
A Metallomic Approach to Assess Associations of Plasma Metal Levels with Amnestic Mild Cognitive Impairment and Alzheimer’s Disease: An Exploratory Study

 ,
,  , , ,
, , ,
Abstract
:1. Background
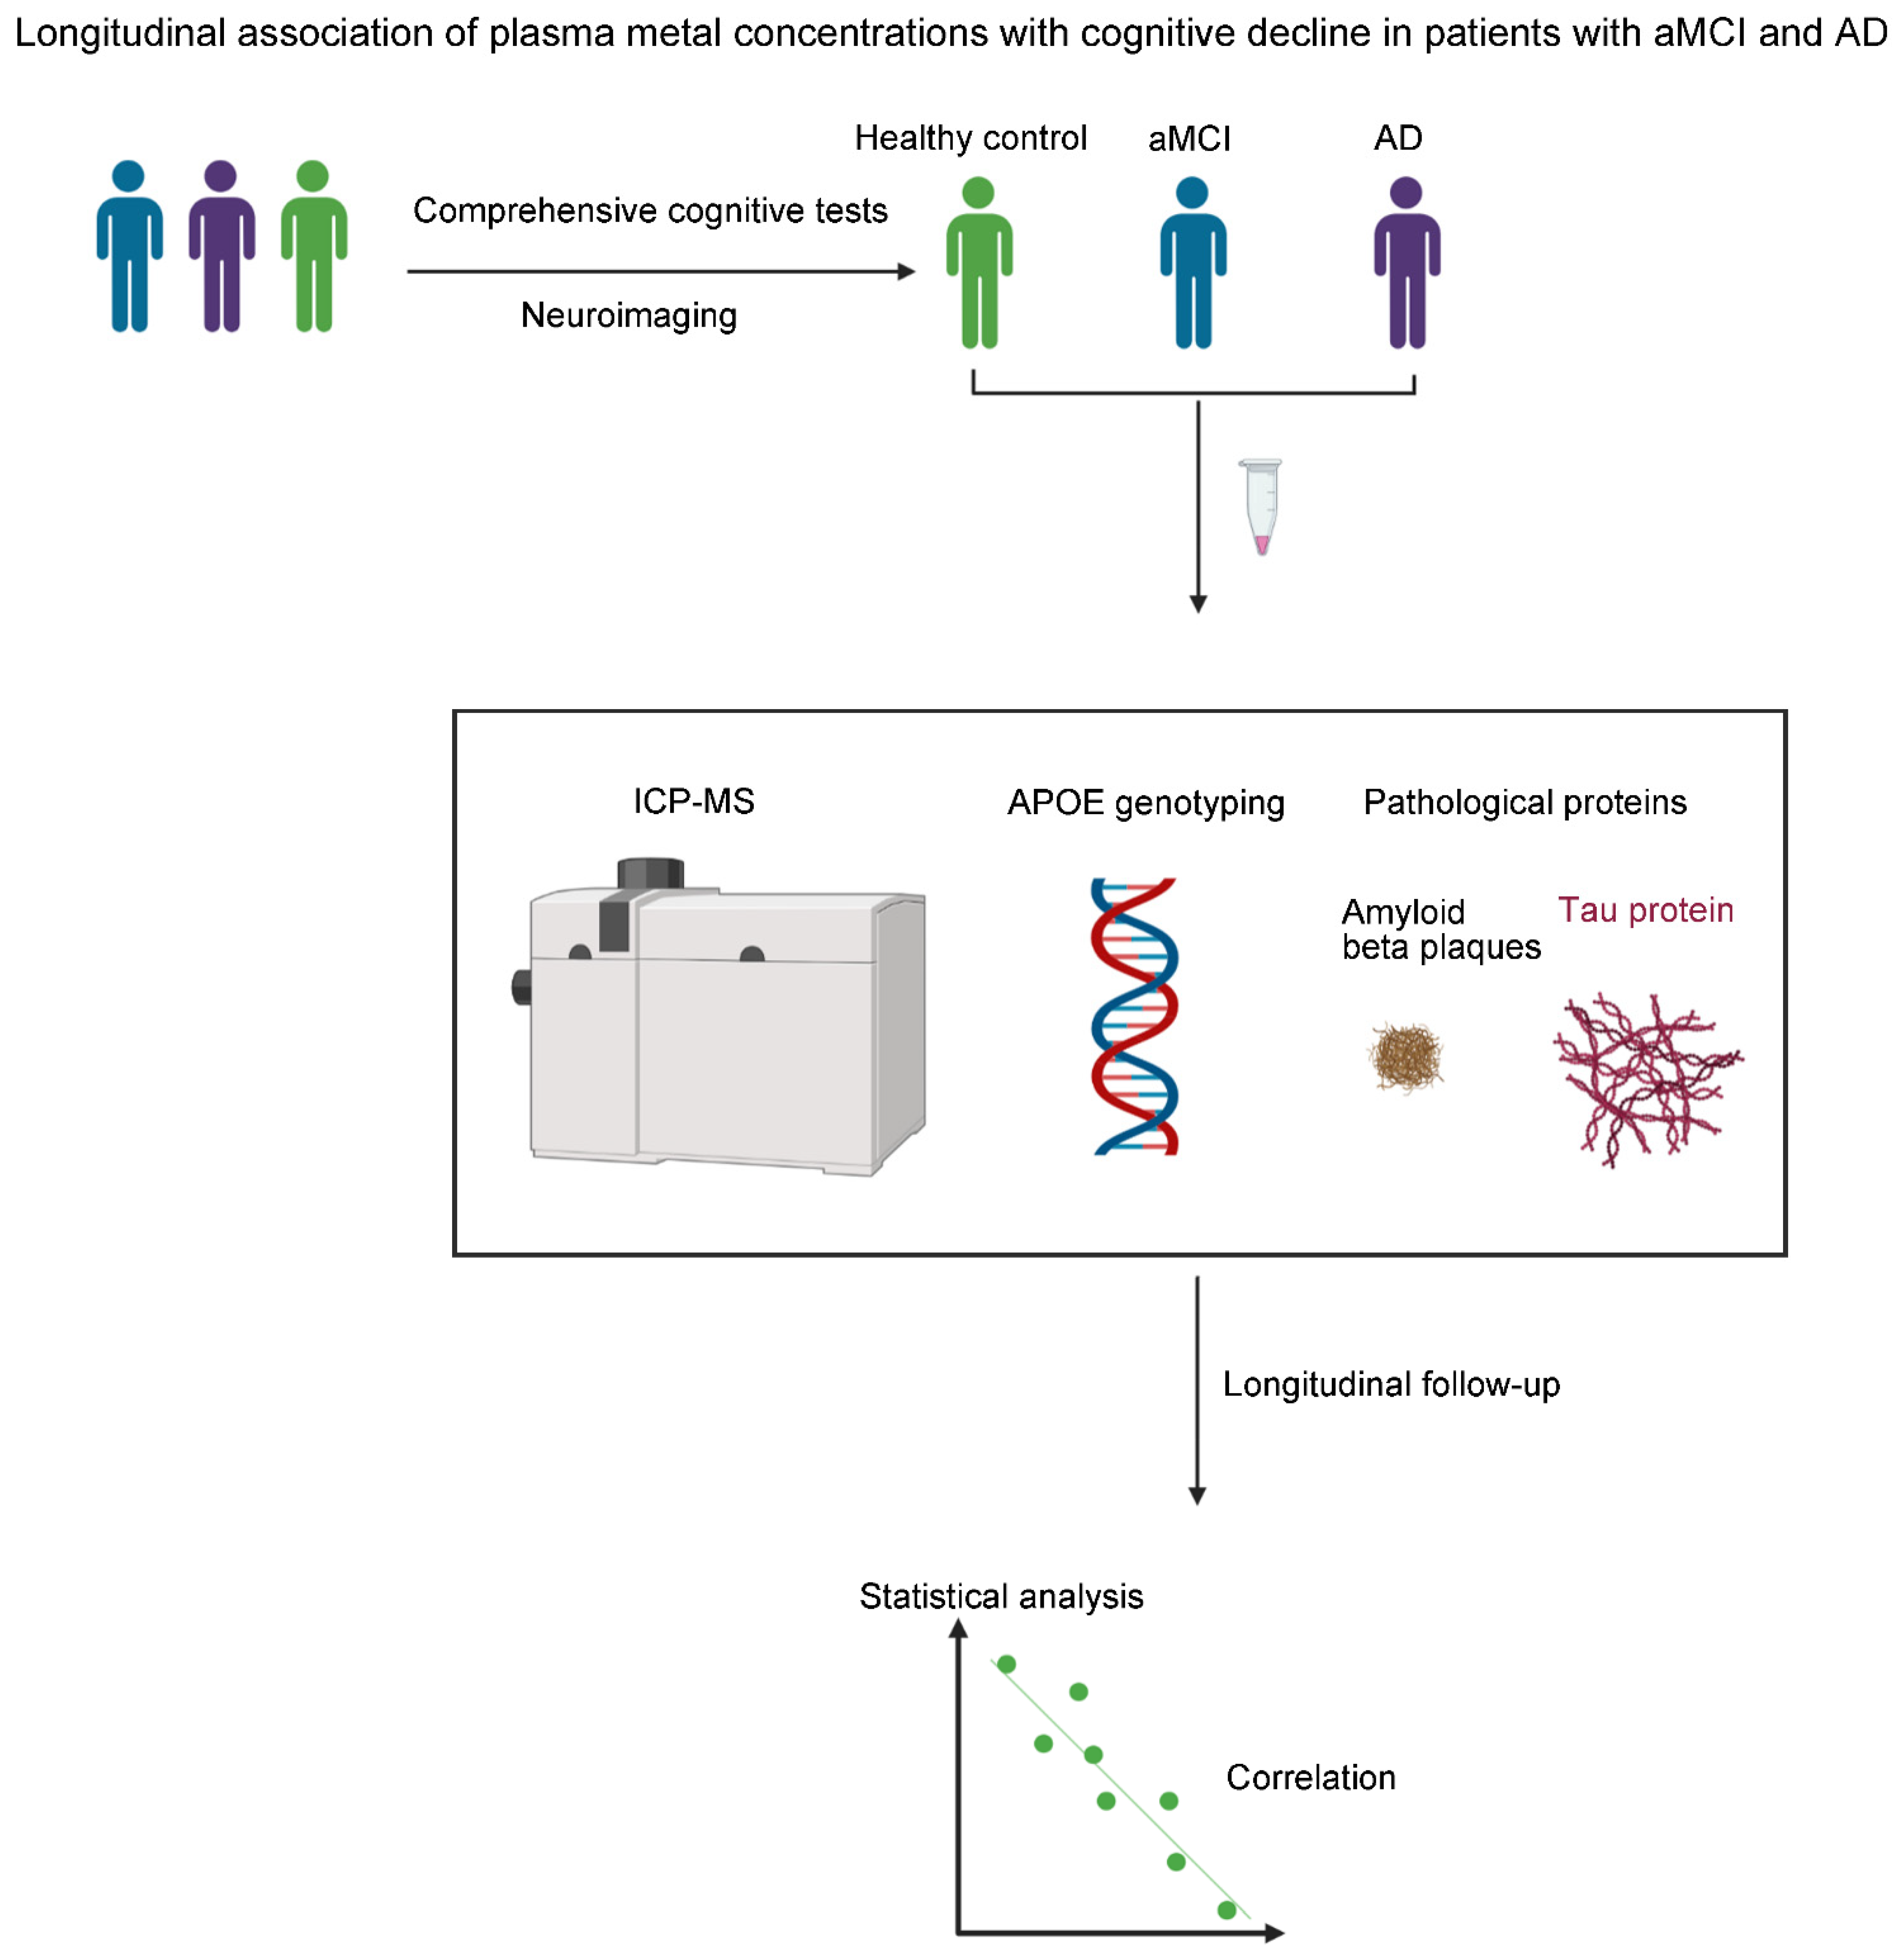
2. Methods
2.1. Patients
2.2. Measuring the Plasma Trace Elements
2.3. ApoE Genotyping
2.4. Plasma Biomarker Assays
2.5. Statistical Analyses
3. Results
3.1. Patient Profiles
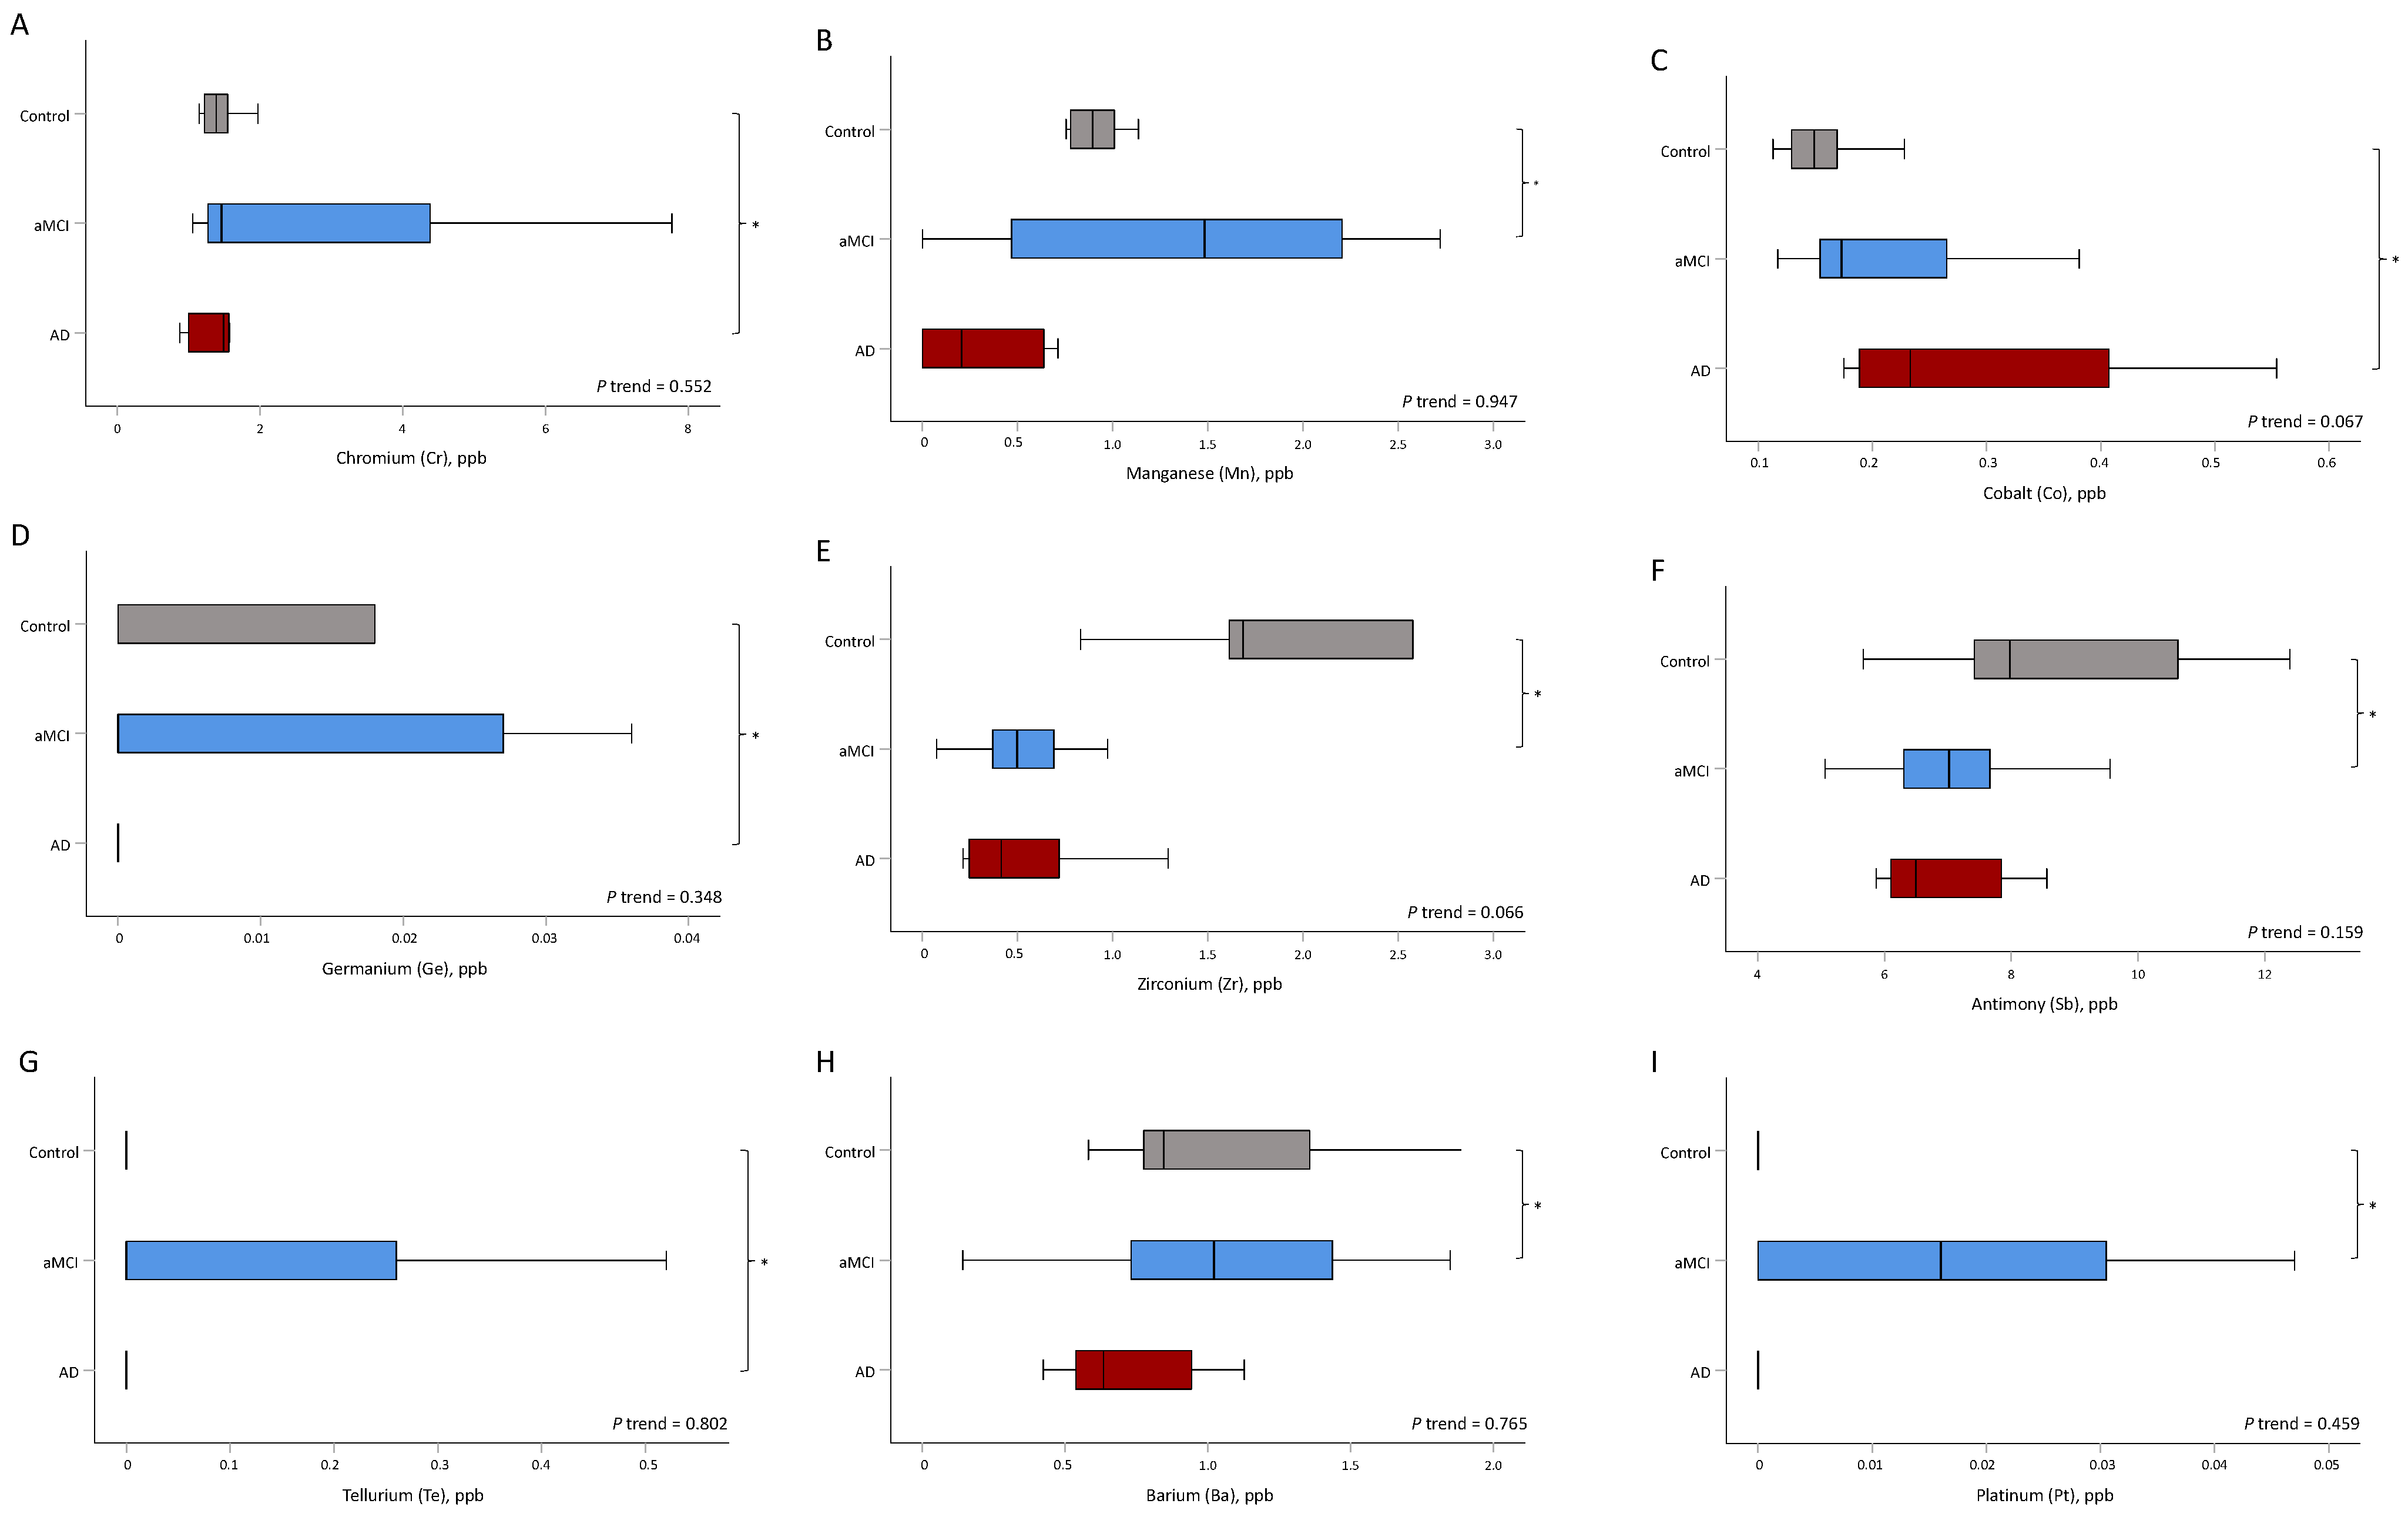
3.2. Trace Elements
3.3. The Utility of Trace Metals to Differentiate between the Disease Groups
3.4. The Association between Trace Metals and an Annual Change in MMSE Scores
4. Discussion
5. Conclusions
Supplementary Materials
Author Contributions
Funding
Institutional Review Board Statement
Informed Consent Statement
Data Availability Statement
Acknowledgments
Conflicts of Interest
Abbreviations
References
- Burns, A.; Iliffe, S. Alzheimer’s disease. BMJ 2009, 338, b158. [Google Scholar] [CrossRef] [PubMed] [Green Version]
- Dickerson, B.C.; McGinnis, S.M.; Xia, C.; Price, B.H.; Atri, A.; Murray, M.E.; Mendez, M.F.; Wolk, D.A. Approach to atypical Alzheimer’s disease and case studies of the major subtypes. CNS Spectr. 2017, 22, 439–449. [Google Scholar] [CrossRef]
- Petersen, R.C.; Negash, S. Mild cognitive impairment: An overview. CNS Spectr. 2008, 13, 45–53. [Google Scholar] [CrossRef]
- Gauthier, S.; Reisberg, B.; Zaudig, M.; Petersen, R.C.; Ritchie, K.; Broich, K.; Belleville, S.; Brodaty, H.; Bennett, D.; Chertkow, H.; et al. Mild cognitive impairment. Lancet 2006, 367, 1262–1270. [Google Scholar] [CrossRef]
- Petersen, R.C.; Lopez, O.; Armstrong, M.J.; Getchius, T.S.D.; Ganguli, M.; Gloss, D.; Gronseth, G.S.; Marson, D.; Pringsheim, T.; Day, G.S.; et al. Practice guideline update summary: Mild cognitive impairment: Report of the Guideline Development, Dissemination, and Implementation Subcommittee of the American Academy of Neurology. Neurology 2018, 90, 126–135. [Google Scholar] [CrossRef]
- Grundman, M.; Petersen, R.C.; Ferris, S.H.; Thomas, R.G.; Aisen, P.S.; Bennett, D.A.; Foster, N.L.; Jack, C.R., Jr.; Galasko, D.R.; Doody, R.; et al. Mild cognitive impairment can be distinguished from Alzheimer disease and normal aging for clinical trials. Arch. Neurol. 2004, 61, 59–66. [Google Scholar] [CrossRef] [Green Version]
- Sperling, R.A.; Aisen, P.S.; Beckett, L.A.; Bennett, D.A.; Craft, S.; Fagan, A.M.; Iwatsubo, T.; Jack, C.R., Jr.; Kaye, J.; Montine, T.J.; et al. Toward defining the preclinical stages of Alzheimer’s disease: Recommendations from the National Institute on Aging-Alzheimer’s Association workgroups on diagnostic guidelines for Alzheimer’s disease. Alzheimer’s Dement. J. Alzheimer’s Assoc. 2011, 7, 280–292. [Google Scholar] [CrossRef] [Green Version]
- Jack, C.R., Jr.; Bennett, D.A.; Blennow, K.; Carrillo, M.C.; Dunn, B.; Haeberlein, S.B.; Holtzman, D.M.; Jagust, W.; Jessen, F.; Karlawish, J.; et al. NIA-AA Research Framework: Toward a biological definition of Alzheimer’s disease. Alzheimer’s Dement. J. Alzheimer’s Assoc. 2018, 14, 535–562. [Google Scholar] [CrossRef]
- Dubois, B.; Feldman, H.H.; Jacova, C.; Hampel, H.; Molinuevo, J.L.; Blennow, K.; DeKosky, S.T.; Gauthier, S.; Selkoe, D.; Bateman, R.; et al. Advancing research diagnostic criteria for Alzheimer’s disease: The IWG-2 criteria. Lancet Neurol. 2014, 13, 614–629. [Google Scholar] [CrossRef]
- Herukka, S.K.; Simonsen, A.H.; Andreasen, N.; Baldeiras, I.; Bjerke, M.; Blennow, K.; Engelborghs, S.; Frisoni, G.B.; Gabryelewicz, T.; Galluzzi, S.; et al. Recommendations for cerebrospinal fluid Alzheimer’s disease biomarkers in the diagnostic evaluation of mild cognitive impairment. Alzheimer’s Dement. J. Alzheimer’s Assoc. 2017, 13, 285–295. [Google Scholar] [CrossRef] [Green Version]
- Adlard, P.A.; Bush, A.I. Metals and Alzheimer’s disease. J. Alzheimer’s Dis. 2006, 10, 145–163. [Google Scholar] [CrossRef]
- Duce, J.A.; Bush, A.I. Biological metals and Alzheimer’s disease: Implications for therapeutics and diagnostics. Prog. Neurobiol. 2010, 92, 1–18. [Google Scholar] [CrossRef] [PubMed]
- Adlard, P.A.; Bush, A.I. Metals and Alzheimer’s Disease: How Far Have We Come in the Clinic? J. Alzheimer’s Dis. 2018, 62, 1369–1379. [Google Scholar] [CrossRef] [PubMed] [Green Version]
- Atwood, C.S.; Huang, X.; Moir, R.D.; Tanzi, R.E.; Bush, A.I. Role of free radicals and metal ions in the pathogenesis of Alzheimer’s disease. Met. Ions Biol. Syst. 1999, 36, 309–364. [Google Scholar]
- Kenche, V.B.; Barnham, K.J. Alzheimer’s disease & metals: Therapeutic opportunities. Br. J. Pharmacol. 2011, 163, 211–219. [Google Scholar] [CrossRef] [Green Version]
- Gerardo, B.; Pinto, M.C.; Nogueira, J.; Pinto, P.; Almeida, A.; Pinto, E.; Marinho-Reis, P.; Diniz, L.; Moreira, P.I.; Simões, M.R.; et al. Associations between Trace Elements and Cognitive Decline: An Exploratory 5-Year Follow-Up Study of an Elderly Cohort. Int. J. Environ. Res. Public Health 2020, 17, 6051. [Google Scholar] [CrossRef]
- Albert, M.S.; DeKosky, S.T.; Dickson, D.; Dubois, B.; Feldman, H.H.; Fox, N.C.; Gamst, A.; Holtzman, D.M.; Jagust, W.J.; Petersen, R.C.; et al. The diagnosis of mild cognitive impairment due to Alzheimer’s disease: Recommendations from the National Institute on Aging-Alzheimer’s Association workgroups on diagnostic guidelines for Alzheimer’s disease. Alzheimer’s Dement. J. Alzheimer’s Assoc. 2011, 7, 270–279. [Google Scholar] [CrossRef] [Green Version]
- McKhann, G.M.; Knopman, D.S.; Chertkow, H.; Hyman, B.T.; Jack, C.R., Jr.; Kawas, C.H.; Klunk, W.E.; Koroshetz, W.J.; Manly, J.J.; Mayeux, R.; et al. The diagnosis of dementia due to Alzheimer’s disease: Recommendations from the National Institute on Aging-Alzheimer’s Association workgroups on diagnostic guidelines for Alzheimer’s disease. Alzheimer’s Dement. J. Alzheimer’s Assoc. 2011, 7, 263–269. [Google Scholar] [CrossRef] [Green Version]
- Shi, J.; Tian, J.; Wei, M.; Miao, Y.; Wang, Y. The utility of the Hopkins Verbal Learning Test (Chinese version) for screening dementia and mild cognitive impairment in a Chinese population. BMC Neurol. 2012, 12, 136. [Google Scholar] [CrossRef] [Green Version]
- Tsai, C.L.; Liang, C.S.; Yang, C.P.; Lee, J.T.; Ho, T.H.; Su, M.W.; Lin, G.Y.; Lin, Y.K.; Chu, H.T.; Hsu, Y.W.; et al. Indicators of rapid cognitive decline in amnestic mild cognitive impairment: The role of plasma biomarkers using magnetically labeled immunoassays. J. Psychiatr. Res. 2020, 129, 66–72. [Google Scholar] [CrossRef] [PubMed]
- Muthaiyah, B.; Essa, M.M.; Lee, M.; Chauhan, V.; Kaur, K.; Chauhan, A. Dietary supplementation of walnuts improves memory deficits and learning skills in transgenic mouse model of Alzheimer’s disease. J. Alzheimer’s. Dis. 2014, 42, 1397–1405. [Google Scholar] [CrossRef] [Green Version]
- Arab, L.; Ang, A. A cross sectional study of the association between walnut consumption and cognitive function among adult US populations represented in NHANES. J. Nutr. Health Aging 2015, 19, 284–290. [Google Scholar] [CrossRef]
- Nielsen, F.; Meacham, S. Growing Evidence for Human Health Benefits of Boron. Complement. Health Pract. Rev. 2011, 16, 169–180. [Google Scholar] [CrossRef]
- Penland, J.G. The importance of boron nutrition for brain and psychological function. Biol. Trace Elem. Res. 1998, 66, 299–317. [Google Scholar] [CrossRef]
- Kumar, A.; Ali, M.; Mishra, P.; Pandey, B.N.; Sharma, P.; Mishra, K.P. Thorium-induced neurobehavioural and neurochemical alterations in Swiss mice. Int. J. Radiat. Biol. 2009, 85, 338–347. [Google Scholar] [CrossRef]
- Authority, E.F.S. Uranium in foodstuffs, in particular mineral water. EFSA J. 2009, 7, 1018. [Google Scholar] [CrossRef]
- Cho, J.; Kang, J.S.; Long, P.H.; Jing, J.; Back, Y.; Chung, K.S. Antioxidant and memory enhancing effects of purple sweet potato anthocyanin and cordyceps mushroom extract. Arch. Pharmacal Res. 2003, 26, 821–825. [Google Scholar] [CrossRef]
- Shan, Q.; Lu, J.; Zheng, Y.; Li, J.; Zhou, Z.; Hu, B.; Zhang, Z.; Fan, S.; Mao, Z.; Wang, Y.-J.; et al. Purple sweet potato color ameliorates cognition deficits and attenuates oxidative damage and inflammation in aging mouse brain induced by d-galactose. J. Biomed. Biotechnol. 2009, 2009, 564737. [Google Scholar] [CrossRef]
- Wang, Y.; Shi, Y.; Wei, H. Calcium Dysregulation in Alzheimer’s Disease: A Target for New Drug Development. J. Alzheimer’s Dis. Park. 2017, 7, 374. [Google Scholar] [CrossRef]
- Brini, M.; Calì, T.; Ottolini, D.; Carafoli, E. Neuronal calcium signaling: Function and dysfunction. Cell Mol. Life Sci. 2014, 71, 2787–2814. [Google Scholar] [CrossRef]
- Morris, R.G. Long-term potentiation and memory. Philos. Trans. R. Soc. Lond. Ser. B Biol. Sci. 2003, 358, 643–647. [Google Scholar] [CrossRef] [Green Version]
- Kern, J.; Kern, S.; Blennow, K.; Zetterberg, H.; Waern, M.; Guo, X.; Börjesson-Hanson, A.; Skoog, I.; Östling, S. Calcium supplementation and risk of dementia in women with cerebrovascular disease. Neurology 2016, 87, 1674–1680. [Google Scholar] [CrossRef] [Green Version]
- LaFerla, F.M. Calcium dyshomeostasis and intracellular signalling in Alzheimer’s disease. Nat. Rev. Neurosci. 2002, 3, 862–872. [Google Scholar] [CrossRef]
- Peng, J.; Liang, G.; Inan, S.; Wu, Z.; Joseph, D.J.; Meng, Q.; Peng, Y.; Eckenhoff, M.F.; Wei, H. Dantrolene ameliorates cognitive decline and neuropathology in Alzheimer triple transgenic mice. Neurosci. Lett. 2012, 516, 274–279. [Google Scholar] [CrossRef] [Green Version]
- Wu, Z.; Yang, B.; Liu, C.; Liang, G.; Eckenhoff, M.F.; Liu, W.; Pickup, S.; Meng, Q.; Tian, Y.; Li, S.; et al. Long-term dantrolene treatment reduced intraneuronal amyloid in aged Alzheimer triple transgenic mice. Alzheimer Dis. Assoc. Disord. 2015, 29, 184–191. [Google Scholar] [CrossRef] [PubMed] [Green Version]
- Hellberg, R.; Nettleton, J.; Morrissey, M. A Review of Mercury in Seafood. J. Aquat. Food Prod. Technol. 2005, 14, 71–100. [Google Scholar] [CrossRef]
- Fotuhi, M.; Mohassel, P.; Yaffe, K. Fish consumption, long-chain omega-3 fatty acids and risk of cognitive decline or Alzheimer disease: A complex association. Nat. Rev. Neurol. 2009, 5, 140–152. [Google Scholar] [CrossRef] [PubMed]
- Kales, S.N.; Thompson, A.M.S. A young woman concerned about mercury. Can. Med. Assoc. J. 2016, 188, 133–134. [Google Scholar] [CrossRef] [Green Version]
- Fan, Y.; Zhang, Y.; Li, J.; Liu, Y.; Chang, H.; Jiang, Y.; Tuo, X.; Zhou, L.; Yu, Y. Association between healthy eating index-2015 and various cognitive domains in US adults aged 60 years or older: The National Health and Nutrition Examination Survey (NHANES) 2011–2014. BMC Public Health 2021, 21, 1862. [Google Scholar] [CrossRef]
- Avila, D.S.; Puntel, R.L.; Aschner, M. Manganese in health and disease. Met. Ions Life Sci. 2013, 13, 199–227. [Google Scholar] [CrossRef]
- Ye, Q.; Kim, J. Effect of olfactory manganese exposure on anxiety-related behavior in a mouse model of iron overload hemochromatosis. Environ. Toxicol. Pharmacol. 2015, 40, 333–341. [Google Scholar] [CrossRef] [Green Version]
- Chen, P.; Chakraborty, S.; Mukhopadhyay, S.; Lee, E.; Paoliello, M.M.; Bowman, A.B.; Aschner, M. Manganese homeostasis in the nervous system. J. Neurochem. 2015, 134, 601–610. [Google Scholar] [CrossRef] [PubMed] [Green Version]
- Maynard, C.J.; Cappai, R.; Volitakis, I.; Cherny, R.A.; White, A.R.; Beyreuther, K.; Masters, C.L.; Bush, A.I.; Li, Q.X. Overexpression of Alzheimer’s disease amyloid-beta opposes the age-dependent elevations of brain copper and iron. J. Biol. Chem. 2002, 277, 44670–44676. [Google Scholar] [CrossRef] [PubMed] [Green Version]
- Tong, Y.; Yang, H.; Tian, X.; Wang, H.; Zhou, T.; Zhang, S.; Yu, J.; Zhang, T.; Fan, D.; Guo, X.; et al. High manganese, a risk for Alzheimer’s disease: High manganese induces amyloid-β related cognitive impairment. J. Alzheimer’s Dis. 2014, 42, 865–878. [Google Scholar] [CrossRef] [PubMed] [Green Version]
- Fountoulakis, K.N.; Vieta, E.; Bouras, C.; Notaridis, G.; Giannakopoulos, P.; Kaprinis, G.; Akiskal, H. A systematic review of existing data on long-term lithium therapy: Neuroprotective or neurotoxic? Int. J. Neuropsychopharmacol. 2008, 11, 269–287. [Google Scholar] [CrossRef] [PubMed] [Green Version]
- Pomara, N.; Banay-Schwartz, M.; Block, R.; Stanley, M.; Gershon, S. Elevation of RBC glycine and choline levels in geriatric patients treated with lithium. Am. J. Psychiatry 1983, 140, 911–913. [Google Scholar] [CrossRef]
- Chen, S.; Underwood, B.R.; Jones, P.B.; Lewis, J.R.; Cardinal, R.N. Association between lithium use and the incidence of dementia and its subtypes: A retrospective cohort study. PLoS Med. 2022, 19, e1003941. [Google Scholar] [CrossRef]
- Forlenza, O.V.; Radanovic, M.; Talib, L.L.; Gattaz, W.F. Clinical and biological effects of long-term lithium treatment in older adults with amnestic mild cognitive impairment: Randomised clinical trial. Br. J. Psychiatry J. Ment. Sci. 2019, 215, 668–674. [Google Scholar] [CrossRef] [Green Version]
- Smith, D.; Keane, P.; Donovan, J.; Malone, K.; McKenna, T.J. Lithium encephalopathy. J. R. Soc. Med. 2003, 96, 590–591. [Google Scholar] [CrossRef]
- Akhtar, A.; Dhaliwal, J.; Saroj, P.; Uniyal, A.; Bishnoi, M.; Sah, S.P. Chromium picolinate attenuates cognitive deficit in ICV-STZ rat paradigm of sporadic Alzheimer’s-like dementia via targeting neuroinflammatory and IRS-1/PI3K/AKT/GSK-3β pathway. Inflammopharmacology 2020, 28, 385–400. [Google Scholar] [CrossRef]
- Akhtar, A.; Bishnoi, M.; Sah, S.P. Sodium orthovanadate improves learning and memory in intracerebroventricular-streptozotocin rat model of Alzheimer’s disease through modulation of brain insulin resistance induced tau pathology. Brain Res. Bull. 2020, 164, 83–97. [Google Scholar] [CrossRef] [PubMed]


| Control | Patients | aMCI | AD | |||
|---|---|---|---|---|---|---|
| Variable | p-Value | p-Value | ||||
| Demographics | ||||||
| Male | 3 (33.3) | 6 (19.4) | 0.394 | 4 (17.4) | 2 (25.0) | 0.634 |
| Age, years | 67.0 ± 6.3 | 79.5 ± 8.1 | <0.001 | 78.3 ± 7.8 | 82.9 ± 8.6 | 0.178 |
| Education, years | 10.9 ± 3.8 | 7.8 ± 4.8 | 0.090 | 7.3 ± 4.7 | 9.5 ± 5.1 | 0.266 |
| Body mass index, kg/m2 | 23.4 ± 2.4 | 24.8 ± 3.9 | 0.308 | 25.2 ± 4.0 | 23.8 ± 3.9 | 0.400 |
| Cognitive tests | ||||||
| Baseline MMSE | 29.3 ± 0.5 | 22.8 ± 5.3 | 0.001 | 23.9 ± 3.7 | 19.5 ± 7.7 | 0.039 |
| CDR sum of box score | 0.4 ± 0.3 | 2.6 ± 2.6 | 0.019 | 1.7 ± 1.1 | 5.1 ± 4.0 | 0.001 |
| Hopkins Verbal Learning Test | 22.0 ± 5.2 | 15.2 ± 5.4 | 0.002 | 16.0 ± 4.9 | 13.0 ± 6.7 | 0.184 |
| Discrimination Index | 11.1 ± 0.8 | 9.3 ± 2.9 | 0.073 | 9.9 ± 1.8 | 7.5 ± 4.6 | 0.041 |
| Forward digit span | 11.2 ± 1.6 | 8.4 ± 2.8 | 0.007 | 8.3 ± 2.8 | 8.6 ± 3.0 | 0.813 |
| Backward digit span | 6.9 ± 3.0 | 3.9 ± 2.8 | 0.008 | 4.1 ± 3.0 | 3.1 ± 2.4 | 0.395 |
| Verbal fluency test | 14.3 ± 2.2 | 9.7 ± 4.5 | 0.005 | 11.0 ± 4.2 | 6.1 ± 3.2 | 0.006 |
| Modified Boston Naming Test | 14.3 ± 0.9 | 12.9 ± 1.8 | 0.028 | 13.1 ± 1.5 | 12.4 ± 2.3 | 0.306 |
| Trail Making Test Part A | 53.9 ± 27.7 | 147.5 ± 101.9 | 0.010 | 136.2 ± 98.8 | 179.9 ± 110.4 | 0.304 |
| Apolipoprotein Eε2:ε3:ε4 | 2:15:1 (11%:83%:6%) | 3:48:11 (5%:77%:18%) | 0.313 | 2:37:7(4%:81%:15%) | 1:11:4 (6%:69%:25%) | 0.625 |
| IMR data | ||||||
| t-Tau, pg/mL | 23.5 ± 1.8 | 25.5 ± 3.6 | 0.125 | 25.5 ± 3.9 | 25.3 ± 2.8 | 0.891 |
| Aβ1–42, pg/mL | 16.9 ± 0.4 | 17.2 ± 0.8 | 0.360 | 17.1 ± 0.9 | 17.2 ± 0.7 | 0.964 |
| p-Tau181, pg/mL | 3.6 ± 0.4 | 3.8 ± 0.6 | 0.257 | 4.0 ± 0.5 | 3.5 ± 0.7 | 0.093 |
| Aβ1–40, pg/mL | 52.6 ± 4.9 | 52.3 ± 4.1 | 0.873 | 52.8 ± 4.2 | 50.9 ± 3.8 | 0.287 |
| α-synuclein, fg/mL | 108.5 ± 83.4 | 120.6 ± 65.6 | 0.648 | 124.7 ± 70.2 | 109.0 ± 52.4 | 0.569 |
| Aβ1–42 × t-Tau | 1.39 ± 0.10 | 1.48 ± 0.15 | 0.104 | 1.48 ± 0.16 | 1.47 ± 0.11 | 0.867 |
| Aβ1–42 × Aβ1-40 | 0.32 ± 0.03 | 0.33 ± 0.03 | 0.592 | 0.33 ± 0.03 | 0.34 ± 0.03 | 0.370 |
| p-Tau × t-Tau | 0.15 ± 0.02 | 0.15 ± 0.02 | 0.807 | 0.16 ± 0.02 | 0.14 ± 0.02 | 0.068 |
| Control | aMCI | AD | p-Value # | |||
|---|---|---|---|---|---|---|
| Variable | P Trend | aMCI vs. Control | AD vs. Control | |||
| Li, μg/L | 1.07 (0.73, 1.11) | 1.21 (1.01, 1.70) | 1.35 (0.73, 1.61) | 0.989 | 0.414 | 0.847 |
| Be, μg/L | 0.92 (0.50, 0.98) | 0.61 (0.51, 1.49) | 0.64 (0.40, 1.15) | 0.474 | 0.722 | 0.564 |
| B, μg/L | 141 (106, 160) | 53 (24, 71) | 35 (12, 45) | 0.005 | 0.009 | 0.012 |
| Al, μg/L | 18.0 (15.0, 19.6) | 14.5 (11.1, 17.9) | 14.5 (13.2, 19.7) | 0.299 | 0.950 | 0.248 |
| Ca, mg/L | 86.5 (84.6, 88.5) | 93.1 (88.2, 99.1) | 93.1 (89.0, 97.1) | 0.291 | 0.173 | 0.441 |
| V, μg/L | 0.29 (0.18, 0.33) | 0.21 (0.13, 0.26) | 0.22 (0.17, 0.26) | 0.477 | 0.201 | 0.564 |
| Cr, μg/L | 1.4 (1.2, 1.5) | 1.5 (1.2, 4.4) | 1.5 (1.0, 1.6) | 0.552 | 0.414 | 0.043 |
| Mn, μg/L | 0.89 (0.78, 1.01) | 1.48 (0.46, 2.26) | 0.21 (0.00, 0.64) | 0.947 | 0.028 | 0.773 |
| Fe, μg/L | 987 (904, 1140) | 1360 (952, 1654) | 1316 (987, 1708) | 0.468 | 0.201 | 0.386 |
| Co, μg/L | 0.15 (0.13, 0.17) | 0.17 (0.15, 0.27) | 0.23 (0.19, 0.41) | 0.067 | 0.267 | 0.027 |
| Ni, μg/L | 0.66 (0.45, 0.99) | 0.91 (0.69, 1.56) | 0.63 (0.45, 1.09) | 0.821 | 0.107 | 1.000 |
| Cu, μg/L | 832 (693, 915) | 956 (850, 1090) | 788 (743, 977) | 0.625 | 0.090 | 0.564 |
| Zn, μg/L | 780 (633, 842) | 751 (679, 802) | 740 (690, 830) | 0.706 | 0.883 | 0.630 |
| Ga, μg/L | 0.071 (0.047, 0.095) | 0.059 (0.024, 0.071) | 0.036 (0.035, 0.036) | 0.102 | 0.173 | 0.248 |
| Ge, μg/L | 0.00 (0.00, 0.02) | 0.00 (0.00, 0.04) | 0.00 (0.00, 0.00) | 0.348 | 0.216 | 0.002 |
| As, μg/L | 4.9 (4.3, 9.4) | 5.7 (4.7, 10.3) | 5.5 (4.6, 8.8) | 0.541 | 0.600 | 0.700 |
| Se, μg/L | 171 (158, 183) | 175 (158, 191) | 148 (141, 167) | 0.368 | 0.414 | 0.124 |
| Rb, μg/L | 216 (209, 250) | 219 (193, 243) | 206 (162, 252) | 0.599 | 0.917 | 0.700 |
| Sr, μg/L | 30.0 (26.9, 35.1) | 34.9 (27.9, 43.9) | 35.6 (32.4, 39.4) | 0.265 | 0.304 | 0.102 |
| Zr, μg/L | 1.68 (1.61, 2.58) | 0.50 (0.37, 0.70) | 0.41 (0.25, 0.72) | 0.066 | 0.034 | 0.248 |
| Mo, μg/L | 2.0 (1.0, 2.0) | 2.1 (1.3, 2.8) | 1.7 (1.2, 2.9) | 0.932 | 0.753 | 0.441 |
| Ag, μg/L | 0.02 (0.00, 0.29) | 0.03 (0.00, 0.13) | 0.07 (0.00, 0.21) | 0.514 | 0.867 | 0.700 |
| Cd, μg/L | 0.07 (0.04, 0.07) | 0.07 (0.05, 0.14) | 0.06 (0.04, 0.07) | 0.499 | 0.630 | 0.386 |
| Sn, μg/L | 0.00 (0.00, 0.59) | 0.00 (0.00, 0.12) | 0.00 (0.00, 0.00) | 0.978 | 0.216 | 0.500 |
| Sb, μg/L | 8.0 (7.4, 10.6) | 7.0 (6.1, 7.7) | 6.5 (6.1, 7.8) | 0.159 | 0.038 | 0.211 |
| Te, μg/L | 0.00 (0.00, 0.00) | 0.00 (0.00, 0.26) | 0.00 (0.00, 0.00) | 0.802 | 0.232 | 0.027 |
| Ba, μg/L | 0.8 (0.8, 1.4) | 1.0 (0.7, 1.4) | 0.6 (0.5, 0.9) | 0.765 | 0.022 | 0.211 |
| W, μg/L | 95.4 (33.0, 230.3) | 0.0 (0.0, 0.0) | 0.0 (0.0, 0.0) | 0.071 | 0.173 | 0.563 |
| Pt, μg/L | 0.00 (0.00, 0.00) | 0.02 (0.00, 0.03) | 0.00 (0.00, 0.00) | 0.459 | 0.038 | 0.149 |
| Au, μg/L | 4.2 (1.9, 35.6) | 0.0 (0.0, 0.0) | 0.0 (0.0, 0.0) | 0.211 | 0.516 | 0.290 |
| Hg, μg/L | 3.2 (2.2, 7.0) | 1.8 (1.2, 2.2) | 0.8 (0.6, 1.2) | 0.102 | 0.850 | 0.700 |
| Tl, μg/L | 0.052 (0.033, 0.072) | 0.028 (0.018, 0.044) | 0.014 (0.010, 0.037) | 0.073 | 0.126 | 0.124 |
| Pb, μg/L | 0.18 (0.17, 0.42) | 1.47 (0.23, 1.97) | 0.43 (0.00, 1.14) | 0.652 | 0.209 | 0.441 |
| Bi, μg/L | 0.05 (0.04, 0.06) | 0.03 (0.02, 0.04) | 0.02 (0.01, 0.03) | 0.028 | 0.034 | 0.007 |
| Th, μg/L | 4.0 (2.9, 7.1) | 0.0 (0.0, 0.5) | 0.0 (0.0, 0.0) | 0.005 | 0.002 | 0.043 |
| U, μg/L | 0.017 (0.014, 0.023) | 0.011 (0.006, 0.021) | 0.007 (0.005, 0.015) | 0.048 | 0.034 | 0.005 |
| Trace Metal | aMCI | AD | ||
|---|---|---|---|---|
| Partial Correlation # | p-Value | Partial Correlation # | p-Value | |
| B | −0.70 | 0.001 | −0.03 | 0.967 |
| Al | −0.09 | 0.707 | −0.01 | 0.982 |
| Ca | 0.50 | 0.026 | −0.82 | 0.092 |
| Mn | −0.35 | 0.133 | −0.91 | 0.035 |
| Co | −0.25 | 0.296 | −0.37 | 0.545 |
| Cu | −0.11 | 0.646 | −0.44 | 0.454 |
| Ga | 0.10 | 0.676 | −0.04 | 0.948 |
| Ge | −0.03 | 0.889 | NA | NA |
| Se | 0.20 | 0.405 | 0.35 | 0.560 |
| Zr | −0.58 | 0.007 | −0.50 | 0.389 |
| Sb | 0.13 | 0.594 | 0.71 | 0.178 |
| Ba | −0.25 | 0.298 | −0.45 | 0.449 |
| W | −0.30 | 0.194 | NA | NA |
| Au | NA | NA | NA | NA |
| Hg | 0.23 | 0.338 | −0.40 | 0.508 |
| Tl | −0.42 | 0.064 | 0.14 | 0.823 |
| Pb | −0.13 | 0.593 | −0.80 | 0.108 |
| Bi | −0.11 | 0.657 | 0.64 | 0.250 |
| Th | −0.52 | 0.020 | NA | NA |
| U | 0.04 | 0.885 | 0.74 | 0.156 |
Publisher’s Note: MDPI stays neutral with regard to jurisdictional claims in published maps and institutional affiliations. |
© 2022 by the authors. Licensee MDPI, Basel, Switzerland. This article is an open access article distributed under the terms and conditions of the Creative Commons Attribution (CC BY) license (https://creativecommons.org/licenses/by/4.0/).
Share and Cite
Lin, Y.-K.; Liang, C.-S.; Tsai, C.-K.; Tsai, C.-L.; Lee, J.-T.; Sung, Y.-F.; Chou, C.-H.; Shang, H.-S.; Yang, B.-H.; Lin, G.-Y.; et al. A Metallomic Approach to Assess Associations of Plasma Metal Levels with Amnestic Mild Cognitive Impairment and Alzheimer’s Disease: An Exploratory Study. J. Clin. Med. 2022, 11, 3655. https://doi.org/10.3390/jcm11133655
Lin Y-K, Liang C-S, Tsai C-K, Tsai C-L, Lee J-T, Sung Y-F, Chou C-H, Shang H-S, Yang B-H, Lin G-Y, et al. A Metallomic Approach to Assess Associations of Plasma Metal Levels with Amnestic Mild Cognitive Impairment and Alzheimer’s Disease: An Exploratory Study. Journal of Clinical Medicine. 2022; 11(13):3655. https://doi.org/10.3390/jcm11133655
Chicago/Turabian StyleLin, Yu-Kai, Chih-Sung Liang, Chia-Kuang Tsai, Chia-Lin Tsai, Jiunn-Tay Lee, Yueh-Feng Sung, Chung-Hsing Chou, Hung-Sheng Shang, Bing-Heng Yang, Guan-Yu Lin, and et al. 2022. "A Metallomic Approach to Assess Associations of Plasma Metal Levels with Amnestic Mild Cognitive Impairment and Alzheimer’s Disease: An Exploratory Study" Journal of Clinical Medicine 11, no. 13: 3655. https://doi.org/10.3390/jcm11133655