
Reproducibility and Accuracy of the Radiofrequency Echographic Multi-Spectrometry for Femoral Mineral Density Estimation and Discriminative Power of the Femoral Fragility Score in Patients with Primary and Disuse-Related Osteoporosis

 ,
,  ,
,  and
and 
Abstract
:1. Introduction
2. Materials and Methods
2.1. Study Design and Participants
2.2. DXA and REMS
2.3. Statistical Analysis
3. Results
4. Discussion
5. Conclusions
Author Contributions
Funding
Institutional Review Board Statement
Informed Consent Statement
Data Availability Statement
Acknowledgments
Conflicts of Interest
References
- Lewiecki, E.M.; Anderson, P.A.; Bilezikian, J.P.; Binkley, N.; Cheung, A.M.; Imel, E.A.; Krueger, D.; McClung, M.R.; Miller, P.D.; Rothman, M.S. Proceedings of the 2021 Santa Fe Bone Symposium: Advances in the Management of Osteoporosis and Metabolic Bone Diseases. J. Clin. Densitom. 2022, 25, 3–19. [Google Scholar] [CrossRef] [PubMed]
- Diez-Perez, A.; Brandi, M.L.; Al-Daghri, N.; Branco, J.C.; Bruyère, O.; Cavalli, L.; Cooper, C.; Cortet, B.; Dawson-Hughes, B.; Dimai, H.P.; et al. Radiofrequency echographic multi-spectrometry for the In Vivo assessment of bone strength: State of the art-outcomes of an expert consensus meeting organized by the European Society for Clinical and Economic Aspects of Osteoporosis, Osteoarthritis and Musculoskeletal Diseases (ESCEO). Aging Clin. Exp. Res. 2019, 31, 1375–1389. [Google Scholar] [CrossRef] [PubMed] [Green Version]
- Di Paola, M.; Gatti, D.; Viapiana, O.; Cianferotti, L.; Cavalli, L.; Caffarelli, C.; Conversano, F.; Quarta, E.; Pisani, P.; Girasole, G.; et al. Radiofrequency echographic multispectrometry compared with dual X-ray absorptiometry for osteoporosis diagnosis on lumbar spine and femoral neck. Osteoporos. Int. 2019, 30, 391–402. [Google Scholar] [CrossRef]
- Cortet, B.; Dennison, E.; Diez-Perez, A.; Locquet, M.; Muratore, M.; Nogués, X.; Ovejero Crespo, D.; Quarta, E.; Brandi, M.L. Radiofrequency Echographic Multi Spectrometry (REMS) for the diagnosis of osteoporosis in a European multicenter clinical context. Bone 2021, 143, 115786. [Google Scholar] [CrossRef]
- Amorim, D.M.R.; Sakane, E.N.; Maeda, S.S.; Lazaretti Castro, M. New technology REMS for bone evaluation compared to DXA in adult women for the osteoporosis diagnosis: A real-life experience. Arch. Osteoporos. 2021, 16, 175. [Google Scholar] [CrossRef] [PubMed]
- Adami, G.; Arioli, G.; Bianchi, G.; Brandi, M.L.; Caffarelli, C.; Cianferotti, L.; Gatti, D.; Girasole, G.; Gonnelli, S.; Manfredini, M.; et al. Radiofrequency echographic multi spectrometry for the prediction of incident fragility fractures: A 5-year follow-up study. Bone 2020, 134, 115297. [Google Scholar] [CrossRef] [PubMed]
- Degennaro, V.A.; Brandi, M.L.; Cagninelli, G.; Casciaro, S.; Ciardo, D.; Conversano, F.; Di Pasquo, E.; Gonnelli, S.; Lombardi, F.A.; Pisani, P.; et al. First assessment of bone mineral density in healthy pregnant women by means of Radiofrequency Echographic Multi Spectrometry (REMS) technology. Eur. J. Obstet. Gynecol. Reprod. Biol. 2021, 263, 44–49. [Google Scholar] [CrossRef] [PubMed]
- Caffarelli, C.; Tomai Pitinca, M.D.; Al Refaie, A.; Ceccarelli, E.; Gonnelli, S. Ability of radiofrequency echographic multispectrometry to identify osteoporosis status in elderly women with type 2 diabetes. Aging Clin. Exp. Res. 2022, 34, 121–127. [Google Scholar] [CrossRef]
- Rolla, M.; Halupczok-Żyła, J.; Jawiarczyk-Przybyłowska, A.; Bolanowski, M. Bone densitometry by radiofrequency echographic multi-spectrometry (REMS) in acromegaly patients. Endokrynol. Pol. 2020, 71, 524–531. [Google Scholar] [CrossRef]
- Edwards, W.B.; Schnitzer, T.J.; Troy, K.L. Reduction in proximal femoral strength in patients with acute spinal cord injury. J. Bone Miner. Res. 2014, 29, 2074–2079. [Google Scholar] [CrossRef]
- Edwards, W.B.; Schnitzer, T.J. Bone Imaging and Fracture Risk after Spinal Cord Injury. Curr. Osteoporos. Rep. 2015, 13, 310–317. [Google Scholar] [CrossRef] [PubMed]
- Cirnigliaro, C.M.; Myslinski, M.J.; La Fountaine, M.F.; Kirshblum, S.C.; Forrest, G.F.; Bauman, W.A. Bone loss at the distal femur and proximal tibia in persons with spinal cord injury: Imaging approaches, risk of fracture, and potential treatment options. Osteoporos. Int. 2017, 28, 747–765. [Google Scholar] [CrossRef] [PubMed]
- Invernizzi, M.; de Sire, A.; Fusco, N. Rethinking the clinical management of volumetric muscle loss in patients with spinal cord injury: Synergy among nutritional supplementation, pharmacotherapy, and rehabilitation. Curr. Opin. Pharmacol. 2021, 57, 132–139. [Google Scholar] [CrossRef]
- Invernizzi, M.; de Sire, A.; Carda, S.; Venetis, K.; Renò, F.; Cisari, C.; Fusco, N. Bone Muscle Crosstalk in Spinal Cord Injuries: Pathophysiology and Implications for Patients’ Quality of Life. Curr. Osteoporos. Rep. 2020, 18, 422–431. [Google Scholar] [CrossRef] [PubMed]
- Pisani, P.; Greco, A.; Conversano, F.; Renna, M.D.; Casciaro, E.; Quarta, L.; Costanza, D.; Muratore, M.; Casciaro, S. A quantitative ultrasound approach to estimate bone fragility: A first comparison with dual X-ray absorptiometry. Measurement 2017, 101, 243–249. [Google Scholar] [CrossRef]
- Greco, A.; Pisani, P.; Conversano, F.; Solperto, G.; Renna, M.D.; Muratore, M.; Casciaro, S. Ultrasound Fragility Score: An innovative approach for the assessment of bone fragility. Measurement 2017, 101, 236–242. [Google Scholar] [CrossRef]
- Roberts, T.T.; Leonard, G.R.; Cepela, D.J. Classifications in Brief: American Spinal Injury Association (ASIA) Impairment Scale. Clin. Orthop. Relat. Res. 2017, 475, 1499–1504. [Google Scholar] [CrossRef] [Green Version]
- Conversano, F.; Franchini, R.; Greco, A.; Soloperto, G.; Chiriacò, F.; Casciaro, E.; Aventaggiato, M.; Renna, M.D.; Pisani, P.; Di Paola, M.; et al. A novel ultrasound methodology for estimating spine mineral density. Ultrasound Med. Biol. 2015, 41, 281–300. [Google Scholar] [CrossRef]
- Casciaro, S.; Peccarisi, M.; Pisani, P.; Franchini, R.; Greco, A.; De Marco, T.; Grimaldi, A.; Quarta, L.; Quarta, E.; Muratore, M.; et al. An Advanced Quantitative Echosound Methodology for Femoral Neck Densitometry. Ultrasound Med. Biol. 2016, 42, 1337–1356. [Google Scholar] [CrossRef]
- Lu, Y.; Fuerst, T.; Hui, S.; Genant, H.K. Standardization of bone mineral density at femoral neck, trochanter and Ward’s triangle. Osteoporos. Int. 2001, 12, 438–444. [Google Scholar] [CrossRef]
- Hanson, J. Standardization of femur BMD. J. Bone Miner. Res. 1997, 12, 1316–1317. [Google Scholar] [CrossRef] [PubMed]
- Walter, S.D.; Eliasziw, M.; Donner, A. Sample size and optimal designs for reliability studies. Stat. Med. 1998, 17, 101–110. [Google Scholar] [CrossRef]
- Caresio, C.; Molinari, F.; Emanuel, G.; Minetto, M.A. Muscle echo intensity: Reliability and conditioning factors. Clin. Physiol. Funct. Imaging 2015, 35, 393–403. [Google Scholar] [CrossRef] [PubMed]
- Weir, J.P. Quantifying test-retest reliability using the intraclass correlation coefficient and the SEM. J. Strength Cond Res. 2005, 19, 231–240. [Google Scholar] [CrossRef]
- McHugh, M.L. Interrater reliability: The kappa statistic. Biochem. Med. 2012, 22, 276–282. [Google Scholar] [CrossRef]
- Kanis, J.A.; Harvey, N.C.; Johansson, H.; Odén, A.; Leslie, W.D.; McCloskey, E.V. FRAX Update. J. Clin. Densitom. 2017, 20, 360–367. [Google Scholar] [CrossRef]
- Kanis, J.A.; Harvey, N.C.; Johansson, H.; Liu, E.; Vandenput, L.; Lorentzon, M.; Leslie, W.D.; McCloskey, E.V. A decade of FRAX: How has it changed the management of osteoporosis? Aging Clin. Exp. Res. 2020, 32, 187–196. [Google Scholar] [CrossRef] [Green Version]
- Shuhart, C.R.; Yeap, S.S.; Anderson, P.A.; Jankowski, L.G.; Lewiecki, E.M.; Morse, L.R.; Rosen, H.N.; Weber, D.R.; Zemel, B.S.; Shepherd, J.A. Executive Summary of the 2019 ISCD Position Development Conference on Monitoring Treatment, DXA Cross-calibration and Least Significant Change, Spinal Cord Injury, Peri-prosthetic and Orthopedic Bone Health, Transgender Medicine, and Pediatrics. J. Clin. Densitom. 2019, 22, 453–471. [Google Scholar] [CrossRef]
- Nowakowska-Płaza, A.; Wroński, J.; Płaza, M.; Sudoł-Szopińska, I.; Głuszko, P. Diagnostic agreement between radiofrequency echographic multispectrometry and dual-energy X-ray absorptiometry in the assessment of osteoporosis in a Polish group of patients. Pol. Arch. Intern. Med. 2021, 131, 840–847. [Google Scholar] [CrossRef]
- Pillen, S.; Arts, I.M.; Zwarts, M.J. Muscle ultrasound in neuromuscular disorders. Muscle Nerve 2008, 37, 679–693. [Google Scholar] [CrossRef]
- Pillen, S.; Tak, R.O.; Zwarts, M.J.; Lammens, M.M.; Verrijp, K.N.; Arts, I.M.; van der Laak, J.A.; Hoogerbrugge, P.M.; van Engelen, B.G.; Verrips, A. Skeletal muscle ultrasound: Correlation between fibrous tissue and echo intensity. Ultrasound Med. Biol. 2009, 35, 443–446. [Google Scholar] [CrossRef] [PubMed]
- Pillen, S.; van Alfen, N. Skeletal muscle ultrasound. Neurol. Res. 2011, 33, 1016–1024. [Google Scholar] [CrossRef] [PubMed] [Green Version]
- Camacho, P.M.; Petak, S.M.; Binkley, N.; Diab, D.L.; Eldeiry, L.S.; Farooki, A.; Harris, S.T.; Hurley, D.L.; Kelly, J.; Lewiecki, E.M.; et al. American association of clinical endocrinologists / American college of endocrinology clinical practice guidelines for the diagnosis and treatment of postmenopausal osteoporosis-2020 update executive summary. Endocr. Pract. 2020, 26, 564–570. [Google Scholar] [CrossRef] [PubMed]
- Kanis, J.A.; Cooper, C.; Rizzoli, R.; Reginster, J.Y. Scientific Advisory Board of the European Society for Clinical and Economic Aspects of Osteoporosis and Osteoarthritis (ESCEO) and the Committees of Scientific Advisors and National Societies of the International Osteoporosis Foundation (IOF). Executive summary of European guidance for the diagnosis and management of osteoporosis in postmenopausal women. Aging Clin. Exp. Res. 2019, 31, 15–17. [Google Scholar] [CrossRef] [PubMed]
- Shevroja, E.; Lamy, O.; Kohlmeier, L.; Koromani, F.; Rivadeneira, F.; Hans, D. Use of Trabecular Bone Score (TBS) as a Complementary Approach to Dual-energy X-ray Absorptiometry (DXA) for Fracture Risk Assessment in Clinical Practice. J. Clin. Densitom. 2017, 20, 334–345. [Google Scholar] [CrossRef] [PubMed]


| Variable | Primary Osteoporosis n = 140 | Disuse-Related Osteoporosis n = 35 |
|---|---|---|
| Age (years) | 74.0 (64.0–81.0) | 57.0 (49.0–63.5) |
| Gender distribution: number of females (males) | 120 (20) | 14 (21) |
| Body mass index (kg/m2) | 23.9 (21.3–27.3) | 24.7 (22.9–29.1) |
| Previous major osteoporotic fracture (%) | 69 | 83 |
| % of all patients treated with anti-osteoporotic drugs | 21% | 6% |
| % of non-fractured patients treated with anti-osteoporotic drugs | 12% | 0% |
| % of fractured patients treated with anti-osteoporotic drugs | 26% | 6% |
| FRAX score in non–complicated patients (10-yr probability of major fracture %) | 10.5 (6.2–17.5) | - |
| FRAX score in non–complicated patients (10-yr probability of hip fracture %) | 3.3 (1.8–6.4) | - |
| AIS score: grade A-B-C (%) | - | 66-14-20 |
| Disease history (years from the spinal cord injury) | - | 15.0 (9.0–23.5) |
| Variable | Primary Osteoporosis n = 135 | Disuse-Related Osteoporosis n = 31 |
|---|---|---|
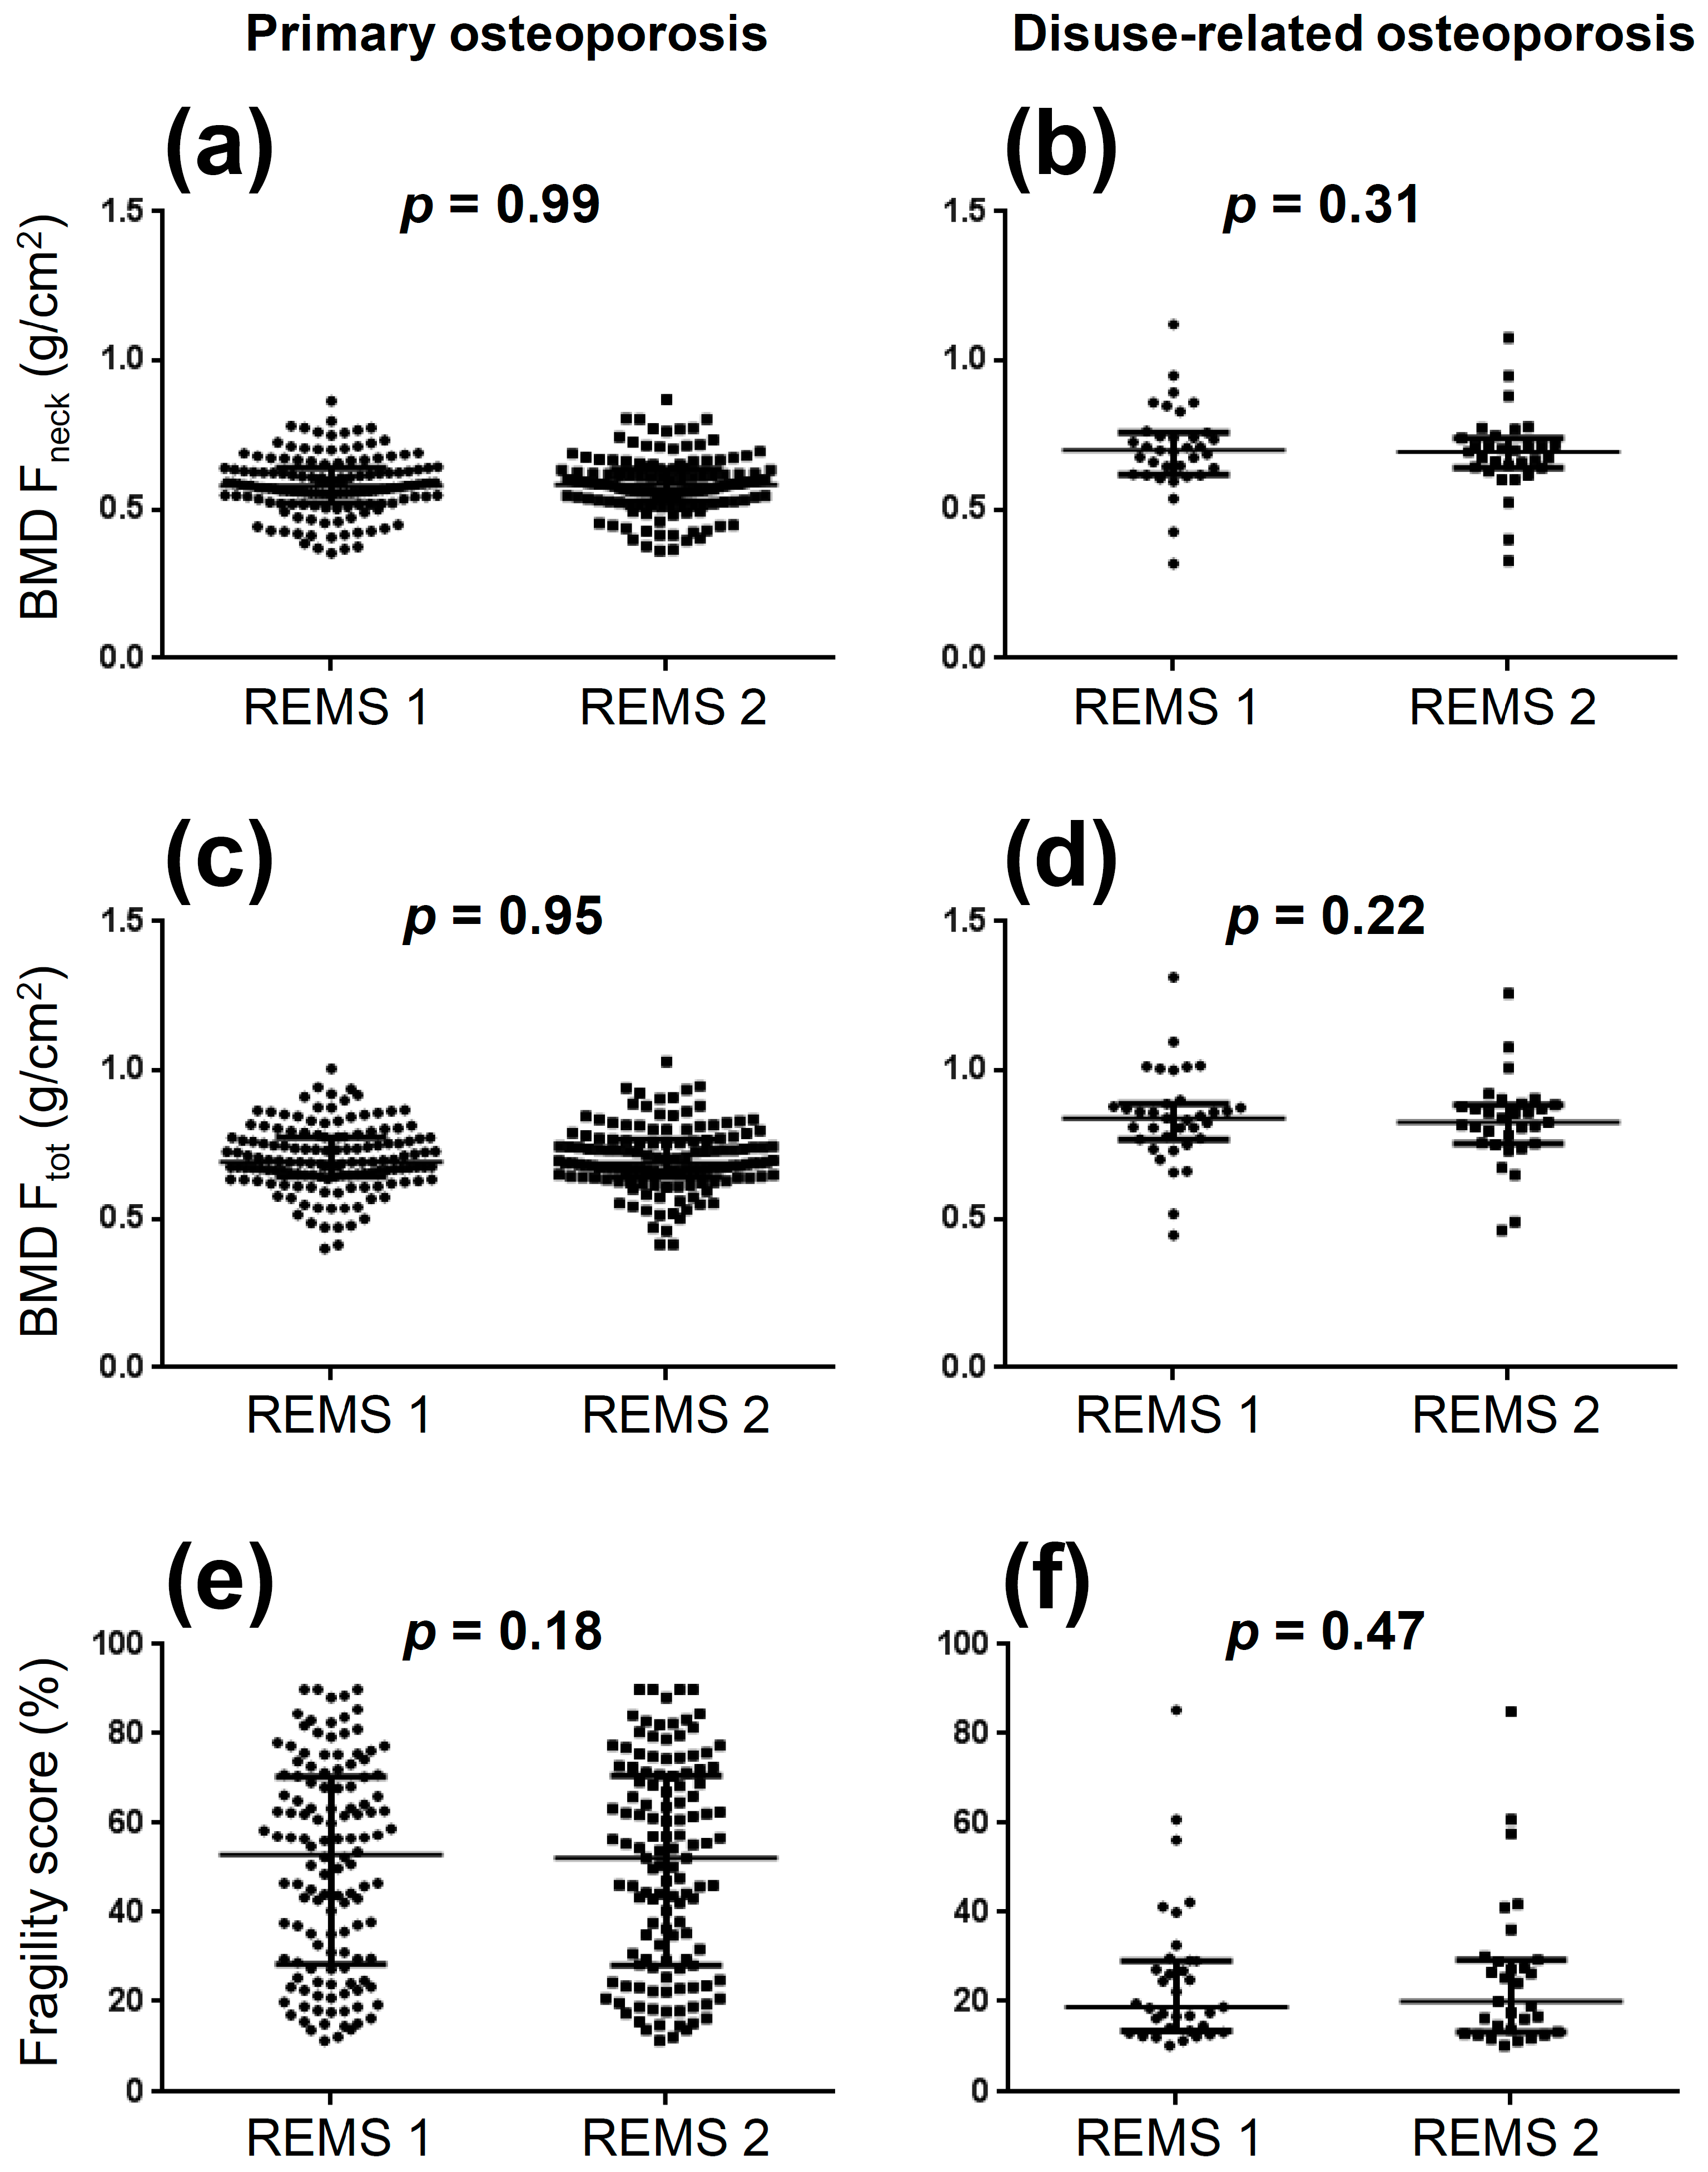
| Femoral neck BMD | ||
| ICC | 0.984 | 0.991 |
| SEM (g/cm2) | 0.012 | 0.013 |
| SDC (g/cm2) | 0.034 | 0.037 |
| LSC (g/cm2) | 0.034 | 0.006 |
| Total femur BMD | ||
| ICC | 0.976 | 0.987 |
| SEM (g/cm2) | 0.017 | 0.017 |
| SDC (g/cm2) | 0.047 | 0.048 |
| LSC (g/cm2) | 0.047 | 0.009 |
| Fragility score | ||
| ICC | 0.998 | 0.984 |
| SEM (%) | 1.02 | 2.08 |
| SDC (%) | 2.84 | 5.76 |
| LSC (%) | 2.96 | 1.05 |
Publisher’s Note: MDPI stays neutral with regard to jurisdictional claims in published maps and institutional affiliations. |
© 2022 by the authors. Licensee MDPI, Basel, Switzerland. This article is an open access article distributed under the terms and conditions of the Creative Commons Attribution (CC BY) license (https://creativecommons.org/licenses/by/4.0/).
Share and Cite
Lalli, P.; Mautino, C.; Busso, C.; Bardesono, F.; Di Monaco, M.; Lippi, L.; Invernizzi, M.; Minetto, M.A. Reproducibility and Accuracy of the Radiofrequency Echographic Multi-Spectrometry for Femoral Mineral Density Estimation and Discriminative Power of the Femoral Fragility Score in Patients with Primary and Disuse-Related Osteoporosis. J. Clin. Med. 2022, 11, 3761. https://doi.org/10.3390/jcm11133761
Lalli P, Mautino C, Busso C, Bardesono F, Di Monaco M, Lippi L, Invernizzi M, Minetto MA. Reproducibility and Accuracy of the Radiofrequency Echographic Multi-Spectrometry for Femoral Mineral Density Estimation and Discriminative Power of the Femoral Fragility Score in Patients with Primary and Disuse-Related Osteoporosis. Journal of Clinical Medicine. 2022; 11(13):3761. https://doi.org/10.3390/jcm11133761
Chicago/Turabian StyleLalli, Piera, Claudia Mautino, Chiara Busso, Francesca Bardesono, Marco Di Monaco, Lorenzo Lippi, Marco Invernizzi, and Marco Alessandro Minetto. 2022. "Reproducibility and Accuracy of the Radiofrequency Echographic Multi-Spectrometry for Femoral Mineral Density Estimation and Discriminative Power of the Femoral Fragility Score in Patients with Primary and Disuse-Related Osteoporosis" Journal of Clinical Medicine 11, no. 13: 3761. https://doi.org/10.3390/jcm11133761