
A Prospective Study of Etiology and Auditory Profiles in Infants with Congenital Unilateral Sensorineural Hearing Loss

 ,
,
Abstract
:1. Introduction
2. Materials and Methods
2.1. Study Design
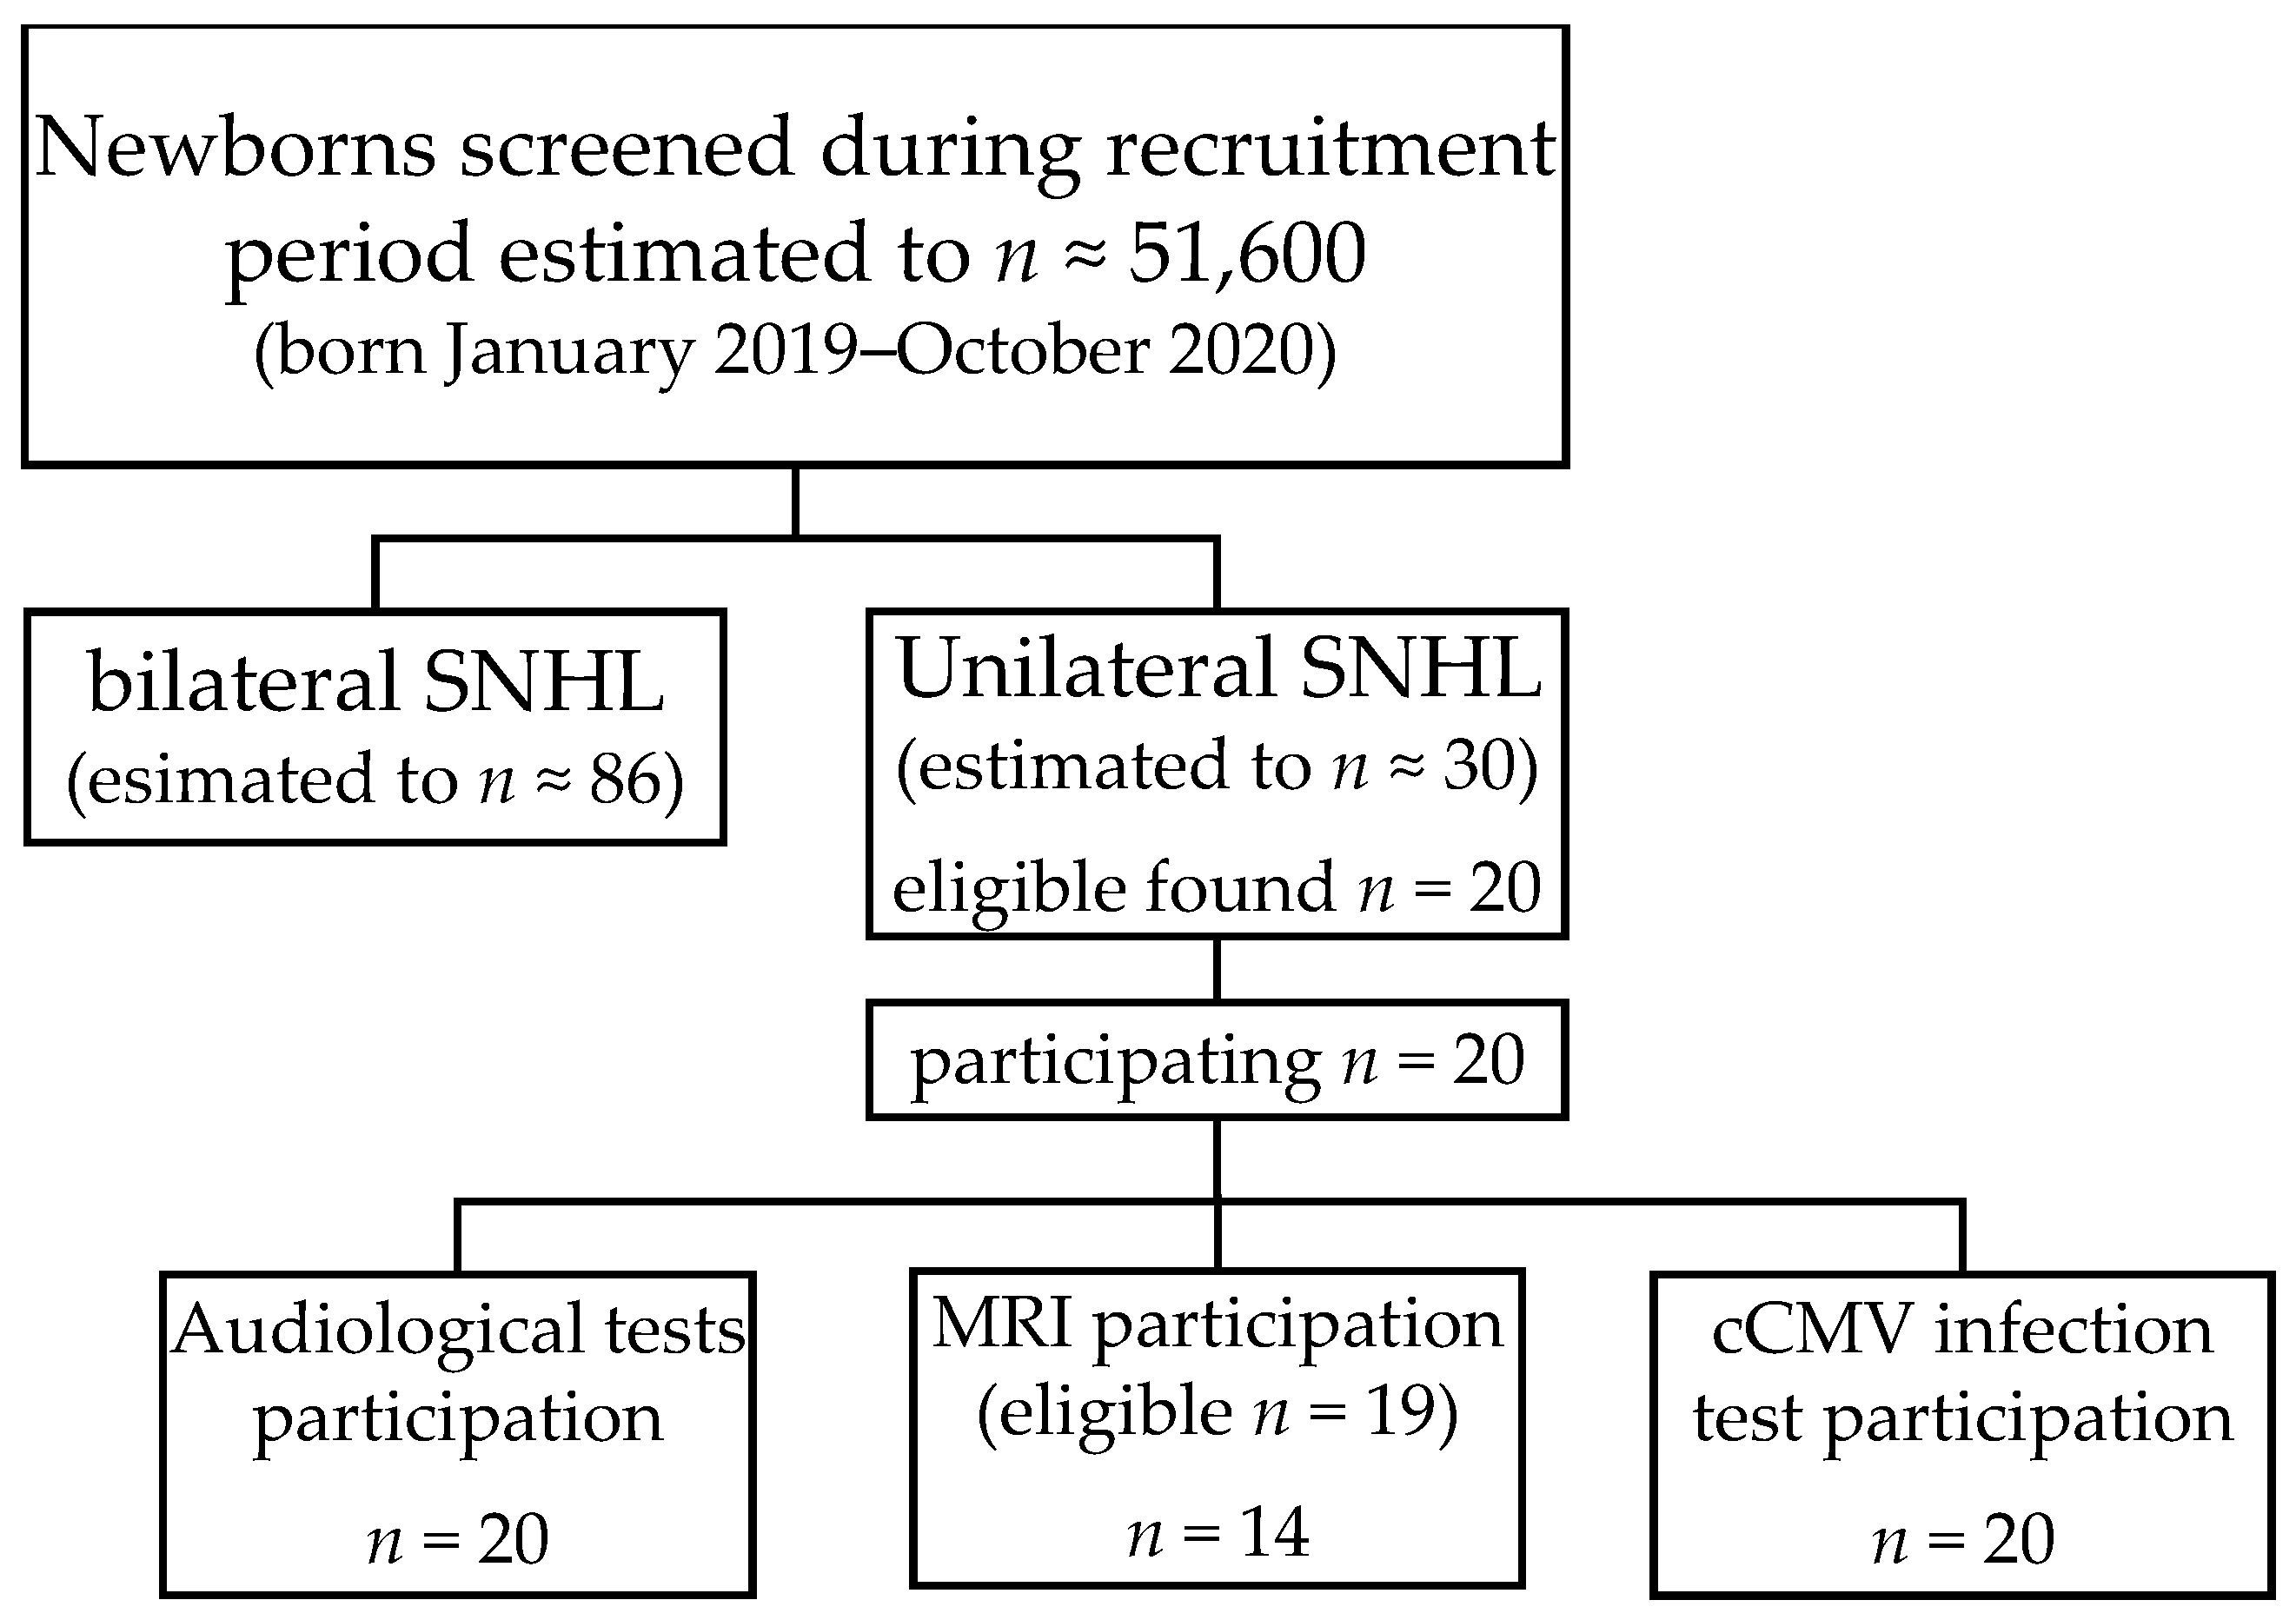
2.2. Subjects
2.3. Auditory Brainstem Response (ABR)
2.4. Transient-Evoked Otoacoustic Emission (TEOAE)
2.5. Distortion Product Otoacoustic Emission (DPOAE)
2.6. Tympanometry and Acoustic Stapedius Reflex Threshold (ART)
2.7. Magnetic Resonance Imaging (MRI)
2.8. Congenital Cytomegalovirus (cCMV) Infection
2.9. Statistical Analysis
3. Results
3.1. Subjects
3.2. Auditory Brainstem Response (ABR)
3.2.1. ABR Thresholds (ABRthrs)
3.2.2. ABR I–V Intervals
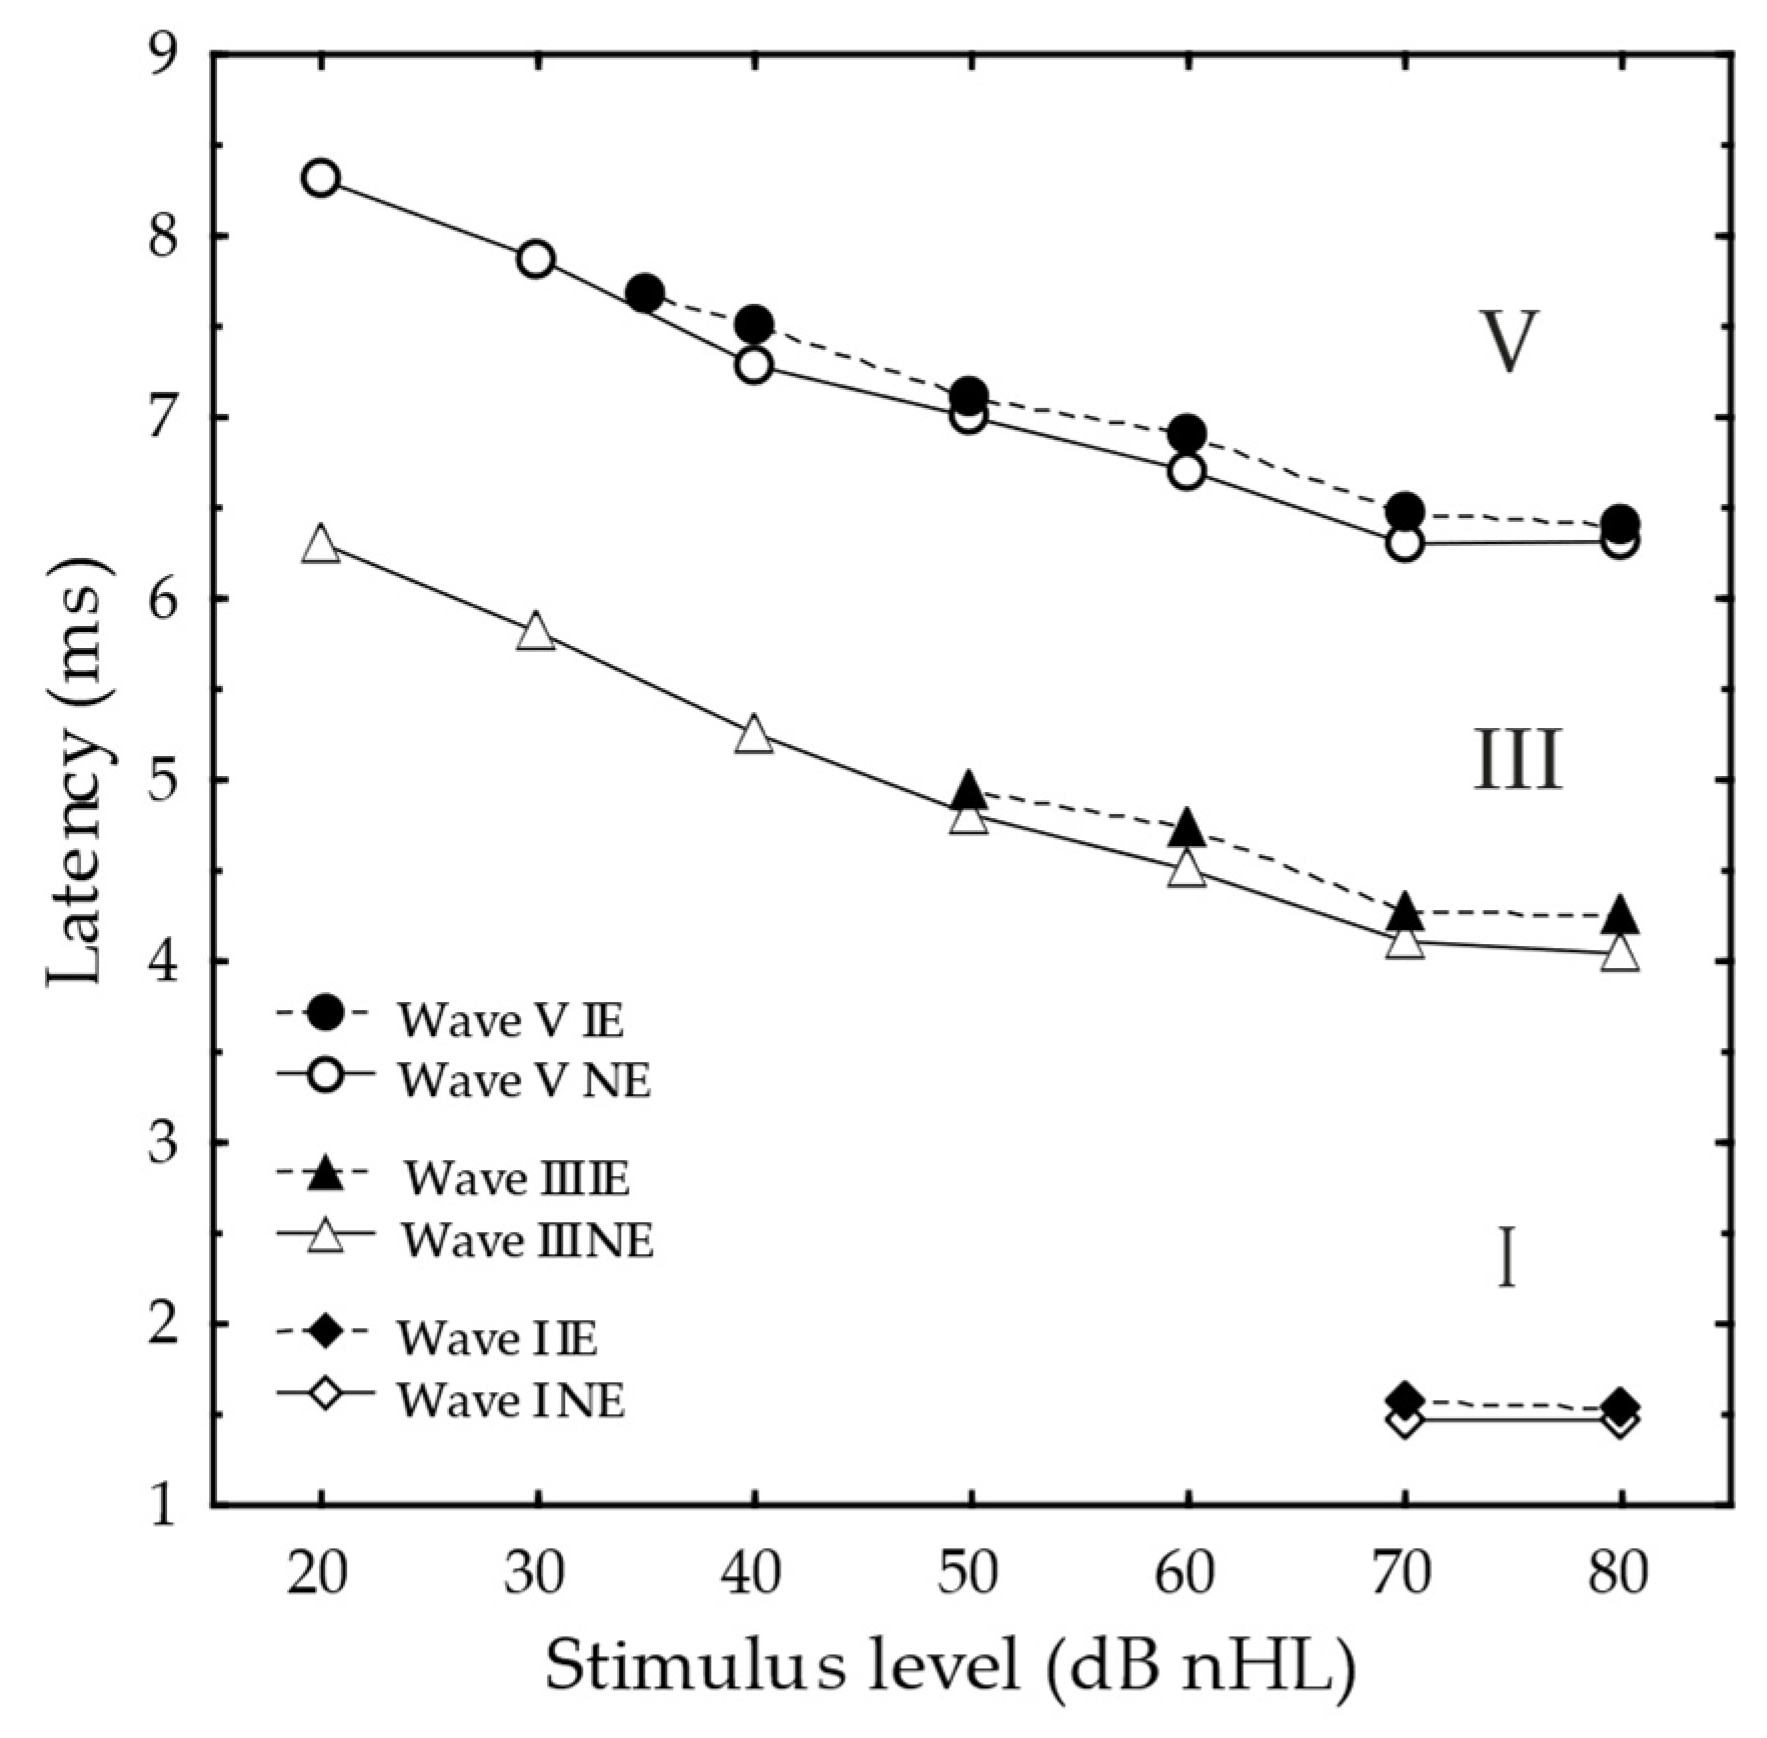
3.2.3. ABR Latencies
3.2.4. ABR Wave Amplitudes
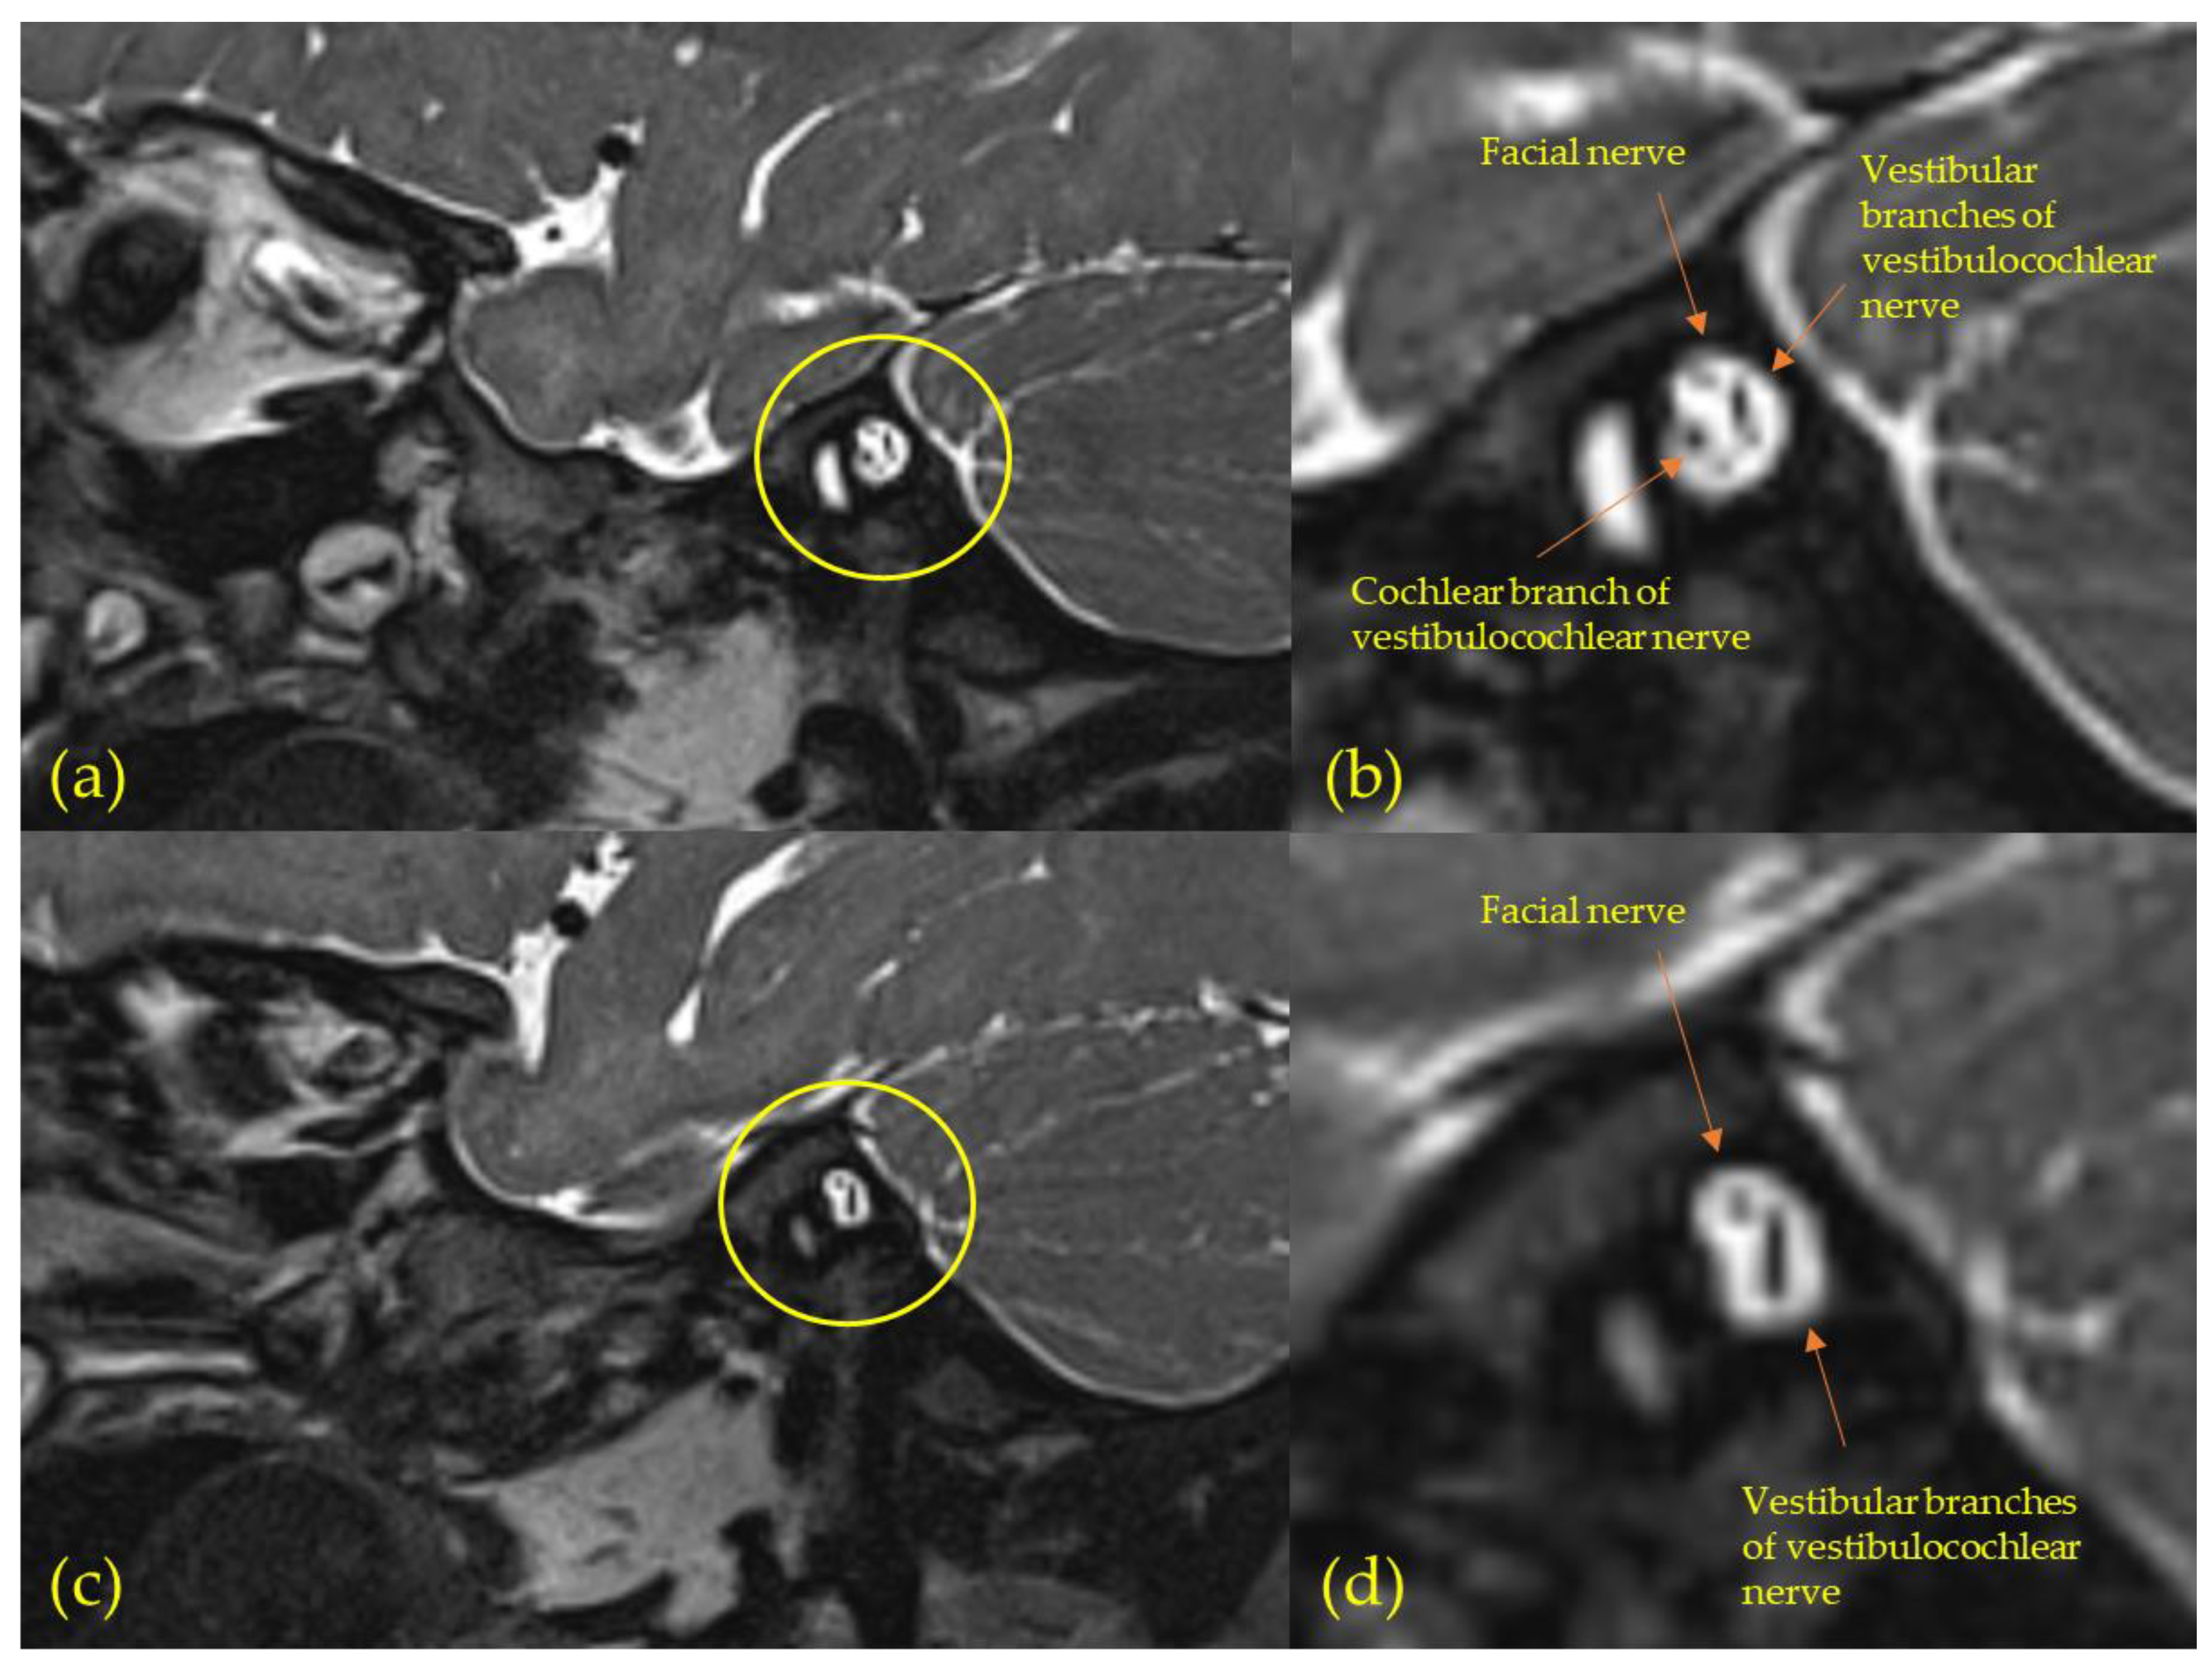
3.3. Magnetic Resonance Imaging (MRI)
3.4. Congenital Cytomegalovirus (cCMV) Infection
3.5. Tympanometry and Acoustic Stapedius Reflex Threshold (ART)
3.6. Transient-Evoked Otoacoustic Emission (TEOAE)
3.7. Distortion-Product Otoacoustic Emission (DPOAE)
4. Discussion
4.1. Magnetic Resonance Imaging (MRI)
4.2. Congenital Cytomegalovirus (cCMV) Infection
4.3. Affected Mechanisms and Auditory Profiles
4.4. Strengths and Limitations
5. Conclusions
Supplementary Materials
Author Contributions
Funding
Institutional Review Board Statement
Informed Consent Statement
Data Availability Statement
Acknowledgments
Conflicts of Interest
References
- Mehl, A.L.; Thomson, V. Newborn hearing screening: The great omission. Pediatrics 1998, 101, e4. [Google Scholar] [CrossRef] [PubMed] [Green Version]
- Berninger, E.; Westling, B. Outcome of a universal newborn hearing-screening programme based on multiple transient-evoked otoacoustic emissions and clinical brainstem response audiometry. Acta Otolaryngol. 2011, 131, 728–739. [Google Scholar] [CrossRef] [PubMed]
- McKay, S.; Gravel, J.S.; Tharpe, A.M. Amplification considerations for children with minimal or mild bilateral hearing loss and unilateral hearing loss. Trends Amplif. 2008, 12, 43–54. [Google Scholar] [CrossRef] [PubMed] [Green Version]
- Kuppler, K.; Lewis, M.; Evans, A.K. A review of unilateral hearing loss and academic performance: Is it time to reassess traditional dogmata? Int. J. Pediatr. Otorhinolaryngol. 2013, 77, 617–622. [Google Scholar] [CrossRef] [PubMed]
- Lieu, J.E.C.; Karzon, R.K.; Ead, B.; Tye-Murray, N. Do Audiologic Characteristics Predict Outcomes in Children With Unilateral Hearing Loss? Otol. Neurotol. 2013, 34, 1703–1710. [Google Scholar] [CrossRef] [PubMed] [Green Version]
- Humes, L.E.; Allen, S.K.; Bess, F.H. Horizontal sound localization skills of unilaterally hearing-impaired children. Audiology 1980, 19, 508–518. [Google Scholar] [CrossRef]
- Newton, V.E. Sound localisation in children with a severe unilateral hearing loss. Audiology 1983, 22, 189–198. [Google Scholar] [CrossRef]
- Bess, F.H.; Tharpe, A.M. Unilateral hearing impairment in children. Pediatrics 1984, 74, 206–216. [Google Scholar] [CrossRef]
- Bess, F.H.; Tharpe, A.M. Case history data on unilaterally hearing-impaired children. Ear Hear. 1986, 7, 14–19. [Google Scholar] [CrossRef]
- Bovo, R.; Martini, A.; Agnoletto, M.; Beghi, A.; Carmignoto, D.; Milani, M.; Zangaglia, A.M. Auditory and academic performance of children with unilateral hearing loss. Scand. Audiol. Suppl. 1988, 30, 71–74. [Google Scholar]
- Ruscetta, M.N.; Arjmand, E.M.; Pratt, S.R. Speech recognition abilities in noise for children with severe-to-profound unilateral hearing impairment. Int. J. Pediatr. Otorhinolaryngol. 2005, 69, 771–779. [Google Scholar] [CrossRef] [PubMed]
- Orzan, E.; Pizzamiglio, G.; Gregori, M.; Marchi, R.; Torelli, L.; Muzzi, E. Correlation of cochlear aperture stenosis with cochlear nerve deficiency in congenital unilateral hearing loss and prognostic relevance for cochlear implantation. Sci. Rep. 2021, 11, 3338. [Google Scholar] [CrossRef] [PubMed]
- van Beeck Calkoen, E.A.; Sanchez Aliaga, E.; Merkus, P.; Smit, C.F.; van de Kamp, J.M.; Mulder, M.F.; Goverts, S.T.; Hensen, E.F. High prevalence of abnormalities on CT and MR imaging in children with unilateral sensorineural hearing loss irrespective of age or degree of hearing loss. Int. J. Pediatr. Otorhinolaryngol. 2017, 97, 185–191. [Google Scholar] [CrossRef]
- Paul, A.; Marlin, S.; Parodi, M.; Rouillon, I.; Guerlain, J.; Pingault, V.; Couloigner, V.; Garabedian, E.N.; Denoyelle, F.; Loundon, N. Unilateral Sensorineural Hearing Loss: Medical Context and Etiology. Audiol. Neurootol. 2017, 22, 83–88. [Google Scholar] [CrossRef]
- Ropers, F.G.; Pham, E.N.B.; Kant, S.G.; Rotteveel, L.J.C.; Rings, E.; Verbist, B.M.; Dekkers, O.M. Assessment of the Clinical Benefit of Imaging in Children With Unilateral Sensorineural Hearing Loss: A Systematic Review and Meta-analysis. JAMA Otolaryngol. Head Neck Surg. 2019, 145, 431–443. [Google Scholar] [CrossRef]
- McClay, J.E.; Booth, T.N.; Parry, D.A.; Johnson, R.; Roland, P. Evaluation of pediatric sensorineural hearing loss with magnetic resonance imaging. Arch. Otolaryngol. Head Neck Surg. 2008, 134, 945–952. [Google Scholar] [CrossRef] [PubMed] [Green Version]
- Masuda, S.; Usui, S. Comparison of the prevalence and features of inner ear malformations in congenital unilateral and bilateral hearing loss. Int. J. Pediatr. Otorhinolaryngol. 2019, 125, 92–97. [Google Scholar] [CrossRef]
- Clemmens, C.S.; Guidi, J.; Caroff, A.; Cohn, S.J.; Brant, J.A.; Laury, A.M.; Bilaniuk, L.T.; Germiller, J.A. Unilateral cochlear nerve deficiency in children. Otolaryngol. Head Neck Surg. 2013, 149, 318–325. [Google Scholar] [CrossRef]
- Gruber, M.; Brown, C.; Mahadevan, M.; Neeff, M. Concomitant imaging and genetic findings in children with unilateral sensorineural hearing loss. J. Laryngol. Otol. 2017, 131, 688–695. [Google Scholar] [CrossRef]
- Masuda, S.; Usui, S.; Matsunaga, T. High prevalence of inner-ear and/or internal auditory canal malformations in children with unilateral sensorineural hearing loss. Int. J. Pediatr. Otorhinolaryngol. 2013, 77, 228–232. [Google Scholar] [CrossRef]
- Nakano, A.; Arimoto, Y.; Matsunaga, T. Cochlear nerve deficiency and associated clinical features in patients with bilateral and unilateral hearing loss. Otol. Neurotol. 2013, 34, 554–558. [Google Scholar] [CrossRef] [PubMed]
- Barbi, M.; Binda, S.; Caroppo, S.; Ambrosetti, U.; Corbetta, C.; Sergi, P. A wider role for congenital cytomegalovirus infection in sensorineural hearing loss. Pediatr. Infect. Dis. J. 2003, 22, 39–42. [Google Scholar] [CrossRef] [PubMed]
- Morton, C.C.; Nance, W.E. Newborn hearing screening—A silent revolution. N. Engl. J. Med. 2006, 354, 2151–2164. [Google Scholar] [CrossRef] [PubMed]
- Vos, B.; Noll, D.; Whittingham, J.; Pigeon, M.; Bagatto, M.; Fitzpatrick, E.M. Cytomegalovirus-A Risk Factor for Childhood Hearing Loss: A Systematic Review. Ear Hear. 2021, 42, 1447–1461. [Google Scholar] [CrossRef]
- Fowler, K.B.; McCollister, F.P.; Dahle, A.J.; Boppana, S.; Britt, W.J.; Pass, R.F. Progressive and fluctuating sensorineural hearing loss in children with asymptomatic congenital cytomegalovirus infection. J. Pediatr. 1997, 130, 624–630. [Google Scholar] [CrossRef]
- Dahle, A.J.; Fowler, K.B.; Wright, J.D.; Boppana, S.B.; Britt, W.J.; Pass, R.F. Longitudinal investigation of hearing disorders in children with congenital cytomegalovirus. J. Am. Acad. Audiol. 2000, 11, 283–290. [Google Scholar] [CrossRef]
- Fowler, K.B.; Dahle, A.J.; Boppana, S.B.; Pass, R.F. Newborn hearing screening: Will children with hearing loss caused by congenital cytomegalovirus infection be missed? J. Pediatr. 1999, 135, 60–64. [Google Scholar] [CrossRef]
- Fowler, K.B.; McCollister, F.P.; Sabo, D.L.; Shoup, A.G.; Owen, K.E.; Woodruff, J.L.; Cox, E.; Mohamed, L.S.; Choo, D.I.; Boppana, S.B. A Targeted Approach for Congenital Cytomegalovirus Screening Within Newborn Hearing Screening. Pediatrics 2017, 139, e20162128. [Google Scholar] [CrossRef] [Green Version]
- Karltorp, E.; Hellström, S.; Lewensohn-Fuchs, I.; Carlsson-Hansén, E.; Carlsson, P.I.; Engman, M.L. Congenital cytomegalovirus infection—A common cause of hearing loss of unknown aetiology. Acta Paediatr. 2012, 101, e357–e362. [Google Scholar] [CrossRef]
- Arndt, S.; Prosse, S.; Laszig, R.; Wesarg, T.; Aschendorff, A.; Hassepass, F. Cochlear Implantation in Children with Single-Sided Deafness: Does Aetiology and Duration of Deafness Matter? Audiol. Neurootol. 2015, 20, 21–30. [Google Scholar] [CrossRef]
- Gordon, K.A.; Henkin, Y.; Kral, A. Asymmetric Hearing During Development: The Aural Preference Syndrome and Treatment Options. Pediatrics 2015, 136, 141–153. [Google Scholar] [CrossRef] [Green Version]
- Steinberg, J.C.; Gardner, M.B. The Dependence of Hearing Impairment on Sound Intensity. J. Acoust. Soc. Am. 1937, 9, 11–23. [Google Scholar] [CrossRef]
- Moore, B.C. Perceptual consequences of cochlear hearing loss and their implications for the design of hearing aids. Ear Hear. 1996, 17, 133–161. [Google Scholar] [CrossRef] [PubMed] [Green Version]
- Eggermont, J.J. Electrocochleography and Recruitment. Ann. Otol. Rhinol. Laryngol. 1977, 86, 138–149. [Google Scholar] [CrossRef] [PubMed]
- Karlsson, K.K.; Berninger, E.; Gustafsson, L.L.; Alvan, G. Pronounced quinine-induced cochlear hearing loss. A mechanistic study in one volunteer at multiple stable plasma concentrations. Audiol. Med. 1995, 4, 12–24. [Google Scholar]
- Jerger, J. Clinical Experience With Impedance Audiometry. Arch. Otolaryngol. 1970, 92, 311–324. [Google Scholar] [CrossRef]
- Marchant, C.D.; McMillan, P.M.; Shurin, P.A.; Johnson, C.E.; Turczyk, V.A.; Feinstein, J.C.; Murdell Panek, D. Objective diagnosis of otitis media in early infancy by tympanometry and ipsilateral acoustic reflex thresholds. J. Pediatr. 1986, 109, 590–595. [Google Scholar] [CrossRef]
- Shera, C.A.; Guinan, J.J., Jr. Evoked otoacoustic emissions arise by two fundamentally different mechanisms: A taxonomy for mammalian OAEs. J. Acoust. Soc. Am. 1999, 105, 782–798. [Google Scholar] [CrossRef] [Green Version]
- Liberman, M.C.; Gao, J.; He, D.Z.Z.; Wu, X.; Jia, S.; Zuo, J. Prestin is required for electromotility of the outer hair cell and for the cochlear amplifier. Nature 2002, 419, 300–304. [Google Scholar] [CrossRef]
- Gorga, M.P.; Worthington, D.W.; Reiland, J.K.; Beauchaine, K.A.; Goldgar, D.E. Some comparisons between auditory brain stem response thresholds, latencies, and the pure-tone audiogram. Ear Hear. 1985, 6, 105–112. [Google Scholar] [CrossRef]
- Eggermont, J.J.; Don, M. Mechanisms of central conduction time prolongation in brain-stem auditory evoked potentials. Arch. Neurol. 1986, 43, 116–120. [Google Scholar] [CrossRef] [PubMed]
- Berninger, E.; Olofsson, A.; Leijon, A. Analysis of click-evoked auditory brainstem responses using time domain cross-correlations between interleaved responses. Ear Hear. 2014, 35, 318–329. [Google Scholar] [CrossRef] [PubMed]
- Berninger, E. Characteristics of normal newborn transient-evoked otoacoustic emissions: Ear asymmetries and sex effects. Int. J. Audiol. 2007, 46, 661–669. [Google Scholar] [CrossRef] [PubMed]
- Johansson, M.; Olofsson, Å.; Berninger, E. Twin study of neonatal transient-evoked otoacoustic emissions. Hear. Res. 2020, 398, 108108. [Google Scholar] [CrossRef] [PubMed]
- Bussé, A.M.L.; Mackey, A.R.; Hoeve, H.L.J.; Goedegebure, A.; Carr, G.; Uhlén, I.M.; Simonsz, H.J. Assessment of hearing screening programmes across 47 countries or regions I: Provision of newborn hearing screening. Int. J. Audiol. 2021, 60, 821–830. [Google Scholar] [CrossRef]
- Socialstyrelsen. Available online: https://sdb.socialstyrelsen.se/if_mfr_004/val.aspx (accessed on 2 June 2022).
- ISO389-6; Acoustics—Reference Zero for the Calibration of Audiometric Equipment—Part 6: Reference Threshold of Hearing for Test Signals of Short Duration. International Organization for Standardization: Geneva, Switzerland, 2007.
- IEC60318-4; Electroacoustics—Simulators of Human Head and Ear—Part 4: Occluded-Ear Simulator for the Measurement of Earphones Coupled to the Ear by Means of Ear Inserts. International Electrotechnical Commision: Geneva, Switzerland, 2010.
- Sklare, D.A.; Denenberg, L.J. Interaural attenuation for tubephone insert earphones. Ear Hear. 1987, 8, 298–300. [Google Scholar] [CrossRef]
- Kemp, D.T.; Ryan, S.; Bray, P. A guide to the effective use of otoacoustic emissions. Ear Hear. 1990, 11, 93–105. [Google Scholar] [CrossRef]
- Thornton, A.R.; Marotta, N.; Kennedy, C.R. The order of testing effect in otoacoustic emissions and its consequences for sex and ear differences in neonates. Hear. Res. 2003, 184, 123–130. [Google Scholar] [CrossRef]
- Berninger, E.; Karlsson, K.K.; Hellgren, U.; Eskilsson, G. Magnitude changes in transient evoked otoacoustic emissions and high-level 2f1-f2 distortion products in man during quinine administration. Scand. Audiol. 1995, 24, 27–32. [Google Scholar] [CrossRef]
- Friedman, A.B.; Guillory, R.; Ramakrishnaiah, R.H.; Frank, R.; Gluth, M.B.; Richter, G.T.; Dornhoffer, J.L. Risk analysis of unilateral severe-to-profound sensorineural hearing loss in children. Int. J. Pediatr. Otorhinolaryngol. 2013, 77, 1128–1131. [Google Scholar] [CrossRef]
- Haffey, T.; Fowler, N.; Anne, S. Evaluation of unilateral sensorineural hearing loss in the pediatric patient. Int. J. Pediatr. Otorhinolaryngol. 2013, 77, 955–958. [Google Scholar] [CrossRef] [PubMed]
- Simons, J.P.; Mandell, D.L.; Arjmand, E.M. Computed Tomography and Magnetic Resonance Imaging in Pediatric Unilateral and Asymmetric Sensorineural Hearing Loss. Arch Otolaryngol. Head Neck Surg. 2006, 132, 186–192. [Google Scholar] [CrossRef] [PubMed] [Green Version]
- Wang, L.; Xu, X.; Zhang, H.; Qian, J.; Zhu, J. Dried blood spots PCR assays to screen congenital cytomegalovirus infection: A meta-analysis. Virol. J. 2015, 12, 60. [Google Scholar] [CrossRef] [PubMed] [Green Version]
- Fernandez, C.; Chasqueira, M.-J.; Marques, A.; Rodrigues, L.; Marçal, M.; Tuna, M.; Braz, M.C.; Neto, A.S.; Mendes, C.; Lito, D.; et al. Lower prevalence of congenital cytomegalovirus infection in Portugal: Possible impact of COVID-19 lockdown? Eur. J. Pediatr. 2022, 181, 1259–1262. [Google Scholar] [CrossRef]
- Rios-Barnes, M.; Fontalvo, M.A.; Linan, N.; Plana, M.; Moreno, M.; Esteva, C.; Munoz-Almagro, C.; Noguera-Julian, A.; Alarcon, A.; Ríos-Barnés, M.; et al. Letter to the Editor on the original article: Lower prevalence of congenital cytomegalovirus infection in Portugal: Possible impact of COVID-19 lockdown? Eur. J. Pediatr. 2022, 181, 1293–1294. [Google Scholar] [CrossRef] [PubMed]
- Polonenko, M.J.; Papsin, B.C.; Gordon, K.A. Children With Single-Sided Deafness Use Their Cochlear Implant. Ear Hear. 2017, 38, 681–689. [Google Scholar] [CrossRef]
- Polonenko, M.J.; Gordon, K.A.; Cushing, S.L.; Papsin, B.C. Cortical organization restored by cochlear implantation in young children with single sided deafness. Sci. Rep. 2017, 7, 16900. [Google Scholar] [CrossRef]
- Thomas, J.P.; Neumann, K.; Dazert, S.; Voelter, C. Cochlear Implantation in Children With Congenital Single-Sided Deafness. Otol. Neurotol. 2017, 38, 496–503. [Google Scholar] [CrossRef]
- Janssen, T. A Review of the Effectiveness of Otoacoustic Emissions for Evaluating Hearing Status After Newborn Screening. Otol. Neurotol. 2013, 34, 1058–1063. [Google Scholar] [CrossRef] [Green Version]
- Fitzzaland, R.E.; Borton, T.E. The acoustic reflex and loudness recruitment. J. Otolaryngol. 1977, 6, 460–465. [Google Scholar]
- Berninger, E.; Karlsson, K.K.; Alvan, G. Quinine reduces the dynamic range of the human auditory system. Acta Otolaryngol. 1998, 118, 46–51. [Google Scholar] [PubMed]
- Rosenhamer, H.J.; Lindström, B.; Lundborg, T. On the use of click-evoked electric brainstem responses in audiological diagnosis. I. The variability of the normal response. Scand. Audiol. 1978, 7, 193–205. [Google Scholar] [CrossRef] [PubMed]
- Rosenhamer, H.J.; Lindström, B.; Lundborg, T. On the use of click-evoked electric brainstem responses in audiological diagnosis. IV. Interaural latency differences (wave V) in cochlear hearing loss. Scand. Audiol. 1981, 10, 67–73. [Google Scholar] [CrossRef] [PubMed]
- Jiang, Z.D.; Zhang, L.; Wu, Y.Y.; Liu, X.Y. Brainstem auditory evoked responses from birth to adulthood: Development of wave amplitude. Hear Res. 1993, 68, 35–41. [Google Scholar] [CrossRef]
- Jiang, Z.D. Intensity Effect on Amplitude of Auditory Brainstem Responses in Human. Scand Audiol. 1991, 20, 41–47. [Google Scholar] [CrossRef]
- Bagatto, M.P.; Moodie, S.; Scollie, S.; Seewald, R.; Moodie, S.; Pumford, J.; Liu, K.P. Clinical protocols for hearing instrument fitting in the Desired Sensation Level method. Trends Amplif. 2005, 9, 199–226. [Google Scholar] [CrossRef]
- Scollie, S.; Seewald, R.; Cornelisse, L.; Moodie, S.; Bagatto, M.; Laurnagaray, D.; Beaulac, S.; Pumford, J. The Desired Sensation Level multistage input/output algorithm. Trends Amplif. 2005, 9, 159–197. [Google Scholar] [CrossRef] [Green Version]
- Keidser, G.; Dillon, H.; Carter, L.; O’Brien, A. NAL-NL2 Empirical Adjustments. Trends Amplif. 2012, 16, 211–223. [Google Scholar] [CrossRef] [Green Version]
- McCreery, R.W.; Bentler, R.A.; Roush, P.A. Characteristics of hearing aid fittings in infants and young children. Ear Hear. 2013, 34, 701–710. [Google Scholar] [CrossRef] [Green Version]
- American Academy of Audiology. American Academy of Audiology Clinical Practice Guidelines: Pediatric Amplification; American Academy of Audiology: Reston, VA, USA, 2013; pp. 5–60. [Google Scholar]
- Kawell, M.E.; Kopun, J.G.; Stelmachowicz, P.G. Loudness discomfort levels in children. Ear Hear. 1988, 9, 133–136. [Google Scholar] [CrossRef]


| ID | IE | Sex | Age at Diagnosis (mos) | ABR Threshold IE (dB nHL) | ABR Wave I–V (ms) | ART (dB HL) | DPOAE (3 Frequencies or More) | MRI Result |
|---|---|---|---|---|---|---|---|---|
| 1 | L | M | 1.8 | 45 | 5.07 (4.90) | |||
| 2 | L | F | 2.5 | 35 | 4.53 (3.93) | X | N.A.D. | |
| 3 | L | F | 2.1 | >90 | 95 (90) | Hypoplasia cochlea, aplasia/severe hypoplasia auditory nerve, semicircular canal dysplasia and EVA | ||
| 4 | R | F | 2.2 | 40 | 80 (NT) | X | ||
| 5 | L | M | 2.1 | 40 | 4.87 (4.70) | 95 (90) | X | N.A.D. |
| 6 | L | M | 2.0 | >90 | >105 (75) | Aplasia cochlea, aplasia/severe hypoplasia auditory nerve, labyrinth dysplasia and semicircular canal dysplasia | ||
| 7 | R | F | 2.0 | 45 | 4.73 (4.73) | 80 (75) | X | Bilateral EVA with probable IP II |
| 8 | R | F | 5.3 | >90 | 95 (85) | Aplasia/severe hypoplasia auditory nerve and hypoplasia inner ear canal | ||
| 9 | L | M | 2.2 | >90 | >105 (85) | |||
| 10 | L | M | 2.7 | 40 | 4.94 (5.13) | 95 (85) | X | |
| 11 | R | M | 3.3 | >90 | >105 (90) | Aplasia/severe hypoplasia auditory nerve and hypoplasia inner ear canal | ||
| 12 | R | F | 1.8 | >90 | >105 (85) | Aplasia/severe hypoplasia auditory nerve and hypoplasia inner ear canal | ||
| 13 | L | F | 5.6 | >90 | N.A.D. | |||
| 14 | L | M | 1.7 | >90 | 95 (80) | Aplasia/severe hypoplasia auditory nerve | ||
| 15 | L | M | 2.0 | 40 | 4.84 (4.80) | N.A.D. | ||
| 16 | L | F | 2.3 | 45 | 4.90 (4.57) | N.A.D. | ||
| 17 | L | M | 2.9 | 60 | 100 (75) | Aplasia/severe hypoplasia auditory nerve | ||
| 18 | R | F | 3.0 | 60 | 100 (80) | Unilateral EVA with probable IP II | ||
| 19 | L | M | 4.3 | 40 | 4.40 (4.87) | |||
| 20 | R | F | 2.4 | 50 | 5.60 (4.83) | 85 (75) |
Publisher’s Note: MDPI stays neutral with regard to jurisdictional claims in published maps and institutional affiliations. |
© 2022 by the authors. Licensee MDPI, Basel, Switzerland. This article is an open access article distributed under the terms and conditions of the Creative Commons Attribution (CC BY) license (https://creativecommons.org/licenses/by/4.0/).
Share and Cite
Johansson, M.; Karltorp, E.; Edholm, K.; Drott, M.; Berninger, E. A Prospective Study of Etiology and Auditory Profiles in Infants with Congenital Unilateral Sensorineural Hearing Loss. J. Clin. Med. 2022, 11, 3966. https://doi.org/10.3390/jcm11143966
Johansson M, Karltorp E, Edholm K, Drott M, Berninger E. A Prospective Study of Etiology and Auditory Profiles in Infants with Congenital Unilateral Sensorineural Hearing Loss. Journal of Clinical Medicine. 2022; 11(14):3966. https://doi.org/10.3390/jcm11143966
Chicago/Turabian StyleJohansson, Marlin, Eva Karltorp, Kaijsa Edholm, Maria Drott, and Erik Berninger. 2022. "A Prospective Study of Etiology and Auditory Profiles in Infants with Congenital Unilateral Sensorineural Hearing Loss" Journal of Clinical Medicine 11, no. 14: 3966. https://doi.org/10.3390/jcm11143966
APA StyleJohansson, M., Karltorp, E., Edholm, K., Drott, M., & Berninger, E. (2022). A Prospective Study of Etiology and Auditory Profiles in Infants with Congenital Unilateral Sensorineural Hearing Loss. Journal of Clinical Medicine, 11(14), 3966. https://doi.org/10.3390/jcm11143966