Author Contributions
Conceptualization, operation, and methodology; M.N., T.Y., K.N. and N.K.; data curating; M.N., T.Y. and H.S.; original draft preparation, writing, review, and editing: all authors; project administration; M.H., K.O. and T.G.; supervision; M.H., K.O. and T.G. All authors have read and agreed to the published version of the manuscript.
Acknowledgments
The authors thank Paolo A. Bolognese, Chiari Ehlas Danlos Syndrome Center, Mount Sinai South Nassau, Lake Success, New York, USA, and Emeritus, Thomas H. Milhorat, Feinstein Institute from Neuroscience Northwell Health, Health, Manhasset New York, USA for their advice and support.
Figure 1.
Illustrative cases: CM-I subtypes. (A): CM-I type A, (B): CM-I type B, (C): CM-I type C, and (D): CM-borderline. Left panel: 2D CT axial image at the level of the foramen magnum; right panel: magnetic resonance (MR) sagittal midline image. (E,F): MR midsagittal images demonstrating the character of CM-I type with HDCT. VPCF, VAFM, and occipital bone size are normal in size. (E): MR midsagittal image in supine position showing normal interval BDI (7.7 mm), normal BAI (3.5 mm), normal CXA) (141°), large retro-odontoid pannus (asterisk), and low-lying cerebellar tonsils. (F): Upon observation of the upright position, there is evidence of cranial settling (2.5 mm decrease in BDI), posterior gliding of occipital condyle, 4.3 mm increase in BAI, anterior flexion of the occipito–atlantal joint (decrease of 8° in CXA), and increased cerebellar ptosis with downward displacement cerebellar tonsils to C1 (white arrow). Note the significantly increased impaction of the foramen magnum anteriorly and posteriorly. Bilateral black dotted arrow = CXA, white arrow = tonsillar herniation. (G): MR midsagittal image demonstrating the character of CM-I type A with TCS. VPCF, VAFM, and occipital bone size are normal in size. MR image showing elongation and downward displacement of the brainstem and cerebellum, as well as large supracerebellar cistern (double asterisk). Abbreviations: CM-I = Chiari malformation type I, BDI = the interval between basion and dens, BAI = the interval between basion and atlas, CXA = the clivo-axial angle, HDCT = hereditary disorders of connective tissue, TCS = tethered cord syndrome.
![Jcm 11 04556 g001a]()
![Jcm 11 04556 g001b]()
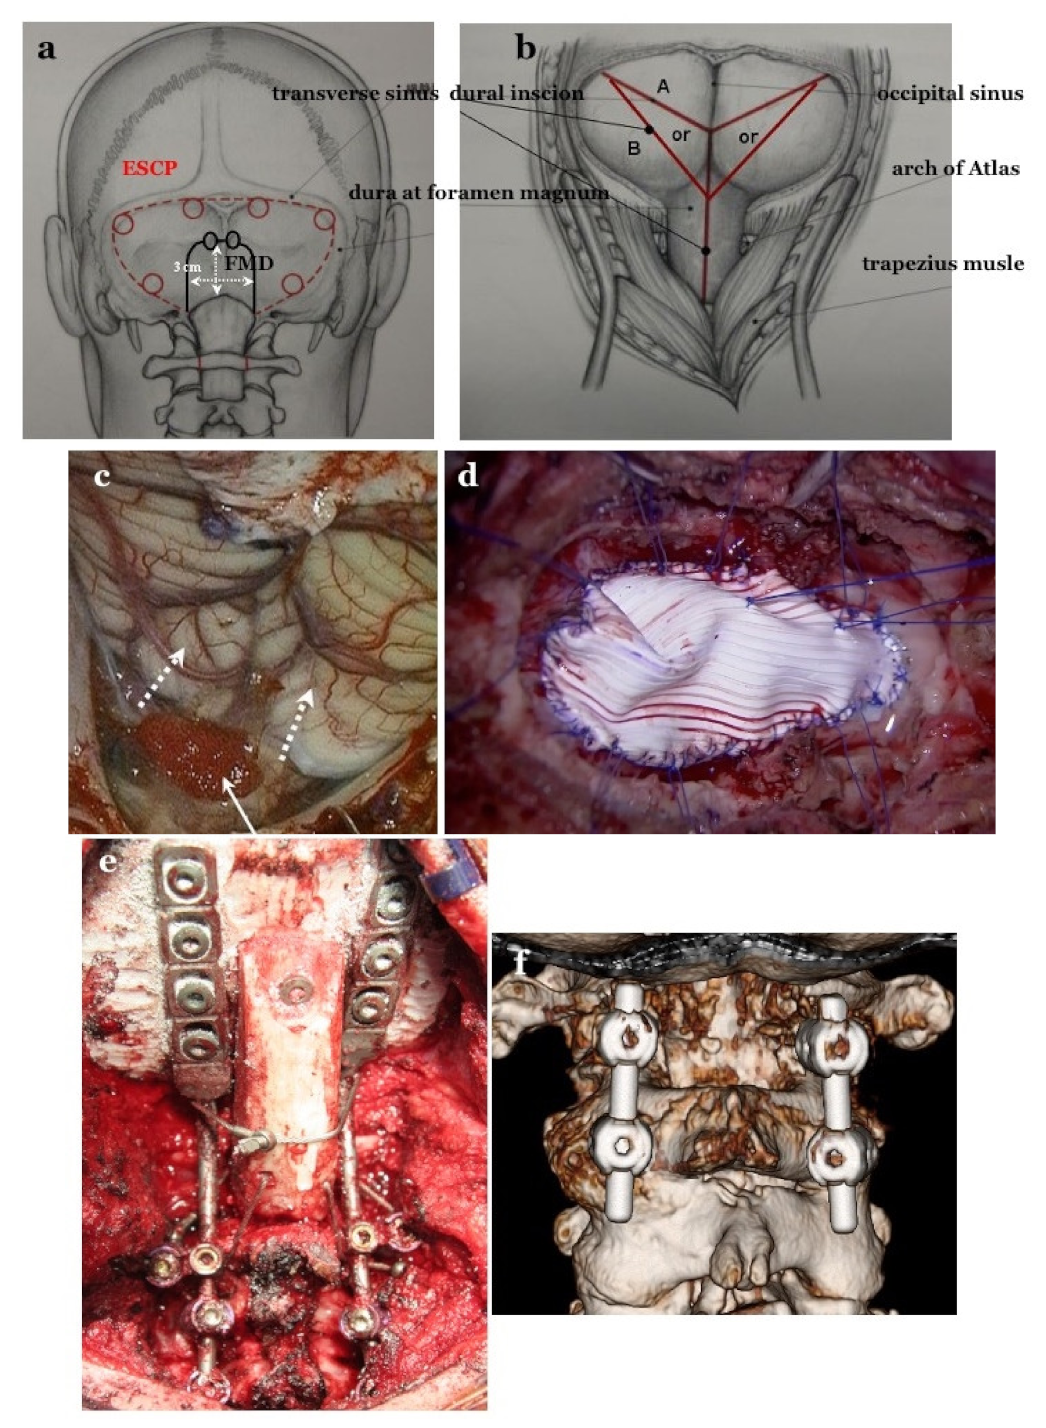
Figure 2.
Craniotomy of FMD and ESCP, and dural incision after opening the dura matter and dural plasty. (a): For expansive suboccipital cranioplasty (ESCP), craniotomy is performed along the transverse and sigmoid sinuses. The foramen magnum (FMD) craniotomy is 2–3 cm in size. In FMD, the subocciptal muscle group is preserved. (b): Dural incision in both operations. (c): Opening the dura mater while preserving the arachnoid membrane. Tonsils move up after achieving appropriate decompression (white dotted arrows). Preventing blood from entering into the subarachnoid space through the pinhole by placing a sponge (white arrow) (d): Dural plasty by tightly applying Gore Tex® (Gore Inc., Newark, DE, USA) sheet water and applying 6–8 threads on bilateral sutures and midline for tenting. OCF and C1/2 FIX. (e): Occipital–cervical fixation (OCF), occipital screws, pedicle screws at bilateral C2, and lateral mass screw at bilateral C3 as anchor screws were connected by rods. (f): C1/2 fixation by Goel’s and Harm’s method: pedicle screws at bilateral C2 and lateral mass screws at bilateral C1 as anchor screws were connected by rods.
![Jcm 11 04556 g002]()
Figure 3.
Illustrative cases: color Doppler ultrasonography (CDU). (a): CDU at the foramen of Magendie after craniotomy. The cerebrospinal fluid (CSF) space of the cisterna magna was very small. Low CSF stump flow was observed. (b): CDU at the foramen of Magendie after opening the dura mater. Although the CSF space became slightly larger than before opening, CSF flow was unchanged, and only low stump flow was observed. * CSF space. (c): CDU at the foramen of Magendie after expansive craniotomy and dural plasty. * CSF space. (d): CDU at the foramen of Luschka after dural plasty. CDU was performed immediately after craniotomy. In this case, the cisterna magna was small and CSF flow was low, so dural plasty was performed. After dural plasty, CDU was performed again. A sufficiently large wave of CSF flow was confirmed from the foramina of Magendie and Luschka. A sufficiently large space of the cisterna magna (12 mL) was observed post-operatively. The maximum CSF flow velocity was 3 cm/s at the foramen of Magendie and 10 cm/s at the foramen of Luschka.
![Jcm 11 04556 g003]()
Figure 4.
Illustrative cases pre-Op.: (a–e), Post-Op.: (f–j).
Figure 4.
Illustrative cases pre-Op.: (a–e), Post-Op.: (f–j).
Figure 5.
Measurement of maximum flow velocity (cm/s) and % cardiac cycle in Cine PC MRI, and pre- and post-operative illustrative cases. (a): Photograph showing the methods used for measuring percentage cardiac cycle (time of maximum flow velocity from R wave: A/R-R interval: B) and maximum flow velocity (speed of maximum flow: C) on cine phase contrast MRI. (b–f): Cine phase contrast MR images demonstrating that the caudal maximum flow velocity at the foramen of Magendie and dorsal CSF space at the foramen magnum (FM) is smaller than in controls and increased post-operatively. (d,g): Cine phase contrast MR images demonstrating large caudal maximum flow velocity in the syringomyelia; however, reliable post-operative flow was not confirmed.
Table 1.
Subtypes of Chiari malformation type I (CM-I) classified on the basis of morphometric analyses, cause of hindbrain ptosis, and surgical intervention.
Table 1.
Subtypes of Chiari malformation type I (CM-I) classified on the basis of morphometric analyses, cause of hindbrain ptosis, and surgical intervention.
| | CM-I Type A | CM-I Type B | CM-I Type C | CM-Borderline |
|---|
| | 36 cases | 120 cases | 115 cases | 14 cases |
| VPCF | normal | normal | small | normal |
| VAFM | normal | small | small | small |
| VBPCF/VPCF | normal | large | large | normal/large |
| Occipital bone size | normal | small | small | small |
| Axial length of hindbrain | normal | normal | elongation | normal |
| Position of hindbrain | downward displacement | normal | downward displacement | normal |
| Cause | others | crowdedness of AFM | crowdedness of whole PCF | crowdedness of AFM |
| Intervention | others | FMD | ESCP | FMD |
Table 2.
Morphometric characterization and other mechanisms of hindbrain ptosis in CM-I type A, and the corresponding surgical intervention.
Table 2.
Morphometric characterization and other mechanisms of hindbrain ptosis in CM-I type A, and the corresponding surgical intervention.
| | Instability of CCJ | Tethering | Hydrocephalus | Intracranial Mass | Pressure Dissociation |
|---|
| VPCF | normal | normal | normal | normal | normal |
| VAFM | normal | normal | normal | normal | normal |
| VBPCV/VPCF | normal | normal | normal/large | normal/large | normal |
| Brainstem and Cerebellum | normal | elongation and downward displacement | | normal | normal |
| Cause | cranial settling | traction | pressure coning | | Hypotension of intraspinal canal |
| Intervention | CCF | untethering/SFT | VPS | resection of mass or FMD | others |
Table 3.
Neurological symptoms and signs, and their outcomes.
Table 3.
Neurological symptoms and signs, and their outcomes.
| | CM-I Type A (Craniocervical Instabiity) | | CM-I Type B | | CM-I Type C | | CM-Borderline | |
|---|
| | 36 Cases | Improvement Rate | 120 Cases | Improvement Rate | 115 Cases | Improvement Rate | 14 Cases | Improvement Rate |
|---|
| Symptoms and signs of brain stem and cerebellum | | | | | | | | |
| Headache | 35 (97.2%) * | 33/35 (94.2%) † | 76 (63.3%) ** | 70/76 (92.1%) † | 91 (79.1%) * | 78/91 (85.7%) † | 7 (50.0%) ** | 16/20 (80.0%) |
| Neck pain | 34 (94.4%) * | 32/34 (94.1%) † | 74 (61.7%) ** | 68/74 (91.9%) † | 84 (73.0%) * | 77/84 (91.7%) † | 7 (50.0%) ** | 13/17 (76.4%) |
| Ataxia | 22 (61.1%) * | 14/22 (63.6%) | 55 (45.8%) ** | 45/55 (81.8%) † | 75 (65.2%) * | 65/ 75 (86.7%) † | 5 (35.7%) ** | 11/15 (73.3%) |
| Dizziness and/or vertigo | 28 (77.8%) * | 22/28 (78.5%) † | 43 (35.8%) ** | 33/43 (76.7%) | 83 (62.2%) * | 73/83 (88.0%) † | 2 (14.3%) ** | 7/10 (70.0%) |
| Dysphasia | 10 (27.8%) ** | 7/10 (70.0%) | 38 (31.7%) | 20/38 (52.6%) ⨍ | 38 (33.0%) | 20/38 (52.6%) ⨍ | 0 (0%) | 0 (0%) |
| Symptoms and signs of spinal cord myelopathy | | | | | | | | |
| Pain of extremities, trunk | 16 (44.4%) ** | 14/16 (87.5%) † | 87 (72.5%) * | 48/70 (68.6%) ⨍ | 65 (56.5%) | 44/65 (67.7%) ⨍ | 10 (71.4%) * | 8/10 (80.0%) |
| Focal dysesthesia of extremities and/or trunk | 18 (50.0%) ** | 14/18 (77.8%) | 77 (64.2%) * | 45/67 (67.1%) ⨍ | 57 (49.6%) | 50/57 (70.2%) | 9 (64.3%) * | 6/9 (66.7%) ⨍ |
| Motor weakness | 24 (66.7%) | 12/14 (85.7%) † | 60 (50.0%) | 47/60 (78.3%) † | 51 (44.3%) | 45/51 (88.2%) † | 11 (78.6%) * | 8/11 (72.76%) |
| Hypalgesia | 12 (33.3%) ** | 6/12 (50.0%) | 55 (45.8%) | 40/55 (72.7%) | 25 (21.7%) ** | 41/55 (74.5%) | 10 (71.4%) * | 6/10 (60.0%) ⨍ |
Dissociated sensory
Sensory disturbance | 9 (25.0%) ** | 6/9 (66.7%) | 50 (41.7%) | 36/50 (72.0%) | 20 (17.4%) ** | 38/50 (76.0%) | 8 (57.1%) * | 4/8 (50.0%) ⨍ |
Table 4.
JOA score RR after FMD and ESCP, and their outcomes.
Table 4.
JOA score RR after FMD and ESCP, and their outcomes.
| | Improved | JOA Score RR (%) | Re-Syringomyelia | Stabilized | Deteriorated | Transient Morbidities |
|---|
| | Neurological Symptoms/Signs | (Mean with ± SD) | | Neurological Symptoms/Signs | Neurological Symptoms/Signs | |
|---|
| Total Number: 300 surgeries | 248/300 (82.7%) | 58.5 ± 10.4 | 24/300 (8.0%) | 25/300 (8.3%) | 28/300 (9.3%) | 9/300 (3.0%) |
| (Posterior fossa decompression) | | | | | | |
| 12 years or older (≥12) | | | | | | |
| FMD: 133 cases | 115/133 (86.5%) | 58.7 ± 10.2 | 10/133 (7.5%) * | 10/133 (7.5%) | 8/130 (6.2%) * | 3/133 (1.7%) |
| (for CM-I types A, B and CM-borderline) | | | | | | |
| ESCP: 87 cases | 78/87 (89.7%) | 60.2 ± 10.1 | 1/87 (1.1%) ** | 8/87 (9.2%) | 2/87 (2.3%) ** | 4/87 (4.6%) * |
| (for CM-I type C) | | | | | | |
| Younger than 12 years (<12) | | | | | | |
| FMD for all types: 80 | | | | | | |
| CM-I type A: 12 | 7/12 (58.3%) ** | 57.2 ± 9.1 | 6/12 (50.0%) * | 0/12 (0%) | 5/12 (41.7%) * | 1/12 (8.3%) |
| CM-I type B: 33 | 25/33 (75.8%) | 58.2 ± 10.1 | 2/33 (6.1%) | 5/33 (15.1%) | 3/41 (7.3%) | 0/33 (0%) |
| CM-I type C: 28 | 18/28 (64.3%) ** | 48.6 ± 10.2 ** | 5/28 (17.9%) * | 1/28 (3.6%) | 9 /28 (32.1%) * | 1/28 (3.6%) |
| CM-borderline: 7 | 5/7 (71.4%) | 54.3 ± 10.4 | 0/7 (0%) | 1/7 (14.3%) | 1/7 (14.3%) | 0 /7 (0%) |
Table 5.
JOA score RR after CCF and its outcome.
Table 5.
JOA score RR after CCF and its outcome.
| Operative Procedures | Improved | Pre-Op. JOACMEQ Score | Post-Op. JOACMQ Score | JOA Score RR (%) | Bony Fusion of Joints | Stabilization of Joints |
|---|
| | Neurological Symptoms/Signs | (Mean with ± One SD) | (Mean with ± One SD) | | | |
|---|
| CCF: 30 cases | 27/30 (90.0%) | 4–15 (9.7 ± 2.48) | 10–17 (15.5 ± 2.51) | 69.7% | 21/30 (70.0%) | 25/30 (83.3%) |
| C1/2 FIX 16 cases | 15/16 (93.8%) | 4–12 (9.0 ± 2.55) * | 14–17 (15.4 ± 2.58) | 78.7% * | 12/16 (75.0%) * | 15/16 (93.8%) * |
| OCF 14 cases | 12/14 (85.7%) | 3–12 (6.4 ± 2.43) ** | 10–17 (15.7 ± 2.48) | 63.5% ** | 9/14 (64.3%) ** | 10/14 (71.4%) ** |
Table 6.
Results of analyses of CSF flow dynamics using Cine PC MRI.
Table 6.
Results of analyses of CSF flow dynamics using Cine PC MRI.
| | Controls | | CM-I Type B | CM-I Type C | CM-Borderline |
|---|
| Maximum flow velocity (cm/s) | | | | |
| 4th ventricle: | 0.68–2.45 (1.96) | Pre-Op | 0.86–1.72 (1.48) * | 0.55–1.72 (1.17) * | 0.56–1.47 (1.28) * |
| | | Post-Op | 0.43–2.68 (2.44) | 0.41–3.72 (2.18) | 0.40–3.78 (2.42) |
| | Deteriorated cases: post-op 6 months | | 0.36–0.83 (0.82) ** | 0.45–1.02 (0.85) ** | 0.56–0.97 (0.78) ** |
| Outlet of foramen of Magendie | 1.70–2.65 (2.24) | Pre-Op | 0.45–2.50 (1.32) * | 0.38–2.47 (1.42) * | 0.44–2.40 (1.44) * |
| | | Post-Op | 0.95–5.50 (3.75) | 0.84–5.70 (4.54) | 0.95 –5.50 (4.25) |
| | Deteriorated cases: post-op 6 months | | 0.45–2.50 (0.82) ** | 0.38–2.47 (0.72) ** | 0.44–2.40 (0.64) ** |
| Syrinx (spinal cord): | 1.25–4.50 (1.98) | Pre-Op | 2.75–6.78 (5.35) | 2.84–6.72 (4.35) | 2.80–7.80 (4.42) |
| | | Post-Op | N.A. | N.A. | N.A. |
| | Deteriorated cases: post-op 6 months | | 2.85–7.82 (5.35) | 243–5.53 (4.35) | 2.67–7.22 (3.25) |
| % Cardiac cycle (%) | | | | | |
| 4th ventricle | 35–48 (32) | Pre-Op | 28–50 (32) | 20–48 (31) | 23–51 (33) |
| | | Post-Op | 12–52 (35) | 9–48 (32) | 18–49 (34) |
| | Deteriorated cases: post-op 6 months | | 26–52 (34) | 22–50 (31) | 24–53 343) |
| Outlet of foramen of Magendie | 21–38 (32) | Pre-Op | 28–52 (34) | 25–50 (36) | 24–49 (35) |
| | | Post-Op | 14–52 (34) | 29–49 (30) | 28–47 (34) |
| | Deteriorated cases: post-op 6 months | | 28–52 (34) | 25–50 (36) | 24–49 (35) |
| Syrinx (spinal cord) | 25–45 (38) | Pre-Op | 27–47 (35) | 25–48 (35) | 23–49 (35) |
| | | Post-Op | N.A. | N.A. | N.A. |
| | Deteriorated cases: post-op 6 months | | 14–47 (35) | 29–49 (33) | 29–46 (35) |
| Caudal acceleration (cm/sec2) | | | | |
| 4th ventricle | 5.68–12.5 (10.2) | Pre-Op | 2.8–4.7 (3.4) * | 2.1–3.2 (2.5) * | 5.6–3.7 (2.8) * |
| | | Post-Op | 4.4–12.6 (11.3) | 5.4–14.7 (12.8) | 5.4–13.7 (10.9) |
| | Deteriorated cases: post-op 6 months | | 2.8–4.7 (3.4) * | 2.1–3.7 (2.5) * | 5.6–3.7 (2.8) * |
| Outlet of foramen of Magendie | 5.70–12.6 (11.4) | Pre-Op | 3.4 –7.5 (5.3) * | 3.8–8.7 (4.4) * | 3.3–7.2 (5.4) * |
| | | Post-Op | 5.9–14. (12.2) | 6.8–18.7 (13.5) | 5.9–7.5 (125) |
| | Deteriorated cases: post-op 6 months | | 3.3 –7.3 (5.0) * | 3.5–8.7 (4.3) * | 3.4–7.3 (5.4) * |
| Syrinx (spinal cord) | 1.25–4.50 (2.80) | Pre-Op | 1.7–4.7 (4.3) | 1.8–4.2 (4.3) | 1.0–4.8 (4.4) |
| | | Post-Op | N.A. | N.A. | N.A. |
| | Deteriorated cases: post-op 6 months | | 1.45–3.50 (2.3) | 1.28–32.40 (21.32) | 1.44–32.33 (31.48) |


