
Effect of a 3-Week Multidisciplinary Body Weight Reduction Program on the Epigenetic Age Acceleration in Obese Adults

 ,
,  , and
, and 
Abstract
:1. Introduction
2. Materials and Methods
2.1. Subjects
2.2. Body Weight Reduction Program (BWRP)
2.3. Anthropometric Measurements
2.4. Metabolic Variables
2.5. Blood Pressure
2.6. Definition of Metabolic Syndrome
2.7. Calculation of Framingham Risk Score and Vascular Age
2.8. Determination of the Epigenetic Age Acceleration
2.9. Statistical Analysis
3. Results
4. Discussion
5. Conclusions
Supplementary Materials
Author Contributions
Funding
Institutional Review Board Statement
Informed Consent Statement
Acknowledgments
Conflicts of Interest
Abbreviations
References
- Tam, B.T.; Morais, J.A.; Santosa, S. Obesity and aging: Two sides of the same coin. Obes. Rev. 2020, 21, e12991. [Google Scholar] [CrossRef] [PubMed]
- Reuser, M.; Bonneux, L.; Willekens, F. The burden of mortality of obesity at middle and old age is small. A life table analysis of the US Health and Retirement Survey. Eur. J. Epidemiol. 2008, 23, 601–607. [Google Scholar] [CrossRef]
- Fontaine, K.R.; Redden, D.T.; Wang, C.; Westfall, A.O.; Allison, D.B. Years of life lost due to obesity. JAMA 2003, 289, 187–193. [Google Scholar] [CrossRef]
- Salvestrini, V.; Sell, C.; Lorenzini, A. Obesity May Accelerate the Aging Process. Front. Endocrinol. 2019, 10, 266. [Google Scholar] [CrossRef]
- Pi-Sunyer, X. The medical risks of obesity. Postgrad. Med. 2009, 121, 21–33. [Google Scholar] [CrossRef] [PubMed]
- Horvath, S.; Raj, K. DNA methylation-based biomarkers and the epigenetic clock theory of aging. Nat. Rev. Genet. 2018, 19, 371–384. [Google Scholar] [CrossRef] [PubMed]
- Santos, A.L.; Sinha, S. Obesity and aging: Molecular mechanisms and therapeutic approaches. Aging Res. Rev. 2021, 67, 101268. [Google Scholar] [CrossRef]
- Holloszy, J.O. The biology of aging. Mayo Clin. Proc. 2000, 75 (Suppl. S3–S8), S3–S9. [Google Scholar] [CrossRef]
- Vidacek, N.Š.; Nanic, L.; Ravlic, S.; Sopta, M.; Geric, M.; Gajski, G.; Garaj-Vrhovac, V.; Rubelj, I. Telomeres, Nutrition, and Longevity: Can We Really Navigate Our Aging? J. Gerontol. A Biol. Sci. Med. Sci. 2017, 73, 39–47. [Google Scholar] [CrossRef] [Green Version]
- Rigamonti, A.E.; De Col, A.; Tamini, S.; Cicolini, S.; Caroli, D.; De Micheli, R.; Tringali, G.; Abbruzzese, L.; Marazzi, N.; Cella, S.G.; et al. Multidisciplinary Integrated Metabolic Rehabilitation in Elderly Obese Patients: Effects on Cardiovascular Risk Factors, Fatigue and Muscle Performance. Nutrients 2019, 11, 1240. [Google Scholar] [CrossRef] [Green Version]
- Rigamonti, A.E.; Tringali, G.; Micheli, R.; De Col, A.; Tamini, S.; Saezza, A.; Cella, S.G.; Sartorio, A. Impact of a Three-Week in-Hospital Multidisciplinary Body Weight Reduction Program on Body Composition, Muscle Performance and Fatigue in a Pediatric Obese Population with or without Metabolic Syndrome. Nutrients 2020, 12, 208. [Google Scholar] [CrossRef] [PubMed] [Green Version]
- Fontana, L.; Partridge, L.; Longo, V.D. Extending healthy life span—From yeast to humans. Science 2010, 328, 321–326. [Google Scholar] [CrossRef] [PubMed] [Green Version]
- Testa, G.; Biasi, F.; Poli, G.; Chiarpotto, E. Calorie restriction and dietary restriction mimetics: A strategy for improving healthy aging and longevity. Curr. Pharm. Des. 2014, 20, 2950–2977. [Google Scholar] [CrossRef] [PubMed]
- Hanjani, N.A.; Vafa, M. Protein Restriction, Epigenetic Diet, Intermittent Fasting as New Approaches for Preventing Age-associated Diseases. Int. J. Prev. Med. 2018, 9, 58. [Google Scholar] [PubMed]
- Tucker, L.A. Physical activity and telomere length in U.S. Men and women: An NHANES investigation. Prev. Med. 2017, 100, 145–151. [Google Scholar] [CrossRef]
- Gleeson, M.; Bishop, N.C.; Stensel, D.J.; Lindley, M.R.; Mastana, S.S.; Nimmo, M.A. The anti-inflammatory effects of exercise: Mechanisms and implications for the prevention and treatment of disease. Nat. Rev. Immunol. 2011, 11, 607–615. [Google Scholar] [CrossRef]
- Ji, L.L.; Dickman, J.R.; Kang, C.; Koenig, R. Exercise-induced hormesis may help healthy aging. Dose 2010, 8, 73–79. [Google Scholar] [CrossRef]
- Ghanemi, A.; Yoshioka, M.; St-Amand, J. Aging and Obesity Shared Patterns: From Molecular Pathogenesis to Epigenetics. Diseases 2021, 9, 87. [Google Scholar] [CrossRef]
- Zbieć-Piekarska, R.; Spólnicka, M.; Kupiec, T.; Parys-Proszek, A.; Makowska, Ż.; Pałeczka, A.; Kucharczyk, K.; Płoski, R.; Branicki, W. Development of a forensically useful age prediction method based on DNA methylation analysis. Forensic Sci. Int. Genet. 2015, 17, 173–179. [Google Scholar] [CrossRef]
- Bonora, E.; Targher, G.; Alberiche, M.; Bonadonna, R.C.; Saggiani, F.; Zenere, M.B.; Monauni, T.; Muggeo, M. Homeostasis model assessment closely mirrors the glucose clamp technique in the assessment of insulin sensitivity: Studies in subjects with various degrees of glucose tolerance and insulin sensitivity. Diabetes Care 2000, 23, 57–63. [Google Scholar] [CrossRef] [Green Version]
- Alberti, K.G.; Eckel, R.H.; Grundy, S.M.; Zimmet, P.Z.; Cleeman, J.I.; Donato, K.A.; Fruchart, J.C.; James, W.P.; Loria, C.M.; Smith, S.C., Jr.; et al. Harmonizing the metabolic syndrome. A joint interim statement of the International Diabetes Federation Task Force on epidemiology and prevention; National Heart, Lung, and Blood Institute; American Heart Association; World Heart Federation; International Atherosclerosis Society; and International Association for the Study of Obesity. Circulation 2009, 120, 1640–1645. [Google Scholar] [PubMed] [Green Version]
- D’Agostino, R.B., Sr.; Vasan, R.S.; Pencina, M.J.; Wolf, P.A.; Cobain, M.; Massaro, J.M.; Kannel, W.B. General cardiovascular risk profile for use in primary care: The Framingham Heart Study. Circulation 2008, 117, 743–753. [Google Scholar] [CrossRef] [PubMed] [Green Version]
- de Toro-Martín, J.; Guénard, F.; Tchernof, A.; Hould, F.S.; Lebel, S.; Julien, F.; Marceau, S.; Vohl, M. Body mass index is associated with epigenetic age acceleration in the visceral adipose tissue of subjects with severe obesity. Clin. Epigenetics 2019, 11, 172. [Google Scholar] [CrossRef] [PubMed] [Green Version]
- Quach, A.; Levine, M.E.; Tanaka, T.; Lu, A.T.; Chen, B.H.; Ferrucci, L.; Ritz, B.; Bandinelli, S.; Neuhouser, M.L.; Beasley, J.M.; et al. Epigenetic clock analysis of diet, exercise, education, and lifestyle factors. Aging 2017, 9, 419–446. [Google Scholar] [CrossRef] [PubMed] [Green Version]
- Horvath, S.; Erhart, W.; Brosch, M.; Ammerpohl, O.; von Schönfels, W.; Ahrens, M.; Heits, N.; Bell, J.T.; Tsai, P.C.; Spector, T.D.; et al. Obesity accelerates epigenetic aging of human liver. Proc. Natl. Acad. Sci. USA 2014, 111, 15538–15543. [Google Scholar] [CrossRef] [PubMed] [Green Version]
- Rönn, T.; Volkov, P.; Davegårdh, C.; Dayeh, T.; Hall, E.; Olsson, A.H.; Nilsson, E.; Tornberg, A.; Dekker Nitert, M.; Eriksson, K.F.; et al. A six months exercise intervention influences the genome-wide DNA methylation pattern in human adipose tissue. PLoS Genet. 2013, 9, e1003572. [Google Scholar] [CrossRef] [PubMed]
- Wang, T.; Tsui, B.; Kreisberg, J.F.; Robertson, N.A.; Gross, A.M.; Yu, M.K.; Carter, H.; Brown-Borg, H.M.; Adams, P.D.; Ideker, T. Epigenetic aging signatures in mice livers are slowed by dwarfism, calorie restriction and rapamycin treatment. Genome Biol. 2017, 18, 57. [Google Scholar] [CrossRef] [Green Version]
- Meir, A.Y.; Keller, M.; Bernhart, S.H.; Rinott, E.; Tsaban, G.; Zelicha, H.; Kaplan, A.; Schwarzfuchs, D.; Shelef, I.; Gepner, Y.; et al. Lifestyle weight-loss intervention may attenuate methylation aging: The CENTRAL MRI randomized controlled trial. Clin. Epigenetics 2021, 13, 48. [Google Scholar] [CrossRef]
- Fitzgerald, K.N.; Hodges, R.; Hanes, D.; Stack, E.; Cheishvili, D.; Szyf, M.; Henkel, J.; Twedt, M.W.; Giannopoulou, D.; Herdell, J.; et al. Potential reversal of epigenetic age using a diet and lifestyle intervention: A pilot randomized clinical trial. Aging 2021, 13, 9419–9432. [Google Scholar] [CrossRef]
- Spinelli, R.; Parrillo, L.; Longo, M.; Florese, P.; Desiderio, A.; Zatterale, F.; Miele, C.; Raciti, G.A.; Beguinot, F. Molecular basis of aging in chronic metabolic diseases. J. Endocrinol. Investig. 2020, 43, 1373–1389. [Google Scholar] [CrossRef]
- Chen, B.H.; Marioni, R.E.; Colicino, E.; Peters, M.J.; Ward-Caviness, C.K.; Tsai, P.C.; Roetker, N.S.; Just, A.C.; Demerath, E.W.; Guan, W.; et al. DNA methylation-based measures of biological age: Meta-analysis predicting time to death. Aging 2016, 8, 1844–1865. [Google Scholar] [CrossRef] [PubMed] [Green Version]
- Christiansen, L.; Lenart, A.; Tan, Q.; Vaupel, J.W.; Aviv, A.; McGue, M.; Christensen, K. DNA methylation age is associated with mortality in a longitudinal Danish twin study. Aging Cell. 2016, 15, 149–154. [Google Scholar] [CrossRef] [PubMed]
- Sartorio, A.; Lafortuna, C.L.; Vangeli, V.; Tavani, A.; Bosetti, C.; La Vecchia, C. Short-term changes of cardiovascular risk factors after a non-pharmacological body weight reduction program. Eur. J. Clin. Nutr. 2001, 55, 865–869. [Google Scholar] [CrossRef] [PubMed] [Green Version]
- Rigamonti, A.E.; Cicolini, S.; Caroli, D.; De Col, A.; Scacchi, M.; Cella, S.G.; Sartorio, A. Effects of a 3-Week In-Hospital Body Weight Reduction Program on Cardiovascular Risk Factors, Muscle Performance, and Fatigue: A Retrospective Study in a Population of Obese Adults with or without Metabolic Syndrome. Nutrients 2020, 12, 1495. [Google Scholar] [CrossRef]
- Ammous, F.; Zhao, W.; Ratliff, S.M.; Mosley, T.H.; Bielak, L.F.; Zhou, X.; Peyser, P.A.; Kardia, S.L.R.; Smith, J.A. Epigenetic age acceleration is associated with cardiometabolic risk factors and clinical cardiovascular disease risk scores in African Americans. Clin. Epigenetics 2021, 13, 55. [Google Scholar] [CrossRef]
- Agha, G.; Mendelson, M.M.; Ward-Caviness, C.K.; Joehanes, R.; Huan, T.; Gondalia, R.; Salfati, E.; Brody, J.A.; Fiorito, G.; Bressler, J.; et al. Blood Leukocyte DNA Methylation Predicts Risk of Future Myocardial Infarction and Coronary Heart Disease. Circulation 2019, 140, 645–657. [Google Scholar] [CrossRef]
- Chilunga, F.P.; Henneman, P.; Venema, A.; Meeks, K.A.C.; Requena-Méndez, A.; Beune, E.; Mockenhaupt, F.P.; Smeeth, L.; Bahendeka, S.; Danquah, I.; et al. Genome-wide DNA methylation analysis on C-reactive protein among Ghanaians suggests molecular links to the emerging risk of cardiovascular diseases. NPJ Genom. Med. 2021, 6, 46. [Google Scholar] [CrossRef]
- Arpón, A.; Milagro, F.I.; Santos, J.L.; García-Granero, M.; Riezu-Boj, J.I.; Martínez, J.A. Interaction Among Sex, Aging, and Epigenetic Processes Concerning Visceral Fat, Insulin Resistance, and Dyslipidaemia. Front. Endocrinol. 2019, 10, 496. [Google Scholar] [CrossRef] [Green Version]
- Stevenson, A.J.; McCartney, D.L.; Harris, S.E.; Taylor, A.M.; Redmond, P.; Starr, J.M.; Zhang, Q.; McRae, A.F.; Wray, N.R.; Spires-Jones, T.L.; et al. Trajectories of inflammatory biomarkers over the eighth decade and their associations with immune cell profiles and epigenetic aging. Clin. Epigenetics 2018, 10, 159. [Google Scholar] [CrossRef] [Green Version]
- Verschoor, C.P.; McEwen, L.M.; Kobor, M.S.; Loeb, M.B.; Bowdish, D.M.E. DNA methylation patterns are related to co-morbidity status and circulating C-reactive protein levels in the nursing home elderly. Exp. Gerontol. 2018, 105, 47–52. [Google Scholar] [CrossRef]
- Ligthart, S.; Marzi, C.; Aslibekyan, S.; Mendelson, M.M.; Conneely, K.N.; Tanaka, T.; Colicino, E.; Waite, L.L.; Joehanes, R.; Guan, W.; et al. DNA methylation signatures of chronic low-grade inflammation are associated with complex diseases. Genome Biol. 2016, 17, 255. [Google Scholar] [CrossRef] [PubMed] [Green Version]
- Sun, Y.V.; Lazarus, A.; Smith, J.A.; Chuang, Y.H.; Zhao, W.; Turner, S.T.; Kardia, S.L. Gene-specific DNA methylation association with serum levels of C-reactive protein in African Americans. PLoS ONE 2013, 8, e73480. [Google Scholar] [CrossRef] [PubMed] [Green Version]
- Snel, M.; van Diepen, J.A.; Stijnen, T.; Pijl, H.; Romijn, J.A.; Meinders, A.E.; Voshol, P.; Jazet, I.M. Immediate and long-term effects of addition of exercise to a 16-week very low calorie diet on low-grade inflammation in obese, insulin-dependent type 2 diabetic patients. Food Chem. Toxicol. 2011, 49, 3104–3111. [Google Scholar] [CrossRef] [PubMed]


| Characteristics | Pre | Post | p-Value |
|---|---|---|---|
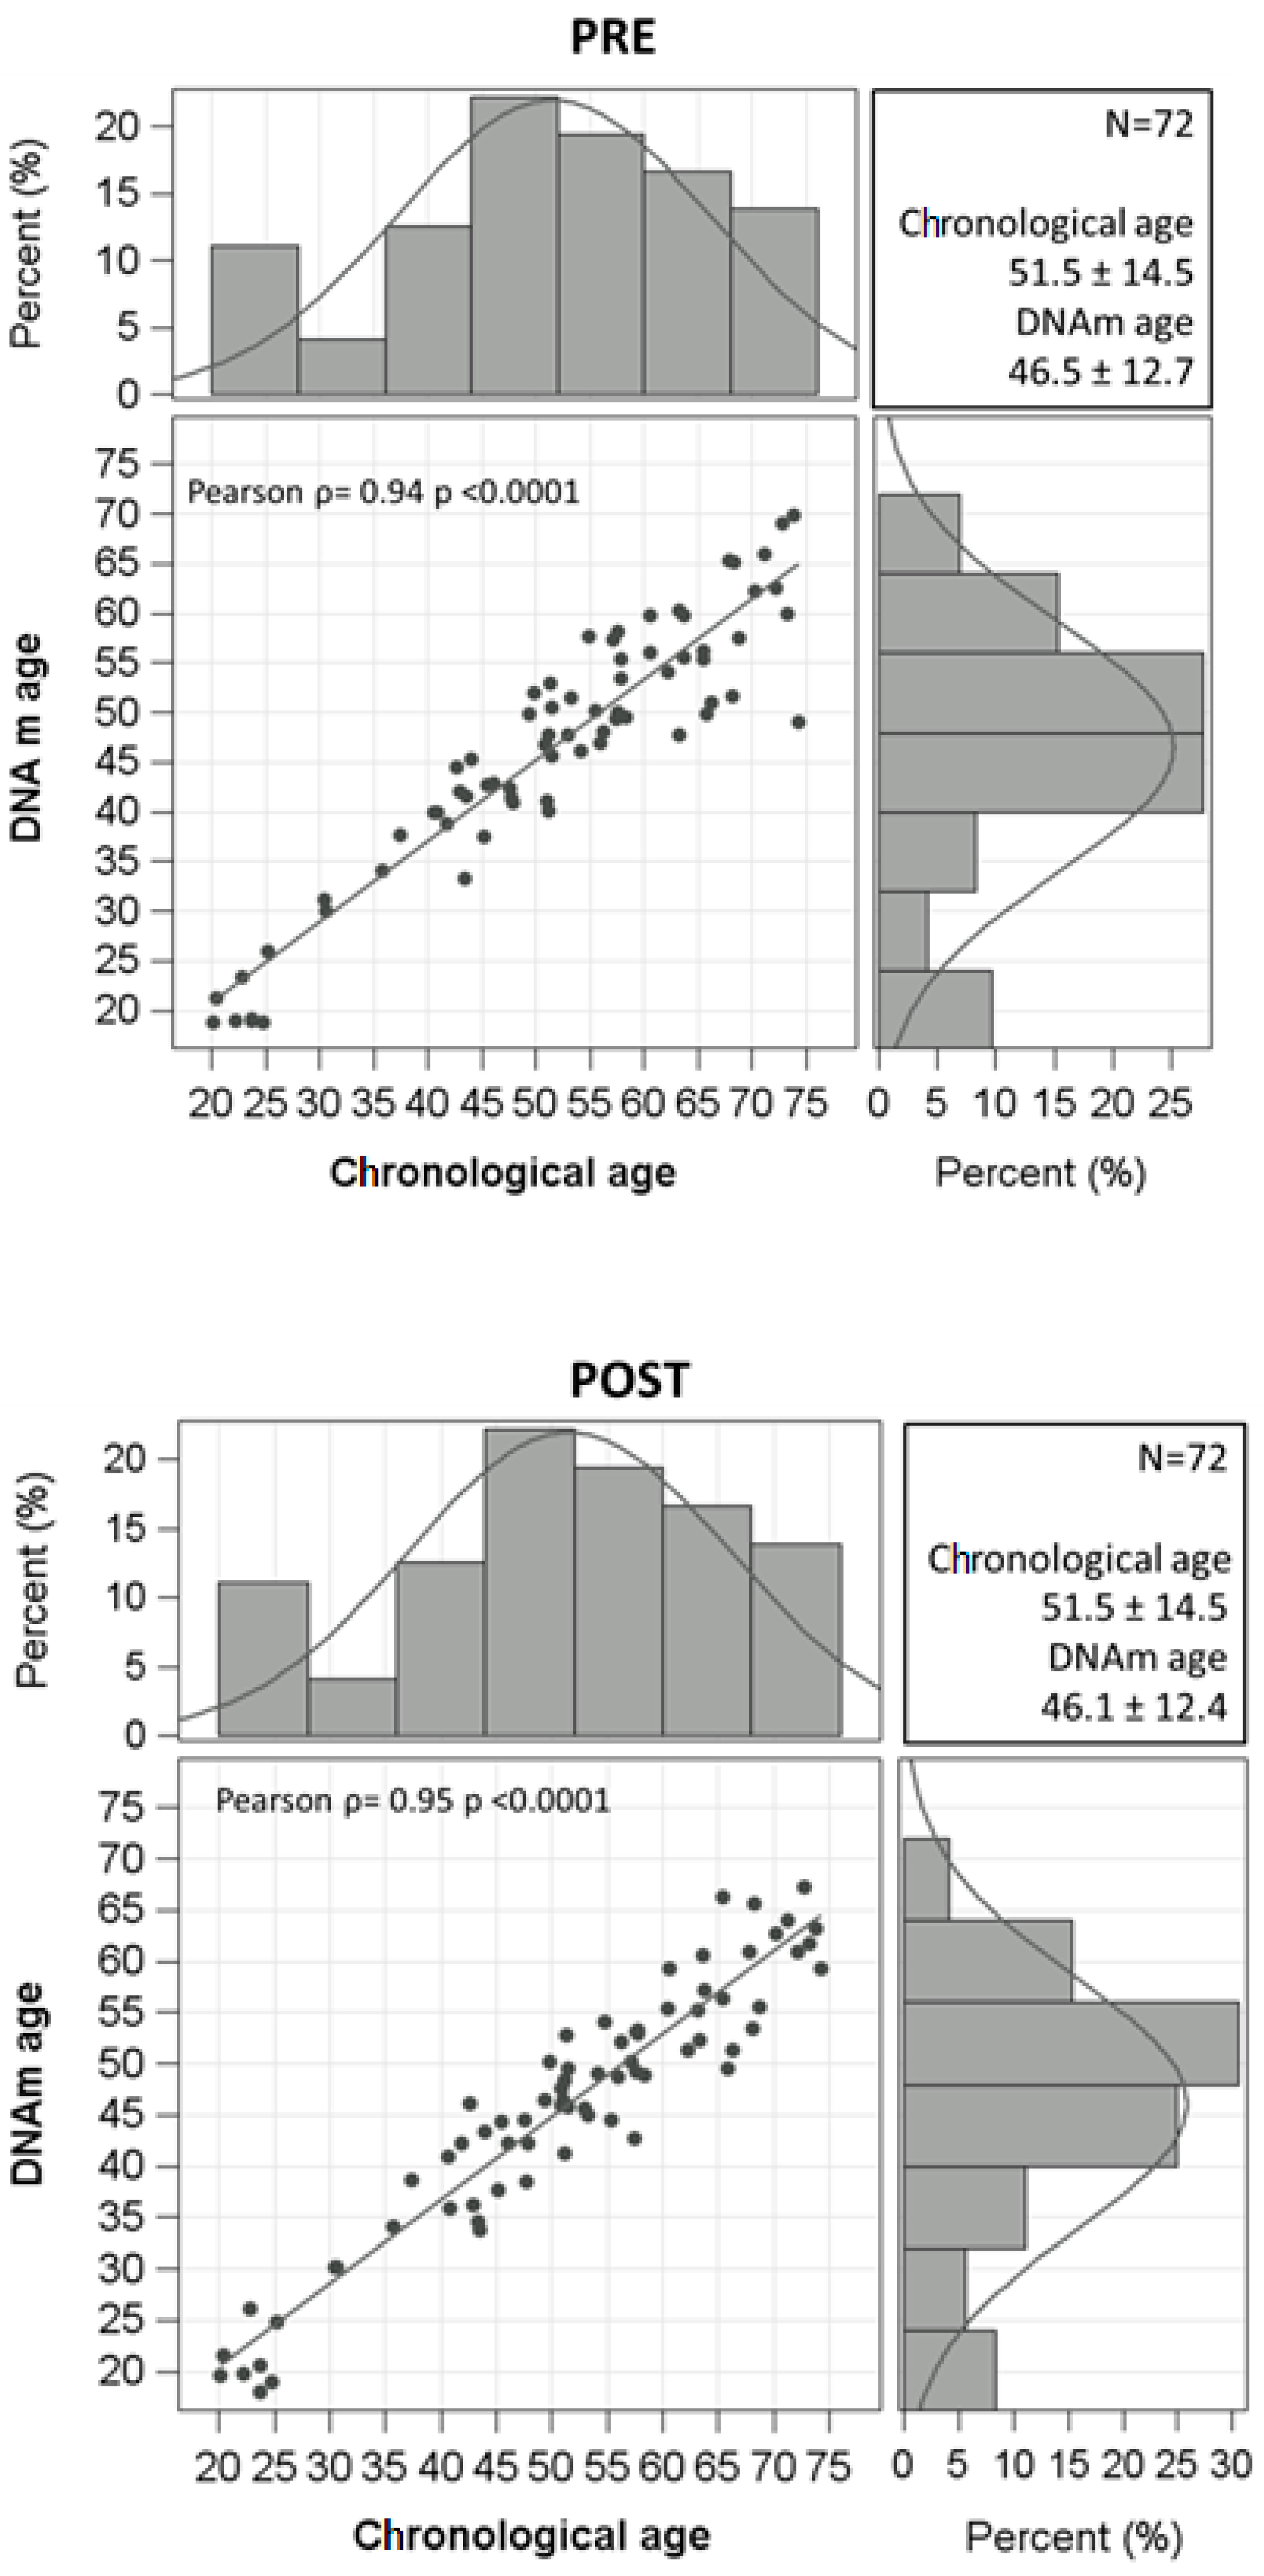
| Age, yrs | 51.5 ± 14.5 | - | |
| DNAm age, yrs | 46.5 ± 12.7 | 46.1 ± 12.4 | 0.2809 |
| Age acceleration, years | 0.79 (−2.12–3.78) | 0.36 (−2.92–2.10) | 0.3078 |
| Gender | |||
| Males | 29 (40.28%) | - | |
| Females | 43 (59.7%) | ||
| Smoking status | |||
| Never smoker | 37 (51.4%) | - | |
| Former smoker | 18 (25.0%) | ||
| Current smoker | 17 (23.6%) | ||
| Alcohol consumption | |||
| Yes | 8 (11.1%) | - | |
| No | 58 (80.6%) | ||
| Occasionally | 6 (8.3%) | ||
| Education | |||
| Primary school or less | 7 (9.7%) | - | |
| Secondary school | 28 (38.9%) | ||
| High school | 29 (40.3%) | ||
| University | 8 (11.1%) | ||
| Occupation | |||
| Employed | 36 (50.0%) | - | |
| Unemployed | 14 (19.4%) | ||
| Retired | 14 (19.4%) | ||
| Housewife | 5 (6.9%) | ||
| Student | 3 (4.2%) | ||
| Physical activity levels | |||
| Sedentary | 58 (80.6%) | - | |
| Active | 13 (18.1%) | ||
| Sporty | 1 (1.4%) | ||
| BMI, kg/m2 | 46.5 ± 6.3 | 45 ± 5.9 | <0.0001 |
| Weight, kg | 117.2 (107.7–137.9) | 114 (103.8–133.5) | <0.0001 |
| Height, m | 1.64 ± 0.1 | - | |
| WC, cm | 125.9 ± 13.4 | 121.2 ± 12.1 | <0.0001 |
| FFM kg | 53.2 (47.9–67.5) | 52.3 (48.7–66.3) | 0.0137 |
| FFM % | 46.5 ± 5.8 | 47.8 ± 7.0 | 0.0165 |
| FM kg | 67.1 ± 15.8 | 63.6 ± 15.4 | <0.0001 |
| FM % | 53.5 ± 5.8 | 52.9 ± 6.4 | 0.3675 |
| Heart rate, bpm | 80.0 ± 11.7 | 76.5 ± 9.2 | 0.0171 |
| Systolic blood pressure, mmHg | 136.3 ± 13.0 | 129.4 ± 11.3 | 0.0001 |
| Diastolic blood pressure, mmHg | 84.9 ± 9.7 | 79.2 ± 7.4 | 0.0001 |
| Anti-hypertensive drugs | |||
| Yes | 37 (51.4%) | 35 (48.6%) | 1 |
| No | 35 (48.6%) | 37 (51.4%) | |
| Glucose, mmol/L | 5.6 (5.2–6.0) | 5.3 (4.9–5.5) | <0.0001 |
| Insulin, mIU/L | 20.5 (13.5–30.6) | 19.4 (14.3–24.6) | <0.0001 |
| HOMA-IR | 6.6 ± 4.2 | 5.0 ± 2.5 | 0.0023 |
| HbA1c, % | 5.7 (5.5–5.9) | 5.6 (5.4–5.8) | <0.0001 |
| Diabetes | |||
| Yes | 11 (15.3%) | 10 (13.9%) | <0.0001 |
| No | 61 (84.7%) | 62 (86.1%) | |
| Anti-diabetic medications | |||
| Yes | 12 (16.7%) | 13 (18.1%) | <0.0001 |
| No | 60 (83.3%) | 59 (81.9%) | |
| Metabolic syndrome | |||
| Yes | 44 (61.1%) | 39 (54.2%) | 0.2100 |
| No | 28 (38.9%) | 33 (45.8%) | |
| Total cholesterol, mg/dL | 193.7 ± 36.1 | 170.4 ± 37.0 | <0.0001 |
| HDL-C, mg/dL | 49.4 ± 11.4 | 44.7 ± 10.6 | <0.0001 |
| LDL-C, mg/dL | 126.4 ± 34.0 | 107.3 ± 32.5 | <0.0001 |
| Triglyceride, mg/dL | 145.5 ± 53.7 | 131.9 ± 44.3 | 0.0063 |
| Lipid-lowering drugs | |||
| Yes | 9 (12.5%) | 12 (16.7%) | <0.0001 |
| No | 63 (87.5%) | 60 (83.3%) | |
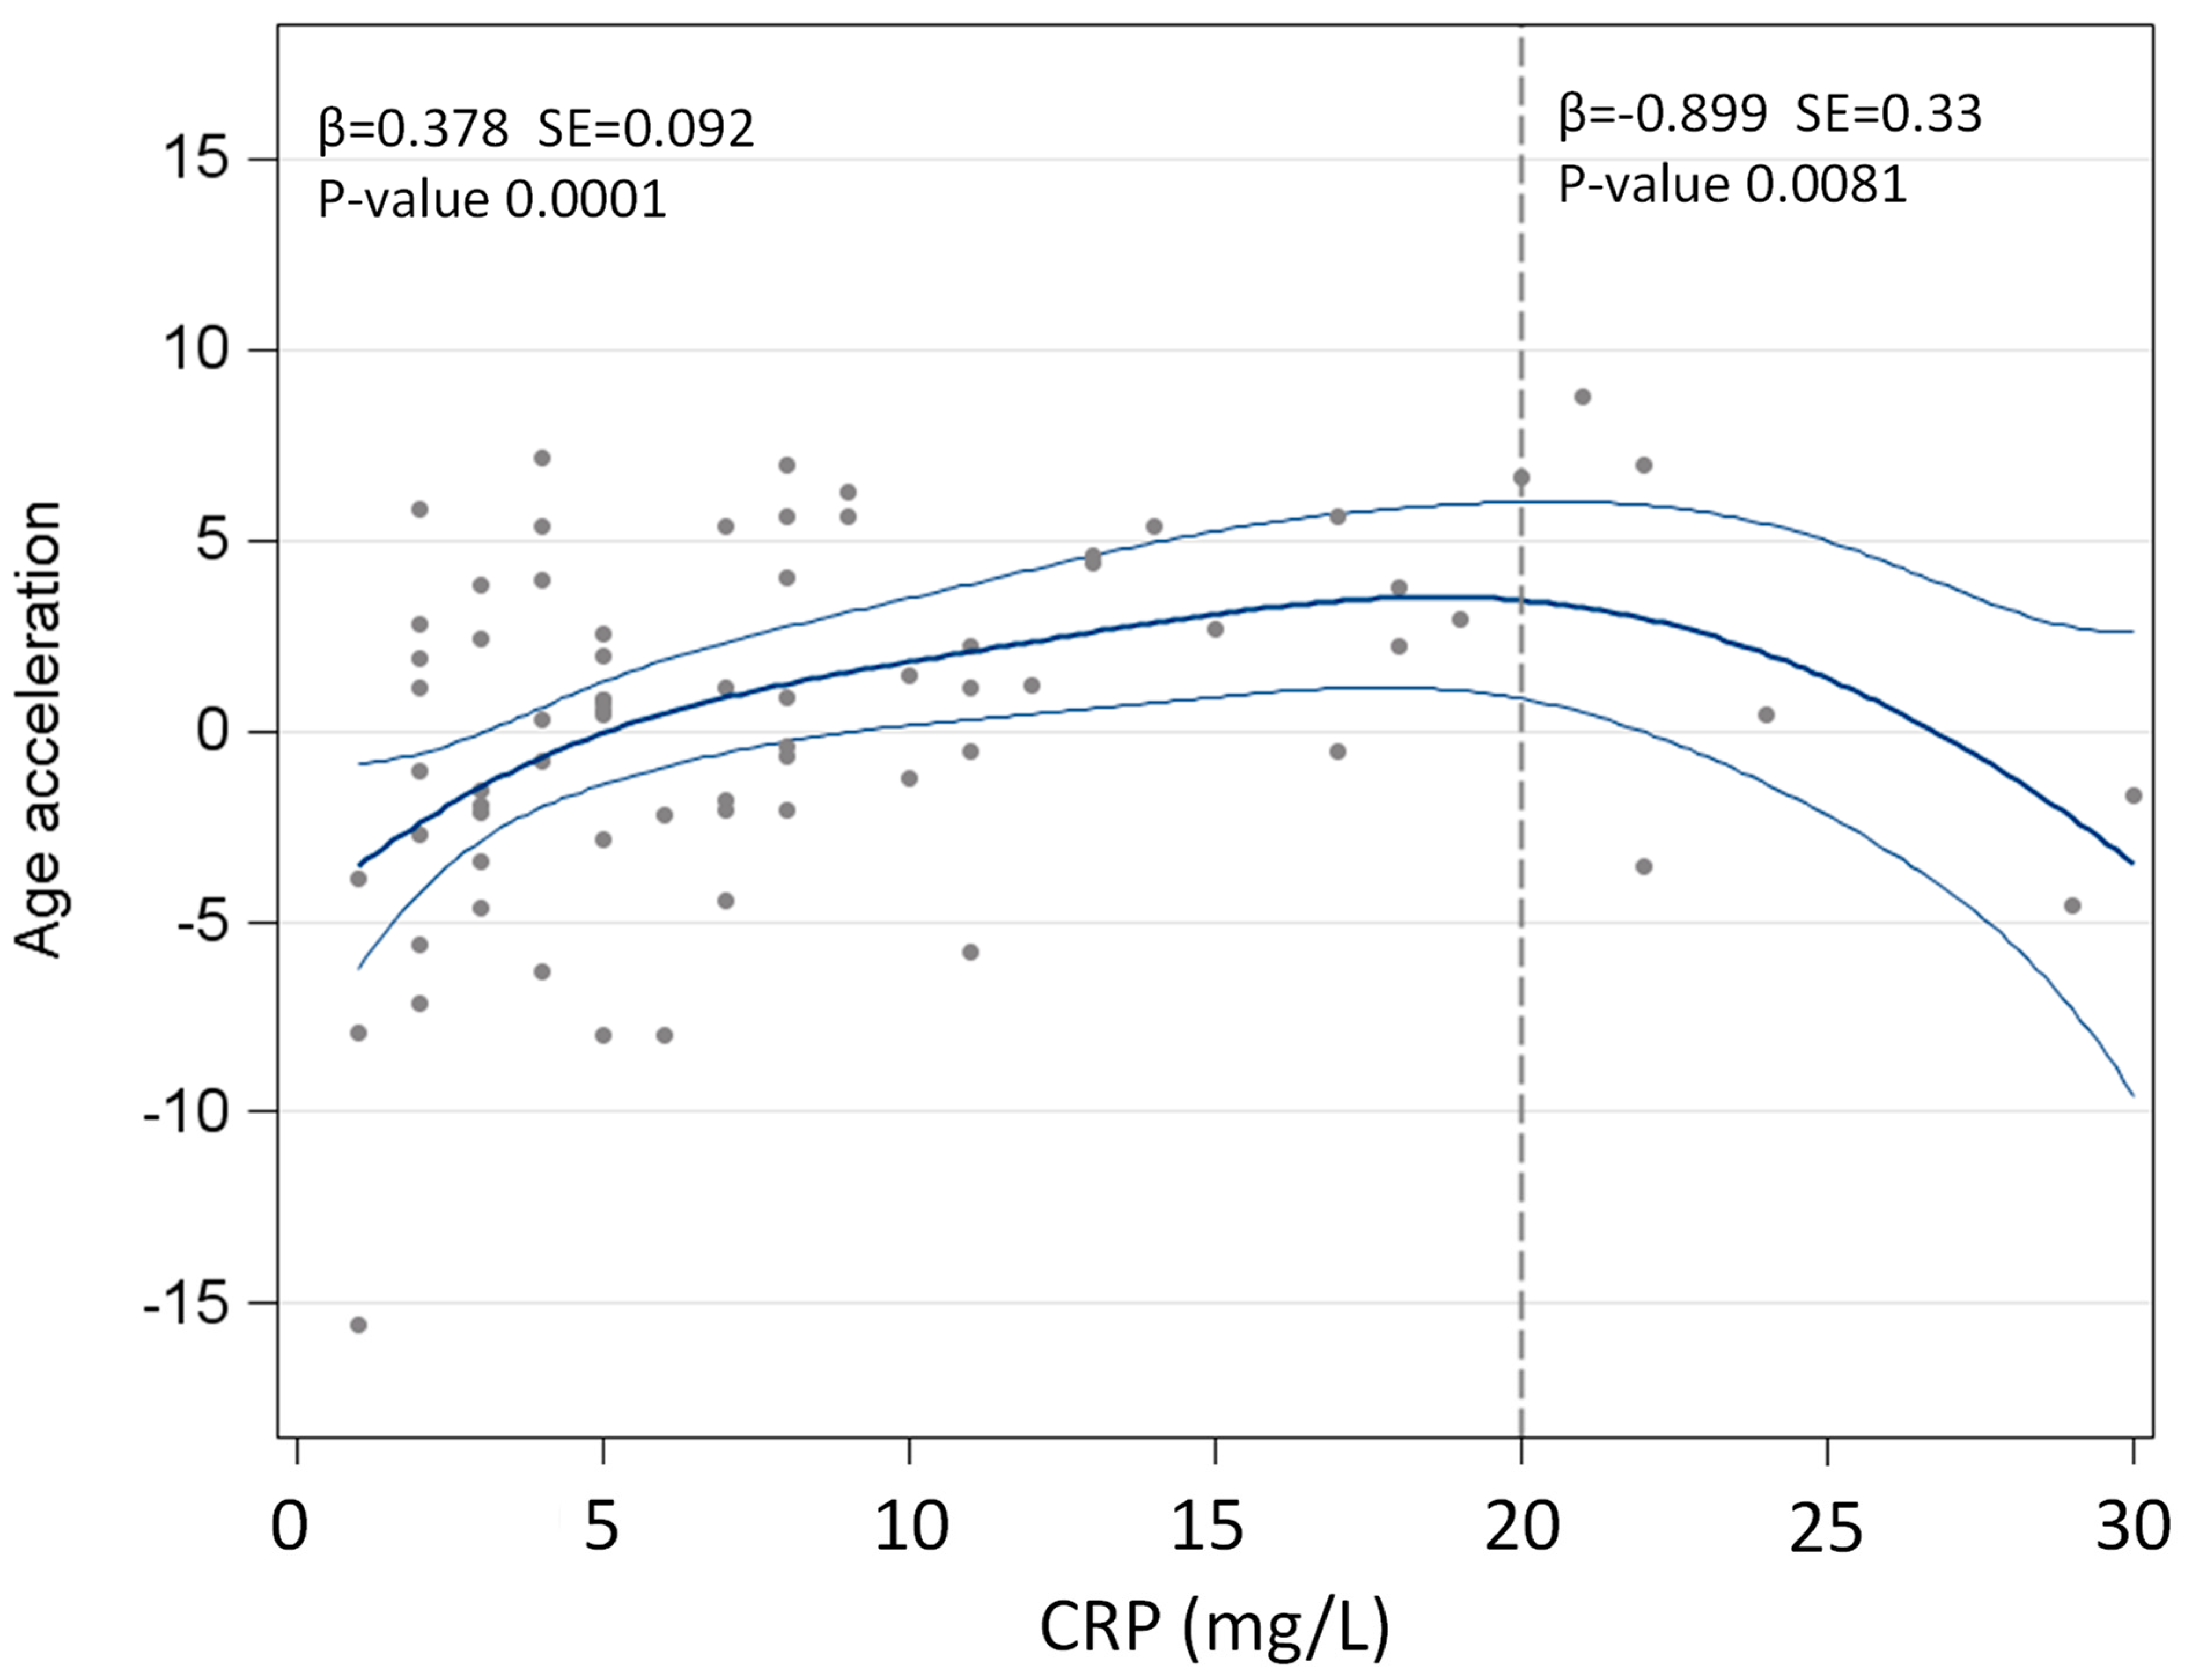
| CRP *, mg/L | 7 (4–11) | 4 (2–8.5) | <0.0001 |
| Neutrophils, % | 59 ± 7.5 | 51.1 ± 7.7 | <0.0001 |
| Lymphocytes, % | 30.1 ± 6.9 | 36.1 ± 7.8 | <0.0001 |
| Monocytes, % | 7.8 ± 1.8 | 9.4 ± 2.5 | <0.0001 |
| Eosinophils, % | 2.2 (1.5–3.2) | 2.4 (1.5–3.5) | 0.0027 |
| Basophils, % | 0.55 (0.4–0.7) | 0.6 (0.4–0.8) | 0.0090 |
| Platelets, ×105/mm3 | 259.1 ± 55.5 | 238.3 ± 54.8 | <0.0001 |
| NLR | 2.11 ± 0.70 | 1.53 ± 0.58 | <0.0001 |
| PLR | 125.4 ± 41.4 | 115.3 ± 44.0 | 0.0150 |
| AST, U/L | 21 (18–28) | - | |
| ALT, U/L | 22 (16.5–36) | 28.5 (20–50.5) | <0.0001 |
| Gamma GT, U/L | 25.5 (19.5–36) | 23 (16–30.5) | <0.0001 |
| Creatinine, mg/dL | 0.80 ± 0.16 | - | |
| VA, yrs | 41.37 ± 14.81 | 38.48 ± 14.80 | <0.0001 |
| FSR, % | 13.88 ± 11.88 | 11.76 ± 10.62 | <0.0001 |
Publisher’s Note: MDPI stays neutral with regard to jurisdictional claims in published maps and institutional affiliations. |
© 2022 by the authors. Licensee MDPI, Basel, Switzerland. This article is an open access article distributed under the terms and conditions of the Creative Commons Attribution (CC BY) license (https://creativecommons.org/licenses/by/4.0/).
Share and Cite
Rigamonti, A.E.; Bollati, V.; Favero, C.; Albetti, B.; Caroli, D.; Abbruzzese, L.; Cella, S.G.; Sartorio, A. Effect of a 3-Week Multidisciplinary Body Weight Reduction Program on the Epigenetic Age Acceleration in Obese Adults. J. Clin. Med. 2022, 11, 4677. https://doi.org/10.3390/jcm11164677
Rigamonti AE, Bollati V, Favero C, Albetti B, Caroli D, Abbruzzese L, Cella SG, Sartorio A. Effect of a 3-Week Multidisciplinary Body Weight Reduction Program on the Epigenetic Age Acceleration in Obese Adults. Journal of Clinical Medicine. 2022; 11(16):4677. https://doi.org/10.3390/jcm11164677
Chicago/Turabian StyleRigamonti, Antonello E., Valentina Bollati, Chiara Favero, Benedetta Albetti, Diana Caroli, Laura Abbruzzese, Silvano G. Cella, and Alessandro Sartorio. 2022. "Effect of a 3-Week Multidisciplinary Body Weight Reduction Program on the Epigenetic Age Acceleration in Obese Adults" Journal of Clinical Medicine 11, no. 16: 4677. https://doi.org/10.3390/jcm11164677
APA StyleRigamonti, A. E., Bollati, V., Favero, C., Albetti, B., Caroli, D., Abbruzzese, L., Cella, S. G., & Sartorio, A. (2022). Effect of a 3-Week Multidisciplinary Body Weight Reduction Program on the Epigenetic Age Acceleration in Obese Adults. Journal of Clinical Medicine, 11(16), 4677. https://doi.org/10.3390/jcm11164677