Article

The Downregulation of Both Giant HERCs, HERC1 and HERC2, Is an Unambiguous Feature of Chronic Myeloid Leukemia, and HERC1 Levels Are Associated with Leukemic Cell Differentiation

1
Department of Clinical and Biological Science, Medical School, University of Torino, 10043 Orbassano, Italy
2
Department of Oncology, Medical School, University of Torino, 10043 Orbassano, Italy
*
Authors to whom correspondence should be addressed.
These authors contributed equally to this work.
J. Clin. Med. 2022, 11(2), 324; https://doi.org/10.3390/jcm11020324
Submission received: 3 December 2021 / Revised: 5 January 2022 / Accepted: 6 January 2022 / Published: 10 January 2022
(This article belongs to the Section Hematology)

Abstract

:
Large HERC E3 ubiquitin ligase family members, HERC1 and HERC2, are staggeringly complex proteins that can intervene in a wide range of biological processes, such as cell proliferation, DNA repair, neurodevelopment, and inflammation. Therefore, mutations or dysregulation of large HERCs is associated with neurological disorders, DNA repair defects, and cancer. Though their role in solid tumors started to be investigated some years ago, our knowledge about HERCs in non-solid neoplasm is greatly lagging behind. Chronic Myeloid Leukemia (CML) is a model onco-hematological disorder because of its unique and unambiguous relation between genotype and phenotype due to a single genetic alteration. In the present study, we ascertained that the presence of the BCR-ABL fusion gene was inversely associated with the expression of the HERC1 and HERC2 genes. Upon the achievement of remission, both HERC1 and HERC2 mRNAs raised again to levels comparable to those of the healthy donors. Additionally, our survey unveiled that their gene expression is sensitive to different Tyrosine Kinases Inhibitors (TKIs) in a time-dependent fashion. Interestingly, for the first time, we also observed a differential HERC1 expression when the leukemic cell lines were induced to differentiate towards different lineages revealing that HERC1 protein expression is associated with the differentiation process in a lineage-specific manner. Taken together, our findings suggest that HERC1 might act as a novel potential player in blood cell differentiation. Overall, we believe that our results are beneficial to initiate exploring the role/s of large HERCs in non-solid neoplasms.

1. Introduction

To some extent, Chronic Myeloid Leukemia (CML) can be considered a model disease not only in the onco-hematology field but more broadly in oncology. It is a clonal myeloproliferative disorder characterized by a single genetic alteration affecting the hematopoietic stem cells. Indeed, the balanced reciprocal translocation t(9;22) (q34;q11) gives rise to a constitutively active tyrosine kinase oncoprotein, BCR-ABL, that is the causative and functional lesion of CML. Thus, in CML, there is an unambiguous relation between genotype and phenotype [1]. Ultimately, BCR-ABL would lead to a progressive block of differentiation and increased genetic instability [2].
The CML can be effectively treated by selectively targeting BCR-ABL with small molecules tyrosine kinase inhibitors (TKIs), which by inhibiting the kinase activity, drive the cells towards apoptosis. The first tyrosine kinase inhibitor (TKI) developed and successfully used in the clinic was Imatinib [3,4]. Though most CML patients responded very well to Imatinib therapy, a minority relapsed [5]. This is due to several reasons ranging from acquired BCR-ABL tyrosine kinase point mutations to overexpression of multidrug resistance gene (MDR1) [6] or, alternatively, to the overexpression of Src kinases family members [7,8,9,10]. To overcome these hindrances, novel TKIs have been developed and introduced in the clinic, including Nilotinib and dual-specificity second-generation Src and BCR-ABL kinase inhibitors, such as Bosutinib, Dasatinib, and the more potent Ponatinib [11]. They show faster responses, lower rates of short-term disease progression, and deeper overall molecular response rates [5]. Due to its broader tyrosine kinase spectrum, Dasatinib has been proven to successfully inhibit the key signaling players involved in the pathogenesis of CML development. When compared to Imatinib, Dasatinib displays hematologic and non-hematologic associated toxicity effects that partially limit its usage [10]. Hence, alternative ways to identify new therapeutic targets/strategies are still required to drive deeper molecular responses, enabling more patients to attempt TKI discontinuation.
The E3 ubiquitin ligases regulate several biological processes through timely ubiquitination and degradation of many cellular proteins responsible for receptor endocytosis, intracellular trafficking, signal transduction, DNA damage recognition and repair, differentiation, and apoptosis [12,13,14]. Consistently, the malfunctioning of E3 ligases leads to the development of numerous human diseases [15], such as central nervous system disorders, inflammation, metabolic dysfunctions, and cancers [16,17], including hematologic malignancies [18]. Several ubiquitin ligases are mutated, overexpressed, or deleted in hematologic malignancies contributing to the pathogenesis of the diseases through accumulation, or excessive degradation, of their substrates which perform critical functions that regulate hematopoietic cell growth and differentiation [15,18,19]. Recently, it has been reported by our group that the HERC1 gene expression dysregulation and some myeloid-related disorders and the physical interaction between BCR-ABL1 and HERC1 [20]. HERC1, together with HERC2, are giant E3 ubiquitin ligases with a molecular weight exceeding 500 kDa. Both have a catalytic HECT domain at their carboxyl terminus that contains a conserved cysteine residue essential for the catalytic activity [15,17].
However, currently, specific inquiries aiming to assess the potential role of the giant HERCs in myeloid-related neoplasia have been minimal. Thanks to the efforts made by the Human Protein Atlas Project (proteinatlas.org), it has emerged that the differential gene expression of HERCs E3 ligase members might act as prognostic factors in a few solid tumors.
In the current study, we investigated the HERC1 and HERC2 gene expression in two different cohorts of CML patients during the elapsed time between diagnosis and one year of TKIs (Imatinib and Dasatinib) treatment. Additionally, for the first time, the HERC1 gene and protein expression level changes were assessed when leukemic cell lines were induced to differentiate. These findings shed light on the large E3 ubiquitin ligase HERC1 as a novel potential and emerging player in blood cell differentiation.

2. Materials and Methods

2.1. Patient Samples and Cell Lines Culture

A total of 78 chronic myeloid leukemia were included in this study. Out of 78, 30 specimens (PB = 15 and BM = 15) were exclusively collected at diagnosis and 19 at remission for initial HERC2 gene expression analysis. Furthermore, specimens were obtained, at different time points (0, 3, 6, and 12 months after the starting TKIs treatment), from 29 CML patients treated either with Imatinib (n = 15) or with Dasatinib (n = 14). We also included 16 healthy volunteers. All the samples were collected and processed in the Laboratory of Molecular Medicine and Oncology, Department of Clinical and Biological Sciences of the Hospital San Luigi Gonzaga Orbassano (TO), after written informed consent (local ethic committee S. Luigi Gonzaga Hospital 201/2014). The K562, HEL cell lines were cultured with RPMI-1640 and supplemented with heat-inactivated 10% fetal bovine serum for all cell lines (20% FBS for primary CML cells), 500 U/mL penicillin, and 0.5 mg/mL streptomycin. Cells were cultured at 37 °C in a humidified atmosphere flushed with 5% CO2.

2.2. Quantitative Real-Time PCR

Mononuclear cells from healthy volunteers and CML samples at each stage were separated on a Ficoll–Hypaque density gradient. Total RNA was extracted in TRIzol Reagent solution (Ambion, Waltham, MA USA), reverse transcribed, and then transcript quantification analysis was performed as described elsewhere [21]. For HERC1, HERC2, and the GUSB genes mRNA quantification, specific assays (assay IDs for Hs01032486_m1 for HERC1, Hs01117656_m1 for HERC2 and GUSB Hs00939627_m1, and -Applied Biosystems, Thermo Fisher Scientific, Massachusetts, MA, USA) were used. The large HERCs Ct values obtained by RT-qPCR were normalized with respect to the Ct counterparts of GUSB and expressed as 2−∆∆Ct. A universal human references RNA (Stratagene, San Diego, CA, USA) was used to calibrate the assay.

2.3. CD34+, CD3+ and CD19+ Cells Separation

The isolation of CD34+, CD3+, and CD19+ cell fraction was achieved through the direct CD34 Progenitor, CD3, and CD19 Cell Isolation Kit (Miltenyi Biotec Inc., Auburn, CA, USA), following the manufacturer’s instructions. Briefly, 108 cells were resuspended in 300 μL of ACD-Buffer (0.5% of bovine serum albumin (BSA) and 2 mM EDTA in PBS pH 7.2) and incubated with 100 μL of FcR Blocking Reagent and 100 μL of positive CD34 MicroBeads for 30 min at 4 °C. Magnetic separations of CD34+ fraction were performed by using the MACS separator with the appropriate MACS (MS) Column after its rehydration with an appropriate volume of ACD-buffer. Subsequently, the cell suspension was deposited on the column, filtered, and washed 3 times with ACD-buffer washes. Flow-through, containing unlabeled CD34 negative (CD34) cells, were also collected. Positively labeled cells (CD34+), which remain magnetically linked to the column, were flushed out by firmly pushing the plunger into the column with an appropriate amount of buffer in a collection tube. The CD34+ cells were confirmed through FACS analysis. Similarly, the isolation of CD3+ and CD19+ cell fraction was achieved by resuspending MNC cells (108) in 100 μL of ACD buffer and incubated for 15 min at 4 °C with 40 μL of CD3 or CD19 Microbeads. The subsequent magnetic separation was performed following the same protocol used to elute the bound CD34+ cells.

2.4. Western Blot Analysis

Protein concentration was determined using the Bio-Rad DC Protein Assay (Bio-Rad). 100 µg of total protein were loaded and run onto 4–14% precast gradient gel (Criterion TM TGX Stain-Free TM) electrophoresis and transferred to PVDF (Bio-Rad, Hercules, California, CA, USA) membranes by using the protocol described elsewhere [22]. Blots were blocked in TBS (Tris-HCl pH7.6, 150 mM NaCl) plus 5% nonfat milk for 1 h at room temperature (RT) and then decorated with appropriate antibodies (HERC1 A301-904A, Bethyl Laboratories, Inc., Montgomery, TX, USA, Tubulin sc-23948, and p44/42 MAPK (ERK1/2) #4696s, phospho-p44/42 MAPK (T202/Y204) #4377s; Vinculin MA5-11690, Sigma-Aldrich; BCR Cell Signaling Tech, phospho-Tyr, sc-7020, Santa Cruz Biotechnology, Dallas, TX, USA; in PBS-Tween 0.5% overnight at 4 °C. Membranes were then washed with PBS-Tween 0.5% 3 times for 15 min each, incubated with appropriate peroxidase-linked secondary antibody (Santa Cruz Biotechnology) for 1 h at RT, and washed again in PBS-Tween 0.5%. Specific binding was detected using an enhanced chemiluminescence system (Clarity Western ECLSubstrate #170-5061, Bio-Rad, Hercules, CA, USA).

2.5. Induction of Differentiation and Flow Cytometry

To induce differentiation, exponentially grown K-562 and HEL cells (5 × 10⁵ cells/mL) were seeded in 10 mL of respective growth medium and exposed to K-562 with 250 nM PMA and 20 U of erythropoietin (EPO; Pfizer, Europe MA EEIG 1050 Bruxelles) separately and HEL with 250 nM PMA for 48 h [23,24]. Morphological changes of cells were observed using a phase-contrast microscope. Following treatment, cells were collected by centrifugation (500× g for 3 min), and each group was then washed in FACS buffer (PBS, 1 mM EDTA, 2% FBS, 0.1% sodium azide) and then resuspended in 500 μL blocking buffer (equal volumes of FACS buffer and FBS) for 10 min at room temperature. The cells were again washed with FACS buffer 2 times and incubated for 20–30 min in the dark with fluorescently conjugated antibodies PE Mouse Anti-Human CD61 (VI-PL2, BioLegend, San Diego, CA, USA). Subsequently, cells were washed twice with 1X PBS, resuspended in FACS buffer, and analyzed using a fluorescence-activated cell sorter (FACS) BD flow cytometer to detect the percentages of differentiated cells. Results were analyzed on FlowJo® software version 10.5.3 (FlowJo, LLC, Ashland, OR, USA).

2.6. Immunofluorescence

Cytospins were prepared using primary cells from CML patients, K562 (before and after treatment), and healthy donor cells. Immunofluorescence was performed as described [25]. Slides were analyzed by fluorescence confocal microscopy (LSM5110; Carl Zeiss MicroImaging, Inc., Jena, Germany); the images were captured using the 63X objective. The intensity of the signal from approximately 80 cells from each condition was evaluated through the use of ImageJ software. For each sample, repeated in triplicate, 3 independent measurements were performed, and each measurement was normalized on background noise. The mean intensity ± standard deviation δ (ds), expressed as fluorescence intensity/number of pixels was calculated and plotted using the program GraphPad Prism (GraphPad Software, San Diego, CA, USA).

2.7. Benzidine Staining

Erythroid differentiation was evaluated by counting blue benzidine-positive cells (hemoglobin expressing cells) by benzidine staining described elsewhere [26]. Briefly, the EPO treated K-562 cells were suspended in a benzidine staining solution containing 0.2% benzidine (Sigma-Aldrich #B3503-5G) in 10% H2O2 (Sigma-Aldrich, Tokyo, Japan) and 0.5 M glacial acetic acid (Sigma-Aldrich). Following 2 min of staining, the differentiated cells were stained blue, and images were captured by phase-contrast microscopy. The percentage of benzidine-positive cells was the number of blue cells divided by the total number of cells.

2.8. Statistical and Correlation Analysis

The large HERC1 and HERC2 gene expression values were first tested for normality by the Shapiro–Wilk test. Afterward, the values obtained at different time points from diagnosis to remission (3, 6, and 12 months) were analyzed and compared with non-parametric Kruskal–Wallis and Wilcoxon tests. The results were then corrected with a posthoc Bonferroni test. Eventually, correlation analysis coefficients (ρ) were determined using the Spearman test. Analyses were carried out by using the GraphPad Prism v5.0 (GraphPad Software, Inc., La Jolla, CA, USA) and R (https://cran.r-project.org/) software (R Core Team, Vienna, Austria).

3. Results

3.1. Baseline Features of the Inquired Cohorts

Baseline characteristics of healthy subjects and CML patients are summarized in Table 1. The present retrospective study was carried out on 29 CML patients under TKIs therapy, and all of them were positive for the p210 BCR-ABL rearrangement at diagnosis. Among them, 3 patients showed a co-expression of b3a2/b2a2 fusion transcripts. The patients were either treated with Imatinib (n = 15) or Dasatinib (n = 14). The median age was 54 and 63.5 years for Imatinib and Dasatinib, respectively. The healthy donors (n = 16) with ages ranging between 21–63 years were included as the control. The genders were equally represented with the only exception of the patients’ cohort treated with Dasatinib, in which males are predominantly represented.

3.2. HERC2 Gene Expression Is Severely Down-Modulated in CML Specimens but Returns to Normal Levels upon Remission

The assessment of the large HERCs transcripts’ amount in a few solid tumors reveals that they might act as prognostic markers (www.proteinatla.org). However, their role in non-solid tumors has started to be explored quite recently. In our previous study, we reported an association of HERC1 gene expression with some myeloid-related disorders [20]. Curiously, besides our findings, the knowledge regarding the other large HERC sub-family member, HERC2, is currently missing in blood malignancies. Hence, we initially investigated the HERC2 gene expression in a cohort of healthy subjects (n = 16) by assessing its mRNA abundance both in bone marrow (BM, n = 7) and peripheral blood (PB, n = 9) samples. Our analysis revealed that the HERC2 mRNA level was slightly, but significantly (p < 0.05), different in PB and BM specimens with median values of 0.97 and 0.71, respectively (Figure 1). Then we assessed the HERC2 gene expression in CML patients at diagnosis (n = 30) and once they reached complete cytogenetic remission (n = 19). Differently from what we observed in the healthy subjects, the HERC2 transcript level in PB (n = 15) and BM (n = 15) samples collected at diagnosis were rather comparable, though, in terms of absolute values, the HERC2 mRNA amount was significantly lower when compared to the mRNA amount of controls (Figure 1). Similar to what has been observed for HERC1, we did not detect any significant difference in terms of HERC2 gene expression between the PB and BM samples from CML samples obtained at diagnosis. Eventually, once CML patients reached remission (n = 19), the HERC2 transcript raised again to levels comparable to those of the healthy donors. On the whole, the HERC2 gene expression is differentially regulated in healthy PB and in BM, while it is significantly downregulated in CML at diagnosis.

3.3. The Upregulation of Both Large HERCs, HERC1 and HERC2, Transcript Levels Are Tightly and Timely Associated with the Disappearance of the Leukemic Cells

BCR-ABL was the first oncogene associated with a neoplasm displaying dual properties, either as a driver or in sustaining the proliferation and expansion of the leukemic clone, facilitating enormously the development of the first selective and specific tyrosine kinase inhibitor (TKI) launched in clinical medicine, Imatinib. Later, the second generation of TKIs (e.g., Nilotinib, Dasatinib) was developed with the aim of counteracting the effect of TKI resistance. Currently, TKIs treatment of CML patients has dramatically improved the prognosis of the disease leading to complete remission in the vast majority of patients [4].
Hence, we aimed to investigate the evolution of the HERC1 and HERC2 transcript levels in two cohorts of patients treated with two different TKIs, namely Imatinib (n = 15) and Dasatinib (n = 14), and to assess their trends during the elapsed time between diagnosis and remission.
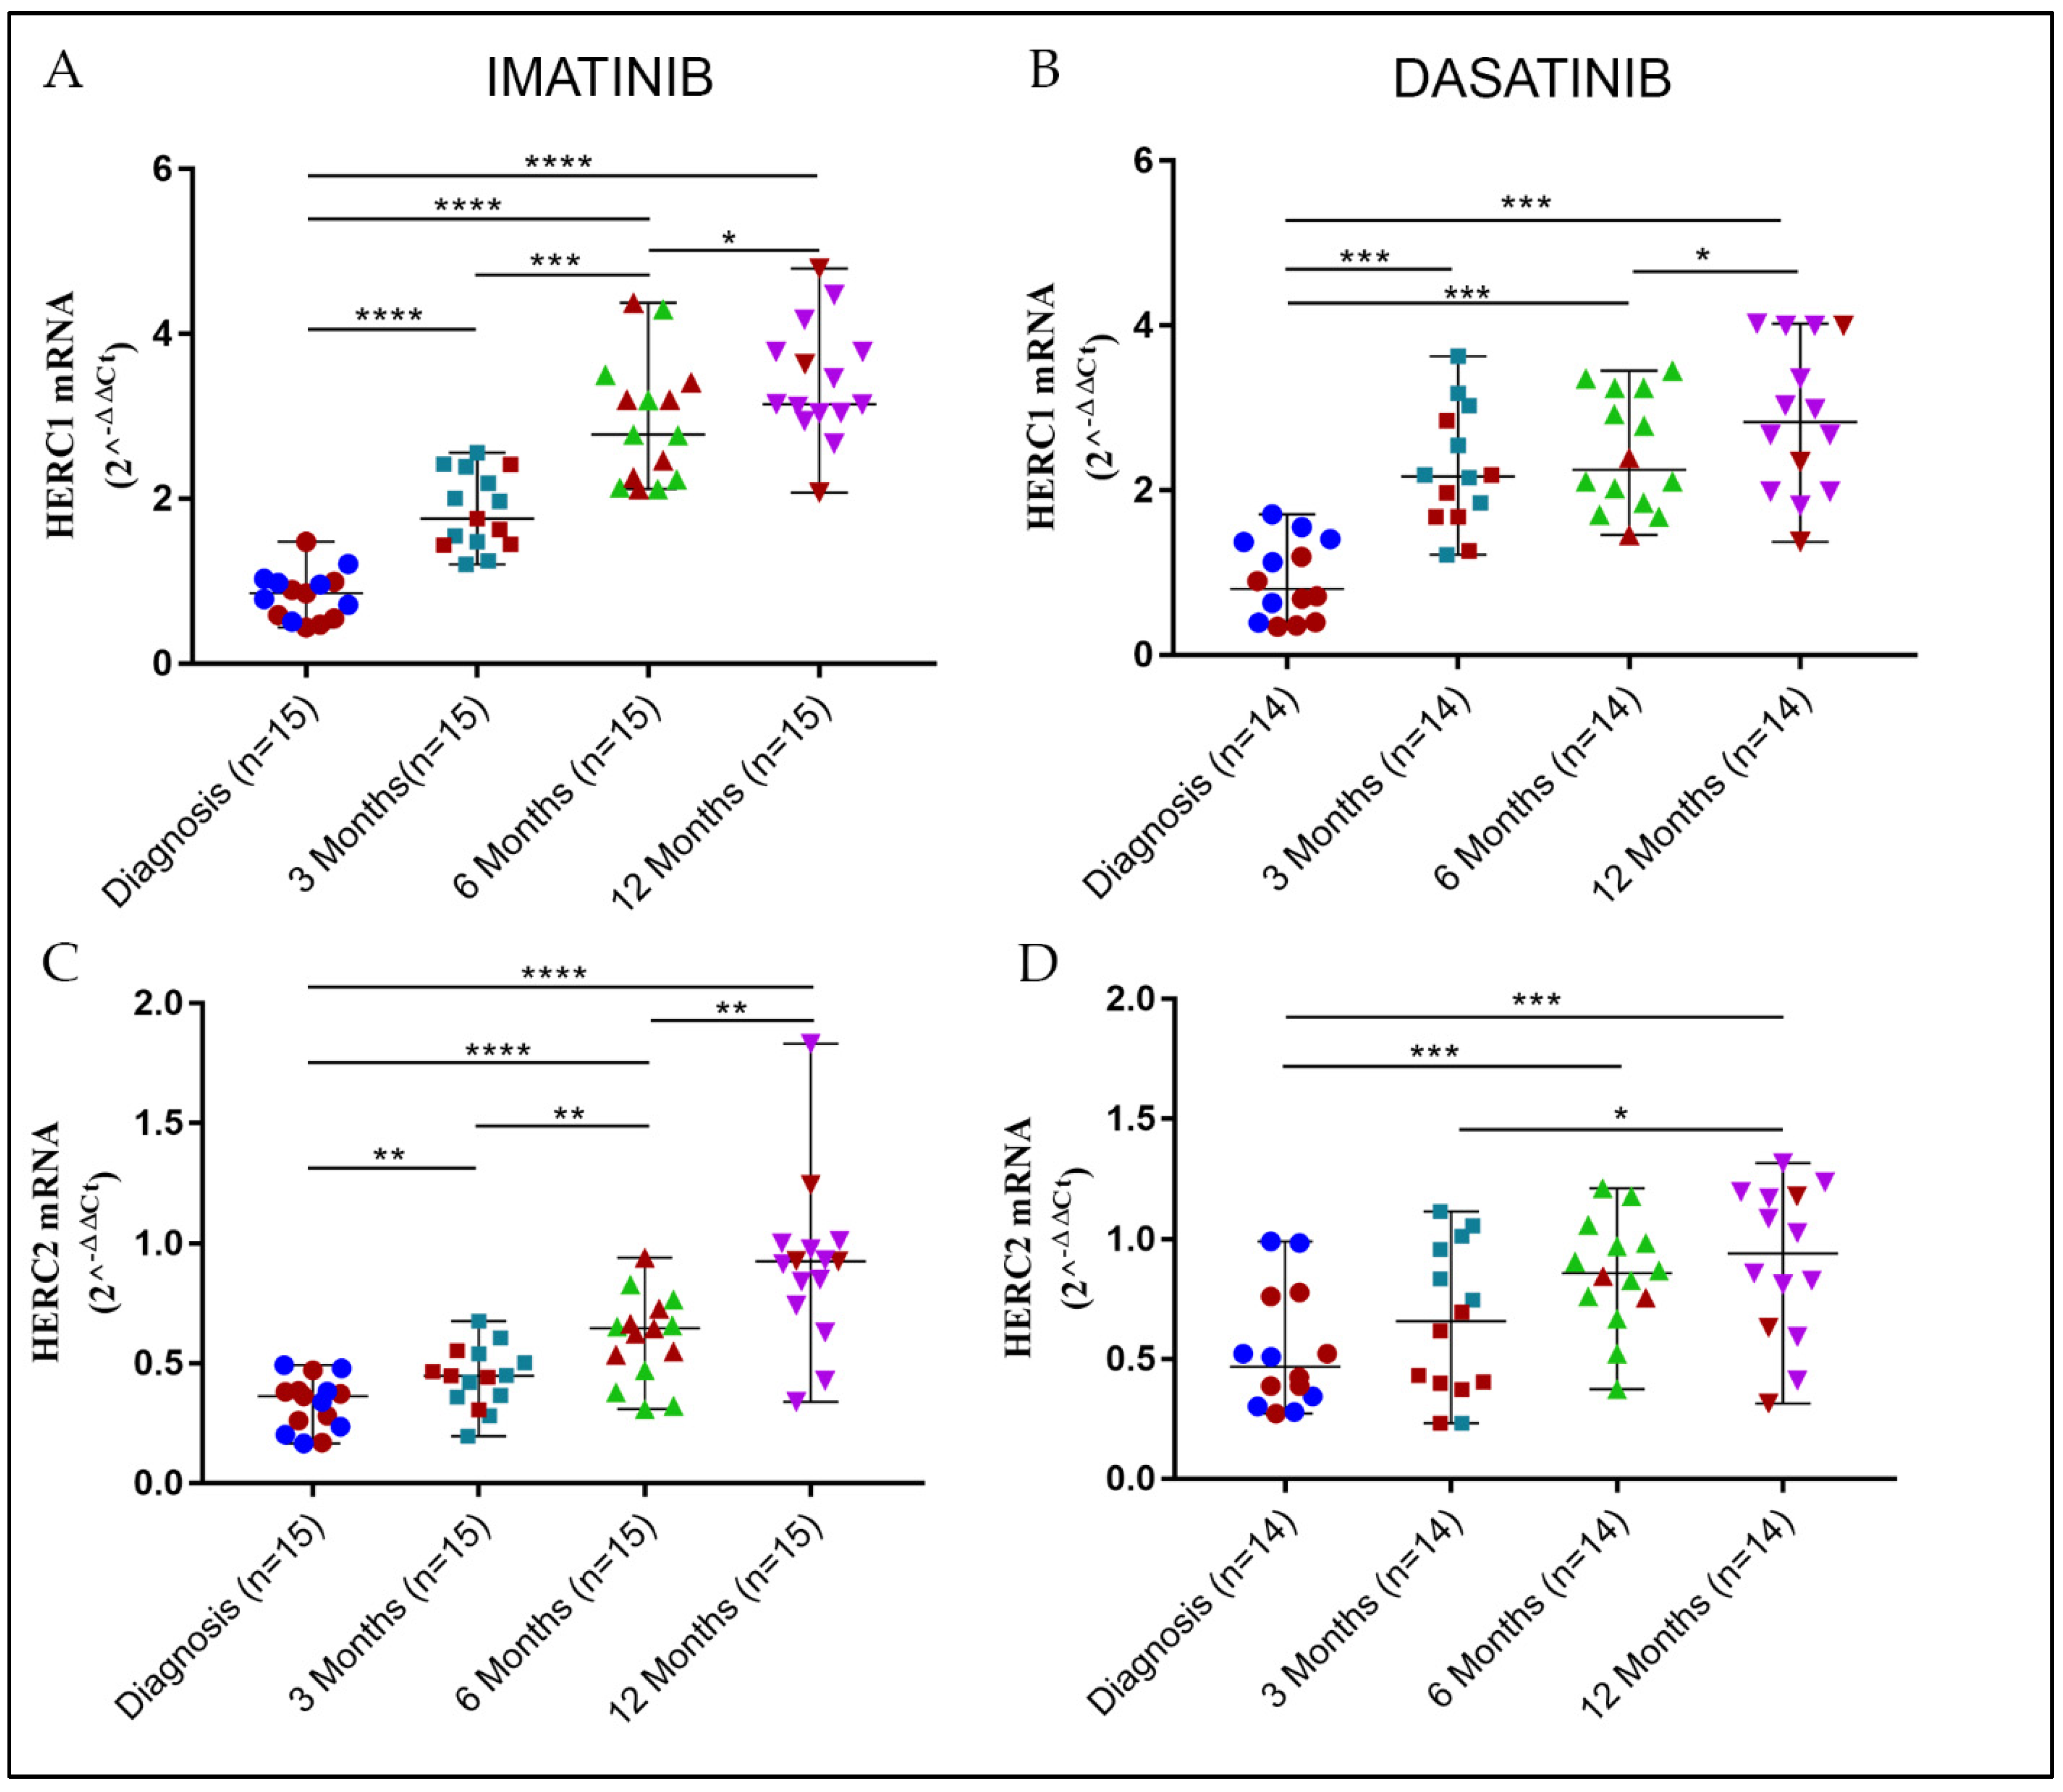
By means of a kinetic at sequential time points from the start of the treatment to complete cytogenetic remission (0, 3, 6, and 12 months), we observed that the gene expression levels of both HERC1 and HERC2 significantly changed (Supplementary Table S1). Moreover, to a different extent, the mRNA amount of both genes accumulated over time with slightly different patterns, depending on either the therapy regimens or on the gene of interest (Figure 2). On the contrary, the BCR-ABL fusion transcript steeply decreased within the first 3 months from the beginning of the therapy and further smoothly declined until the 12th month (Supplementary Figure S1), indicating that the leukemic clone was disappearing and the normal polyclonal hematopoiesis appeared again.
We also noticed that HERC1 mRNA amount significantly increased within the first 3 months, with a steeper trend in the case of Dasatinib (median = 2.17) treated patients when compared to the Imatinib counterpart (median= 1.76). Interestingly, at the later time points (6 and 12 months), while in the case of Imatinib, the HERC1 gene expression displayed a steady increment, with Dasatinib, the increase was still discernible but to a lesser extent (Figure 2A,B). Eventually, in either treatment at the endpoint (12 months), the HERC1 transcript amounts were comparable (Imatinib median = 3.35; Dasatinib median = 2.83).
Even though at diagnosis, the HERC2 baseline mRNA level was lower than that of HERC1, the gene expression pattern observed was similar. Patients under Imatinib therapy displayed a gradual increase in HERC2 transcript level and reached values (median = 0.93) comparable to those of the healthy controls at the endpoint (12 months). Unlike HERC1, in the case of HERC2, the Dasatinib treatment did not lead to a prompt and sharp gene expression increase within the 3 month time window. However, the HERC2 transcript amount observed after 12 months of Dasatinib therapy was undistinguishable (median = 0.94) from that of the Imatinib counterpart and comparable to those of healthy controls. Noticeably, a significant increase was detected only after 6 months (median = 0.86) from the starting of the Dasatinib treatment (Figure 2C,D).
Since, in the case of the Dasatinib treated group, genders were not equally represented, we assessed whether the expression of large HERCs genes was different in males and females in both groups (Imatinib vs. Dasatinib). Our analysis did not detect any significant differences suggesting that, at least in blood cells, the HERC1 and HERC2 gene expression is independent of the gender at diagnosis and during remission (data not shown).

3.4. Inverse and Positive Correlations among Large HERCs and BCR-ABL in CML Patients under TKIs Treatment

The kinetics of the BCR-ABL, HERC1, and HERC2 gene expression levels showed potential correlations among the different genes. To sort out the issue, we calculated the Spearman correlation coefficients (ρ) amongst the three genes (BCR-ABL, HERC1, and HERC2), either intra- or inter-therapy. In Imatinib-treated patients, we found that both large HERCs negatively correlated with BCR-ABL (Figure 3A), while a positive correlation coefficient was calculated between the HERC1 and HERC2 (BCR-ABL vs. HERC1 ρ = −0.85; BCR-ABL vs. HERC2 ρ = −0.69; HERC1 vs. HERC2 ρ = 0.68).
Conversely, in Dasatinib-treated patients, the correlation coefficients fell sharply, the inverse correlation between BCR-ABL and HERC1 being the most significant (ρ = −0.57). Though to a lesser extent, we also identified a moderate positive correlation between HERC1 and HERC2 (ρ = 0.44) (Figure 3B).
Interestingly, when we attempted to assess the correlation of the large HERCs between the two TKIs (i.e., Imatinib and Dasatinib) treated cohorts, we observed a positive correlation for each HERC member. However, a better outcome was attained with HERC1 when compared to HERC2 (Imatinib HERC1 vs. Dasatinib HERC1 ρ = 0.68; Imatinib HERC2 vs. Dasatinib HERC2 ρ = 0.47).
Furthermore, when we compared the correlation coefficients between Imatinib HERC1 vs. Dasatinib HERC2, and vice versa (i.e., Dasatinib HERC1 vs. Imatinib HERC2), we found a positive correlation only with the latter pair (Imatinib HERC1 vs. Dasatinib HERC2 ρ = 0.32; Dasatinib HERC1 vs. Imatinib HERC2 ρ = 0.59).
Overall, these data imply that (a) in CML patients under different TKIs treatment, the gene expression of both large HERCs negatively correlate with the BCR-ABL transcript; (b) the mRNA amount of the large HERCs was equally and significantly downregulated at the onset stage of CML when compared to healthy counterpart; (c) the positive correlation between HERC1 and HERC2 in patients treated with Imatinib is comparatively higher (ρ = 0.667) than that observed in patients treated with Dasatinib (ρ = 0.558).

3.5. The Levels of HERC1 and HERC2 Are Sensitive to BCR-ABL Inhibition

To assess whether the gene and protein expression of both HERC1 and HERC2 were concurrent, we treated in-vitro for 24 h with Imatinib and Dasatinib, 5 primary BM samples collected at diagnosis, and then evaluated the gene and protein levels. In parallel, the Ph+ K-562 cells were also treated with the same TKIs at the same concentration and for the same time. Interestingly, primary leukemic cells, as well as (Ph+) K-562, showed a significant increase in HERC1 both at mRNA and protein level after TKIs treatment, indicating that by inhibiting the BCR-ABL tyrosine kinase activity, the HERC1 levels were restored. Surprisingly, either in primary CML and K-562 treated cells, we also observed an upregulation of HERC2 mRNA level that was not concurrent with the respective protein level (Figure 4). We also determined whether there was a time dependency in the accumulation of the HERC1 and HERC2 transcripts amounts in K-562 cells upon TKIs treatments. Indeed, we observed that, over a 24 h time window, the accumulation of HERC1 and HERC2 displayed a pretty similar kinetic, being faster in the case of Dasatinib (Supplementary Figure S3).

3.6. Leukemic Cells Vary HERC1 Levels upon Differentiation Induction

Previous findings indicate that upon Imatinib treatment, and prior to apoptosis, CML cells undergo erythroid differentiation [26]. This, alongside our current data, prompted us to investigate whether HERC1 and HERC2 cellular levels were associated with differentiation stages. Hence, we determined the HERC1 protein amount in different blood cell types in both healthy donors and CML patients. We observed that HERC1 is mainly downregulated in the myeloid lineage, as well as early precursors, from CML primary cells when compared to the healthy counterparts (Figure S2).
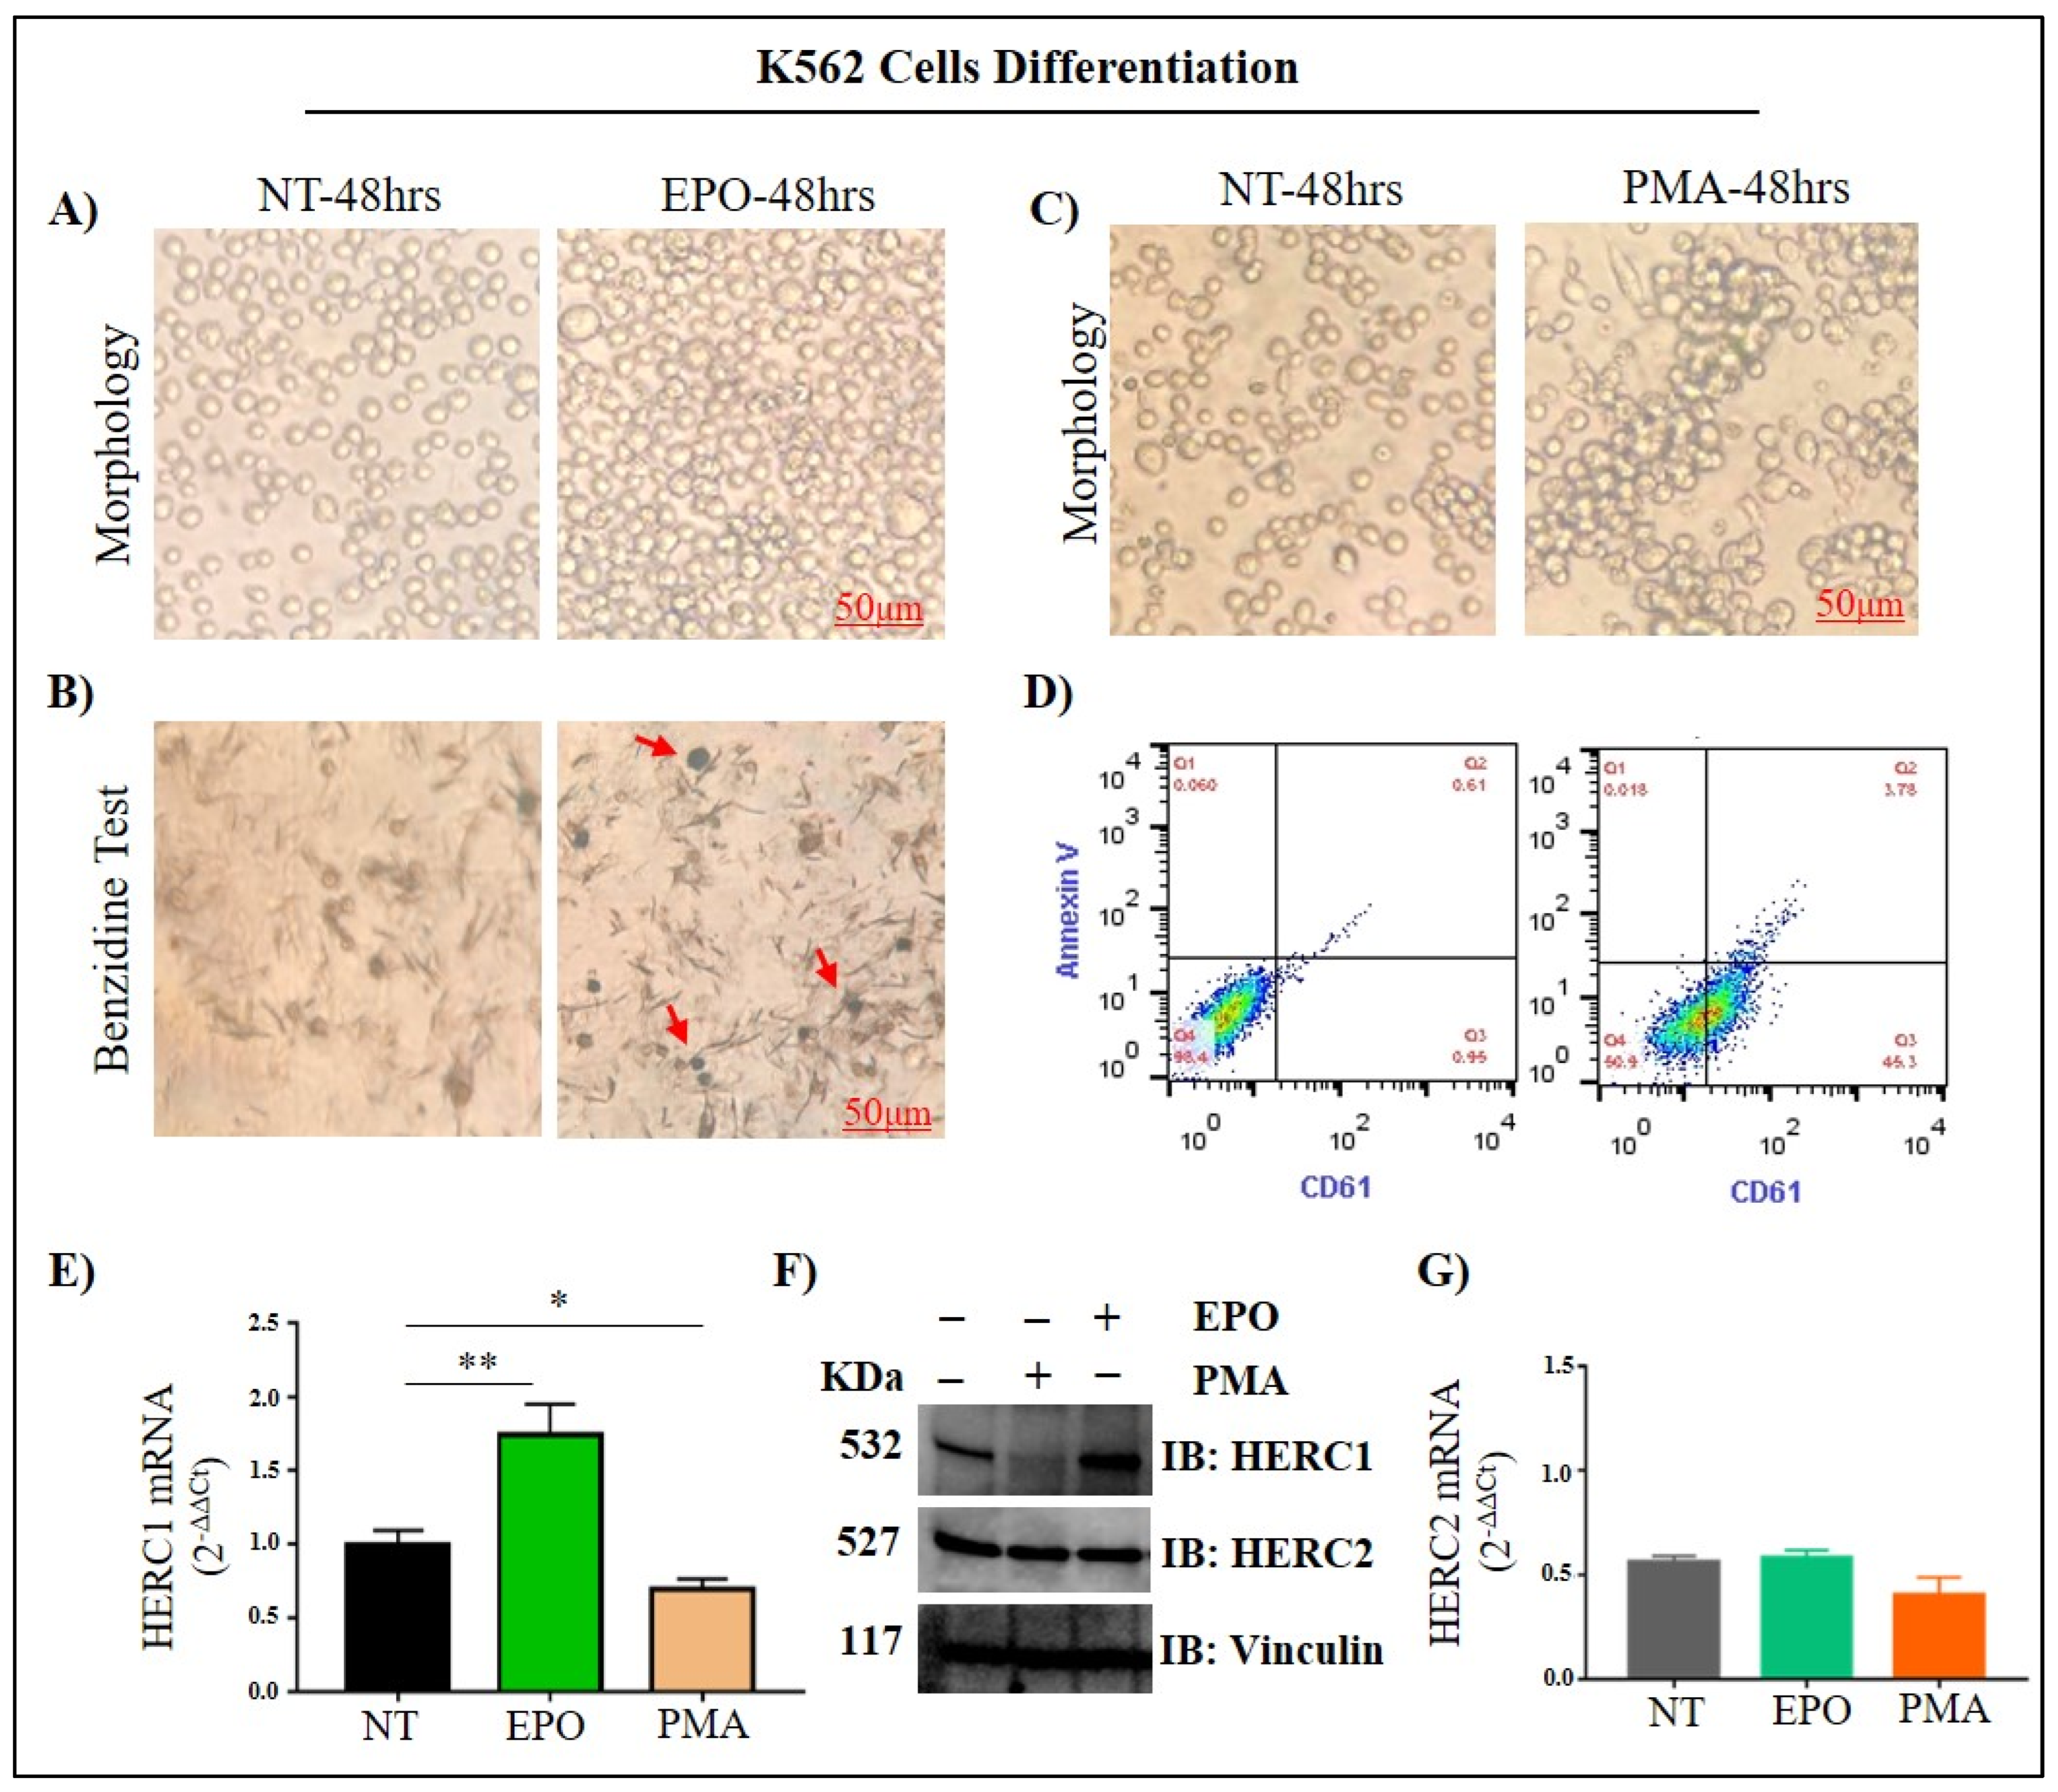
Based on these preliminary results, we suspected that different HERC1 levels might be associated with diverse blood cell types. Therefore, we attempted to differentiate K-562 cells with Erythropoietin (EPO) and phorbol 12 myristate 13-acetate (PMA). It is known that erythropoietin induces K-562 cells toward the erythroid-like lineage [23], while PMA toward megakaryocytic-like cells [24].
After EPO treatment, and when compared to the untreated control, K562 cells differentiated into enlarged erythroid-like cells, as was confirmed by benzidine assay. EPO induced an increase of erythroid differentiation by approximately 35% (benzidine-positive cells) with respect to control (Figure 5A,B).
Conversely, PMA treated K-562 cells tend to differentiate towards the megakaryocyte lineage with elongated shapes and acquired cell-to-substratum adhesion properties. PMA-induced megakaryocytic differentiation was confirmed by a significant increase in megakaryocyte-specific cell surface marker CD61 (Figure 5C,D). After differentiation, total RNAs and proteins were extracted, and HERC1 mRNA and protein expression was analyzed by RT-qPCR and Western Blot. Interestingly, HERC1 levels both at mRNA and protein were upregulated when cells were induced to differentiate towards the erythroid lineage after EPO treatment. On the contrary, when cells were induced towards the megakaryocyte lineage, the mRNA and protein amount were greatly reduced (Figure 5E,F). On the contrary, we did not detect any significant change in terms of HERC2 mRNA and protein levels (Figure 5F,G).
To further corroborate these data and exclude that our observations might be cell-specific, we also attempted to differentiate a Ph negative cell line, Human Erythroleukemia (HEL), toward megakaryocytic-like cells, by using phorbol 12-myristate 13-acetate (PMA). After PMA incubation, many cells underwent morphologic changes becoming elongated and firmly attached to the substratum (Supplementary Figure S4A), alongside an increased expression of the CD61 cell-specific surface marker (Supplementary Figure S4B,C). Similar to what we observed in Ph+ cells, the HERC1 expression, both at mRNA and protein level, was downregulated upon differentiation. By contrast, the transcript and protein amounts of HERC2 remained unchanged and comparable to those of the non-treated cells (Figure S4D–F). Overall, these results suggest that HERC1 might be potentially implied in the remodeling of the cellular proteome during blood cell differentiation and thus represents a novel differentiation marker.

4. Discussion

The dysregulation of the Ubiquitin-Proteasome System (UPS) has been reported to substantially contribute to the initiation and progression of CML as well as maintenance of the Leukemic Initiating Cell (LIC) [27]. Furthermore, the anomalous UPS regulation is also implied during the progression from chronic to accelerated and blast crises [28]. In addition, in acute lymphoblastic leukemia, somatic deletions of HERC1 were associated with lower levels of the protein MSH2, which is in turn involved in DNA mismatch repair [29], and mutations in HERC1 were also found in T-ALL patients [30]. Recurrent mutations of both HERC1 and HERC2 have also been detected in T cell prolymphocytic leukemia with a frequency of approximately 10% [31]. Previously, and in more detail than the present study, we observed a tight and unambiguous inverse correlation between the presence of the fusion oncogene BCR-ABL and the gene expression of HERC1 and HERC2 in newly diagnosed CML patients. It is noteworthy that when compared to healthy donors, in CML specimens, the HERC1 and HERC2 mRNA amounts are detected at lower levels in white blood cells precursors, as well as in mature white blood cells, as determined in BM and PB specimens. We found that in CML cells the gene and protein expression of HERC1 seem to be sensitive to TKIs, whereas in the case of HERC2 such behavior was restricted only to the transcript. Eventually, for the first time our data display that in healthy mature blood cells there is a greater accumulation of large HERCs and that, in terms of absolute values, the large HERCs transcript amount profoundly differs being HERC2 expressed at a remarkably lower extent when compared to HERC1. Overall, these findings let surmise a putative role of both giant HERCs in the chronic phase of the CML.
Currently, the mechanistic and molecular reasons by which the genes encoding for the large HERCs are downregulated in CML are unknown. In spite of that, CML displays a peculiar BCR-ABL dependent gene signature conferring unique leukemogenic properties to the cells, including the aberrant readout of coordinated effects of transcription factors as well as aberrant epigenetic controls. Additionally, other post-transcriptional mechanisms, including non-coding RNA-mediated specific mRNA silencing, are also considered to be very powerful epigenetic mediators modulating the CML expression profiles and phenotypic outcome [32]. Overall, it is likely that BCR-ABL exerts a negative effect on the accumulation of these HERC genes. Recently, we observed that BCR-ABL interacts with HERC1 and that the latter is a substrate of the former [20]. Determining the molecular mechanism/s by which large HERCs are downregulated in CML and ascertaining to what levels the aberrant HERCs transcripts dysregulation occurs will be a matter of future studies.
Interestingly, our findings point out that the two large HERCs, HERC1 and HERC2, genes are differently controlled by tyrosine kinases. Alongside BCR-ABL, Src kinases play a role in the leukemogenesis of CML. The Src kinases sustain the proliferation of BCR-ABL expressing cells, the transition of CML to lymphoid blast crisis [33,34,35], and in some cases, the overexpression of Src kinases have been implicated in Imatinib acquired resistance [7,8]. Accordingly, activation of Src may promote BCR-ABL phosphorylation within the activation loop, thus interfering with the Imatinib binding. Therefore, the small molecule inhibitor with overlapping activity against both Abl and Src (i.e., Dasatinib) results in enhanced activity against CML compared with that of Imatinib, which is a potent Abl tyrosine kinase inhibitor but has negligible activity against Src kinases [10,36]. Our current evidence suggests that, though HERC1 and HERC2 are localized on the same chromosome [37] and encode for proteins sharing many structural similarities, their gene expression might be differentially regulated by Src family kinases. Indeed, though both genes appear to be severely downregulated in chronic myeloid leukemia cells, the effect of Dasatinib on the HERC1 and HERC2 gene expression is different. As a matter of fact, when compared with HERC1, HERC2 appeared more sensitive to the effects of Dasatinib with a slower recovery kinetic. These data prompt us to speculate that the transcription of both genes is negatively regulated by BCR-ABL. Additionally, our results suggest that at least in the early stages of recovery, HERC2 gene expression might be under positive regulation by Src kinases. We suppose that, differently from HERC1, the HERC2 gene expression is under a triple control depending on the chromatin condensation grade, which represents a hindrance for the transcription factors’ accessibility to the promoter. In support of this assumption, an in-silico survey (http://gene-regulation.com/pub/programs/alibaba2/) revealed that a conserved DNA consensus binding site for a transcription factor downstream of Src, Myc, exists exclusively on the HERC2 gene promoter, but not on that of HERC1.
What are the biological consequences of keeping large HERCs transcript amount low during myeloid neoplastic proliferation? At the moment, it remains an open question, though some plausible working hypotheses should be carefully considered. Among the different neoplasm, the CML is characterized by a very high genomic instability due to alterations of the DNA damage responses and repair as well as cell-cycle checkpoints. Overall, these alterations lead to the acquisition of secondary genetic lesions that accompany the progression from chronic to accelerated and eventually blast crisis [38,39]. The loss of p53 function has been associated with the suppression of apoptosis and progression of CML into blast crisis [40]. In this respect, HERC2 also could provide an important point of regulatory flexibility, allowing cells to finely control their response to specific genotoxic insults and maintain genome stability by controlling the XPA and BRCA1 protein stability and eventually regulating the cell-cycle at G2/M checkpoint transition [41,42,43]. Moreover, HERC2 has been shown to physically interact, via the CPH domain, with the oncosuppressor protein p53. Moreover, by finely tuning p53 tetramerization HERC2 controls the p53 DNA binding and, thus, its transcriptional activity [44]. Among the outstanding hallmarks of neoplastic cells, there is the acquired ability of the cells to escape the programmed cell death, a process that is strictly under the control of the ubiquitin-proteasome system [45,46], where E3 ligases are crucial players regulating many aspects of the process. Though HECT family members are a minority of the whole E3 ubiquitin ligases, few of them appear to be pivotal either in enhancing (i.e., NedL1) or inhibiting (i.e., AREL1) p53 mediated apoptosis [47,48]. It has been recently reported that HERC5 regulates the apoptosis rate in colorectal cells by acting throughout CtBP1, and thus regulating the expression of pivotal apoptotic genes (e.g., BAX, PUMA, BIK) [49]. Our findings do not allow us to discern to what degree HERC1 and HERC2 are involved in regulating apoptosis; hence this would be one of the next challenging issue to be sorted-out.
A common and prominent feature shared by all leukemia, as well as many other tumors, including solid cancers, is that they display impaired cell differentiation. Basically, the differentiation defects featuring leukemic cells, though to a different extent, are common to every leukemia form, including the myeloid-related disorder. Whereas the functional role of HERC2 has been extensively investigated, that of HERC1 has only been recently associated with cellular proliferation. However, with the exception of a few observations, restricted to the central nervous system in which HERC1 seems to be important for the axonal myelination and the control of the presynaptic membrane dynamics of central synapses [50], the role of this giant ubiquitin-ligase during cell-differentiation remains poorly investigated. Nonetheless, it is well known that the UPS plays an important role during morphogenesis and differentiation in almost every cell ranging from lower eukaryotes [51,52,53,54,55,56,57] to mammals [58,59], including blood cells [60]. In this regard, red blood cells differentiation requires the remodeling of their proteome that takes place by the selective degradation of pre-existing proteins through the UPS.
Our findings indicate that HERC1 protein amount is associated with the differentiation process of leukemic cells at least towards two different lineages, suggesting that HERC1, and to a lesser extent HERC2, might contribute to the proteome remodeling associated with cell differentiation. Furthermore, the endpoint of cellular differentiation is cell senescence, a process characterized by a stable cell cycle arrest and where autophagy plays a critical role [61]. At this point, it remains to be ascertained at which point large HERCs might be crucial contributors to all these processes. Further research work is required to investigate the functional role of HERC1 in the regulation of blood cell differentiation and identify what the HERC1 gene expression regulators are.

5. Conclusions

Our survey reveals that the HERC2 gene is expressed in PB and BM from healthy subjects with lower levels in the latter specimens. In white blood cells, the HERC2 transcript amount is inferior to that of HERC1. As it occurs for HERC1, also the HERC2 gene expression is profoundly reduced in CML patients at diagnosis, but it is restored to normal levels and with a relatively rapid kinetic upon disease remission. Eventually, our evidence suggests that, differently from HERC1, the HERC2 transcription is likely under the control of Src family kinases. We also observed that the HERC1 mRNA and protein amount levels are tightly linked to the cell fate. Remarkably, our findings suggest that, at least in blood cells, HERC1 might be a novel differentiation marker.

Supplementary Materials

The following supporting information can be downloaded at: https://www.mdpi.com/article/10.3390/jcm11020324/s1, Figure S1. Anticorellation between large HERCs and BCR-ABL transcript amounts in CML patients. Figure S2. HERC1 is sharply downregulated in the leukemic myeloid lineage. Figure S3. Time dependency effect of TKIs (Imatinib and Dasatinib) on HERC1 and HERC2 transcript level in K562 (Ph+) cells. Figure S4. (A) Representative images of K562 cell pellet showing reddish color and blue coloration in benzamine test due to the presence of hemoglobin after EPO treatment (B) immunofluorescence microscopy revealing the EPO-induced differentiation of K562 cells resulted in an increase of HERC1 protein levels. (C,D) Representative cell morphology images and flow cytometry analysis of HEL cells stained using anti-CD61 megakaryocyte specific cell surface marker of undifferentiated and differentiated HEL-cells, after 48hours in the presence of PMA (250 nM). (E,F) HERC1gene expression both at mRNA and protein in undifferentiated and differentiated HEL cells. The a-tubulin and vinculin were used as loading controls in Western Blots. Table S1. p-values of HERC1 and HERC2 by time in CML patients under different TKIs treatment by Kruskal-Wallis test.

Author Contributions

Conceptualization: E.B., B.P. and G.S.; methodology: M.S.A., C.P. and S.M.; software data analysis: S.M.; validation: M.S.A., C.P., S.M. and D.C.; data curation: E.B., B.P. and D.C.; writing original draft: M.S.A., B.P. and E.B.; writing—review and editing: E.B., B.P., M.S.A. and G.S.; supervision: E.B., B.P. and G.S.; funding acquisition: G.S., B.P. and D.C. All authors have read and agreed to the published version of the manuscript.

Funding

This research was funded by AIRC, grant number 10005 to G.S. by a grant of A.I.R.B.B. to B.P. and by research funding from the Università Degli Studi di Torino to B.P.

Institutional Review Board Statement

The study was conducted according to the guidelines of the Declaration of Helsinki and approved by the Institutional Review Board (or Ethics Committee) of Local ethics committee S. Luigi Gonzaga Hospital protocol code: 0021496, 212/2015.

Informed Consent Statement

Informed consent was obtained from all subjects involved in the study.

Data Availability Statement

We did not produce a public database.

Acknowledgments

We thank Emilia Giuliano and Enrico Gottardi for human samples processing.

Conflicts of Interest

The authors declare no conflict of interest.

References

  1. Melo, J.V.; Barnes, D.J. Chronic myeloid leukaemia as a model of disease evolution in human cancer. Nat. Rev. Cancer 2007 76 2007, 7, 441–453. [Google Scholar] [CrossRef]
  2. Gómez-Casares, M.T.; García-Alegria, E.; López-Jorge, C.E.; Ferrándiz, N.; Blanco, R.; Alvarez, S.; Vaqué, J.P.; Bretones, G.; Caraballo, J.M.; Sánchez-Bailón, P.; et al. MYC antagonizes the differentiation induced by imatinib in chronic myeloid leukemia cells through downregulation of p27KIP1. Oncogene 2012, 32, 2239–2246. [Google Scholar] [CrossRef]
  3. Cohen, P.; Cross, D.; Jänne, P.A. Kinase drug discovery 20 years after imatinib: Progress and future directions. Nat. Rev. Drug Discov. 2021, 20, 551–569. [Google Scholar] [CrossRef]
  4. Bracco, E.; Ali, M.S.; Magnati, S.; Saglio, G. The paradigm of targeting an oncogenic tyrosine kinase: Lesson from BCR-ABL. In Advances in Precision Medicine Oncology; InTechOpen: London, UK, 2021. [Google Scholar] [CrossRef]
  5. Mughal, T.I.; Radich, J.P.; Deininger, M.W.; Apperley, J.F.; Hughes, T.P.; Harrison, C.J.; Gambacorti-Passerini, C.; Saglio, G.; Cortes, J.; Daley, G.Q. Chronic myeloid leukemia: Reminiscences and dreams. Haematologica 2016, 101, 541–558. [Google Scholar] [CrossRef]
  6. Mahon, F.-X.; Belloc, F.; Lagarde, V.; Chollet, C.; Moreau-Gaudry, F.; Reiffers, J.; Goldman, J.M.; Melo, J.V. MDR1 gene overexpression confers resistance to imatinib mesylate in leukemia cell line models. Blood 2003, 101, 2368–2373. [Google Scholar] [CrossRef] [PubMed]
  7. Donato, N.J.; Wu, J.Y.; Stapley, J.; Gallick, G.; Lin, H.; Arlinghaus, R.; Talpaz, M. BCR-ABL independence and LYN kinase overexpression in chronic myelogenous leukemia cells selected for resistance to STI571. Blood 2003, 101, 690–698. [Google Scholar] [CrossRef] [PubMed] [Green Version]
  8. Dai, Y.; Rahmani, M.; Corey, S.J.; Dent, P.; Grant, S. A Bcr/Abl-independent, Lyn-dependent form of imatinib mesylate (STI-571) resistance is associated with altered expression of Bcl-2. J. Biol. Chem. 2004, 279, 34227–34239. [Google Scholar] [CrossRef] [PubMed] [Green Version]
  9. Rossari, F.; Minutolo, F.; Orciuolo, E. Past, present, and future of Bcr-Abl inhibitors: From chemical development to clinical efficacy. J. Hematol. Oncol. 2018, 11, 84. [Google Scholar] [CrossRef] [Green Version]
  10. Martinelli, G.; Soverini, S.; Rosti, G.; Baccarani, M. Dual tyrosine kinase inhibitors in chronic myeloid leukemia. Leukemia 2005, 19, 1872–1879. [Google Scholar] [CrossRef]
  11. Pophali, P.A.; Patnaik, M.M. The role of new tyrosine kinase inhibitors in chronic myeloid leukemia. Cancer J. 2016, 22, 40. [Google Scholar] [CrossRef] [Green Version]
  12. Pergolizzi, B.; Panuzzo, C.; Shahzad Ali, M.; Lo Iacono, M.; Levra Levron, C.; Ponzone, L.; Prelli, M.; Cilloni, D.; Calautti, E.; Bozzaro, S.; et al. Two conserved glycine residues in mammalian and Dictyostelium Rictor are required for mTORC2 activity and integrity. J. Cell Sci. 2019, 132, jcs236505. [Google Scholar] [CrossRef]
  13. Groothuis, T.A.M.; Dantuma, N.P.; Neefjes, J.; Salomons, F.A. Ubiquitin crosstalk connecting cellular processes. Cell Div. 2006, 1, 21. [Google Scholar] [CrossRef]
  14. Suresh, B.; Lee, J.; Kim, H.; Ramakrishna, S. Regulation of pluripotency and differentiation by deubiquitinating enzymes. Cell Death Differ. 2016, 23, 1257–1264. [Google Scholar] [CrossRef] [Green Version]
  15. García-Cano, J.; Martinez-Martinez, A.; Sala-Gaston, J.; Pedrazza, L.; Jose Rosa, J.L. HERCing: Structural and Functional Relevance of the Large HERC Ubiquitin Ligases. Front. Physiol. 2019, 10, 1014. [Google Scholar] [CrossRef] [PubMed]
  16. Chaugule, V.K.; Walden, H. Specificity and disease in the ubiquitin system. Biochem. Soc. Trans. 2016, 44, 212–227. [Google Scholar] [CrossRef] [Green Version]
  17. Fajner, V.; Maspero, E.; Polo, S. Targeting HECT-type E3 ligases–insights from catalysis, regulation and inhibitors. FEBS Lett. 2017, 591, 2636–2647. [Google Scholar] [CrossRef] [PubMed] [Green Version]
  18. Marteijn, J.A.F.; Jansen, J.H.; van der Reijden, B.A. Ubiquitylation in normal and malignant hematopoiesis: Novel therapeutic targets. Leukemia 2006, 20, 1511–1518. [Google Scholar] [CrossRef] [Green Version]
  19. Di Costanzo, A.; Del Gaudio, N.; Conte, L.; Altucci, L. The ubiquitin proteasome system in hematological malignancies: New insight into its functional role and therapeutic options. Cancers 2020, 12, 1898. [Google Scholar] [CrossRef] [PubMed]
  20. Ali, M.S.; Panuzzo, C.; Calabrese, C.; Maglione, A.; Piazza, R.; Cilloni, D.; Saglio, G.; Pergolizzi, B.; Bracco, E. The Giant HECT E3 ubiquitin ligase HERC1 is aberrantly expressed in myeloid related disorders and it is a novel BCR-ABL1 binding partner. Cancers 2021, 13, 341. [Google Scholar] [CrossRef]
  21. Calabrese, C.; Panuzzo, C.; Stanga, S.; Andreani, G.; Ravera, S.; Maglione, A.; Pironi, L.; Petiti, J.; Ali, M.S.; Scaravaglio, P.; et al. Deferasirox-dependent iron chelation enhances mitochondrial dysfunction and restores p53 signaling by stabilization of p53 family members in leukemic Cells. Int. J. Mol. Sci. 2020, 21, 7674. [Google Scholar] [CrossRef]
  22. Cubillos-Rojas, M.; Amair, F.; Bartrons, R.; Rosa, J.L.; Cubillos-Rojas, M.; Amair-Pinedo, F.; Tato, I.; Ventura, F. Tris-acetate polyacrylamide gradient gels for the simultaneous electrophoretic analysis of proteins of very high and low molecular mass liraglutide improves liver microvascular dysfunction in cirrhosis: Evidence from translational studies view project metabolic reprogramming of tumor cells view project tris-acetate polyacrylamide gradient gels for the simultaneous electrophoretic analysis of proteins of very high and low molecular mass. Methods Mol. Biol. 2012, 869, 205–213. [Google Scholar] [CrossRef] [PubMed]
  23. Kitanaka, A.; Waki, M.; Kamano, H.; Tanaka, T.; Kubota, Y.; Ohnishi, H.; Takahara, J.; Irino, S. Antisense src expression inhibits proliferation and erythropoietin-induced erythroid differentiation of K562 human leukemia cells. Biochem. Biophys. Res. Commun. 1994, 201, 1534–1540. [Google Scholar] [CrossRef] [PubMed]
  24. Kong, X.-Z.; Yin, R.-H.; Ning, H.-M.; Zheng, W.-W.; Dong, X.-M.; Yang, Y.; Xu, F.-F.; Li, J.-J.; Zhan, Y.-Q.; Yu, M. Effects of THAP11 on erythroid differentiation and megakaryocytic differentiation of K562 cells. PLoS ONE 2014, 9, e91557. [Google Scholar] [CrossRef] [Green Version]
  25. Ali, M.S.; Gill, K.S.; Saglio, G.; Cilloni, D.; Soden, D.M.; Forde, P.F. Expressional changes in stemness markers post electrochemotherapy in pancreatic cancer cells. Bioelectrochemistry 2018, 122, 84–92. [Google Scholar] [CrossRef] [Green Version]
  26. Jacquel, A.; Herrant, M.; Legros, L.; Belhacene, N.; Luciano, F.; Pages, G.; Hofman, P.; Auberger, P. Imatinib induces mitochondria-dependent apoptosis of the Bcr-Abl-positive K562 cell line and its differentiation toward the erythroid lineage. FASEB J. 2003, 17, 2160–2162. [Google Scholar] [CrossRef]
  27. Reavie, L.; Buckley, S.M.; Loizou, E.; Takeishi, S.; Aranda-Orgilles, B.; Ndiaye-Lobry, D.; Abdel-Wahab, O.; Ibrahim, S.; Nakayama, K.I.; Aifantis, I. Regulation of c-Myc ubiquitination controls chronic myelogenous leukemia initiation and progression. Cancer Cell 2013, 23, 362–375. [Google Scholar] [CrossRef] [PubMed] [Green Version]
  28. Magistroni, V.; Mauri, M.; D’Aliberti, D.; Mezzatesta, C.; Crespiatico, I.; Nava, M.; Fontana, D.; Sharma, N.; Parker, W.; Schreiber, A.; et al. De novo UBE2A mutations are recurrently acquired during chronic myeloid leukemia progression and interfere with myeloid differentiation pathways. Haematologica 2019, 104, 1789–1797. [Google Scholar] [CrossRef] [Green Version]
  29. Diouf, B.; Cheng, Q.; Krynetskaia, N.F.; Yang, W.; Cheok, M.; Pei, D.; Fan, Y.; Cheng, C.; Krynetskiy, E.Y.; Geng, H.; et al. Somatic deletions of genes regulating MSH2 protein stability cause DNA mismatch repair deficiency and drug resistance in human leukemia cells. Nat. Med. 2011, 17, 1298–1303. [Google Scholar] [CrossRef]
  30. Neumann, M.; Vosberg, S.; Schlee, C.; Heesch, S.; Schwartz, S.; Gökbuget, N.; Hoelzer, D.; Graf, A.; Krebs, S.; Bartram, I.; et al. Mutational spectrum of adult T-ALL. Oncotarget 2015, 6, 2754. [Google Scholar] [CrossRef] [Green Version]
  31. Johansson, P.; Klein-Hitpass, L.; Choidas, A.; Habenberger, P.; Mahboubi, B.; Kim, B.; Bergmann, A.; Scholtysik, R.; Brauser, M.; Lollies, A.; et al. SAMHD1 is recurrently mutated in T-cell prolymphocytic leukemia. Blood Cancer J. 2018, 8, 1–16. [Google Scholar] [CrossRef] [Green Version]
  32. Polakova, K.M.; Koblihova, J.; Stopka, T. Role of epigenetics in chronic myeloid leukemia. Curr. Hematol. Malig. Rep. 2013, 8, 28–36. [Google Scholar] [CrossRef] [Green Version]
  33. Stanglmaier, M.; Warmuth, M.; Kleinlein, I.; Reis, S.; Hallek, M. The interaction of the Bcr-Abl tyrosine kinase with the Src kinase Hck is mediated by multiple binding domains. Leukemia 2003, 17, 283–289. [Google Scholar] [CrossRef] [Green Version]
  34. Danhauser-Riedl, S.; Warmuth, M.; Druker, B.J.; Emmerich, B.; Hallek, M. Activation of Src Kinases p53/56lyn and p59hck by p210bcr/abl in Myeloid Cells. Cancer Res. 1996, 56, 3589–3596. [Google Scholar] [PubMed]
  35. Hu, Y.; Swerdlow, S.; Duffy, T.M.; Weinmann, R.; Lee, F.Y.; Li, S. Targeting multiple kinase pathways in leukemic progenitors and stem cells is essential for improved treatment of Ph+ leukemia in mice. Proc. Natl. Acad. Sci. USA 2006, 103, 16870–16875. [Google Scholar] [CrossRef] [Green Version]
  36. Lombardo, L.J.; Lee, F.Y.; Chen, P.; Norris, D.; Barrish, J.C.; Behnia, K.; Castaneda, S.; Cornelius, L.A.M.; Das, J.; Doweyko, A.M.; et al. Discovery of N-(2-Chloro-6-methyl-phenyl)-2-(6-(4-(2-hydroxyethyl)-piperazin-1-yl)-2-methylpyrimidin-4-ylamino)thiazole-5-carboxamide (BMS-354825), a dual Src/Abl kinase inhibitor with potent antitumor activity in preclinical assays. J. Med. Chem. 2004, 47, 6658–6661. [Google Scholar] [CrossRef]
  37. Cruz, C.; Paladugu, A.; Ventura, F.; Bartrons, R.; Aldaz, M.; Rosa, J.L. Assignment of the human P532 gene (HERC1) to chromosome 15q22 by fluorescence in situ hybridization. Cytogenet. Genome Res. 1999, 86, 68–69. [Google Scholar] [CrossRef] [PubMed]
  38. Muvarak, N.; Nagaria, P.; Rassool, F.V. Genomic instability in chronic myeloid leukemia: Targets for therapy? Curr. Hematol. Malig. Rep. 2012, 7, 94–102. [Google Scholar] [CrossRef]
  39. Bolton-Gillespie, E.; Schemionek, M.; Klein, H.-U.; Flis, S.; Hoser, G.; Lange, T.; Nieborowska-Skorska, M.; Maier, J.; Kerstiens, L.; Koptyra, M.; et al. Genomic instability may originate from imatinib-refractory chronic myeloid leukemia stem cells. Blood 2013, 121, 4175–4183. [Google Scholar] [CrossRef] [PubMed]
  40. Stuppia, L.; Calabrese, G.; Peila, R.; Guanciali-Franchi, P.; Morizio, E.; Spadano, A.; Palka, G. p53 loss and point mutations are associated with suppression of apoptosis and progression of CML into myeloid blastic crisis. Cancer Genet. Cytogenet. 1997, 98, 28–35. [Google Scholar] [CrossRef]
  41. Kang, T.-H.; Lindsey-Boltz, L.A.; Reardon, J.T.; Sancar, A. Circadian control of XPA and excision repair of cisplatin-DNA damage by cryptochrome and HERC2 ubiquitin ligase. Proc. Natl. Acad. Sci. USA 2010, 107, 4890–4895. [Google Scholar] [CrossRef] [Green Version]
  42. Wu, W.; Sato, K.; Koike, A.; Nishikawa, H.; Koizumi, H.; Venkitaraman, A.R.; Ohta, T. HERC2 Is an E3 ligase that targets BRCA1 for degradation. Cancer Res. 2010, 70, 6384–6392. [Google Scholar] [CrossRef] [Green Version]
  43. Izawa, N.; Wu, W.; Sato, K.; Nishikawa, H.; Kato, A.; Boku, N.; Itoh, F.; Ohta, T. HERC2 interacts with claspin and regulates dna origin firing and replication fork progression. Cancer Res. 2011, 71, 5621–5625. [Google Scholar] [CrossRef] [PubMed] [Green Version]
  44. Cubillos-Rojas, M.; Amair-Pinedo, F.; Peiró-Jordán, R.; Bartrons, R.; Ventura, F.; Rosa, J.L. The E3 ubiquitin protein ligase herc2 modulates the activity of tumor protein p53 by regulating its oligomerization. J. Biol. Chem. 2014, 289, 14782–14795. [Google Scholar] [CrossRef] [PubMed] [Green Version]
  45. Bader, M.; Steller, H. Regulation of cell death by the ubiquitin-proteasome system. Curr. Opin. Cell Biol. 2009, 21, 878. [Google Scholar] [CrossRef] [Green Version]
  46. Gupta, I.; Singh, K.; Varshney, N.K.; Khan, S. Delineating crosstalk mechanisms of the ubiquitin proteasome system that regulate apoptosis. Front. Cell Dev. Biol. 2018, 6, 11. [Google Scholar] [CrossRef] [PubMed]
  47. Li, Y.; Ozaki, T.; Kikuchi, H.; Yamamoto, H.; Ohira, M.; Nakagawara, A. A novel HECT-type E3 ubiquitin protein ligase NEDL1 enhances the p53-mediated apoptotic cell death in its catalytic activity-independent manner. Oncogene 2008, 27, 3700–3709. [Google Scholar] [CrossRef] [Green Version]
  48. Kim, J.B.; Kim, S.Y.; Kim, B.M.; Lee, H.; Kim, I.; Yun, J.; Jo, Y.; Oh, T.; Jo, Y.; Chae, H.D.; et al. Identification of a novel anti-apoptotic E3 ubiquitin ligase that ubiquitinates antagonists of inhibitor of apoptosis proteins SMAC, HtrA2, and ARTS. J. Biol. Chem. 2013, 288, 12014–12021. [Google Scholar] [CrossRef] [Green Version]
  49. Zhu, L.; Wu, J.; Liu, H. Downregulation of HERC5 E3 ligase attenuates the ubiquitination of CtBP1 to inhibit apoptosis in colorectal cancer cells. Carcinogenesis 2021, 42, 1119–1130. [Google Scholar] [CrossRef]
  50. Angeles Montes-Fernández, M.; Ma Pérez-Villegas, E.; Garcia-Gonzalo, F.R.; Pedrazza, L.; Luis Rosa, J.; Alvarez de Toledo, G.; Armengol, J.A. The HERC1 ubiquitin ligase regulates presynaptic membrane dynamics of central synapses. Sci. Rep. 2020, 10, 12057. [Google Scholar] [CrossRef] [PubMed]
  51. Hossain, S.; Veri, A.O.; Cowen, L.E. The proteasome governs fungal morphogenesis via functional connections with HSP90 and camp-protein kinase a signaling. MBio 2020, 11, e00290-20. [Google Scholar] [CrossRef]
  52. Papaevgeniou, N.; Chondrogianni, N. The ubiquitin proteasome system in Caenorhabditis elegans and its regulation. Redox Biol. 2014, 2, 333–347. [Google Scholar] [CrossRef] [PubMed] [Green Version]
  53. Lipinszki, Z.; Klement, E.; Hunyadi-Gulyas, E.; Medzihradszky, K.F.; Márkus, R.; Pál, M.; Deák, P.; Udvardy, A. A novel interplay between the ubiquitin–proteasome system and serine proteases during Drosophila development. Biochem. J. 2013, 454, 571–583. [Google Scholar] [CrossRef] [Green Version]
  54. Ramirez, J.; Martinez, A.; Lectez, B.; Lee, S.Y.; Franco, M.; Barrio, R.; Dittmar, G.; Mayor, U. Proteomic analysis of the ubiquitin landscape in the drosophila embryonic nervous system and the adult photoreceptor cells. PLoS ONE 2015, 10, e0139083. [Google Scholar] [CrossRef] [Green Version]
  55. Pukatzki, S.; Tordilla, N.; Franke, J.; Kessin, R.H. A Novel component involved in ubiquitination is required for development of dictyostelium discoideum. J. Biol. Chem. 1998, 273, 24131–24138. [Google Scholar] [CrossRef] [PubMed] [Green Version]
  56. Pergolizzi, B.; Bracco, E.; Bozzaro, S. A new HECT ubiquitin ligase regulating chemotaxis and development in Dictyostelium discoideum. J. Cell Sci. 2017, 130, 551–562. [Google Scholar] [CrossRef] [Green Version]
  57. Pergolizzi, B.; Bozzaro, S.; Bracco, E. Dictyostelium as model for studying ubiquitination and deubiquitination. Int. J. Dev. Biol. 2019, 63, 529–539. [Google Scholar] [CrossRef] [Green Version]
  58. Naujokat, C.; Tomo, T.; Tomošarić, T. Concise review: Role and function of the ubiquitin-proteasome system in mammalian stem and progenitor cells. Stem Cells 2007, 25, 2408–2418. [Google Scholar] [CrossRef] [PubMed]
  59. Saez, I.; Koyuncu, S.; Gutierrez-Garcia, R.; Dieterich, C.; Vilchez, D. Insights into the ubiquitin-proteasome system of human embryonic stem cells. Sci. Rep. 2018, 8, 4092. [Google Scholar] [CrossRef] [Green Version]
  60. Moran-Crusio, K.; Reavie, L.B.; Aifantis, I. Regulation of hematopoietic stem cell fate by the ubiquitin proteasome system. Trends Immunol. 2012, 33, 357–363. [Google Scholar] [CrossRef] [PubMed] [Green Version]
  61. Deschênes-Simard, X.; Lessard, F.; Gaumont-Leclerc, M.F.; Bardeesy, N.; Ferbeyre, G. Cellular senescence and protein degradation: Breaking down cancer. Cell Cycle 2014, 13, 1840. [Google Scholar] [CrossRef] [Green Version]
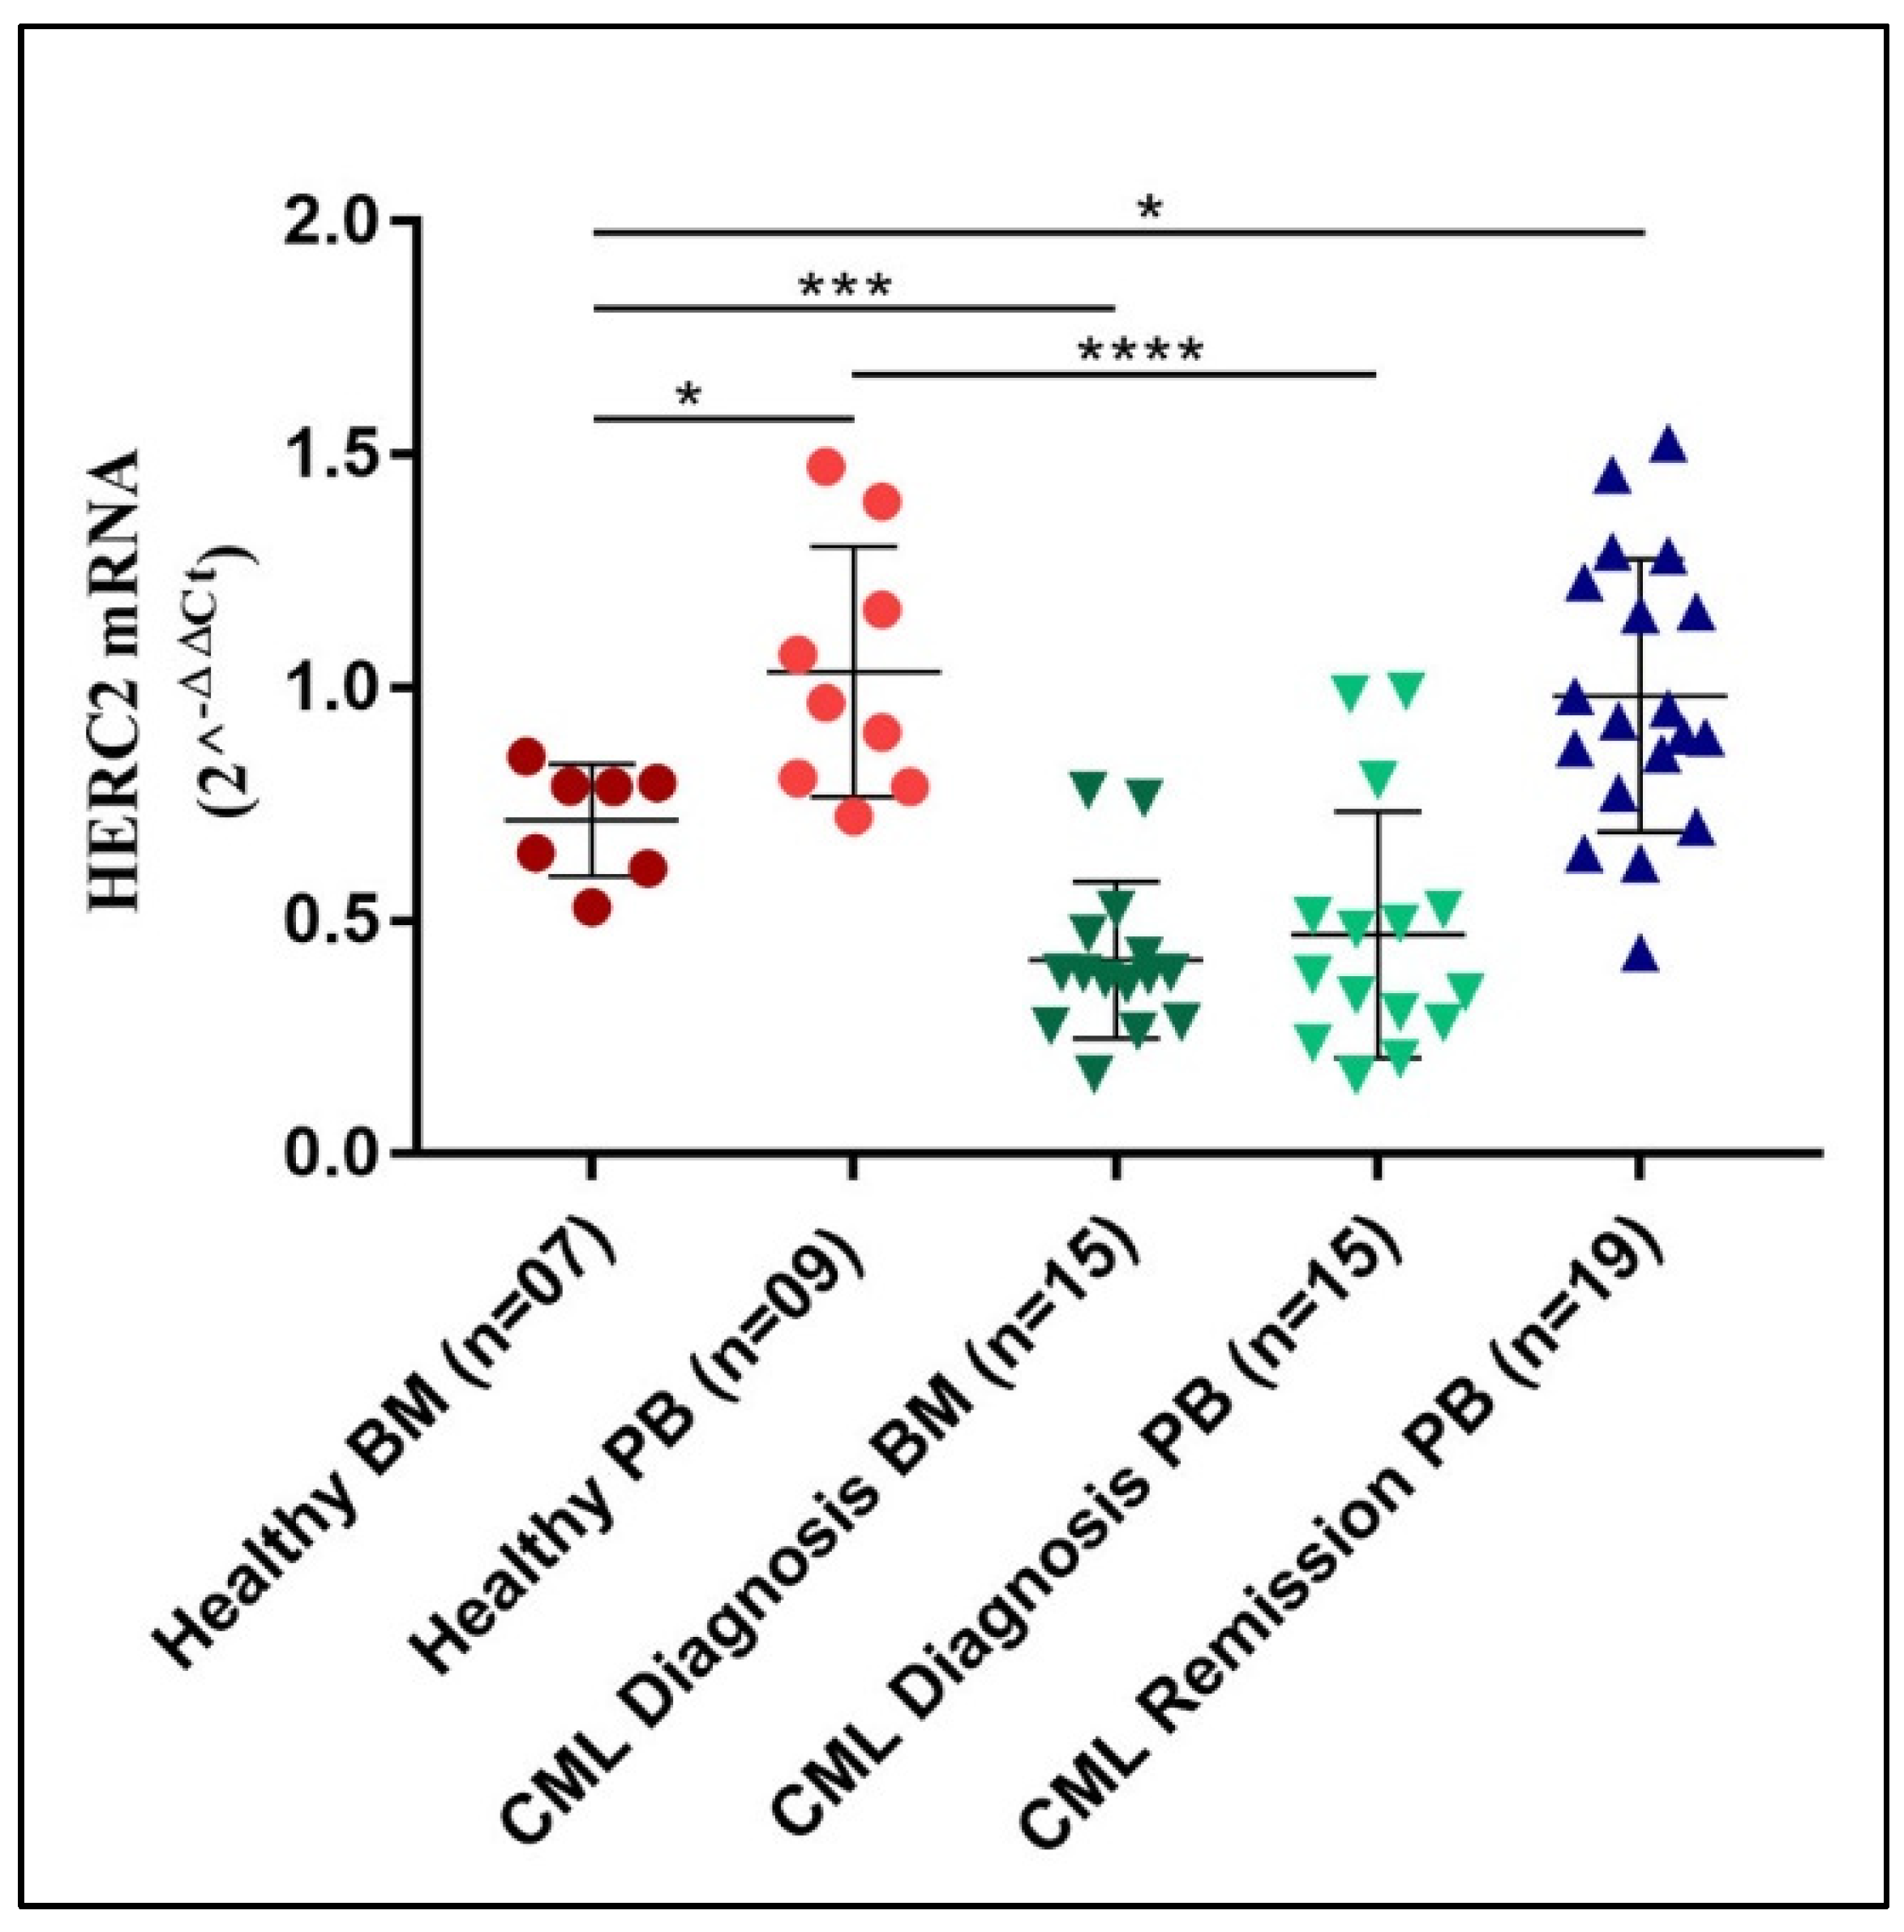
Figure 1. HERC2 gene expression is differentially regulated PB and BM from healthy subjects, and it is down-modulated in newly diagnosed CML patients. HERC2 gene was differentially expressed in BM and PB specimens from healthy subjects, displaying a significantly lower transcript amount in BM. When compared to the controls, newly diagnosed CML patients showed lower HERC2 mRNA levels, both in PB and BM samples. Remarkably, when CML patients reached remission, the HERC2 gene expression raised again to levels comparable to those encountered of healthy donors. p ≤ 0.05 = *; p ≤ 0.001 = ***; p ≤ 0.0001 = ****.
Jcm 11 00324 g001
Figure 2. The kinetic evolution of the HERC1 and HERC2 transcript levels in CML patients treated with Imatinib and Dasatinib. Independently from the TKIs therapy regimens, both HERC1 and HERC2 displayed a transcript accumulation kinetic that was rather comparable. In all cases, the gene expression levels increased over the time elapsed from diagnosis to at least the complete cytogenetic remission (12 months), reaching values comparable to those of healthy subjects. While upon Imatinib treatment, the HERC1 (A) and HERC2 (C) gene transcripts accumulation followed an approximately growing linear trend; with Dasatinib, the HERC1 (B) and HERC2 (D) accumulation differed substantially, being significantly delayed. Red and different color symbols represent BM and PB, respectively, in each time point of CML specimens. p ≤ 0.05 = *; p ≤ 0.01 = **; p ≤ 0.001 = ***; p ≤ 0.0001 = ****.
Jcm 11 00324 g002
Figure 3. Gene expression correlation analyses among HERC1, HERC2, and BCR-ABL from CML patients treated with two different TKIs. The scatter plots and Spearman coefficient (rho) showed the correlations occurring among the BCR-ABL, HERC1, and HERC2 transcripts in CML patients’ specimens collected at different time points starting from the beginning of the Imatinib (A) and Dasatinib (B) treatments up to 12 months (0, 3, 6, and 12). Values are expressed either as 2−∆∆Ct for both HERC1 and HERC2 and as I.S. for BCR-ABL, respectively. Each blue and red solid circle refers to a patient who has been treated either with Imatinib or with Dasatinib, respectively.
Jcm 11 00324 g003
Figure 4. Effect of Imatinib and Dasatinib treatment on HERC1 and HERC2 expression in primary CML and K562 (Ph+) cells. The HERC1 and HERC2 gene expressions following Imatinib (1 μM) and Dasatinib (0.25 µM) treatment were determined at mRNA and protein level by RT-qPCR (A,C,E,F), immunofluorescence (B,D), and Western Blotting (G). Imatinib (1 µM) and Dasatinib (0.25 µM) treated K-562 cells (24 h) showed an increase in HERC1 gene expression both at mRNA and protein levels compared to non-treated cells, in contrast, an increase in HERC2 mRNA was observed without any change in its protein level. TKIs impaired the phosphorylation (enzymatic actively) of BCR-ABL, which indicates the HERC1 protein and mRNA levels of both HERCs are modulated by the activity of Bcr-Abl1. Vinculin was used as a loading control in Western blot. p ≤ 0.05 = *; p ≤ 0.01 = **.
Jcm 11 00324 g004
Figure 5. Leukemic cells’ differentiation towards the erythroid and megakaryocyte-like lineages antagonistically affect the HERC1 levels. Differentiation was performed by incubating Ph+ K562 myeloid leukemia cell lines with 250 nM phorbol 12 myristate 13-acetate (PMA) and 20 U/mL Erythropoietin (EPO). (A) Representative pictures of the morphology of uninduced control and differentiated cells; (B) K562 cells were harvested after 48 h with or without EPO induction and stained with benzidine. Benzidine-positive cells turned blue, indicated with red arrows. Untreated K562 cells served as a control. (C,D) Representative cell morphology images and flow cytometry analysis of PMA treated K562 cells. Prior flow cytometry cells were stained for megakaryocyte-specific cell surface marker CD61. (E,F) Expression changes in HERC1 gene at mRNA and protein level in non-treated, EPO, and PMA induced K562 cells. An increase in HERC1 protein and mRNA level was seen in EPO-treated K562 cells, while a decrease in HERC1 gene expression was observed in PMA treated cells. (G) Interestingly, there is not any change in HERC2 protein level in K562 differentiated cells. p ≤ 0.05 = *; p ≤ 0.01 = **.
Jcm 11 00324 g005
Table 1. Baseline characteristics of healthy subjects and CML patients.
GroupsTKI Therapy Dosage
(mg/d)
No. of SamplesAgeGenderBCR-ABL (IS) % at OnsetRearrangementMutations
RangeMedianMFRangeMedianp190p210p230Ex8/Int8
Control/1621–63 3697//////
Imatinib4001537–83548736.5–137.069.50/15 #/2
Dasatinib1001421–7263.510442.0–174.072.00/14 ##/1
# 2 out of 15 patients have coexistence of p210(b3a2) and p210(b2a2), ## 1 out of 14 patients have coexistence of p210(b3a2) and p210(b2a2). M = Male, F = Female.
Publisher’s Note: MDPI stays neutral with regard to jurisdictional claims in published maps and institutional affiliations.