


Relationship between the Blood Urea Nitrogen to Creatinine Ratio and In-Hospital Mortality in Non-Traumatic Subarachnoid Hemorrhage Patients: Based on Propensity Score Matching Method

Abstract
:1. Introduction
2. Materials and Methods
2.1. Data Sources
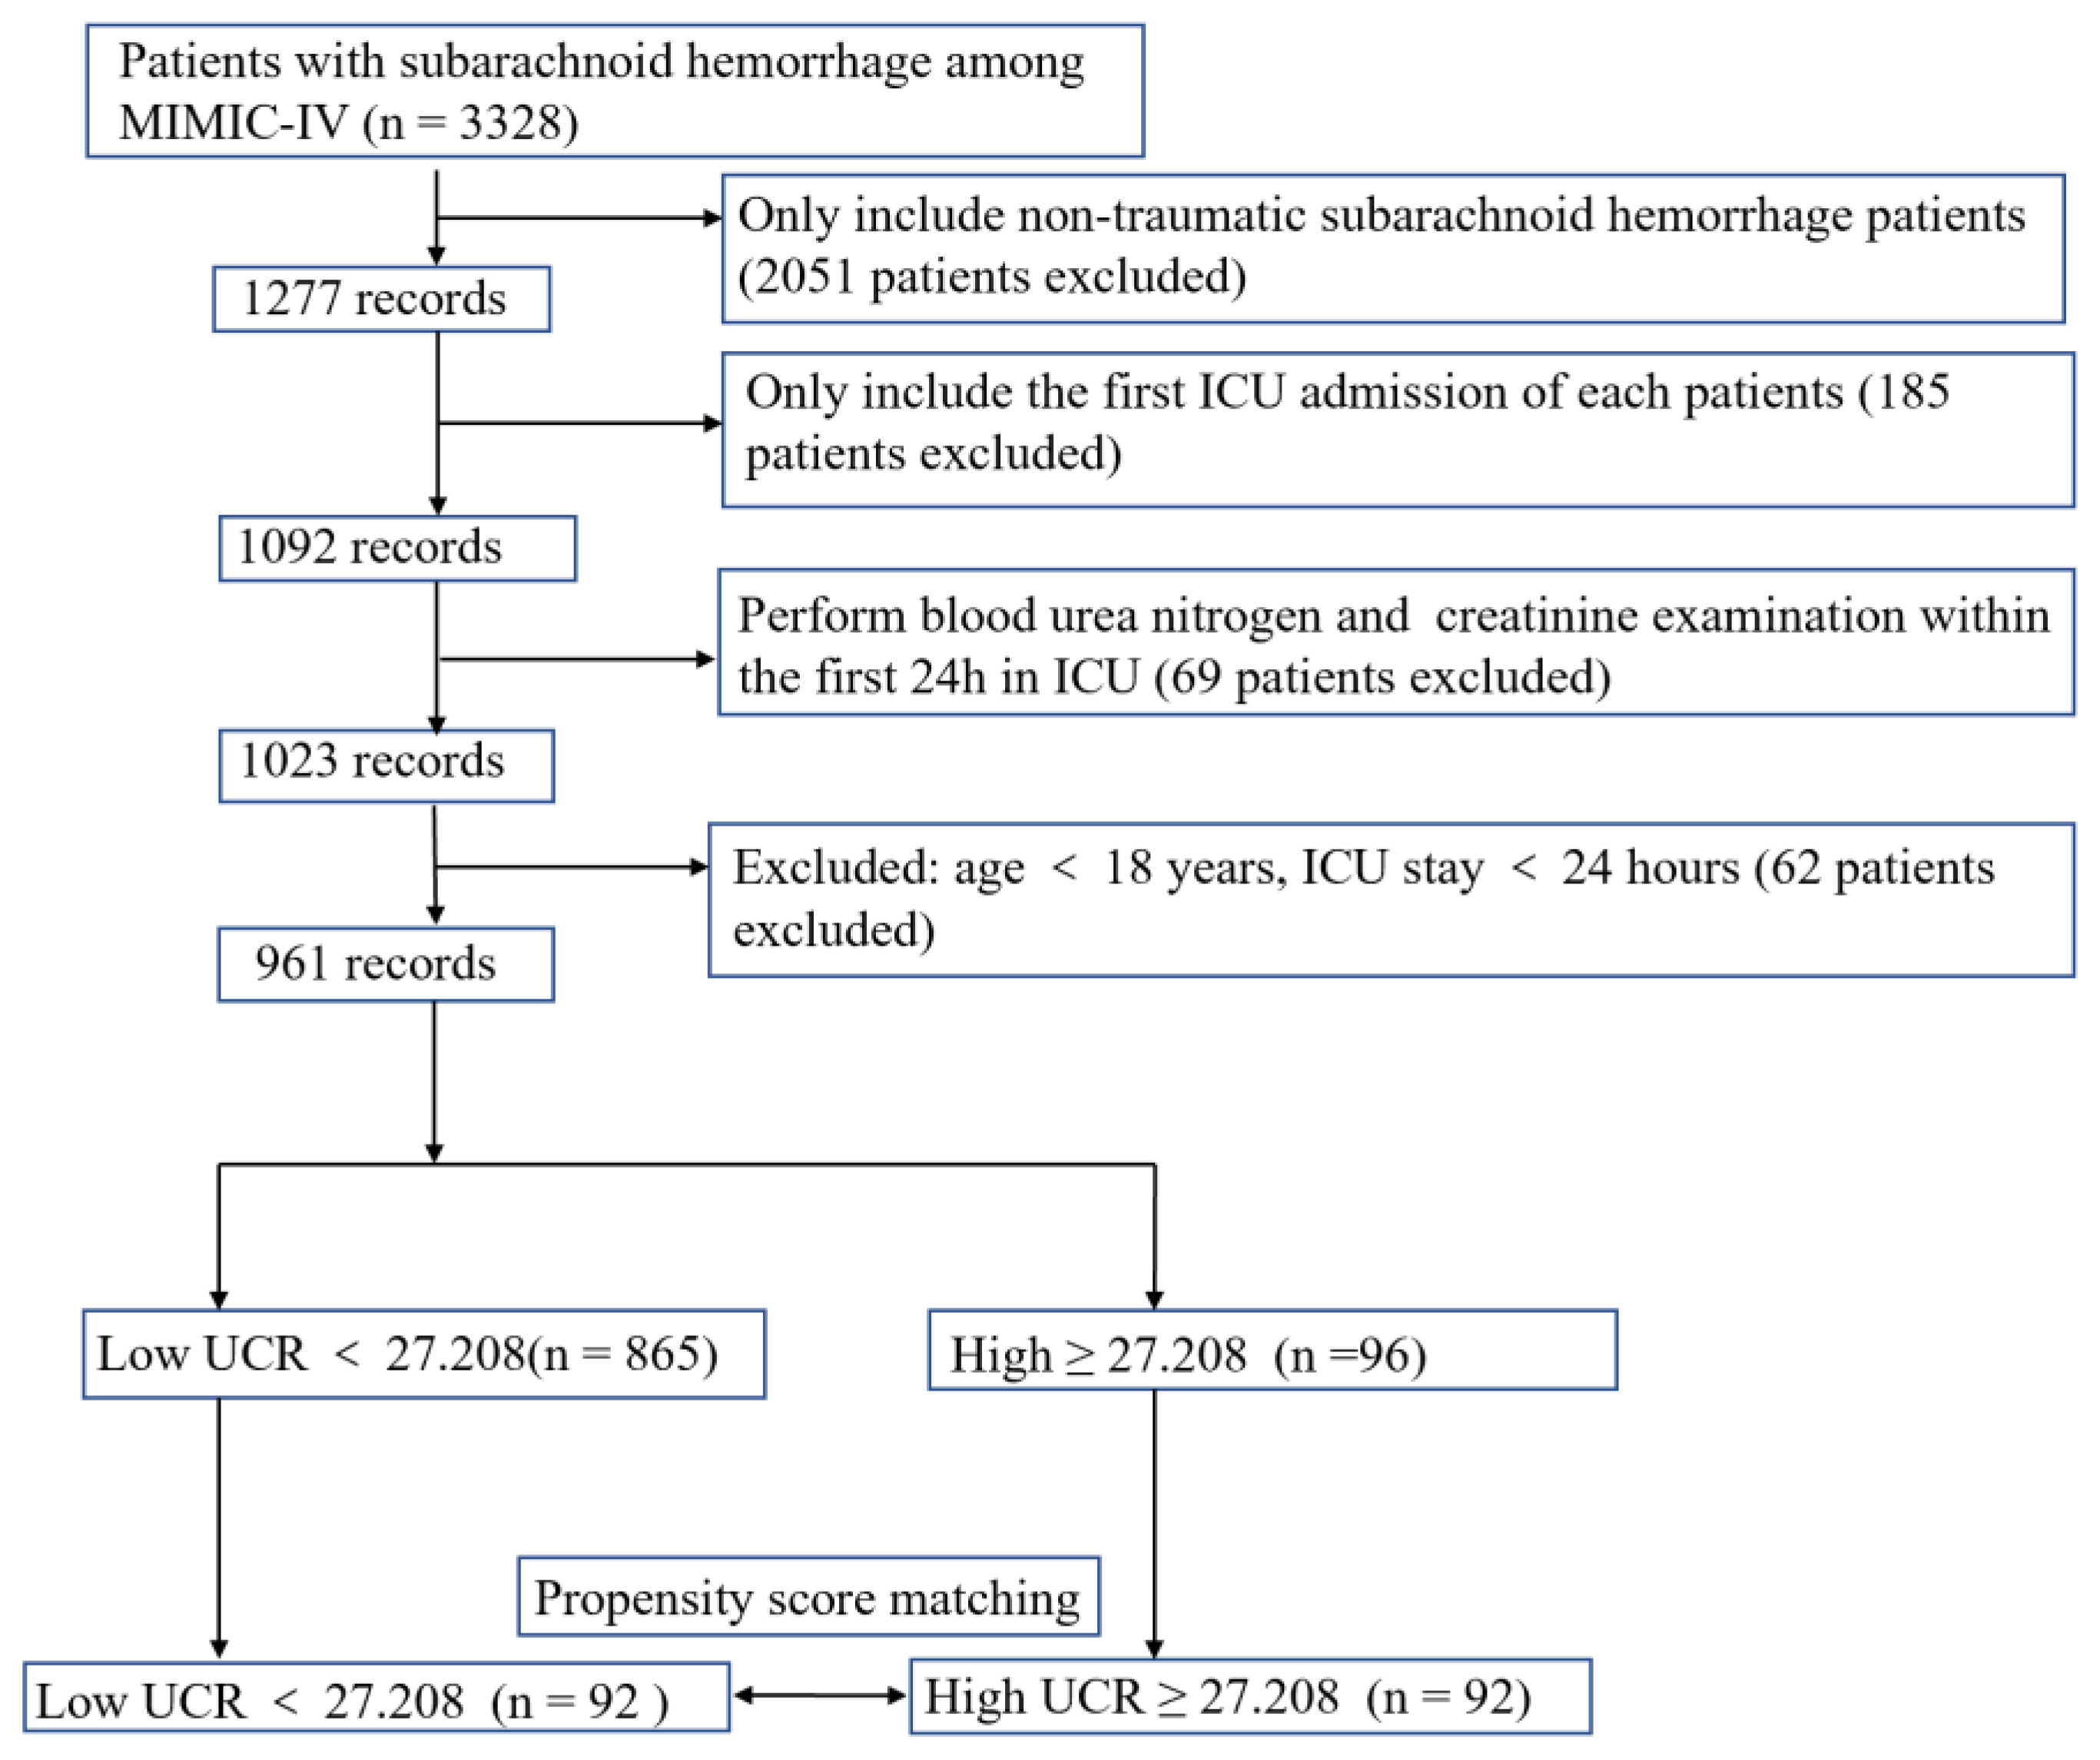
2.2. Study Population
2.3. Data Extraction
2.4. Endpoints
2.5. Statistical Analysis
3. Results
3.1. Data Sources
3.2. Clinical Characteristics of Study Subjects
3.3. The Prognostic Significance of UCR before PSM
3.4. Association between UCR and in-Hospital Mortality in Non-Traumatic Subarachnoid Hemorrhage Patients before PSM
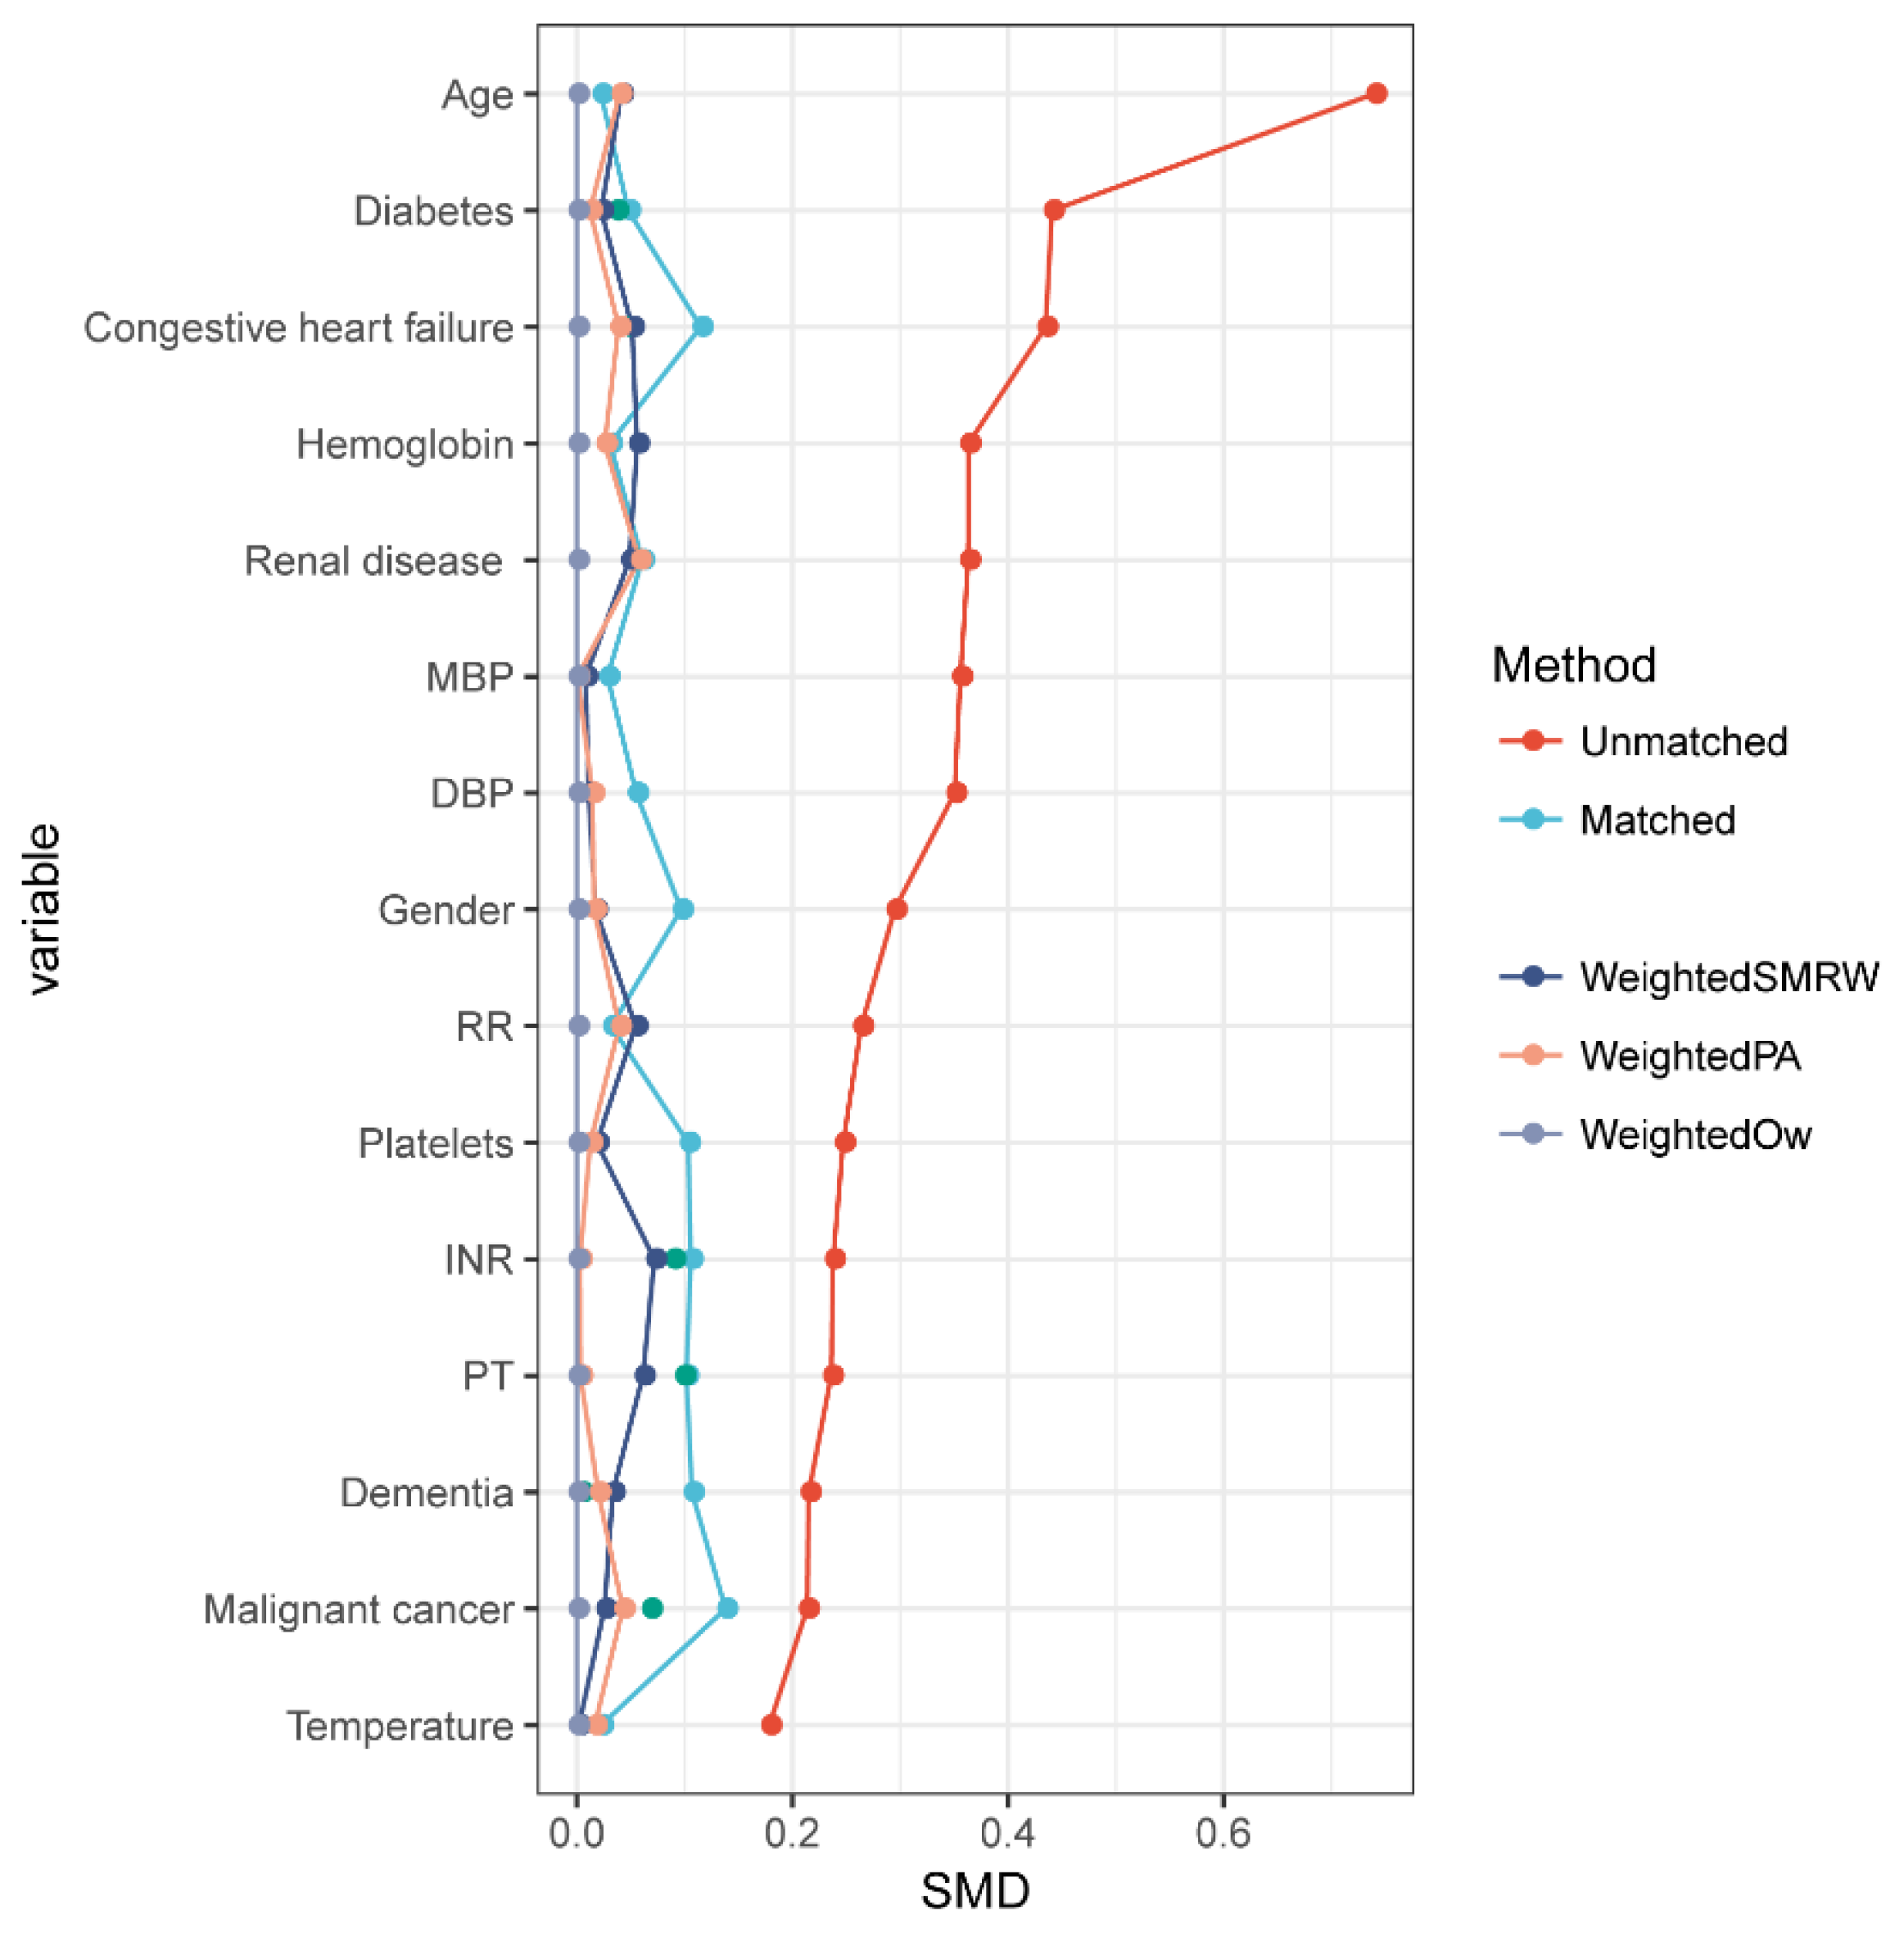
3.5. The Results of PSM
3.6. The Clinical Characteristics of Non-Traumatic Subarachnoid Hemorrhage Patients after PSM
3.7. Association between UCR and in-Hospital Mortality in Non-Traumatic Subarachnoid Hemorrhage Patients after PSM
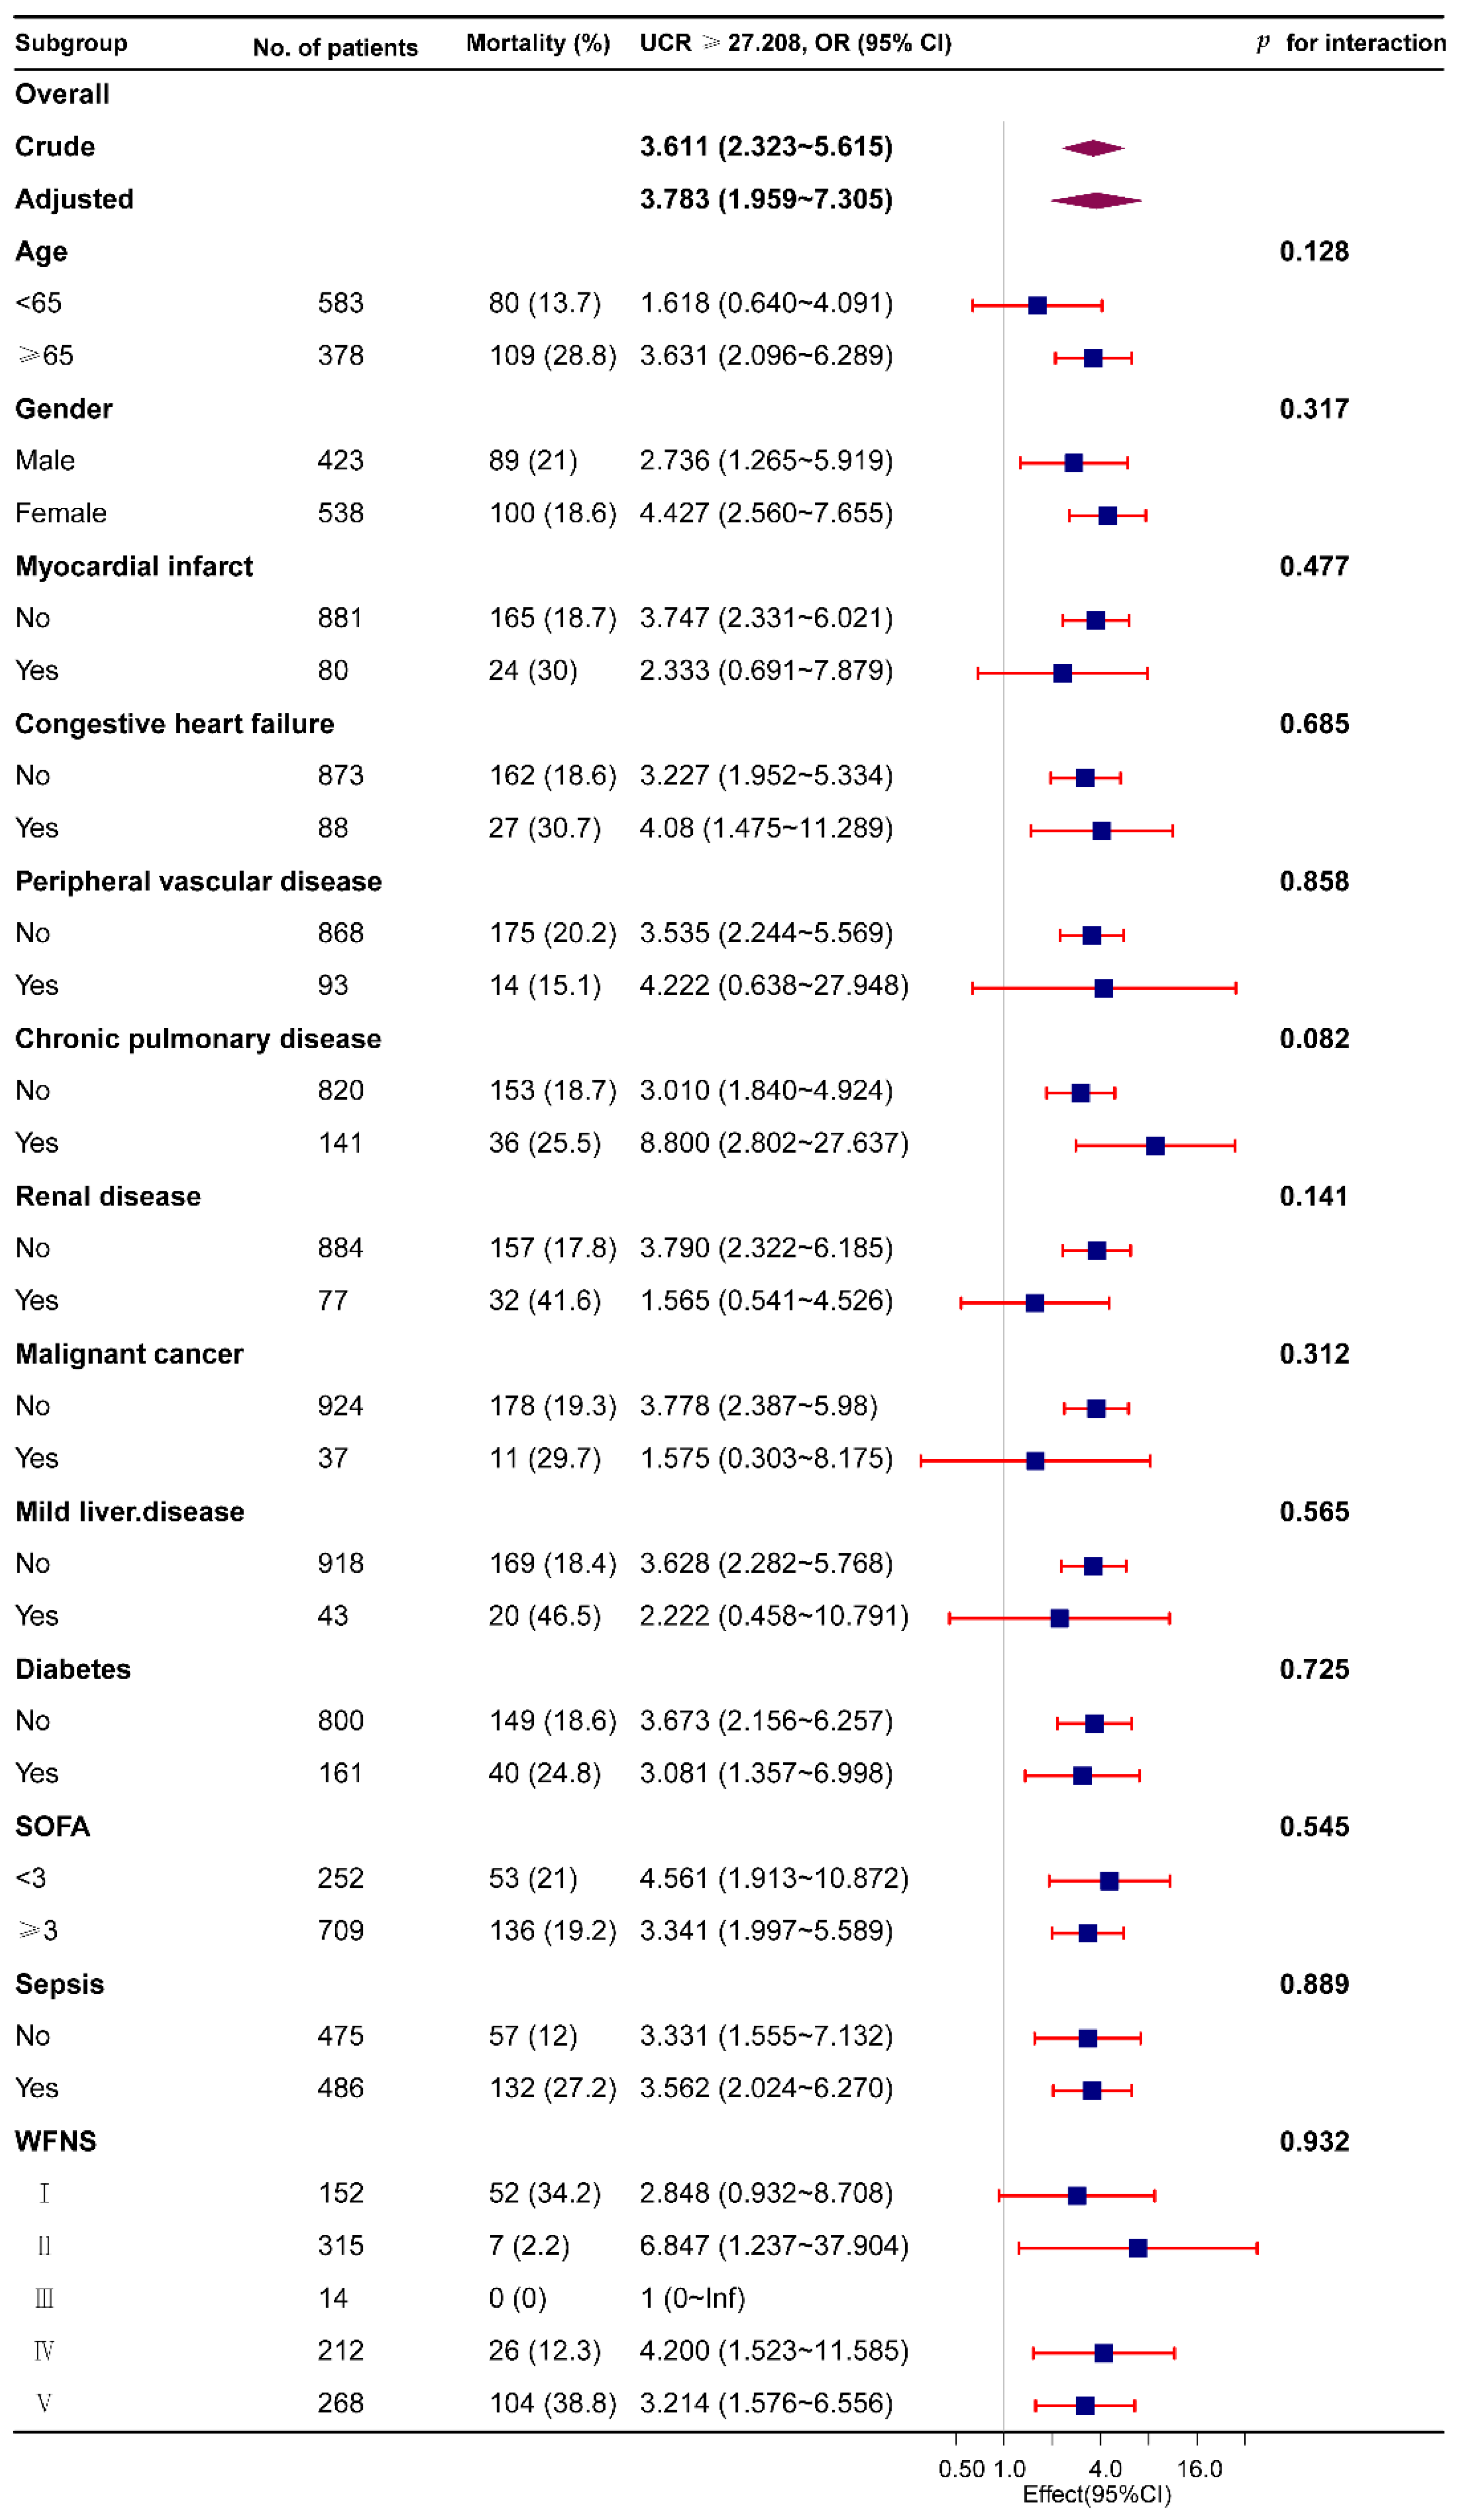
3.8. Subgroup Analysis
4. Discussion
5. Conclusions
Supplementary Materials
Author Contributions
Funding
Institutional Review Board Statement
Informed Consent Statement
Data Availability Statement
Acknowledgments
Conflicts of Interest
Abbreviations
References
- Vergouwen, M.D.; Jong-Tjien-Fa, A.V.; Algra, A.; Rinkel, G.J. Time trends in causes of death after aneurysmal subarachnoid hemorrhage: A hospital-based study. Neurology 2016, 86, 59–63. [Google Scholar] [CrossRef] [PubMed]
- Peng, R.; Liu, K.; Li, W.; Yuan, Y.; Niu, R.; Zhou, L.; Xiao, Y.; Gao, H.; Yang, H.; Zhang, C.; et al. Blood urea nitrogen, blood urea nitrogen to creatinine ratio and incident stroke: The Dongfeng-Tongji cohort. Atherosclerosis 2021, 333, 1–8. [Google Scholar] [CrossRef] [PubMed]
- Chen, L.; Chen, L.; Zheng, H.; Wu, S.; Wang, S. The association of blood urea nitrogen levels upon emergency admission with mortality in acute exacerbation of chronic obstructive pulmonary disease. Chron. Respir. Dis. 2021, 18, 14799731211060051. [Google Scholar] [CrossRef] [PubMed]
- Liu, E.Q.; Zeng, C.L. Blood Urea Nitrogen and In-Hospital Mortality in Critically Ill Patients with Cardiogenic Shock: Analysis of the MIMIC-III Database. Biomed. Res. Int. 2021, 2021, 5948636. [Google Scholar] [CrossRef] [PubMed]
- Aronson, D.; Hammerman, H.; Beyar, R.; Yalonetsky, S.; Kapeliovich, M.; Markiewicz, W.; Goldberg, A. Serum blood urea nitrogen and long-term mortality in acute ST-elevation myocardial infarction. Int. J. Cardiol. 2008, 127, 380–385. [Google Scholar] [CrossRef] [PubMed]
- Li, X.; Li, T.; Wang, J.; Dong, G.; Zhang, M.; Xu, Z.; Hu, Y.; Xie, B.; Yang, J.; Wang, Y. Higher blood urea nitrogen level is independently linked with the presence and severity of neonatal sepsis. Ann. Med. 2021, 53, 2192–2198. [Google Scholar] [CrossRef] [PubMed]
- Bacigalupo, A.; Oneto, R.; Bruno, B.; Soracco, M.; Lamparelli, T.; Gualandi, F.; Occhini, D.; Raiola, A.; Mordini, N.; Berisso, G.; et al. Early predictors of transplant-related mortality (TRM) after allogeneic bone marrow transplants (BMT): Blood urea nitrogen (BUN) and bilirubin. Bone Marrow Transpl. 1999, 24, 653–659. [Google Scholar] [CrossRef] [Green Version]
- Han, D.; Zhang, L.; Zheng, S.; Xu, F.; Li, C.; Yang, R.; Ma, W.; Yin, H.; Lyu, J. Prognostic Value of Blood Urea Nitrogen/Creatinine Ratio for Septic Shock: An Analysis of the MIMIC-III Clinical Database. Biomed. Res. Int. 2021, 2021, 5595042. [Google Scholar] [CrossRef] [PubMed]
- Jiang, W.F.; Deng, M.L. Prognostic impact of blood urea nitrogen/creatinine ratio changes in patients with acute ischemic stroke. Clin. Neurol. Neurosurg. 2022, 215, 107204. [Google Scholar] [CrossRef] [PubMed]
- Lin, C.J.; Yang, J.T.; Huang, Y.C.; Tsai, Y.H.; Lee, M.H.; Lee, M.; Hsiao, C.T.; Hsiao, K.Y.; Lin, L.C. Favorable outcome of blood urea nitrogen/creatinine-based hydration therapy 3 months after acute ischemic stroke. Am. J. Emerg. Med. 2016, 34, 2414–2418. [Google Scholar] [CrossRef] [PubMed]
- Matsue, Y.; van der Meer, P.; Damman, K.; Metra, M.; O’Connor, C.M.; Ponikowski, P.; Teerlink, J.R.; Cotter, G.; Davison, B.; Cleland, J.G.; et al. Blood urea nitrogen-to-creatinine ratio in the general population and in patients with acute heart failure. Heart 2017, 103, 407–413. [Google Scholar] [CrossRef] [PubMed]
- Zhen, Z.; Liang, W.; Tan, W.; Dong, B.; Wu, Y.; Liu, C.; Xue, R. Prognostic significance of blood urea nitrogen/creatinine ratio in chronic HFpEF. Eur. J. Clin. Investig. 2022, 52, e13761. [Google Scholar] [CrossRef] [PubMed]
- Johnson, A.; Bulgarelli, L.; Pollard, T.; Horng, S.; Celi, L.A.; Mark, R. MIMIC-IV (version 1.0). PhysioNet. 2021. Available online: https://physionet.org/content/mimiciv/1.0/ (accessed on 4 October 2022).
- Skrivankova, V.W.; Richmond, R.C.; Woolf, B.A.R.; Yarmolinsky, J.; Davies, N.M.; Swanson, S.A.; VanderWeele, T.J.; Higgins, J.P.T.; Timpson, N.J.; Dimou, N.; et al. Strengthening the Reporting of Observational Studies in Epidemiology Using Mendelian Randomization: The STROBE-MR Statement. JAMA 2021, 326, 1614–1621. [Google Scholar] [CrossRef] [PubMed]
- Li, L.; Greene, T. A weighting analogue to pair matching in propensity score analysis. Int. J. Biostat. 2013, 9, 215–234. [Google Scholar] [CrossRef] [PubMed]
- Brookhart, M.A.; Wyss, R.; Layton, J.B.; Sturmer, T. Propensity score methods for confounding control in nonexperimental research. Circ. Cardiovasc. Qual. Outcomes 2013, 6, 604–611. [Google Scholar] [CrossRef] [PubMed] [Green Version]
- Austin, P.C.; Stuart, E.A. Moving towards best practice when using inverse probability of treatment weighting (IPTW) using the propensity score to estimate causal treatment effects in observational studies. Stat. Med. 2015, 34, 3661–3679. [Google Scholar] [CrossRef] [PubMed] [Green Version]
- Cheng, C.; Li, F.; Thomas, L.E.; Li, F.F. Addressing Extreme Propensity Scores in Estimating Counterfactual Survival Functions via the Overlap Weights. Am. J. Epidemiol. 2022, 191, 1140–1151. [Google Scholar] [CrossRef]
- Austin, P.C. An Introduction to Propensity Score Methods for Reducing the Effects of Confounding in Observational Studies. Multivar. Behav. Res. 2011, 46, 399–424. [Google Scholar] [CrossRef] [PubMed] [Green Version]
- Deng, L.; Wang, C.; Qiu, S.; Bian, H.; Wang, L.; Li, Y.; Wu, B.; Liu, M. Association between Blood Urea Nitrogen-to-creatinine Ratio and Three-Month Outcome in Patients with Acute Ischemic Stroke. Curr. Neurovasc. Res. 2019, 16, 166–172. [Google Scholar] [CrossRef]
- Bhatia, K.; Mohanty, S.; Tripathi, B.K.; Gupta, B.; Mittal, M.K. Predictors of early neurological deterioration in patients with acute ischaemic stroke with special reference to blood urea nitrogen (BUN)/creatinine ratio & urine specific gravity. Indian J. Med. Res. 2015, 141, 299–307. [Google Scholar] [CrossRef] [PubMed]
- Zhu, X.; Cheang, I.; Liao, S.; Wang, K.; Yao, W.; Yin, T.; Lu, X.; Zhou, Y.; Zhang, H.; Li, X. Blood Urea Nitrogen to Creatinine Ratio and Long-Term Mortality in Patients with Acute Heart Failure: A Prospective Cohort Study and Meta-Analysis. Cardiorenal Med. 2020, 10, 415–428. [Google Scholar] [CrossRef] [PubMed]
- Lin, L.C.; Lee, J.D.; Hung, Y.C.; Chang, C.H.; Yang, J.T. Bun/creatinine ratio-based hydration for preventing stroke-in-evolution after acute ischemic stroke. Am. J. Emerg. Med. 2014, 32, 709–712. [Google Scholar] [CrossRef] [PubMed]
- Cortes-Vicente, E.; Guisado-Alonso, D.; Delgado-Mederos, R.; Camps-Renom, P.; Prats-Sanchez, L.; Martinez-Domeno, A.; Marti-Fabregas, J. Frequency, Risk Factors, and Prognosis of Dehydration in Acute Stroke. Front. Neurol. 2019, 10, 305. [Google Scholar] [CrossRef] [PubMed]


| Variables | Total (n = 961) | Survival (n = 772) | Non-Survival (n = 189) | p-Value |
|---|---|---|---|---|
| Demographic | ||||
| Female, n (%) | 538 (56.0) | 438 (56.7) | 100 (52.9) | 0.342 |
| Age, years | 60.0 (51.0, 72.0) | 58.5 (50.0, 70.0) | 68.0 (56.0, 79.0) | <0.001 |
| Ethnicity, n (%) | <0.001 | |||
| Asian | 36 (3.7) | 23 (3) | 13 (6.9) | |
| White | 580 (60.4) | 499 (64.6) | 81 (42.9) | |
| Other | 345 (35.9) | 250 (32.4) | 95 (50.3) | |
| Vital signs | ||||
| HR, beats/minute | 78.0 (71.0, 87.0) | 77.0 (70.0, 86.0) | 82.0 (75.0, 92.0) | <0.001 |
| SBP, mmHg | 125.0 (115.0, 133.0) | 125.0 (115.0, 133.0) | 126.0 (116.0, 134.0) | 0.741 |
| DBP, mmHg | 64.0 (58.0, 69.0) | 64.0 (58.0, 69.0) | 62.0 (57.0, 70.0) | 0.136 |
| MBP, mmHg | 82.0 (76.0, 88.0) | 82.0 (76.0, 88.0) | 81.0 (76.0, 88.0) | 0.582 |
| RR, times/minute | 18.0 (16.0, 20.0) | 17.0 (16.0, 19.0) | 19.0 (17.0, 21.0) | <0.001 |
| Temperature, °C | 37.0 (36.8, 37.3) | 37.0 (36.8, 37.2) | 37.0 (36.6, 37.5) | 0.842 |
| SpO2, % | 98.0 (96.0, 99.0) | 98.0 (96.0, 99.0) | 98.0 (97.0, 99.0) | 0.001 |
| Comorbidities, n (%) | ||||
| Myocardial infarction | 80 (8.3) | 56 (7.3) | 24 (12.7) | 0.015 |
| Congestive heart failure | 88 (9.2) | 61 (7.9) | 27 (14.3) | 0.006 |
| Peripheral vascular disease | 93 (9.7) | 79 (10.2) | 14 (7.4) | 0.239 |
| Chronic pulmonary disease | 141 (14.7) | 105 (13.6) | 36 (19) | 0.058 |
| Peptic ulcer disease | 6 (0.6) | 4 (0.5) | 2 (1.1) | 0.336 |
| Paraplegia | 156 (16.2) | 124 (16.1) | 32 (16.9) | 0.772 |
| Renal disease | 77 (8.0) | 45 (5.8) | 32 (16.9) | <0.001 |
| Malignant cancer | 37 (3.9) | 26 (3.4) | 11 (5.8) | 0.116 |
| Mild liver disease | 43 (4.5) | 23 (3) | 20 (10.6) | <0.001 |
| Diabetes | 161 (16.8) | 121 (15.7) | 40 (21.2) | 0.07 |
| Vasospasm | 80 (8.3) | 75 (9.7) | 5 (2.6) | 0.002 |
| DCI | 66 (6.9) | 60 (7.8) | 6 (3.2) | 0.025 |
| Sepsis | 486 (50.6) | 354 (45.9) | 132 (69.8) | <0.001 |
| Laboratory results | ||||
| Urea nitrogen, mg/dL | 13.0 (10.0, 18.0) | 13.0 (10.0, 17.0) | 18.0 (13.0, 28.0) | <0.001 |
| Creatinine, mg/dL | 0.8 (0.6, 1.0) | 0.8 (0.6, 0.9) | 1.0 (0.7, 1.3) | <0.001 |
| UCR | 17.0 (13.3, 21.8) | 16.7 (13.3, 21.4) | 18.0 (13.8, 25.0) | 0.006 |
| Hemoglobin, g/L | 12.9 (11.6, 14.1) | 13.0 (11.8, 14.2) | 12.5 (10.9, 14.1) | 0.032 |
| Platelets, 109/L | 227.0 (184.0, 280.0) | 230.0 (189.0, 281.0) | 219.0 (152.0, 272.0) | <0.001 |
| WBC, 109/L | 12.9 (9.7, 16.6) | 12.5 (9.4, 15.9) | 15.2 (11.6, 19.7) | <0.001 |
| Anion gap, mmol/L | 16.0 (14.0, 18.0) | 16.0 (14.0, 18.0) | 18.0 (15.0, 20.0) | <0.001 |
| Bicarbonate, mmol/L | 24.0 (22.0, 26.0) | 24.0 (22.0, 26.0) | 23.0 (21.0, 26.0) | 0.039 |
| Calcium, mg/dL | 8.7 (8.3, 9.2) | 8.7 (8.4, 9.1) | 8.7 (8.2, 9.2) | 0.855 |
| Chloride, mmol/L | 107.0 (104.0, 110.0) | 107.0 (104.0, 109.0) | 109.0 (105.0, 116.0) | <0.001 |
| Sodium, mmol/L | 141.0 (139.0, 144.0) | 141.0 (139.0, 143.0) | 144.0 (140.0, 149.0) | <0.001 |
| INR | 1.1 (1.1, 1.2) | 1.1 (1.1, 1.2) | 1.2 (1.1, 1.4) | <0.001 |
| PT, s | 12.6 (11.8, 13.8) | 12.5 (11.7, 13.5) | 13.6 (12.3, 15.8) | <0.001 |
| APTT, s | 29.0 (26.1, 33.5) | 28.7 (25.9, 32.8) | 30.2 (26.8, 37.2) | 0.003 |
| ALT, IU/L | 78.0 (32.0, 78.0) | 78.0 (42.0, 78.0) | 78.0 (25.0, 78.0) | 0.007 |
| AST, U/L | 127.0 (45.0, 127.0) | 127.0 (52.0, 127.0) | 127.0 (37.0, 127.0) | 0.118 |
| Glucose, mg/dL | 131.5 (112.5, 156.3) | 128.0 (109.8, 150.0) | 151.6 (126.0, 187.8) | <0.001 |
| Scores | ||||
| OASIS | 31.0 (25.0, 40.0) | 29.0 (23.0, 37.0) | 41.0 (35.0, 46.0) | <0.001 |
| GCS | 13.0 (7.0, 14.0) | 13.0 (8.0, 14.0) | 7.0 (3.0, 15.0) | <0.001 |
| SOFA | 3.0 (2.0, 3.0) | 3.0 (2.0, 3.0) | 3.0 (2.0, 4.0) | 0.001 |
| WFNS Grade, n (%) | <0.001 | |||
| I | 152 (15.8) | 100 (13) | 52 (27.5) | |
| II | 315 (32.8) | 308 (39.9) | 7 (3.7) | |
| II | 14 (1.5) | 14 (1.8) | 0 (0) | |
| IV | 212 (22.1) | 186 (24.1) | 26 (13.8) | |
| V | 268 (27.9) | 164 (21.2) | 104 (55) | |
| Outcomes | ||||
| Length of ICU stay, days | 12.0 (7.0, 20.0) | 13.0 (8.0, 21.0) | 5.0 (2.0, 13.0) | <0.001 |
| Length of hospital stay, days | 7.0 (3.0, 13.0) | 7.0 (3.0, 13.0) | 4.0 (2.0, 10.0) | <0.001 |
| Characteristic | Before PSM | |||
|---|---|---|---|---|
| All Patients | Low UCR < 27.208 | High UCR ≥ 27.208 | p | |
| N | 961 | 865 | 96 | |
| Demographic | ||||
| Female, n (%) | 538 (56.0) | 472 (54.6) | 66 (68.8) | 0.008 |
| Age, years | 60.0 (51.0, 72.0) | 59.0 (50.0, 70.0) | 74.0 (61.0, 80.0) | <0.001 |
| Ethnicity, n (%) | 0.161 | |||
| Asian | 36 (3.7) | 29 (3.4) | 7 (7.3) | |
| White | 580 (60.4) | 522 (60.3) | 58 (60.4) | |
| Other | 345 (35.9) | 314 (36.3) | 31 (32.3) | |
| Vital signs | ||||
| HR, beats/minute | 78.0 (71.0, 87.0) | 78.0 (70.0, 87.0) | 81.5 (71.0, 92.0) | 0.047 |
| SBP, mmHg | 125.0 (115.0, 133.0) | 125.0 (115.0, 133.0) | 124.5 (116.0, 132.2) | 0.523 |
| DBP, mmHg | 64.0 (58.0, 69.0) | 64.0 (58.0, 70.0) | 60.0 (55.8, 66.0) | <0.001 |
| MBP, mmHg | 82.0 (76.0, 88.0) | 82.0 (76.0, 88.0) | 78.0 (75.0, 83.0) | <0.001 |
| RR, times/minute | 18.0 (16.0, 20.0) | 18.0 (16.0, 20.0) | 18.5 (17.0, 20.0) | 0.015 |
| Temperature, °C | 37.0 (36.8, 37.3) | 37.0 (36.8, 37.3) | 36.9 (36.7, 37.1) | 0.013 |
| SpO2, % | 98.0 (96.0, 99.0) | 98.0 (96.0, 99.0) | 98.0 (96.0, 99.0) | 0.571 |
| Comorbidities, n (%) | ||||
| Myocardial infarction | 80 (8.3) | 67 (7.7) | 13 (13.5) | 0.051 |
| Congestive heart failure | 88 (9.2) | 66 (7.6) | 22 (22.9) | <0.001 |
| Peripheral vascular disease | 93 (9.7) | 88 (10.2) | 5 (5.2) | 0.119 |
| Dementia | 17 (1.8) | 12 (1.4) | 5 (5.2) | 0.021 |
| Paraplegia | 156 (16.2) | 147 (17) | 9 (9.4) | 0.055 |
| Renal disease | 77 (8.0) | 59 (6.8) | 18 (18.8) | <0.001 |
| Malignant cancer | 37 (3.9) | 29 (3.4) | 8 (8.3) | 0.025 |
| Mild liver disease | 43 (4.5) | 35 (4) | 8 (8.3) | 0.066 |
| Diabetes | 161 (16.8) | 129 (14.9) | 32 (33.3) | <0.001 |
| DCI | 66 (6.9) | 64 (7.4) | 2 (2.1) | 0.051 |
| Sepsis | 486 (50.6) | 429 (49.6) | 57 (59.4) | 0.069 |
| Vasospasm, n (%) | 80 (8.3) | 77 (8.9) | 3 (3.1) | 0.052 |
| Laboratory results | ||||
| Hemoglobin, g/L | 12.9 (11.6, 14.1) | 13.0 (11.7, 14.2) | 12.2 (10.3, 13.6) | <0.001 |
| Platelets, 109/L | 227.0 (184.0, 280.0) | 229.0 (187.0, 283.0) | 209.5 (154.8, 251.2) | <0.001 |
| WBC, 109/L | 12.9 (9.7, 16.6) | 12.9 (9.6, 16.6) | 12.4 (9.9, 16.9) | 0.658 |
| Anion gap, mmol/L | 16.0 (14.0, 18.0) | 16.0 (14.0, 18.0) | 16.0 (14.8, 19.0) | 0.095 |
| Bicarbonate, mmol/L | 24.0 (22.0, 26.0) | 24.0 (22.0, 26.0) | 25.0 (23.0, 26.0) | 0.083 |
| Calcium, mg/dL | 8.7 (8.3, 9.2) | 8.7 (8.3, 9.2) | 8.8 (8.3, 9.3) | 0.478 |
| Chloride, mmol/L | 107.0 (104.0, 110.0) | 107.0 (104.0, 110.0) | 107.0 (103.0, 112.0) | 0.919 |
| Sodium, mmol/L | 141.0 (139.0, 144.0) | 141.0 (139.0, 143.0) | 141.0 (138.0, 146.0) | 0.520 |
| INR | 1.1 (1.1, 1.2) | 1.1 (1.1, 1.2) | 1.2 (1.1, 1.4) | <0.001 |
| PT, s | 12.6 (11.8, 13.8) | 12.6 (11.7, 13.7) | 13.2 (12.0, 15.3) | 0.003 |
| APTT, s | 29.0 (26.1, 33.5) | 28.9 (26.0, 33.2) | 29.5 (26.6, 34.7) | 0.406 |
| ALT, IU/L | 78.0 (32.0, 78.0) | 78.0 (32.0, 78.0) | 78.0 (31.8, 78.0) | 0.686 |
| AST, U/L | 127.0 (45.0, 127.0) | 127.0 (45.0, 127.0) | 127.0 (43.8, 127.0) | 0.443 |
| Glucose, mg/dL | 131.5 (112.5, 156.3) | 131.3 (112.0, 154.3) | 135.1 (116.5, 169.6) | 0.097 |
| Scores | ||||
| SOFA | 3.0 (2.0, 3.0) | 3.0 (2.0, 3.0) | 3.0 (2.8, 3.0) | 0.162 |
| GCS | 13.0 (7.0, 14.0) | 13.0 (7.0, 14.0) | 10.0 (6.0, 13.0) | 0.006 |
| OASIS | 31.0 (25.0, 40.0) | 31.0 (24.0, 39.0) | 37.5 (29.8, 44.0) | <0.001 |
| WFNS, n (%) | 0.01 | |||
| I | 152 (15.8) | 138 (16) | 14 (14.6) | |
| II | 315 (32.8) | 296 (34.2) | 19 (19.8) | |
| III | 14 (1.5) | 11 (1.3) | 3 (3.1) | |
| IV | 212 (22.1) | 190 (22) | 22 (22.9) | |
| V | 268 (27.9) | 230 (26.6) | 38 (39.6) | |
| Outcomes | ||||
| In-hospital mortality, n (%) | 189 (19.7) | 148 (17.1) | 41 (42.7) | <0.001 |
| Length of ICU stay, days | 12.0 (7.0, 20.0) | 12.0 (7.0, 20.0) | 11.0 (5.0, 19.0) | 0.195 |
| Length of hospital stay, days | 7.0 (3.0, 13.0) | 7.0 (3.0, 13.0) | 5.5 (2.0, 11.2) | 0.093 |
| Characteristic | Crude Model | Model I | Model II | Model III | ||||
|---|---|---|---|---|---|---|---|---|
| OR (95% CI) | p-Value | OR (95% CI) | p-Value | OR (95% CI) | p-Value | OR (95% CI) | p-Value | |
| Before PSM | ||||||||
| UCR | 1.038 (1.018~1.059) | <0.001 | 1.030 (1.008~1.052) | 0.0071 | 1.031 (1.009~1.054) | 0.0062 | 1.038 (1.009~1.068) | 0.0102 |
| Low UCR (<27.208) | 1(Ref) | 1(Ref) | 1(Ref) | 1(Ref) | ||||
| High UCR (≥27.208) | 3.611 (2.323~5.615) | <0.001 | 3.110 (1.937~4.995) | <0.001 | 2.979 (1.818~4.844) | <0.001 | 3.783 (1.959~7.305) | <0.001 |
| After PSM | ||||||||
| UCR | 1.039 (1.008~1.071) | 0.0014 | 1.036 (1.003~1.070) | 0.0326 | 1.041 (1.006~1.078) | 0.0215 | 1.066 (1.011~1.124) | 0.0189 |
| Low UCR (<27.208) | 1 (Ref) | 1 (Ref) | 1 (Ref) | 1 (Ref) | ||||
| High UCR (≥27.208) | 2.995 (1.540~5.671) | 0.0011 | 3.082 (1.515~6.271) | 0.0019 | 3.634 (1.673~7.892) | 0.0011 | 10.161 (2.691~38.368) | <0.001 |
| Characteristic | After PSM | |||
|---|---|---|---|---|
| All Patients | Low UCR < 27.208 | High UCR ≥ 27.208 | p | |
| N | 184 | 92 | 92 | |
| Demographic | ||||
| Female, n (%) | 132 (71.7) | 68 (73.9) | 64 (69.6) | 0.513 |
| Age, years | 72.0 (60.0, 81.0) | 72.0 (59.8, 81.0) | 72.5 (60.8, 80.0) | 0.781 |
| Ethnicity, n (%) | 0.092 | |||
| Asian | 8 (4.3) | 1 (1.1) | 7 (7.6) | |
| White | 113 (61.4) | 57 (62) | 56 (60.9) | |
| Other | 63 (34.2) | 34 (37) | 29 (31.5) | |
| Vital signs | ||||
| HR, beats/minute | 79.5 (71.0, 90.0) | 78.5 (71.8, 88.2) | 81.5 (71.0, 92.2) | 0.326 |
| SBP, mmHg | 124.0 (116.0, 132.0) | 124.0 (115.8, 129.0) | 125.5 (116.0, 133.2) | 0.489 |
| DBP, mmHg | 61.0 (56.0, 66.2) | 62.0 (56.8, 67.0) | 60.0 (55.8, 66.0) | 0.439 |
| MBP, mmHg | 78.0 (74.0, 84.0) | 79.0 (74.0, 86.0) | 78.0 (74.8, 83.0) | 0.878 |
| RR, times/minute | 18.0 (17.0, 21.0) | 18.0 (17.0, 21.0) | 19.0 (17.0, 20.0) | 0.838 |
| Temperature, °C | 37.0 (36.7, 37.3) | 37.0 (36.8, 37.3) | 36.9 (36.7, 37.1) | 0.152 |
| SpO2, % | 97.0 (96.0, 99.0) | 97.0 (96.0, 99.0) | 97.0 (96.0, 99.0) | 0.684 |
| Comorbidities, n (%) | ||||
| Myocardial infarction | 21 (11.4) | 11 (12) | 10 (10.9) | 0.817 |
| Congestive heart failure | 32 (17.4) | 14 (15.2) | 18 (19.6) | 0.437 |
| Peripheral vascular disease | 12 (6.5) | 7 (7.6) | 5 (5.4) | 0.55 |
| Cerebrovascular disease | 184 (100.0) | 92 (100) | 92 (100) | 1 |
| Dementia | 8 (4.3) | 5 (5.4) | 3 (3.3) | 0.72 |
| Paraplegia | 31 (16.8) | 22 (23.9) | 9 (9.8) | 0.01 |
| Renal disease | 28 (15.2) | 13 (14.1) | 15 (16.3) | 0.681 |
| Malignant cancer | 11 (6.0) | 4 (4.3) | 7 (7.6) | 0.351 |
| Mild liver disease | 12 (6.5) | 4 (4.3) | 8 (8.7) | 0.232 |
| Diabetes | 54 (29.3) | 26 (28.3) | 28 (30.4) | 0.746 |
| Hypertension | 4 (1.1) | 2 (1.1) | 2 (1.1) | 1 |
| DCI | 7 (3.8) | 5 (5.4) | 2 (2.2) | 0.444 |
| Sepsis | 103 (56.0) | 50 (54.3) | 53 (57.6) | 0.656 |
| Vasospasm, n (%) | 6 (3.3) | 3 (3.3) | 3 (3.3) | 1 |
| Laboratory results | ||||
| Hemoglobin, g/L | 12.4 (10.9, 13.6) | 12.6 (11.4, 13.3) | 12.3 (10.7, 13.7) | 0.680 |
| Platelets, 109/L | 210.0 (159.0, 255.2) | 209.0 (162.5, 265.0) | 210.0 (156.8, 251.2) | 0.468 |
| WBC, 109/L | 13.2 (10.2, 17.1) | 13.3 (10.5, 16.9) | 12.8 (10.0, 17.2) | 0.986 |
| Anion gap, mmol/L | 16.0 (14.0, 18.2) | 16.5 (14.0, 18.0) | 16.0 (14.0, 19.0) | 0.605 |
| Bicarbonate, mmol/L | 25.0 (22.0, 26.0) | 25.0 (22.0, 27.0) | 25.0 (23.0, 26.0) | 0.293 |
| Calcium, mg/dL | 8.8 (8.3, 9.3) | 8.8 (8.3, 9.3) | 8.8 (8.3, 9.3) | 0.964 |
| Chloride, mmol/L | 107.0 (103.0, 111.0) | 108.0 (104.0, 109.2) | 107.0 (103.0, 112.2) | 0.970 |
| Sodium, mmol/L | 141.0 (139.0, 144.0) | 141.0 (139.0, 144.0) | 141.0 (138.0, 146.0) | 0.826 |
| INR | 1.2 (1.1, 1.3) | 1.2 (1.1, 1.3) | 1.2 (1.1, 1.3) | 0.990 |
| PT, s | 13.2 (11.9, 14.9) | 13.3 (11.9, 14.8) | 13.2 (12.0, 14.9) | 1.000 |
| APTT, s | 29.2 (26.5, 34.1) | 29.1 (26.4, 34.0) | 29.4 (26.6, 34.4) | 0.847 |
| ALT, IU/L | 78.0 (25.0, 78.0) | 78.0 (22.2, 78.0) | 78.0 (31.0, 78.0) | 0.417 |
| AST, U/L | 127.0 (36.8, 127.0) | 127.0 (35.8, 127.0) | 127.0 (42.8, 127.0) | 0.146 |
| Glucose, mg/dL | 138.5 (117.3, 169.2) | 141.6 (116.4, 166.9) | 135.1 (118.6, 169.2) | 0.833 |
| Scores | ||||
| SOFA | 3.0 (2.8, 3.0) | 3.0 (2.8, 3.0) | 3.0 (2.8, 3.0) | 0.863 |
| GCS | 10.0 (7.0, 14.0) | 10.0 (7.0, 14.0) | 9.0 (6.0, 13.0) | 0.161 |
| OASIS | 37.0 (29.0, 44.0) | 36.5 (29.0, 44.0) | 37.0 (29.0, 43.5) | 0.600 |
| WFNS, n (%) | 0.142 | |||
| I | 27 (14.7) | 14 (15.2) | 13 (14.1) | |
| II | 40 (21.7) | 24 (26.1) | 16 (17.4) | |
| III | 3 (1.6) | 0 (0) | 3 (3.3) | |
| IV | 49 (26.6) | 27 (29.3) | 22 (23.9) | |
| V | 65 (35.3) | 27 (29.3) | 38 (41.3) | |
| Outcomes | ||||
| In-hospital mortality, n (%) | 59 (32.1) | 19 (20.7) | 40 (43.5) | < 0.001 |
| Length of ICU stay, days | 6.0 (3.0, 13.0) | 6.0 (3.0, 13.2) | 6.0 (2.0, 12.0) | 0.321 |
| Length of hospital stay, days | 11.0 (5.0, 19.2) | 11.5 (6.0, 21.0) | 10.5 (5.0, 18.2) | 0.449 |
| Analysis | In-Hospital Mortality | p Value |
|---|---|---|
| No. of results/no. of patients at risk (%) | <0.001 | |
| Low UCR (<27.208) | 148/865 (17.1) | |
| High UCR (≥27.208) | 41/96 (42.7) | |
| Crude analysis-odds ratio (95% CI) | 3.611 (2.323~5.615) | <0.001 |
| Multivariable analysis-odds ratio (95% CI) | 2.663 (1.627~4.359) | <0.001 |
| Adjusted propensity score | 2.594 (1.615~4.164) | <0.001 |
| With SMRW | 2.536 (1.642~3.916) | <0.001 |
| With PA | 2.502 (1.335~4.689) | 0.0042 |
| With OW | 2.431 (1.203~4.912) | 0.0133 |
Publisher’s Note: MDPI stays neutral with regard to jurisdictional claims in published maps and institutional affiliations. |
© 2022 by the authors. Licensee MDPI, Basel, Switzerland. This article is an open access article distributed under the terms and conditions of the Creative Commons Attribution (CC BY) license (https://creativecommons.org/licenses/by/4.0/).
Share and Cite
Chen, Z.; Wang, J.; Yang, H.; Li, H.; Chen, R.; Yu, J. Relationship between the Blood Urea Nitrogen to Creatinine Ratio and In-Hospital Mortality in Non-Traumatic Subarachnoid Hemorrhage Patients: Based on Propensity Score Matching Method. J. Clin. Med. 2022, 11, 7031. https://doi.org/10.3390/jcm11237031
Chen Z, Wang J, Yang H, Li H, Chen R, Yu J. Relationship between the Blood Urea Nitrogen to Creatinine Ratio and In-Hospital Mortality in Non-Traumatic Subarachnoid Hemorrhage Patients: Based on Propensity Score Matching Method. Journal of Clinical Medicine. 2022; 11(23):7031. https://doi.org/10.3390/jcm11237031
Chicago/Turabian StyleChen, Zirong, Junhong Wang, Hongkuan Yang, Hua Li, Rudong Chen, and Jiasheng Yu. 2022. "Relationship between the Blood Urea Nitrogen to Creatinine Ratio and In-Hospital Mortality in Non-Traumatic Subarachnoid Hemorrhage Patients: Based on Propensity Score Matching Method" Journal of Clinical Medicine 11, no. 23: 7031. https://doi.org/10.3390/jcm11237031
APA StyleChen, Z., Wang, J., Yang, H., Li, H., Chen, R., & Yu, J. (2022). Relationship between the Blood Urea Nitrogen to Creatinine Ratio and In-Hospital Mortality in Non-Traumatic Subarachnoid Hemorrhage Patients: Based on Propensity Score Matching Method. Journal of Clinical Medicine, 11(23), 7031. https://doi.org/10.3390/jcm11237031