Article

Impact of Frailty Risk on Adverse Outcomes after Traumatic Brain Injury: A Historical Cohort Study

1
Department of Rehabilitation Medicine, Mie University Graduate School of Medicine, Tsu 514-8507, Japan
2
Department of Rehabilitation, Mie University Hospital, Tsu 514-8507, Japan
3
Department of Nutrition, Hamamatsu Medicine University Hospital, Hamamatsu 431-3192, Japan
4
Department of Health Science, Faculty of Health and Human Development, The University of Nagano, Nagano 380-8525, Japan
*
Author to whom correspondence should be addressed.
J. Clin. Med. 2022, 11(23), 7064; https://doi.org/10.3390/jcm11237064
Submission received: 15 October 2022 / Revised: 23 November 2022 / Accepted: 27 November 2022 / Published: 29 November 2022
(This article belongs to the Section Endocrinology & Metabolism)

Abstract

:
We evaluated the utility of the Hospital Frailty Risk Score (HFRS) as a predictor of adverse events after hospitalization in a retrospective analysis of traumatic brain injury (TBI). This historical cohort study analyzed the data of patients hospitalized with TBI between April 2014 and August 2020 who were registered in the JMDC database. We used HFRS to classify the patients into the low- (HFRS < 5), intermediate- (HFRS5-15), and high- (HFRS > 15)-frailty risk groups. Outcomes were the length of hospital stay, the number of patients with Barthel Index score ≥ 95 on, Barthel Index gain, and in-hospital death. We used logistic and linear regression analyses to estimate the association between HFRS and outcome in TBI. We included 18,065 patients with TBI (mean age: 71.8 years). Among these patients, 10,139 (56.1%) were in the low-frailty risk group, 7388 (40.9%) were in the intermediate-frailty risk group, and 538 (3.0%) were in the high-frailty risk group. The intermediate- and high-frailty risk groups were characterized by longer hospital stays than the low-frailty risk group (intermediate-frailty risk group: coefficient 1.952, 95%; confidence interval (CI): 1.117–2.786; high-frailty risk group: coefficient 5.770; 95% CI: 3.160–8.379). The intermediate- and high-frailty risk groups were negatively associated with a Barthel Index score ≥ 95 on discharge (intermediate-frailty risk group: odds ratio 0.645; 95% CI: 0.595–0.699; high-frailty risk group: odds ratio 0.221; 95% CI: 0.157–0.311) and Barthel Index gain (intermediate-frailty risk group: coefficient −4.868, 95% CI: −5.599–−3.773; high-frailty risk group: coefficient −19.596, 95% CI: −22.242–−16.714). The intermediate- and high-frailty risk groups were not associated with in-hospital deaths (intermediate-frailty risk group: odds ratio 0.901; 95% CI: 0.766–1.061; high-frailty risk group: odds ratio 0.707; 95% CI: 0.459–1.091). We found that HFRS could predict adverse outcomes during hospitalization in TBI patients.

1. Introduction

Traumatic brain injury (TBI) is one of the most severe types of injury in terms of both morbidity and long-term impact on survivors [1,2]. According to the Centers for Disease Control and Prevention, there were approximately 223,135 TBI-related hospitalizations in 2019 and 64,362 TBI-related deaths in 2020 [3]. TBI-related mortality rates increased over the ten years from 2008 to 2017 [3]. Patients with severe TBI could have long-term or life-long disabilities [3]. TBI results in long-term societal costs, and initiatives to improve prognosis and reduce societal costs after TBI have been reported [2,4].
TBI is closely associated with frailty [5]. TBI can be caused by falls, traffic accidents, and other injuries, with falls causing approximately half of all TBIs [6]. The Centers for Disease Control and Prevention reported that TBI-related emergency hospitalizations in 2014 were the highest among seniors aged ≥ 75 years [6]. Frailty is a condition in which motor and cognitive functions decline with age, and falls related to frailty are particularly common in the older population [5,7]. Additionally, frailty has several characteristics that affect TBI management and outcomes, including multimorbidity and polypharmacy [8].
Recently, the Hospital Frailty Risk Score (HFRS), based on the 10th revision of the International Classification of Diseases (ICD-10) diagnostic codes, has been developed and reported to be useful for identifying patients at high risk for adverse outcomes [9]. HFRS is calculated based on 109 ICD-10 codes, with specific weights applied to each code. HFRS could be implemented in most hospital information systems with less time and at a low cost [9,10]. HFRS has been reported to predict frailty and adverse outcomes in the general population [9,10].
Assessment of the risk of frailty in patients with TBI could help predict and prevent adverse outcomes. Several studies have predicted prognosis using the frailty scale for TBI [11,12,13,14]. Some studies used frailty assessment scales based on medication and biochemical examination data [11,12,13], which are difficult to calculate automatically. One study [14] assessed frailty based on 11 comorbidities; however, this was reported to be less accurate at predicting adverse events than a frailty assessment scale based on a larger number of comorbidities [15]. Therefore, we focused on HFRS, which can be calculated automatically in the presence of several comorbidities. To the best of our knowledge, HFRS has not been investigated for its potential to predict adverse outcomes in TBI. We hypothesized that patients with TBI at a higher risk of frailty, as calculated by HFRS, would have longer hospital stays, more deaths, and lower activities of daily living (ADL) independence than patients with TBI at a lower risk of frailty. The purpose of this cohort study was to evaluate the utility of HFRS as a predictor of adverse events after TBI.

2. Materials and Methods

2.1. Ethical Considerations

This study used data from a hospital-based database created by the JMDC. The requirement for obtaining patient informed consent was waived because the data provided by JMDC was de-identified and unlinked to personal information. This database is generally available; hence, the ethics committee of Mie University determined that no ethical review was required.

2.2. Data Source

This retrospective cohort study is observational research using the JMDC database. The JMDC database has been accumulating medical fee data from multiple health insurance societies since 2005 [16,17]. The database includes individual health insurance claims from >60 insurers: the cumulative population size amounts to approximately 14 million people (as of February 2022) [18]. The database includes Diagnostic Procedure Combination data, which was introduced to Japan in 2003 as a system to pay for medical care [19]. The Diagnostic Procedure Combination database is a national database of acute inpatient admissions in Japan. The data include sex, age, ICD-10 diagnostic codes, surgical information, length of stay (LOS), Barthel Index (BI), and other information [20].

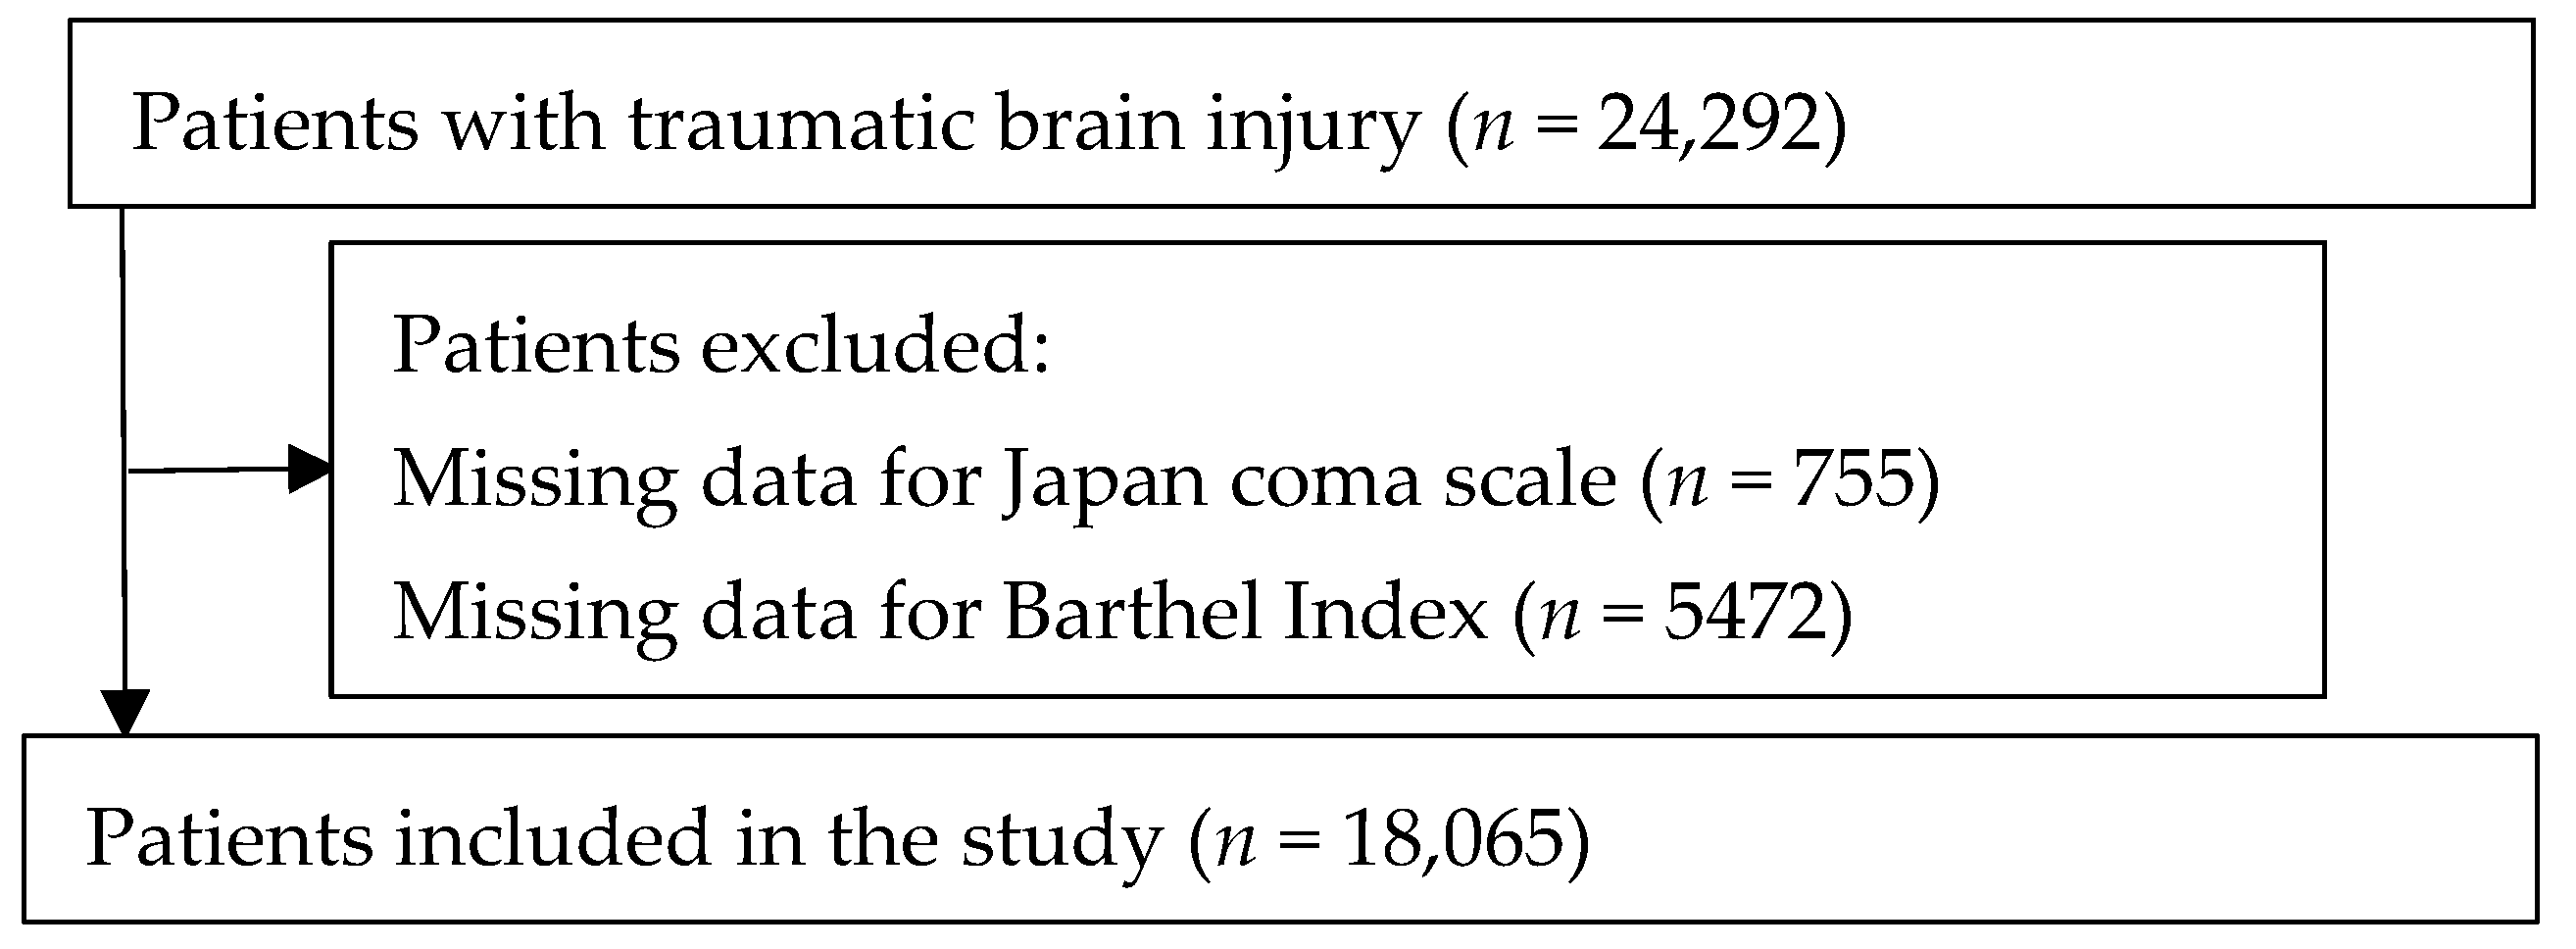
2.3. Study Population

Disease diagnosis data in the Diagnosis Procedure Combination database are classified with ICD-10 codes recorded by the attending physician. This study analyzed the data for the period from April 2014 to August 2020 from patients hospitalized due to TBI (ICD-10 code S60). We excluded patients with missing Japan coma scale (JCS) score data at admission, BI at discharge, and BI at admission.

2.4. Calculation of HFRS

We calculated HFRS at the time of hospitalization for patients admitted with a diagnosis of TBI [9]. This Frailty index was developed and endorsed using data from 1 million patients aged > 74 years [9]. HFRS is calculated by summing points assigned to each of the 109 ICD-10 codes. HFRS in this study is calculated from the comorbidities of each patient at admission. HFRS comprises 31 comorbidities, including dementia, delirium, neuropathy, pneumonia, urinary tract disorders, hypotension, fractures, and motor dysfunction [9]. HFRS assigns different points to each code, with higher scores indicating greater frailty risk [9]. In HFRS, the cutoff point for frailty is reported to be ≥ 5 [9]. We used HFRS to classify patients into the low- (HFRS < 5), intermediate- (HFRS 5–15), and high- (HFRS > 15) frailty risk groups.

2.5. Variables and Outcomes

The variables used in this study were as follows: sex, age, body mass index, type of TBI (diffuse TBI S062, focal TBI S063, epidural hemorrhage S064, traumatic subdural hemorrhage S065, traumatic subarachnoid hemorrhage S066, and other injury types), neurosurgical surgery on admission, ventilator use on admission, intensive care unit management on admission, JCS score at admission, BI at admission, inpatient rehabilitation services received, number of drugs taken during hospitalization, the mean number of complications occurring during hospitalization, number of beds, and year of admission. Surgery includes craniotomy. The JCS is a widely used tool in Japan to assess the level of consciousness, which is classified as follows: alert (0), dull (1-digit code: 1, 2, 3), somnolence (2-digit code: 10, 20, 30), and coma (3-digit code: 100, 200, 300) [21]. The BI is used to assess a patient’s ability to perform ADL; a higher BI score indicates greater independence in ADL [22].
In this study, the outcomes were LOS, BI score ≥ 95 on, BI gain, and hospital death. BI gain was determined as the BI score at discharge less the BI score on admission. BI is considered fully independent, with BI score ≥ 95 on discharge [22].

2.6. Statistical Analysis

We compared the outcomes between the low-, intermediate-, and high-frailty risk groups. The data were expressed as absolute values and percentages for categorical data and mean ± standard deviation for continuous data. The χ2 test was used to determine differences among the three groups. Differences in the frailty risk among the three groups were analyzed using the one-way analysis of variance. We performed multivariate logistic and multiple linear regression analyses to adjust for confounding factors. The covariates adjusted were sex, age, body mass index, type of TBI, surgery on admission, ventilator use on admission, intensive care unit management on admission, JCS score at admission, BI at admission, inpatient rehabilitation services received, number of drugs administered during hospitalization, number of complications that occurred during hospitalization, number of beds, and year of admission. Statistical analyses were performed using SPSS software (version 25.0; IBM Japan, Tokyo, Japan). Statistical significance was set at p < 0.05.

3. Results

We included 18,065 patients who were hospitalized due to TBI, who did not have missing data on JCS score at admission, BI at admission, and BI at discharge (Figure 1). Patients were classified into the low- (10,139 (56.1%)), intermediate- (7388 (40.9%)), and high- (538 (3.0%)) frailty risk groups based on HFRS.
Table 1 shows the characteristics of the study participants. The high-frailty risk group had more women, a lower JCS score and BI on admission, and a higher proportion of patients aged > 75 years than the low- and intermediate-frailty risk groups.
Table 2 shows the results of outcome comparisons among the groups. The frailty risk was significantly associated with LOS, the number of patients with BI score ≥ 95 on discharge, BI gain, and the number of in-hospital deaths.
Table 3 shows the results of the multiple linear regression analyses on HFRS. The intermediate- and high-frailty risk groups were characterized by longer hospital stays than the low-frailty risk group (intermediate-frailty risk group: coefficient 1.952, 95% CI: 1.117–2.786; high-frailty risk group: coefficient 5.770, 95% CI: 3.160–8.379). The intermediate- and high-frailty risk groups were negatively associated with BI gain (intermediate-frailty risk group: coefficient −4.868, 95% CI: −5.599–−3.773; high-frailty risk group: coefficient −19.596, 95% CI: −22.242–−16.714).
Table 4 shows the results of the logistic regression analysis on HFRS. The intermediate- and high-frailty risk groups were negatively associated with a BI score ≥ 95 on discharge (intermediate-frailty risk group: odds ratio 0.645; 95% CI: 0.595−0.699; high-frailty risk group: odds ratio 0.221; 95% CI: 0.157−0.311). The intermediate- and high-frailty risk groups were not significantly associated with in-hospital death (intermediate-frailty risk group: odds ratio 0.901; 95% CI: 0.766−1.061; high-frailty risk group: odds ratio 0.707; 95% CI: 0.459−1.091).

4. Discussion

This study investigated the association of HFRS assessed using ICD-10 codes with adverse events and functional outcomes in patients with TBI, using nationwide data from Japan. The results indicated that patients with a higher frailty risk had a longer hospital stay duration and lower ability to perform ADL during hospitalization.
High frailty risk was positively associated with the length of the hospital stay. HFRS assesses frailty risk based on a weighted score of comorbidities with a certain number of points assigned for each ICD-10 code [9]. Gilbert et al. [9] reported that, among patients aged > 75 years admitted to an acute care hospital, those with a high frailty risk had a nearly two-fold increase in 30-day mortality and a six-fold increase in the risk of long-term hospitalization compared to those with a low frailty risk. Subsequent studies have examined the association between HFRS and adverse events in patients admitted to medical facilities [23] with stroke/transient ischemic attack [24], hip fracture surgery [25], total hip and knee arthroplasty [26], osteoarthritis [27], chronic obstructive pulmonary disease [28], and heart failure [29]. These reports stated that HFRS could predict adverse events during hospitalization. Similar to previous studies, we found that HFRS could predict prolonged LOS in patients with TBI. Patients with more comorbidities had a higher risk for mortality and severe disease [30]. Frailty was also considered a condition with a high risk of adverse outcomes due to the loss of function in multiple organs, such as the brain, endocrine system, immune system, and skeletal muscles [7]. Therefore, HFRS using comorbidities could be a useful tool for predicting adverse events in patients with TBI.
The high frailty risk was negatively associated with the number of patients with BI score ≥ 95 on discharge and BI gain. HFRS was suggested to predict functional outcomes, e.g., ADL, in TBI patients. High frailty risk was also not associated with in-hospital death. In HFRS, there is a greater weighting of ICD-10 codes for cerebrovascular, motor, gait, and cognitive disabilities [9]. HFRS includes diseases based on ICD-10 codes that affect functional outcomes [9,28]. Thus, patients at a higher risk of frailty are more likely to present with comorbidities that affect functional recovery more. HFRS has fewer comorbidities that are directly related to death than functional impairment and has less accuracy in predicting death [28,31]. Therefore, HFRS could be a useful predictive tool for functional prognoses, such as ADL, rather than death. In contrast, in a study that followed up patients with TBI for 1 year, death was found to be associated with frailty [32]. A long-term follow-up in the present study might have increased the number of deaths as well as the statistical power to detect significant differences.
Patients at a intermediate-, and high risk of frailty accounted for about half of the patients with TBI (43.9%). The percentage of TBI patients with frailty was approximately 40% using the mFI-11 [14] and Groningen Frailty Indicator [13]. In contrast, patients with frailty alongside other conditions assessed using HFRS (total hip arthroplasty/total knee arthroplasty [21] and spinal surgery [27]) included fewer than 15% of patients at a moderate to severe frailty risk. Falls in the older population are closely related to frailty, an age-related decline in motor and cognitive function [5,6]. Factors contributing to falls include age, sex, gait disturbance, and neurological and cognitive impairments [5,7]. Thus, patients with TBI may have been affected by frailty even before the injury. TBI is also likely to result in life-long physical, cognitive, and psychosocial functional impairments [33,34,35]. HFRS has many items associated with TBI (cerebrovascular disease, motor impairment, gait disturbance, cognitive impairment, open or superficial head injury, delirium, emotional status, and so on), which may have contributed to the high proportion of patients at a high risk of frailty.
This study has several strengths. Several comorbidity scores have been previously developed, including the Charlson Comorbidity Index and Elixhauser Comorbidity Index [36,37]. HFRS includes cognitive impairment, delirium, disorientation, falls, mobility impairments, dependence syndrome, urinary incontinence, and difficulties in managing life that have not received attention in the Charlson and Elixhauser Comorbidity Indexes [9]. HFRS includes more comorbidities related to injury in TBI than other comorbidity indices [9]. Therefore, compared to other comorbidity indices, HFRS could better detect functional adverse events at admission in TBI patients. Another strength is that HFRS can be automatically implemented in in-hospital information systems [9]. Because ICD-10 codes are routinely recorded electronically, HFRS data for TBI can be automatically embedded in in-hospital electronic medical records. HFRS could be made available automatically, potentially reducing patient burden by predicting adverse events.
This study has several limitations that are common to database studies. The analysis is a historical cohort study, and data acquisition was limited to data available from the hospital information system. Therefore, we were unable to obtain long-term follow-up data or detailed data on parameters such as walking ability, muscle strength, or Glasgow Coma Scale score. However, a high correlation between the JCS and Glasgow Coma Scale scores has been reported [22], and we believe that we were able to adequately assess disease severity. In addition, the accuracy of this data could be somewhat problematic because HFRS used in this study was based on ICD-10 codes in the medical information system. In general, studies using reimbursement databases reported problems with data reliability owing to coding errors, inappropriate coding, and poor documentation [38,39]. However, the criterion-related validity of medical records based on ICD-10 codes has been validated in Japan [20]. Therefore, there may have been minimal bias due to coding inaccuracy.

5. Conclusions

This study suggests that HFRS could predict adverse outcomes for TBI in advance. Patients at a higher risk for frailty were associated with longer hospital stays, a lower BI gain, and a lower percentage of patients with BI score ≥ 95 on discharge. This finding supports the utility of HFRS as a predictor of adverse events after hospitalization due to TBI.

Author Contributions

Conceptualization, Y.Y. and R.M.; methodology, Y.Y. and R.M.; software, Y.Y.; validation, Y.Y. and R.M.; formal analysis, Y.Y.; investigation, Y.Y.; data curation, Y.Y.; writing—original draft preparation, Y.Y.; writing—review and editing, S.H., K.U., Y.S., M.S., Y.K., A.S. and R.M.; supervision, R.M.; project administration, R.M. All authors have read and agreed to the published version of the manuscript.

Funding

This work was supported by Mitsui Sumitomo Insurance Welfare Foundation [grant number 23].

Institutional Review Board Statement

The JMDC database is generally available; hence, the ethics committee of Mie University determined that no ethical review was required.

Informed Consent Statement

The requirement for obtaining patient informed consent was waived because the data provided by JMDC was de-identified and unlinked to personal information.

Data Availability Statement

Data sharing not applicable—no new data generated.

Conflicts of Interest

The authors declare no conflict of interest.

References

  1. Rodriguez, S.R.; Mallonee, S.; Archer, P.; Gofton, J. Evaluation of death certificate-based surveillance for traumatic brain injury–Oklahoma 2002. Public Health Rep. 2006, 121, 282–289. [Google Scholar] [CrossRef]
  2. Faul, M.; Wald, M.M.; Rutland-Brown, W.; Sullivent, E.E.; Sattin, R.W. Using a cost-benefit analysis to estimate outcomes of a clinical treatment guideline: Testing the Brain Trauma Foundation guidelines for the treatment of severe traumatic brain injury. J. Trauma 2007, 63, 1271–1278. [Google Scholar] [CrossRef] [PubMed] [Green Version]
  3. Centers for Disease Control and Prevention. National Center for Health Statistics: Mortality Data on CDC WONDER. Available online: https://wonder.cdc.gov (accessed on 21 May 2022).
  4. Surveillance Report of Traumatic Brain Injury-Related Emergency Department Visits, Hospitalizations, and Deaths; Centers for Disease Control and Prevention, U.S. Department of Health and Human Services: Atlanta, Georgia, 2014. Available online: https://www.cdc.gov/traumaticbraininjury/pdf/TBI-Surveillance-Report-FINAL_508.pdf (accessed on 21 May 2022).
  5. Vaishya, R.; Vaish, A. Falls in older adults are serious. Indian J. Orthop. 2020, 54, 69–74. [Google Scholar] [CrossRef] [PubMed]
  6. Langlois, J.A.; Rutland-Brown, W.; Thomas, K.E. Traumatic Brain Injury in the United States Emergency Department Visits, Hospitalizations, and Deaths; Centers for Disease Control and Prevention, National Center for Injury Prevention and Control: Atlanta, GA, USA, 2006. Available online: https://www.cdc.gov/traumaticbraininjury/tbi_ed.html (accessed on 21 May 2022).
  7. Clegg, A.; Young, J.; Iliffe, S.; Rikkert, M.O.; Rockwood, K. Frailty in elderly people. Lancet 2013, 381, 752–762. [Google Scholar] [CrossRef] [PubMed] [Green Version]
  8. Guilherme, G.P.G.; Rodrigo, C.; Edson, L.Z.J.; Luca, G.; Mateus, M.; Stephanie, N.D.S.; Marcelo, V.S. Traumatic brain injury in the elderly: Clinical features, prognostic factors, and outcomes of 133 consecutive surgical patients. Cureus 2021, 27, e13587. [Google Scholar]
  9. Gilbert, T.; Neuburger, J.; Kraindler, J.; Keeble, E.; Smith, P.; Ariti, C.; Arora, S.; Street, A.; Parker, S.; Roberts, H.C.; et al. Development and validation of a hospital frailty risk score focusing on older people in acute care settings using electronic hospital records: An observational study. Lancet 2018, 391, 1775–1782. [Google Scholar] [CrossRef] [PubMed] [Green Version]
  10. McAlister, F.; Walraven, C.V. External validation of the hospital frailty risk score and comparison to the hospital-patient one-year mortality risk score to predict outcomes in elderly hospitalized patients: A retrospective cohort study. BMJ Qual. Saf. 2019, 28, 284–288. [Google Scholar] [CrossRef]
  11. Galimberti, S.; Graziano, F.; Maas, A.I.R.; Isernia, G.; Lecky, F.; Jain, S.; Sun, X.; Gardner, R.C.; Taylor, S.R.; Markowitz, A.J. CENTER-TBI and TRACK-TBI participants and investigators. Effect of frailty on 6-month outcome after traumatic brain injury: A multicentre cohort study with external validation. Lancet Neuro. 2022, 21, 153–162. [Google Scholar] [CrossRef]
  12. Tang, O.Y.; Shao, B.; Kimata, A.R.; Sastry, R.A.; Wu, J.; Asaad, W.F. The impact of frailty on traumatic brain injury outcomes: An analysis of 691,821 nationwide cases. Neurosurgery 2022, 91, 808–820. [Google Scholar] [CrossRef]
  13. Abdulle, A.E.; de Koning, M.E.; van der Horn, H.J.; Scheenen, M.E.; Roks, G.; Hageman, G.; Spikman, J.M.; van der Naalt, J. Early predictors for long-term functional outcome after mild traumatic brain injury in frail elderly patients. J. Head Trauma Rehabil. 2018, 33, E59–E67. [Google Scholar] [CrossRef]
  14. Tracy, B.M.; Carlin, M.N.; Tyson, J.W.; Schenker, M.L.; Gelbard, R.B. The 11-item modified frailty index as a tool to predict unplanned events in traumatic brain injury. Am. Surg. 2020, 86, 1596–1601. [Google Scholar] [CrossRef] [PubMed]
  15. Lascano, D.; Pak, J.S.; Kates, M.; Finkelstein, J.B.; Silva, M.; Hagen, E.; RoyChoudhury, A.; Bivalacque, T.J. Validation of a frailty index in patients undergoing curative surgery for urologic malignancy and comparison to other risk stratification tools. Urol. Oncol. 2015, 33, 426.e1–426.e12. [Google Scholar] [CrossRef] [PubMed] [Green Version]
  16. Kimura, S.; Sato, T.; Ikeda, S.; Noda, M.; Nakayama, T. Development of a database of health insurance claims: Standardization of disease classifications and anonymous record linkage. J. Epidemiol. 2010, 20, 413–419. [Google Scholar] [CrossRef] [PubMed] [Green Version]
  17. Nagai, K.; Tanaka, T.; Kodaira, N.; Kimura, S.; Takahashi, Y.; Nakayama, T. Data resource profile: JMDC claims databases sourced from medical institutions. J. Gen. Fam. Med. 2020, 21, 211–218. [Google Scholar] [CrossRef]
  18. JMDC Claims Database. Japan Medical Data Center. Available online: https://www.jmdc.co.jp/en/jmdc-claims-database (accessed on 21 May 2022).
  19. Yasunaga, H.; Ide, H.; Imamura, T.; Ohe, K. Impact of the Japanese diagnosis procedure combination-based payment system on cardiovascular medicine-related costs. Int. Heart J. 2005, 46, 855–866. [Google Scholar] [CrossRef] [Green Version]
  20. Yamana, H.; Moriwaki, M.; Horiguchi, H.; Kodan, M.; Fushimi, K.; Yasunaga, H. Validity of diagnoses, procedures, and laboratory data in Japanese administrative data. J. Epidemiol. 2017, 27, 476–482. [Google Scholar] [CrossRef]
  21. Yumoto, T.; Naito, H.; Yorifuji, T.; Aokage, T.; Fujisaki, N.; Nakao, A. Association of Japan coma scale score on hospital arrival with in-hospital mortality among trauma patients. BMC Emerg. Med. 2019, 19, 65. [Google Scholar] [CrossRef] [Green Version]
  22. Mahoney, F.I.; Barthel, D.W. Functional evaluation: The Barthel index. Md. State Med. J. 1965, 14, 61–65. [Google Scholar]
  23. Gilbert, T.; Cordier, Q.; Polazzi, S.; Bonnefoy, M.; Keeble, E.; Street, A.; Conroy, S.; Duclos, A. External validation of the hospital frailty risk score in France. Age Ageing 2022, 51, afab126. [Google Scholar] [CrossRef]
  24. Kilkenny, M.F.; Phan, H.T.; Lindley, R.I.; Kim, J.; Lopez, D.; Dalli, L.L.; Grimley, R.; Sundararajan, V.; Thrift, A.G.; Andrew, N.E.; et al. Stroke123 Investigators and the AuSCR Consortium Utility of the hospital frailty risk score derived from administrative data and the association with stroke outcomes. Stroke 2021, 52, 2874–2881. [Google Scholar] [CrossRef]
  25. Shimizu, A.; Maeda, K.; Fujishima, I.; Kayashita, J.; Mori, N.; Okada, K.; Uno, C.; Shimizu, M.; Momosaki, R. Hospital frailty risk score predicts adverse events in older patients with hip fractures after surgery: Analysis of a nationwide inpatient database in Japan. Arch. Gerontol. Geriatr. 2022, 98, 104552. [Google Scholar] [CrossRef] [PubMed]
  26. Meyer, M.; Parik, L.; Leiß, F.; Renkawitz, T.; Grifka, J.; Weber, M. Hospital frailty risk score predicts adverse events in primary total hip and knee arthroplasty. J. Arthroplast. 2020, 35, 3498–3504.e3. [Google Scholar] [CrossRef] [PubMed]
  27. Hannah, T.C.; Neifert, S.N.; Caridi, J.M.; Martini, M.L.; Lamb, C.; Rothrock, R.J.; Yuk, F.J.; Gilligan, J.; Genadry, L.; Gal, J.S. Utility of the hospital frailty risk score for predicting adverse outcomes in degenerative spine surgery cohorts. Neurosurgery 2020, 87, 1223–1230. [Google Scholar] [CrossRef] [PubMed]
  28. Ushida, K.; Shimizu, A.; Hori, S.; Yamamoto, Y.; Momosaki, R. Hospital frailty risk score predicts outcomes in chronic obstructive pulmonary disease exacerbations. Arch. Gerontol. Geriatr. 2022, 100, 104658. [Google Scholar] [CrossRef]
  29. McAlister, F.A.; Savu, A.; Ezekowitz, J.A.; Armstrong, P.W.; Kaul, P. The hospital fraily risk score in patients with heart failure is strongly associated with outcomes but less so with pharmacotherapy. J. Intern. Med. 2022, 287, 322–332. [Google Scholar] [CrossRef] [PubMed]
  30. Tuty Kuswardhani, R.A.; Henrina, J.; Pranata, R.; Anthonius Lim, M.; Lawrensia, S.; Suastika, K. Charlson comorbidity index and a composite of poor outcomes in COVID-19 patients: A systematic review and meta-analysis. Diabetes Metab. Syndr. 2020, 14, 2103–2109. [Google Scholar] [CrossRef]
  31. Charlson, M.E.; Pompei, P.; Ales, K.L.; Mackenzie, C.R. A new method of classifying prognostic comorbidity in longitudinal studies: Development and validation. J. Chronic Dis. 1987, 40, 373–383. [Google Scholar] [CrossRef]
  32. Baggiani, M.; Guglielmi, A.; Citerio, G. Acute traumatic brain injury in frail patients: The next pandemic. Curr. Opin. Crit. Care 2022, 28, 166–175. [Google Scholar] [CrossRef]
  33. Rehabilitation of persons with traumatic brain injury. NIH Consens. Statement 1998, 26–28, 1–41.
  34. Andriessen, T.M.; Horn, J.; Franschman, G.; van der Naalt, J.V.D.; Haitsma, I.; Jacobs, B.; Steyerberg, E.W.; Vos, P.E. Epidemiology, severity classification, and outcome of moderate and severe traumatic brain injury: A prospective multicenter study. J. Neurotrauma 2011, 28, 2019–2031. [Google Scholar] [CrossRef]
  35. Vitaz, T.W.; Jenks, J.; Raque, G.H.; Shields, C.B. Outcome following moderate traumatic brain injury. Surg. Neurol. 2003, 60, 285–291, discussion 291. [Google Scholar] [CrossRef] [PubMed]
  36. Persico, I.; Cesari, M.; Morandi, A.; Haas, J.; Mazzola, P.; Zambon, A.; Annoni, G.; Bellelli, G. Frailty and delirium in older adults: A systematic review and meta-analysis of the literature. J. Am. Geriatr. Soc. 2018, 66, 2022–2030. [Google Scholar] [CrossRef] [PubMed]
  37. Layton, A.M.; Armstrong, H.F.; Baldwin, M.R.; Podolanczuk, A.J.; Pieszchata, N.M.; Singer, J.P.; Arcasoy, S.M.; Meza, K.S.; D’Ovidio, F.; Lederer, D.J. Frailty and maximal exercise capacity in adult lung transplant candidates. Respir. Med. 2017, 131, 70–76. [Google Scholar] [CrossRef]
  38. Rabinstein, A.A. Administrative medical databases for clinical research: The good, the bad, and the ugly. Neurocrit. Care 2018, 29, 323–325. [Google Scholar] [CrossRef] [Green Version]
  39. Hashimoto, R.E.; Brodt, E.D.; Skelly, A.C.; Dettori, J.R. Administrative database studies: Goldmine or goose chase? Evid.-Based Spine Care J. 2014, 5, 74–76. [Google Scholar] [PubMed]
Figure 1. Patient selection.
Jcm 11 07064 g001
Table 1. Characteristics of the study participants.
Low-Frailty Risk Group (Hospital Frailty Risk Score < 5)Intermediate-Frailty Risk Group (Hospital Frailty Risk Score 5–15)High-Frailty Risk Group
(Hospital Frailty Risk Score > 15)
p-Value
Number of patients, n (%)10,139 (56.1)7388 (40.9)538 (3.0)
Female sex, n (%)3607 (35.6)2944 (39.8)292 (54.3)<0.001
Age, years, n (%) <0.001
-<652444 (24.1)1384 (18.7)8 (1.5)
-65–742214 (21.8)1397 (18.9)34 (6.3)
-75–894418 (43.6)3608 (48.8)375 (69.7)
-≥901063 (10.5)999 (13.5)121 (22.5)
Body mass index, n (%) <0.001
-<18.51742 (17.2)1498 (20.3)158 (29.4)
-18.5–25.05517 (54.4)3861 (52.3)241 (44.8)
-≥25.01680 (16.6)1082 (14.6)55 (10.2)
-Missing1200 (11.8)947 (12.8)84 (15.6)
Injury type, n (%) <0.001
-Diffuse traumatic brain injury907 (8.9)712 (9.6)42 (7.8)
-Focal traumatic brain injury301 (3.0)208 (2.8)12 (2.2)
-Epidural hemorrhage363 (3.6)261 (3.5)13 (2.4)
-Traumatic subdural hemorrhage5549 (54.7)3671 (49.7)340 (63.2)
-Traumatic subarachnoid hemorrhage1923 (19.0)1597 (21.6)98 (18.2)
-Other injury type1096 (10.8)939 (12.7)33 (6.1)
Neurosurgical procedure on admission, n (%)3248 (32.0)1706 (23.1)169 (31.4)<0.001
Ventilator on admission, n (%)340 (3.4)495 (6.7)30 (5.6)<0.001
Intensive care unit management on admission, n (%)929 (9.2)925 (12.5)67 (12.5)<0.001
Japan coma scale at admission, n (%) <0.001
-04960 (48.9)2545 (34.4)118 (21.9)
-1–33934 (38.8)3438 (46.5)304 (56.5)
-10–30659 (6.5)765 (10.4)75 (13.9)
-100–300586 (5.8)640 (8.7)41 (7.6)
Barthel index at admission,
mean (SD)
47.7 ± 40.833.9 ± 38.119.3 ± 29.7<0.001
Received inpatient rehabilitation services, n (%)5150 (50.8)4489 (60.8)423 (78.6)<0.001
Number of drugs during hospitalization, mean (SD)4.4 (4.5)5.9 (5.2)7.5 (5.3)0.004
Number of complications occurring during hospitalization, mean (SD)0.5 (1.0)1.5 (1.8)2.4 (2.3)<0.001
Number of beds, n (%) <0.001
-20–99186 (1.8)98 (1.3)8 (1.5)
-100–1992436 (24.0)1334 (18.1)131 (24.3)
-200–2991650 (16.3)1196 (16.2)120 (22.3)
-300–4992987 (29.5)2664 (36.1)165 (30.7)
-≥5002880 (28.4)2096 (28.4)114 (21.2)
Year of admission, n (%) <0.001
-2014858 (8.5)534 (7.2)24 (4.5)
-20151308 (12.9)810 (11.0)36 (6.7)
-20161498 (14.8)1148 (15.5)77 (14.3)
-20171650 (16.3)1292 (17.5)108 (20.1)
-20182004 (19.8)1412 (19.1)119 (22.1)
-20191908 (18.8)1441 (19.5)120 (22.3)
-2020913 (9.0)751 (10.2)54 (10.0)
Table 2. Comparison of Hospital Frailty Risk Score and outcomes between the low-, intermediate-, and high-frailty risk groups.
Low-Frailty Risk Group (Hospital Frailty Risk Score < 5)Intermediate-Frailty Risk Group (Hospital Frailty Risk Score 5–15)High-Frailty Risk Group
(Hospital Frailty Risk Score > 15)
p-Value
Length of hospital stay,
Mean ± SD
16.6 ± 27.925.0 ± 35.936.1 ± 42.9<0.001
Barthel Index score ≥ 95 on discharge, n (%)6034 (59.5)2950 (39.9)59 (11.0)<0.001
Barthel index gain,
Mean ± SD
26.9 ± 37.425.1 ±38.214.0 ± 30.5<0.001
Death in hospital, n (%)655 (6.5)640 (8.7)40 (7.4)<0.001
Table 3. Multiple linear regression analysis for the length of hospital stay and Barthel Index gain.
VariablesCoefficient95% Confidence Intervalp-Value
LowerUpper
Length of hospital stay
Low-frailty risk group (reference)---
Intermediate-frailty risk group1.9521.1172.786<0.001
High-frailty risk group5.7703.1608.379<0.001
Barthel index gain
Low-frailty risk group (reference)---
Intermediate-frailty risk group−4.868−5.599−3.773<0.001
High-frailty risk group−19.596−22.242−16.714<0.001
Models adjusted for sex, age, body mass index, injury type, neurosurgical procedure on admission, ventilator use on admission, intensive care unit management on admission, Japan coma scale score on admission, Barthel Index on admission, inpatient rehabilitation services received, number of drugs administered during hospitalization, number of complications that occurred during hospitalization, number of beds, and year of admission.
Table 4. Binary logistic regression analysis for in-hospital death and Barthel Index score ≥ 95 on discharge.
VariablesOdds Ratio95% Confidence Intervalp-Value
LowerUpper
Barthel Index score ≥ 95 on discharge
Low-frailty risk group (reference)---
Intermediate-frailty risk group0.6450.5950.699<0.001
High-frailty risk group0.2210.1570.311<0.001
Death in hospital
Low-frailty risk group (reference)---
Intermediate-frailty risk group0.9010.7661.0610.690
High-frailty risk group0.7070.4591.0910.245
Models adjusted for sex, age, body mass index, injury type, neurosurgical procedure on admission, ventilator use on admission, intensive care unit management on admission, Japan coma scale score at admission, Barthel Index at admission, inpatient rehabilitation services received, number of drugs administered during hospitalization, number of complications that occurred during hospitalization, number of beds, and year of admission.
Publisher’s Note: MDPI stays neutral with regard to jurisdictional claims in published maps and institutional affiliations.

