Abstract
Sickle cell disease (SCD) occurs when two alleles of mutated hemoglobin (HbS or HbC) are inherited (HbSS and HbSC) rather than one (HbAS or HbAC), which indicates a person carries the sickle cell trait. The high prevalence of these two alleles in Africa have been associated with reduced malaria susceptibility. Recent in vitro research has been shown that microRNAs (miRNAs) miR-451a and let-7i-5p are differentially expressed in HbSS erythrocytes compared to healthy controls (HbAA) and are overexpressed in Plasmodium-infected malaria erythrocytes. However, these miRNAs have not been fully examined in the plasma of people with different sickle hemoglobin genotypes. Plasma circulating miRNAs are commonly encapsulated in extracellular vesicles, such as exosomes, and are thought to play a role in disease development. Circulating exosomal miR-451a and let-7i-5p were quantified from individuals with various hemoglobin genotypes (HbAA, HbAS, HbAC, HbSS, HbSC, and HbCC) with (+) and without (−) malaria. The results showed a higher level of exosomal let-7i-5p and miR-451a in HbSS-. Exosomal let-7i-5p and miR-451a levels were lower in HbSS+ compared to other genotypes. Based on the area under the curve (AUC) of the Receiver Operating Characteristics (ROCs), both exosomal miRNAs may be useful disease biomarkers for SCD with malaria. Finally, miR-451a and let-7i-5p modulate genes involved in inflammation, making them potential biomarkers of pathogenesis for both diseases.
1. Introduction
Sickle cell disease (SCD) is one of the most common severe monogenic disorders in the world associated with clinical complications, such as stroke, infections, acute splenic sequestration, acute chest syndrome, pulmonary hypertension, and leg ulcers [1]. SCD is a genetic disorder associated with a mutation in the beta-chain in both hemoglobin (Hb) alleles that cause the red blood cell (RBC) morphology to change under hypoxic conditions [1]. The Hb allele variant S (HbS) causes sickle cell anemia (SCA) [2,3]. HbS and HbC are associated with SCA when both HbS and/or HbC alleles are inherited (HbSS or HbSC). While sickle cell trait (SCT) occurs when one HbS or HbC allele is inherited from one parent and one normal allele (HbA) from another parent (HbAS or HbAC). People with SCT often have no complications from carrying the HbS or HbC allele [4]. The host hemoglobin genotype has been shown to play a protective role against malaria [5,6]. However, the mechanism by which sickle hemoglobin genotypes provide protection is poorly understood. In 2018, there were 405,000 malaria deaths worldwide, with most occurring among children [7]. SCD and malaria require treatment strategies that target pathophysiological mechanisms and clinical complications. Functional biomarkers must be identified and evaluated for their diagnostic and prognostic value.
Studies have shown that HbSS erythrocytes have differential expression of many erythrocytic microRNAs (miRNAs) [8,9]. While there are hundreds of miRNAs, two miRNAs have been identified as being associated with HbSS and HbAS, as well as parasite growth in vitro [3,9]. Researchers have discovered elevated levels of miR-451a and let-7i-5p in HbSS and HbAS erythrocytes, which inhibit parasite growth in vitro [8,9]. MiRNAs are small, non-coding RNAs of approximately 20 to 25 nucleotides long that endogenously regulate gene expression post-transcriptionally [10]. MiRNAs are produced by various cells, and a single miRNA can have multiple targets [11]. The integrity of circulating miRNAs is maintained in plasma when encapsulated in microvesicles such as exosomes (vesicles 30–100 nm in size) [12]. Exosomes contain biomolecules such as miRNA, mRNA, proteins, and lipids. Exosomes transfer these biomolecules from one cell to another [13]. Exosomes and their contents have been used to develop new diagnostics, drugs, and vaccines [12,14]. Exosomal miRNAs have been used as biomarkers in cancer and chronic and infectious diseases [12,15,16]. There are hundreds of highly regulated miRNAs in the body that bind to target mRNAs and control translation [17]. While miRNAs have been shown to be differentially expressed in SCD patients compared to non-SCD controls, their exosomal miRNAs have not been characterized [9]. Likewise, miRNAs have been examined for malaria, but much research is still needed to fully understand the role of exosomal miRNAs in malaria pathogenesis [18].
Based on previous in vitro studies, we chose to evaluate exosomal miR-451a and let-7i-5p in our cohort [3,9]. While other studies have investigated endogenous miRNA levels in cell culture, our study specifically focused on exosomal miRNA levels. Studying exosomal miRNAs, we can learn more about how miRNAs are involved in SCD and malaria pathogenesis, and their findings may be used to develop therapeutic approaches. Therefore, in this study, we evaluated the expression of exosomal miR-451a and let-7i-5p among persons with or without malaria, with one (HbAS and HbAC), two (HbSS, HbSC, and HbCC), or no copies (HbAA) of the Hb allele variant S or C. We hypothesized that miR-451a and let-7i-5p are differentially expressed in plasma exosomes isolated from individuals with different hemoglobin variants and may contribute to the pathogenesis of both SCD and malaria. Studying miRNA expression levels in exosomes, specifically, miR-451a and let-7i-5p, and their relationship to inflammation in SCD will enhance our understanding of SCD and malaria pathogenesis. In addition, analyzing the effect of malaria and SCD on exosomal miRNA could prompt the development of severity biomarkers.
2. Materials and Methods
2.1. Study Population
The data were collected from the Greater Accra region of Ghana, West Africa, at the Korle-Bu Teaching Hospital and district hospitals, namely, Princess Marie Louise Children’s Hospital, Korle-Bu Polyclinic, Mamprobi Polyclinic, Ussher Polyclinic, Shai-Osudoku, and LA General Hospital. Volunteers were recruited between February and November 2014 and from June 2017 to July 2019 as part of an ongoing National Institute of Health’s Fogarty International Center-funded SCD and a malaria study between Morehouse School of Medicine and the University of Ghana.
Ethical approval was obtained from the University of Ghana’s Noguchi Memorial Institute for Medical Research and College of Health Sciences, and the Morehouse School of Medicine (Atlanta, GA) institutional review boards before the study’s commencement. Participants of age ≥ 18 years gave their informed consent. Among persons aged < 18 years, parents or guardians provided written consent. Exclusion criteria included individuals with abnormal fetal Hb (HbF), pregnant women, insufficient complete blood count (CBC) information, or positive HIV test. All samples were numerically coded to anonymize the data. A total of 183 subjects were randomly selected from a pool of a total 923 volunteers. Of the 183 subjects, the average age of all subjects was close to 30 years, representing all 6 sickle hemoglobin genotypes (HbAA, HbAS, HbAC, HbSS, HbSC, and HbCC) with (+) and without (−) malaria. Several groups were hard to recruit, so we used all individuals recruited for those groups, regardless of age and gender. There were ten individuals for the HbCC−, HbAS+, and HbAC+ groups and eleven individuals for the HbAC− and HbSS+ groups. For the other genotype groups, there were 35 HbAA−, 31 HbAS−, 17 HbSS−, 15 HbSC−, 26 HbAA+, and 7 HbSC+. During the entire recruitment period, we were unable to identify any individuals with a HbCC+ genotype, so that group could not be included in the study.
2.2. Laboratory Evaluation of Blood Samples
Blood samples were collected using BD Vacutainer® CPT™ (BD Bioscience, San Jose, CA, USA) Mononuclear Cell Preparation Tubes. Genotyping patients for sickle cell status was conducted at the Department of Haematology at the Korle-Bu Teaching Hospital using cellulose acetate membrane electrophoresis using HbAA, HbSS, and HbCC controls to determine participants’ hemoglobin status [19]. The medical questionnaires used for enrollment were consistent in all facilities where patients’ clinical and laboratory data were obtained. CBC counts were obtained by the hospital or clinical pathology laboratories from venous blood samples to determine patient hematological characteristics. Plasma, white blood cells (WBCs), and red blood cells (RBCs) were separated within hours of the collection, as instructed by the CPT tube manufacturer’s protocol [19,20]. Blood samples were tested for Plasmodium falciparum using a Rapid Diagnostic Test (RDT) kit and thick smear microscopy. The malaria RDT kits used (First Response® Malaria Ag. pLDH/HRP2 Combo Card Test, WHO reference number: PQDx 0285-010-00) detected both Plasmodium falciparum-specific protein HRP2, as well as Pan (Pan lactate dehydrogenase (LDH)), which detects multiple malaria species. HIV status was determined with RDTs (First Response® HIV-1–2 kits). We refer to malaria-infected individuals with (+) and non-infected individuals with (−) after the Hb genotypes.
2.3. Exosomal RNA Extraction
Exosomes were isolated from plasma using the Total Exosome Isolation kit (from plasma) (Invitrogen) following the manufacturer’s instructions, and total RNA was isolated from exosomes using the Total Exosome RNA/Protein Isolation kit (Invitrogen) following the manufacturer’s instructions. Samples were stored at −80 °C until further analysis.
2.4. Real-Time Quantitative PCR (RT-qPCR)
RNA was reverse transcribed using TaqMan MicroRNA Assay (Applied Biosystems, Waltham, MA, USA) and the TaqMan MicroRNA Reverse Transcription Kit (Applied Biosystems). RT-qPCR was performed using the Roche LightCycler 480 (Roche Applied Science) and the Bio-Rad CFX96 Real-Time PCR System using TaqMan MicroRNA Assay and TaqMan Universal Master Mix II, no UNG (Applied Biosystems) [21]. We focused on miR-451a and let-7i-5p due to the role of their expression role in SCD and malaria [3,9]. The RT-qPCR primers for miR-451a, let-7i-5p, and U6 (used as an internal control) were designed using Invitrogen MicroRNA Analysis and the TaqMan Assay search tool. U6 snRNA has been widely used in other studies as an internal control for exosomal miRNA [22,23]. The ΔΔCT method was used to evaluate the relative fold change in miRNA expression in Excel (Microsoft Office 365) and normalized to U6 expression [24]. ΔΔCt was created using RNU6 as an endogenous control and HbAA- as the control group in Excel using the Livak method [24]. ΔΔCt values were log-transformed to normalize the data. Any ΔΔCt over three standard deviations from the mean were flagged and removed as outliers.
2.5. Statistical Analysis
All statistical analyses were performed in GraphPad PRISM version 7.04 for Windows (GraphPad Software). A sample size calculation was performed using a 95% confidence interval and power of 80, using preliminary RT-qPCR miRNA data, which determined that a minimum of 6 samples per group was needed. Descriptive statistics were used to illustrate the study samples and hematologic profiles, stratified by Hb subtypes. Normality was determined through the D’Agostino and Pearson method. When comparing more than two groups, ANOVA and Tukey’s multiple comparison tests were used to assess within- and between-group’s significance among variables. However, to compare exosomal miRNAs levels between individual genotypes with and without malaria, an unpaired t-test was used. MiR-451a and let-7i-5p logged ΔΔCTs were correlated using Pearson correlation for each genotype and malaria status, as well as independent of genotype. MiR-451a and let-7i-5p ΔΔCTs were correlated with blood characteristics using Pearson correlation by genotype. A p-value of p < 0.05 was considered significant for all tests.
2.6. Receiver Operating Characteristic (ROC) Curve Analysis
To investigate the potential use of miRNAs as diagnostic tools, the ROC was calculated. Area under the curve (AUC) was calculated to show the accuracy of each analysis with p-values. Analyses were completed using GraphPad Prism software (GraphPad 9.2.0). Statistical significance was established at p < 0.05 for all tests.
2.7. Bioinformatics
To identify and evaluate potential gene targets of miR-451a and let-7i-5p, each miRNA was assessed with five different statistical algorithms that enlist predicted targets (DIANA-TarBase v7.0 [25], RNA22 [26], mirDB [27,28], TargetScan [29], microRNA.org [25,26,27,28,29,30]). All five lists generated were converted into a Venn diagram using software (http://bioinformatics.psb.ugent.be/webtools/Venn/, last accessed 23 May 2021). The software determined targets that overlapped across the prediction algorithms used. The predicted targets’ gene ontology was analyzed with Integrated Pathways Analysis (IPA) and FunRich tool (Version 3.1.3) (https://www.FunRich.org, last accessed 23 May 2021) [31,32].
3. Results
A total of 183 participant samples were randomly selected out of a cohort of 923 participants from each genotype (HbAA, HbAS, HbAC, HbSC, HbSS, and HbCC) with (+) and without (−) malaria (Table 1). The hematological characteristics and clinical data of the original cohort of 923 participants were compared in previous publication [33]. Results from the miRNA RT-qPCR were analyzed by ΔΔCt analysis. For the non-malaria groups, exosomal let-7i-5p was significantly upregulated in HbSS− patients as compared to HbAC− (p = 0.006), HbCC− (p = 0.04), and HbSC− (p = 0.004) (Figure 1A). Exosomal miR-451a levels were significantly upregulated in HbSS- compared to HbSC− (p = 0.003) and HbCC− (p = 0.0003) (Figure 1B). Additionally, exosomal miR-451a was significantly reduced for HbSC− compared to HbAA− (p = 0.0004) and HbAS− (p = 0.003). Finally, exosomal miR-451a was significantly reduced for HbCC− compared to HbAA− (p < 0.0001) and HbAS− (p = 0.0004) (Figure 1B). In the malaria positive cohorts, exosomal miR-451a levels were significantly reduced in HbSS+ compared to HbAA− (p < 0.0001), HbAA+ (p < 0.0001), HbAS+ (p < 0.0001), HbAC+ (p < 0.0001), and HbSC+ (p = 0.04) (Figure 1D). While in malaria-positive groups, exosomal let-7i-5p was significantly reduced in HbSS+ compared to HbAA− (p = 0.002), HbAA+ (p = 0.0008), HbAS+ (p = 0.01), and HbAC+ (p = 0.01) (Figure 1C).

Table 1.
Clinical characteristics of study populations. All genotypes with (+) and without (−) malaria—mean and standard deviation for clinical characteristics. White blood cells (WBCs). Red Blood cells (RBCs).
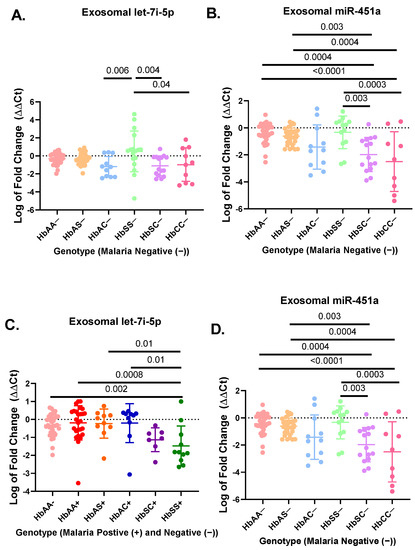
Figure 1.
RT-qPCR results for exosomal miR-451a and let-7i-5p expressed as log of fold change (ΔΔCt) in a bar graph expressing mean and standard deviation. ΔΔCt was created using RNU6 as endogenous control and HbAA− as the control group in Excel using the Livak method [28] (A) There was a significant difference in relative expression of exosomal let-7i-5p for HbSS− vs. HbAC− (p = 0.006), HbSS− vs. HbCC− (p = 0.04), and HbSS− vs. HbSC− (p = 0.004). (B) There was a significant difference for expression of exosomal miR-451a between HbAA− vs. HbCC− (p < 0.0001), HbAA− vs. HbSC− (p = 0.0004), HbAS− vs. HbCC− (p = 0.0004), HbAS− vs. HbSC− (p = 0.003), HbCC− vs. HbSS− (p = 0.0003), and HbSC− vs. HbSS− (p = 0.003). (C) There was a significant difference for exosomal let-7i-5p between HbAA− vs. HbSS+ (p = 0.002), HbAA+ vs. HbSS+ (p = 0.0008), HbAC+ vs. HbSS+ (p = 0.01), and HbAS+ vs. HbSS+ (p = 0.01). (D) There was a significant difference for exosomal miR-451a between HbSS+ vs. HbAA− (p < 0.0001), HbSS+ vs. HbAA+ (p < 0.0001), HbSS+ vs. HbAS+ (p < 0.0001), HbSC+ vs. HbSS+ (p = 0.04), and HbSS+ vs. HbAC+ (p < 0.0001).
There was no difference in exosomal let-7i-5p and miR-451a levels between HbAA, HbAS, HbAC, and HbSC groups with and without malaria, except for HbSS−, which was elevated compared to HbSS+ (p < 0.02) (Figure S1G,H). Overall, this suggests that exosomal miR-451a and let-7i-5p may play a role in SCD and malaria inflammation.
3.1. Let-7i-5p and miR-451a Expression Correlate with Each Other Regardless of Genotype and Malaria Status
Pearson correlation analysis showed that the expression levels of both exosomal let-7i-5p and miR-451a were correlated with each genotype independently (Table 2). All genotypes with and without malaria were significantly (p < 0.05) correlated between the two miRNAs, except for HbAS+, HbSC+, and HbCC− (Table 2). When all Hb groups were combined, there was a significant correlation with R2 = 0.45 and p < 0.0001 for malaria-negative groups and R2 = 76 and p < 0.0001 for malaria-positive groups. (Table 2, Figure 2). Additionally, when all genotypes, regardless of malaria status, were combined, there was a significant correlation between the two miRNAs (R2 = 0.54, p < 0.0001) (Table 2). For all genotypes with and without malaria, except HbAS+, HbSC+, and HbCC−, miR-451a and let-7i-5p significantly correlated with each other.
Table 2.
Assessment of correlation between miR-451a and let-7i-5p in each genotype. Assessment of R2 and p values of miR-451a and let-7i-5p expression levels in each genotype with and without malaria using Pearson correlation analysis. All malaria-negative groups include HbAA−, HbAS−, HbAC−, HbSC−, HbSS−, and HbCC−. All malaria-positive groups include HbAA+, HbAS+, HbAC+, HbSS+, HbSC+. All Hb genotypes include: HbAA−/+, HbAS−/+, HbAC−/+, HbSC−/+, HbSS−/+, HbCC−. Bold text denotes significance.
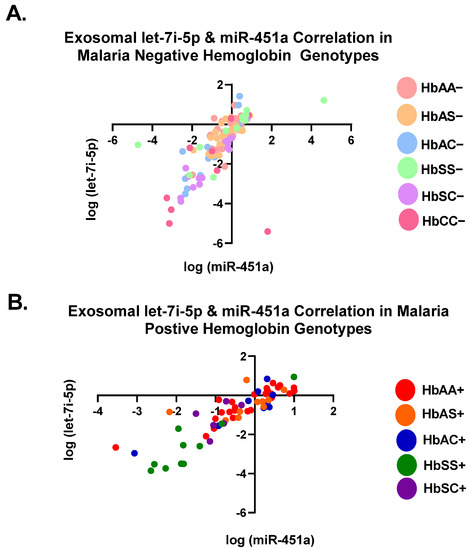
Figure 2.
Correlation of exosomal let-7i-5p and miR-451a expression levels among all genotypes. Two-tailed Pearson correlation with 95% confidence bands of let-7i-5p and miR-451a between genotypes. (A) For HbAA−, HbAS−, HbSS−, HbAC−, HbSC−, and HbCC−, R2 = 0.45 and p < 0.0001. (B) For HbAA+, HbAS+, HbSS+, HbAC+, and HbSC+, R2 = 0.76 and p < 0.0001.
Pearson correlation analyses were performed on each miRNA versus CBC values (RBC, WBC, Hb, and PLT) for each genotype with and without malaria (Figure 3). There were seven significant correlations (Figure 3). For HbAA+, there was a significant correlation between exosomal let-7i-5p and RBCs levels with R2 = 0.23 and p = 0.01 (Figure 3A). There was a significant correlation for HbSS+ between exosomal let-7i-5p and Hb levels, as well as PLT counts with a R2 = 0.4 and p = 0.04 and R2 = 0.4 and p = 0.04, respectively (Figure 3B–D). Additionally, for HbSS+, there was a significant correlation between exosomal miR-451a and Hb levels with R2 = 0.42 and p = 0.04. HbSC− also had a significant correlation between exosomal miR-451a and Hb with R2 = 0.36 and p = 0.02 (Figure 3E). Similarly, HbSC− showed a significantly correlation between exosomal let-7i-5p and miR-451a and PLTs with R2 = 0.31 and p = 0.03 and R2 = 0.3 and p = 0.03, respectively (Figure 3F,G).
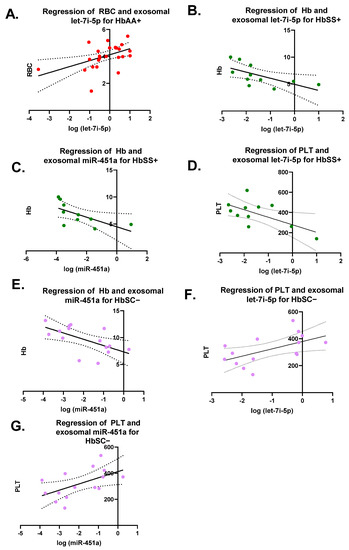
Figure 3.
Pearson correlation on each miRNA versus complete blood counts (CBCs) (RBC, WBC, Hb, and PLT) for each genotype with and without malaria. RBCs = red blood cells; WBCs = white blood cells; Hb = hemoglobin; PLT = platelet. Only 7 correlations were significant and shown. (A) For HbAA+, correlation between exosomal let-7i-5p and RBC resulted in R2 = 0.23 and p = 0.01. (B) For HbSS+, correlation between exosomal let-7i-5p and Hb was R2 = 0.4 and p = 0.04. (C) For HbSS+, correlation between exosomal miR-451a and Hb was R2 = 0.42 and p = 0.04. (D) For HbSS+, correlation between exosomal let-7i-5p and PLT was R2 = 0.4 and p = 0.04. (E) For HbSC−, correlation between exosomal miR-451a and Hb resulted in R2 = 0.36 and p = 0.02. (F) For HbSC−, correlation between exosomal let-7i-5p and PLT resulted in R2 = 0.31 and p = 0.03. (G) For HbSC−, correlation between exosomal miR-451a and PLT resulted in R2 = 0.3 and p = 0.03.
3.2. miR-451a and Let-7i-5p Are Significant Biomarkers for Sickle Cell Anemia and Malaria Status
The AUC of the ROCs were calculated to investigate whether exosomal miR-451a and let-7i-5p can be used as potential diagnostic markers (Table 3). The ROC curves and AUC estimates enabled us to predict that both exosomal miRNAs can distinguish between SCA+ (HbSS+ and HbSC+ combined) and HbAA+ (miR-451a AUC 0.8365, p = 0.0003; let-7i-5p AUC 0.828, p = 0.0002) (Figure 4A,B); between SCA+ and HbAA− (miR-451a AUC 0.8457, p = 0.0001, let-7i-5p AUC 0.8238, p = 0.0001) (Figure 4C,D); between SCA+ and SCT+ (HbAS+ and HbAC+ combined) (miR-451a AUC 0.8250, p = 0.0009, let-7i-5p AUC 0.8222, p = 0.0007) (Figure 4E,F); and between SCA+ and SCT− (HbAS− and HbAC− combined) (miR-451a AUC 0.7604, p = 0.0023, let-7i-5p AUC 0.7407, p = 0.0033) (Figure 4G,H).
Table 3.
Data from ROC Analysis for exosomal miR-451a and let-7i-5p. Area under the curve (AUC) and p-values of all phenotypic differences with and without malaria for miR-451a. SCA+ (HbSS+ and HbSC+ combined), SCA− (HbSS− and HbSC− combined), SCT+ (HbAS+ and HbAC+ combined), SCT− (HbAS− and HbAC− combined), HbAA−, and HbAA+. Bold text denotes significant values.
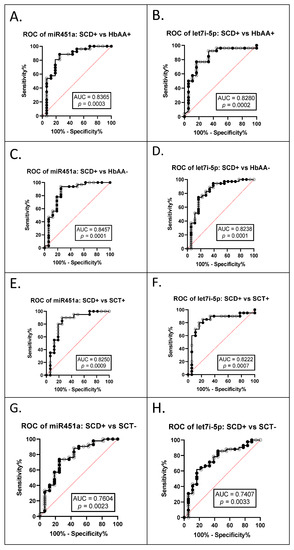
Figure 4.
ROC analysis for exosomal miR-451a and let-7i-5p (A) miR-451a, SCA+ (HbSS+ and HbSC+ combined) vs. HbAA+, AUC = 0.8365, p = 0.0003; (B) let-7i-5p, SCA+ vs. HbAA+, AUC = 0.8280, p = 0.0002; (C) miR-451a, SCA+ vs. HbAA−, AUC = 0.8457, p = 0.0001; (D) let-7i-5p, SCA+ vs. HbAA−, AUC = 0.8238, p = 0.0001; (E) miR-451a, SCA+ vs. SCT+ (HbAS+ and HbAC+ combined), AUC = 0.8250, p = 0.0009; (F) let-7i-5p, SCA+ vs. SCT+, AUC = 0.8222, p = 0.0007; (G) miR-451a, SCA+ vs. SCT− (HbAS− and HbAC− combined), AUC = 0.7604, p = 0.0023; (H) let-7i-5p, SCA+ vs. SCT−, AUC = 0.7407, p = 0.0033.
3.3. Predictions of Let-7i-5p and miR-451a Gene Targets
MiRNAs are known to have multiple targets, and multiple algorithms predict targets for miRNAs. To determine if there were any predicted targets of interest for let-7i-5p and miR-451a for further investigation, we used multiple prediction algorithms. Therefore, potential gene targets of let-7i-5p and miR-451a were determined using five commonly used prediction algorithms (DIANA, mirDB, RNA22, TargetScan, and microRNA.org). The predicted targets were organized in Venn diagrams (Figure S2) to show the distribution of target genes. Lin-28 Homolog B (LIN28B) and Fidgetin (FIGN) were predicted as let-7i-5p’s target genes by all five algorithms. None of the five algorithms predicted common targets for miR-451a. Using Ingenuity Pathway Analysis (IPA), twelve out of all the predicted targets for let-7i-5p had connections with the Let-7 miRNAs family or each other. These genes are Adrenoceptor Beta 2 (ADRB2), Hypoxia Inducible Factor 1 Subunit Alpha Inhibitor (HIF1AN), RAN Binding Protein 2 (RANBP2), E2F Transcription Factor 5 (E2F5), NRAS Proto-Oncogene, GTPase (NRAS), Lysine methyltransferase 2D (KMT2D), Fibronectin Type III Domain Containing 3A (FNDC3A), High Mobility Group AT-Hook 2 (HMGA2), MSM4, P53 Regulator (MDM4), Tripartite motif Containing 71 (TRIM71), Lin-28 Homolog B (LIN28B), and Insulin-Like Growth Factor Binding Protein 1 (IGFBP1) (Figure S3). All predicted targets of miR-451a in IPA are directly connected to miR-451a. These genes are Odd-Skipped Related Transcription Factor 1 (OSR1), Sterile Alpha Motif Domain-Containing 4B (SAMD4B), and Protease Subunit Beta 8 (PSMB8) (Figure S3). All the predicted targets identified in IPA have direct or indirect relationships with inflammation signaling pathways via STAT3 and NFҡB (Figure S3). These results suggest miR-451a and let-7i-5p targets of interest may alter pathogenesis through inflammatory pathways. Molecular function, cellular components, and biological processes were analyzed in FunRich to look for any similarity between predicted targets (Figure S3). Three different molecular functions were predicted for miR-451a: transcription factor activity (33%), ubiquitin-specific protease activity (33%), and molecular function unknown (33%). Let-7i-5p predicted targets represent four distinct molecular functions: transcription factor activity (~18%), transcription regulator activity (~8%), ubiquitin-specific protease activity (~8%), and unknown molecular function (~16%) (Figure S3). The predicted gene targets were further analyzed according to cellular components. MiR-451a predicted targets include five cellular components: nucleolus (50%), cytoplasm (50%), exosomes (50%), proteasome complex (50%), and nucleus (100%). The predicted targets for let-7i-5p represent four cellular components: nucleolus (~21%), cytoplasm (~55%), exosomes (3%), and nucleus (~66%). Finally, the predicted targets were stratified for biological processes. The predicted targets of miR-451a represent three biological processes: regulation of nucleobase, nucleoside, nucleotide, and nucleic acid metabolism (~33%), protein metabolism (~33%), and unknown biological process (~33%). Finally, let-7i-5p predicted targets represent five biological processes: signal transduction (~18%); cell communication (~18%); regulation of nucleobase, nucleoside, nucleotide, and nucleic acid metabolism (~34%); protein metabolism (~10%); and biological process unknown (~10%) (Figure S4). These results suggest that the predicted targets have a variable range of functions and may alter pathways other than inflammation in SCD pathogenesis. More studies are needed to investigate miR-451a and let-7i-5p targets’ effects on inflammation in malaria and SCD.
4. Discussion
Our study identified associations between Hb genotype and the expression of exosomal miRNA. These miRNAs could mediate the severity of malaria and sickle cell disease, which could indicate how SCT might protect against malaria infection. We hypothesized that miR-451a and let-7i-5p are differentially expressed in plasma exosomes isolated from individuals with different hemoglobin variants and may contribute to the pathogenesis of both SCD and malaria. We found that exosomal let-7i-5p was significantly upregulated in HbSS− patients compared to HbCC−, HbAC−, and HbSC−, while exosomal miR-451a was also significantly elevated in HbSS− compared to HbSC− and HbCC− (Figure 1). However, for exosomal miR-451a, HbSC− and HbCC− were significantly decreased compared to other genotypes without malaria. However, for exosomal miR-451a and let-7i-5p, we observed a shift from significant elevation without malaria to a considerable decrease in HbSS+ compared to other genotypes. Finally, our gene target analysis indicated that endogenous let-7i-5p and miR-451a are involved in inflammation associated with SCD severity. Our results suggest that these miRNAs may play an essential role in regulating the pathogenesis of SCD and malaria.
When measuring exosomal let-7i-5p and miR-451a expression levels, we found a statistically significant (p < 0.05) increased expression in HbSS− patients compared to other genotypes (Figure 1). Let-7i-5p expression levels were similar to those measured in a previous study, which measured non-exosomal miRNA expression in RBC culture and found that miRNA expression was associated with parasite growth [3]. There has also been an association reported between let-7i-5p and malaria in vitro and in the plasma of children in Mozambique [34]. Although the study in Mozambique did not examine exosomal miRNA and only compared uncomplicated to complicated malaria, it did not determine what the levels of miRNAs would be in non-malaria participants [34]. Additionally, the study in Mozambique did not investigate the sickle cell status, and we know miRNA levels are altered by sickle cells status from other studies [3,9]. In our cohort, we also found an inverse relationship between RBC count and measured exosomal let-7i-5p levels in HbAA+ in our cohort (Figure 3). Furthermore, the AUC of the ROC curves of exosomal miR-451a and let-7i-5p showed the potential to be used as biomarkers to discriminate SCA, SCT, and HbAA when complicated by malaria (Figure 4). However, the sensitivity and specificity were not remarkably high. In this study, there were relatively few patient samples, so further analysis of these exosomal miRNAs needs to be conducted.
Other miRNAs, such as miR-144 and miR-451a, have been reported to be associated with RBC characteristics and hemolysis [8,35]. We also found correlations between Hb levels and miRNA levels in both HbSS+ (let-7i-5p and miR-451a) and HbSC− (miR-451a) groups (Figure 3). HbSS is associated with reduced RBC survival as hemolysis is increased due to sickling [36]. Additionally, RBC lifespans are reduced in individuals with HbSS due to other factors such as oxidative stress, which cause membrane damage, increased cell rigidity, and cell dehydration, resulting in increased hemolysis [36].
To investigate the relationship between clinical characteristics and exosomal miRNA expression, we examined possible targets of let-7i-5p and miR-451a. Five different prediction algorithms and IPA enabled us to identify three potential common targets (OSR1, SAMD4B, and PSMB8) for miR-451a and 12 predicted targets for let-7i-5p. Out of the three predicted miR-451a common targets, only PSMB8 has been reported to be associated with miR-451a and involved in inflammation [37]. PSMB8, also known as LMP7, inhibits NFҡB when levels of miR-451a are high [37].
Using IPA, twelve predicted target genes of let-7i-5p, ADRB2, HIF1AN, RANBP2, E2F5, NRAS, KMT2D, FNDC3A, HMGA2, MDM4, TRIM71, LIN28B, and IGFBP1, were connected, directly or indirectly, to the let-7 miRNAs family and other targets (Table 4). Out of the twelve targets, five (ADRB2, HIF1AN, HMGA2, TRIM71, and LIN28B) were associated with SCD pathogenesis (Table 4). ADRB2 has been reported to be linked to the adhesion of RBCs in HbSS [38,39,40]. In ADRB2, polymorphisms can increase the adhesion of RBCs in HbSS, which can cause vaso-occlusive crisis and stroke [38,39,40]. HIF1AN is considered a master regulator in hypoxia pathways, and painful vaso-occlusive crisis is thought to be caused by multiple occurrences of hypoxia in SCD patients [41,42]. A SCD patient became transfusion independent after treatment with globin lentiviral gene therapy, which caused a chromosomal integration of the vector at the HMGA2 site [43]. TRIM71 is an orthologue of LIN-41, which is a highly conserved target for all the let-7 family miRNAs [44]. LIN28B regulates fetal hemoglobin (HbF) via the let-7 family [45]. Increasing HbF levels is a potential SCD therapy. Hydroxyurea, a current medication for SCD, increases HbF levels [46]. These results suggest a more comprehensive look into PSMB8 as potential targets for miR-451a and ADRB2, HIF1AN, HMGA2, TRIM71, and LIN28B as potential targets for let-7i-5p.
Table 4.
Predicted targets of miR-451a and let-7i-5p using IPA analysis. Target gene name, abbreviation, Entrez gene ID, and short description of function.
Further analysis in FunRich to assess the molecular function, cellular components, and biological process classified the majority of the predicted targets of let-7i-5p and miR-451a into four molecular functions: transcription regulator activity, transcription factor activity, ubiquitin-specific protease activity, and unknown molecular function. The majority of the predicted targets were associated with five cellular components: nucleolus, cytoplasm, exosomes, proteasome complex, and nucleus. Further analysis revealed that most of the predicted targets were involved in five biological processes: signal transduction, cell communication, regulation of nucleobase, nucleoside, nucleotide, and nucleic acid metabolism, protein metabolism, and unknown biological process. Let-7i-5p and miR-451a play roles in multiple biological pathways. Thus, they could modulate SCD and malaria pathogenesis via multiple pathways, such as the inflammatory pathway, especially in HbSS and HbSC.
Moreover, miR-451a and let-7i-5p have been shown to be highly enriched in HbAS and HbSS erythrocytes in vitro [3]. MiR-451 and let-7 family of miRNAs have been shown to control key regulators of genes involved in immune function [57,58,59]. MiR-451a enhances erythroid differentiation and is involved in oxidative stress. Let-7i-5p acts directly on the 3′-UTR of BTB Domain and CNC Homolog 1 (BACH1), associated with heme binding, and negatively regulates the expression of this protein and thereby upregulates heme oxygenase-decycling 1 (HMOX1) gene expression [57,60,61]. HMOX1 gene codes for the Heme-oxygenase-1 (HO-1), the rate-limiting enzyme in the degradation of heme groups to biliverdin, carbon monoxide (CO), and iron. Increased free heme produced during malaria infection induces inflammation, which damages the host vascular endothelium and exacerbates fatal malaria pathogenesis [62,63,64,65]. As a cellular stress regulator, HO-1 protects against oxidative stress, heavy metal toxicity, UV radiation, inflammation, and prevents the deleterious effects of heme, as well as mediates anti-inflammatory and anti-apoptotic functions [66,67]. HO-1 induced by reactive oxygen species and nitric oxide (NO) is involved in regulating angiogenesis [68,69]. HO-1 facilitates the repair of injured tissues through the inhibition of infiltrating inflammatory cells [70]. In SCA, the HbS genotype causes hemolytic anemia, leading to the accumulation of high levels of cell-free Hb and free heme in plasma [71,72]. HbAS individuals (sickle cell trait) also accumulate low (non-pathologic) levels of heme in plasma [73]. Free heme in the erythrocytes has been implicated in damage of the red cell membrane, leading to higher red cell adhesion to the endothelium in SCA [74]. Higher frequency and severity of sickle cell crises is related to enhanced release of free heme, exhibited as membrane-bound iron [75]. Free heme plays a crucial role in SCA’s pathophysiology as a cofactor of HbS polymerization [76]. Once released from Hb, a phenomenon favored in HbS [77], free heme becomes cytotoxic [78,79,80]. In SCA patients, miR-451a and let-7i-5p overexpression could be behind the chronic inflammation observed as well as the harmful consequences of high levels of free heme due to abnormal HO-1 expression.
The samples used for this study were selected from a larger cohort, which compared hematological parameters between HbAA, HbAS, HbAC, HbSC, HbSS, and HbCC with and without malaria [33]. The study determined that Hb genotypes and malaria status changed an individual’s hematological parameters. For example, SCA individuals, regardless of malaria status, had increased WBC and platelet counts and lower Hb levels compared to other Hb genotypes [33]. Additionally, the same pool of samples was also used previously to measure cytokine and chemokine levels [81]. The study explored the possibility of using inflammatory cytokines as biomarkers between Hb genotypes and malaria [81]. In particular, IL-6, which let-7i-5p is known to target, was able to independently discriminate between HbAA− vs. HbAA+, HbAC− vs. HbAC+, and HbAS+ vs. HbAC+ [81]. We also found that the levels of other inflammatory cytokines were significantly different between genotypes with and without malaria [81]. A cross-examination of cytokine and miRNA levels was not possible due to the small sample size. Based on the significant association between SCD and malaria, these miRNAs may be able to help manage their pathogenesis.
The present study reveals significant changes in exosomal let-7i-5p and miR-451a levels and their association with SCD and malaria, but some limitations need to be considered. First, parasite densities of malaria-positive individuals were not explored, which may lead to systematic bias since other studies have shown parasite densities vary by Hb genotypes [82,83]. The gold standard for determining malaria infection is the RDT and thick blood smear. In this study, those with semi-immunity to malaria infection were not taken into consideration due to the limitations of the thick blood smear and rapid diagnostic tests. To remove this disparity, future experiments will use serological tests, such as an ELISA, to determine malaria antibody concentrations and confirm the presence of malaria in those who show a negative blood smear test but are still infected with the disease. Additionally, the severity of malaria was not categorized by severe or uncomplicated, which may have resulted in statistical bias. We do, however, report WBC counts and Hb levels, which are associated with inflammation and anemia, respectively, and are involved with SCD and malaria pathogenesis and severity. Additionally, this study illustrates a possible association between exosomal miRNA levels and inflammation via identifying potential targets and hematological characteristics. Instead, the article opens the discussion for further investigation into how these miRNAs directly impact inflammation in SCD and malaria. Finally, we only analyzed two of the miRNAs of interest in exosomes found in previous studies identifying RBC endogenous miRNAs. However, other circulating miRNAs have been identified in other studies [3,9,34]. To fully understand the role of exosomal miRNAs in malaria and SCD, further studies are needed to evaluate let-7i-5p and miR-451a, as well as other exosomal miRNAs.
5. Conclusions
In summary, exosomal let-7i-5p and miR-451a were differentially expressed in HbSS and HbSC. The predicted targets identified that let-7i-5p and miR-451a are associated with host inflammatory pathways. Our findings suggest that exosomal let-7i-5p and miR-451a may play a role in SCD and malaria pathogenesis. These miRNAs potentially modulate SCD and malaria pathogenesis by targeting inflammatory pathways via NFҡB. Understanding the relationship between exosomal miR-451a and let-7i-5p, SCT, SCD−induced-inflammatory responses, and malaria-induced-inflammatory responses may lead to novel approaches to interventions. Future interventions may include artificially encapsulated exosomes or liposomes with miRNAs, which could protect against malaria pathogenies and SCA severity.
Supplementary Materials
The following are available online at https://www.mdpi.com/article/10.3390/jcm11030500/s1, Figure S1: Comparisons of each Hb genotype with and without malaria individually for exosomal let-7i-5p and miR-451a levels, Figure S2: Venn Diagram illustrating predicted overlapping targets of miRNAs (let-7i-5p and miR-451a), Figure S3: Pathway interactions of predicted and known miRNA targets in IPA, Figure S4: Predicted targets, for miR-451a and let-7i-5p analyzed in FunRich.
Author Contributions
A.D. and J.K.S. designed the study. A.D., M.D.W., Y.D.-A., A.A.A. and F.B. provided support in patient enrollment and sample collection. K.O.H. and A.D. conducted the experiments. K.O.H., A.D., A.B. and J.K.S. analyzed and interpreted the data. K.O.H., A.B. and A.D. wrote the paper. K.O.H., A.B., F.B., S.A.I., M.D.W., Y.D.-A., A.A.A., J.K.S. and A.D. edited and approved final manuscript. All authors have read and agreed to the published version of the manuscript.
Funding
Research was supported by the National Institutes of Health, grant numbers NIH/FIC 1K01TW010282 (Driss, PI), NIH/FIC UJMT Fogarty Global Health Fellows Program #5R25TW009340 (Chi, PI), NIH/NIMHD Research Centers in Minority Institutions (RCMI) 5U54MD007602 (Bond, PI; Driss, pilot PI), National Center for Advancing Translational Sciences of the NIH TL1TR002382 (Harp, TL1 Trainee), NIH/NINDS 1R01NS091616 (Stiles, PI) and National Institute on Minority Health and Health Disparities G12MD007602 (Bond, PI), and NIH 2U54MD007602. No authors have any conflict of interest to declare.
Institutional Review Board Statement
Ethical approval was obtained from the University of Ghana’s Noguchi Memorial Institute for Medical Research and College of Health Sciences, and the Morehouse School of Medicine (Atlanta, GA) institutional review boards before the study’s commencement. The study was conducted according to the guidelines of the Declaration of Helsinki and approved by the Institutional Review of Morehouse School of Medicine (protocol code 966708-1 from 28 September 2016), and Ghana’s Noguchi Memorial Institute for Medical Research and College of Health Sciences (Protocol code KBTH-STC 0009/201-7 from 15 March 2017).
Informed Consent Statement
Informed consent was obtained from all subjects involved in the study. Participants of age ≥ 18 years gave their informed consent. Among persons aged < 18 years, parents or guardians provided written consent.
Data Availability Statement
For original data, please contact adel.driss@gmail.com.
Acknowledgments
The study was supported by National Institutes of Health, grant numbers NIH/FIC 1K01TW010282 (Driss, PI), NIH/FIC UJMT Fogarty Global Health Fellows Program #5R25TW009340 (Chi, PI), NIH/NIMHD Research Centers in Minority Institutions (RCMI) 5U54MD007602 (Bond, PI; Driss pilot PI), National Center for Advancing Translational Sciences of the NIH TL1TR002382 (Harp, TL1 Trainee), NIH/NINDS 1R01NS091616 (Stiles, PI), and National Institute on Minority Health and Health Disparities G12MD007602 (Bond, PI).
Conflicts of Interest
The authors declare no conflict of interest.
References
- Driss, A.; Asare, K.O.; Hibbert, J.M.; Gee, B.E.; Adamkiewicz, T.V.; Stiles, J.K. Sickle Cell Disease in the Post Genomic Era: A Monogenic Disease with a Polygenic Phenotype. Genom. Insights 2009, 2009, 23–48. [Google Scholar] [CrossRef]
- Quinn, C.T.; Rogers, Z.R.; Buchanan, G.R. Survival of children with sickle cell disease. Blood 2004, 103, 4023–4027. [Google Scholar] [CrossRef] [PubMed]
- LaMonte, G.; Philip, N.; Reardon, J.; Lacsina, J.R.; Majoros, W.; Chapman, L.; Thornburg, C.D.; Telen, M.J.; Ohler, U.; Nicchitta, C.V.; et al. Translocation of sickle cell erythrocyte microRNAs into Plasmodium falciparum inhibits parasite translation and contributes to malaria resistance. Cell Host Microbe 2012, 12, 187–199. [Google Scholar] [CrossRef] [PubMed]
- John, N. A review of clinical profile in sickle cell traits. Oman Med. J. 2010, 25, 3–8. [Google Scholar] [CrossRef] [PubMed]
- Mackinnon, M.J.; Mwangi, T.W.; Snow, R.W.; Marsh, K.; Williams, T.N. Heritability of malaria in Africa. PLoS Med. 2005, 2, e340. [Google Scholar] [CrossRef]
- Driss, A.; Hibbert, J.M.; Wilson, N.O.; Iqbal, S.A.; Adamkiewicz, T.V.; Stiles, J.K. Genetic polymorphisms linked to susceptibility to malaria. Malar. J. 2011, 10, 271. [Google Scholar] [CrossRef]
- WHO. Malaria. Available online: https://www.who.int/news-room/fact-sheets/detail/malaria (accessed on 23 May 2021).
- Sangokoya, C.; Telen, M.J.; Chi, J.T. microRNA miR-144 modulates oxidative stress tolerance and associates with anemia severity in sickle cell disease. Blood 2010, 116, 4338–4348. [Google Scholar] [CrossRef]
- Chen, S.Y.; Wang, Y.; Telen, M.J.; Chi, J.T. The genomic analysis of erythrocyte microRNA expression in sickle cell diseases. PLoS ONE 2008, 3, e2360. [Google Scholar] [CrossRef] [PubMed]
- Christopher, A.F.; Kaur, R.P.; Kaur, G.; Kaur, A.; Gupta, V.; Bansal, P. MicroRNA therapeutics: Discovering novel targets and developing specific therapy. Perspect. Clin. Res. 2016, 7, 68–74. [Google Scholar] [CrossRef]
- Mohr, A.M.; Mott, J.L. Overview of microRNA biology. Semin. Liver Dis. 2015, 35, 3–11. [Google Scholar] [CrossRef]
- Matsumura, T.; Sugimachi, K.; Iinuma, H.; Takahashi, Y.; Kurashige, J.; Sawada, G.; Ueda, M.; Uchi, R.; Ueo, H.; Takano, Y.; et al. Exosomal microRNA in serum is a novel biomarker of recurrence in human colorectal cancer. Br. J. Cancer 2015, 113, 275–281. [Google Scholar] [CrossRef] [PubMed]
- Guo, W.; Gao, Y.; Li, N.; Shao, F.; Wang, C.; Wang, P.; Yang, Z.; Li, R.; He, J. Exosomes: New players in cancer (Review). Oncol. Rep. 2017, 38, 665–675. [Google Scholar] [CrossRef]
- Li, R.; Chibbar, R.; Xiang, J. Novel EXO-T vaccine using polyclonal CD4(+) T cells armed with HER2-specific exosomes for HER2-positive breast cancer. OncoTargets Ther. 2018, 11, 7089–7093. [Google Scholar] [CrossRef] [PubMed]
- Nilsson, J.; Skog, J.; Nordstrand, A.; Baranov, V.; Mincheva-Nilsson, L.; Breakefield, X.O.; Widmark, A. Prostate cancer-derived urine exosomes: A novel approach to biomarkers for prostate cancer. Br. J. Cancer 2009, 100, 1603–1607. [Google Scholar] [CrossRef]
- Jalalian, S.H.; Ramezani, M.; Jalalian, S.A.; Abnous, K.; Taghdisi, S.M. Exosomes, new biomarkers in early cancer detection. Anal. Biochem. 2019, 571, 1–13. [Google Scholar] [CrossRef] [PubMed]
- Ha, T.Y. MicroRNAs in Human Diseases: From Lung, Liver and Kidney Diseases to Infectious Disease, Sickle Cell Disease and Endometrium Disease. Immune Netw. 2011, 11, 309–323. [Google Scholar] [CrossRef]
- Cohen, A.; Combes, V.; Grau, G.E. MicroRNAs and Malaria—A Dynamic Interaction Still Incompletely Understood. J. Neuroinfect. Dis. 2015, 6, 165. [Google Scholar]
- Iqbal, S.A.; Botchway, F.; Badu, K.; Wilson, N.O.; Dei-Adomakoh, Y.; Dickinson-Copeland, C.M.; Chinbuah, H.; Adjei, A.A.; Wilson, M.; Stiles, J.K.; et al. Hematological Differences among Malaria Patients in Rural and Urban Ghana. J. Trop. Pediatr. 2016, 62, 477–486. [Google Scholar] [CrossRef][Green Version]
- Driss, A.; Wilson, N.O.; Mason, K.; Hyacinth, H.I.; Hibbert, J.M.; Serjeant, G.R.; Stiles, J.K. Elevated IL-1α and CXCL10 Serum Levels Occur in Patients with Homozygous Sickle Cell Disease and a History of Acute Splenic Sequestration. Dis. Markers 2012, 32, 295–300. [Google Scholar] [CrossRef]
- Harp, D.; Driss, A.; Mehrabi, S.; Chowdhury, I.; Xu, W.; Liu, D.; Garcia-Barrio, M.; Taylor, R.N.; Gold, B.; Jefferson, S.; et al. Exosomes derived from endometriotic stromal cells have enhanced angiogenic effects in vitro. Cell Tissue Res. 2016, 365, 187–196. [Google Scholar] [CrossRef]
- Li, X.J.; Ren, Z.J.; Tang, J.H.; Yu, Q. Exosomal MicroRNA MiR-1246 Promotes Cell Proliferation, Invasion and Drug Resistance by Targeting CCNG2 in Breast Cancer. Cell. Physiol. Biochem. Int. J. Exp. Cell. Physiol. Biochem. Pharmacol. 2017, 44, 1741–1748. [Google Scholar] [CrossRef]
- Que, R.; Ding, G.; Chen, J.; Cao, L. Analysis of serum exosomal microRNAs and clinicopathologic features of patients with pancreatic adenocarcinoma. World J. Surg. Oncol. 2013, 11, 219. [Google Scholar] [CrossRef] [PubMed]
- Livak, K.J.; Schmittgen, T.D. Analysis of relative gene expression data using real-time quantitative PCR and the 2(-Delta Delta C(T)) Method. Methods 2001, 25, 402–408. [Google Scholar] [CrossRef] [PubMed]
- Vergoulis, T.; Vlachos, I.S.; Alexiou, P.; Georgakilas, G.; Maragkakis, M.; Reczko, M.; Gerangelos, S.; Koziris, N.; Dalamagas, T.; Hatzigeorgiou, A.G. TarBase 6.0: Capturing the exponential growth of miRNA targets with experimental support. Nucleic Acids Res. 2012, 40, D222–D229. [Google Scholar] [CrossRef] [PubMed]
- Miranda, K.C.; Huynh, T.; Tay, Y.; Ang, Y.S.; Tam, W.L.; Thomson, A.M.; Lim, B.; Rigoutsos, I. A pattern-based method for the identification of MicroRNA binding sites and their corresponding heteroduplexes. Cell 2006, 126, 1203–1217. [Google Scholar] [CrossRef]
- Wong, N.; Wang, X. miRDB: An online resource for microRNA target prediction and functional annotations. Nucleic Acids Res. 2015, 43, D146–D152. [Google Scholar] [CrossRef]
- Wang, X. Improving microRNA target prediction by modeling with unambiguously identified microRNA-target pairs from CLIP-ligation studies. Bioinformatics 2016, 32, 1316–1322. [Google Scholar] [CrossRef]
- Agarwal, V.; Bell, G.W.; Nam, J.W.; Bartel, D.P. Predicting effective microRNA target sites in mammalian mRNAs. Elife 2015, 4, e05005. [Google Scholar] [CrossRef]
- Betel, D.; Wilson, M.; Gabow, A.; Marks, D.S.; Sander, C. The microRNA.org resource: Targets and expression. Nucleic Acids Res. 2008, 36, D149–D153. [Google Scholar] [CrossRef]
- Pathan, M.; Keerthikumar, S.; Ang, C.S.; Gangoda, L.; Quek, C.Y.; Williamson, N.A.; Mouradov, D.; Sieber, O.M.; Simpson, R.J.; Salim, A.; et al. FunRich: An open access standalone functional enrichment and interaction network analysis tool. Proteomics 2015, 15, 2597–2601. [Google Scholar] [CrossRef]
- Wolf, S.; Wu, W.; Jones, C.; Perwitasari, O.; Mahalingam, S.; Tripp, R.A. MicroRNA Regulation of Human Genes Essential for Influenza A (H7N9) Replication. PLoS ONE 2016, 11, e0155104. [Google Scholar] [CrossRef]
- Harp, K.O.; Botchway, F.; Dei-Adomakoh, Y.; Wilson, M.D.; Mubasher, M.; Adjei, A.A.; Thompson, W.E.; Stiles, J.K.; Driss, A. Analysis of clinical presentation, hematological factors, self-reported bed net usage, and malaria burden in sickle cell disease patients. EClinicalMedicine 2021, 39, 101045. [Google Scholar] [CrossRef]
- Gupta, H.; Rubio, M.; Sitoe, A.; Varo, R.; Cisteró, P.; Madrid, L.; Cuamba, I.; Jimenez, A.; Martiáñez-Vendrell, X.; Barrios, D.; et al. Plasma MicroRNA Profiling of Plasmodium falciparum Biomass and Association with Severity of Malaria Disease. Emerg. Infect. Dis. 2021, 27, 430–442. [Google Scholar] [CrossRef]
- Shkurnikov, M.Y.; Knyazev, E.N.; Fomicheva, K.A.; Mikhailenko, D.S.; Nyushko, K.M.; Saribekyan, E.K.; Samatov, T.R.; Alekseev, B.Y. Analysis of Plasma microRNA Associated with Hemolysis. Bull. Exp. Biol. Med. 2016, 160, 748–750. [Google Scholar] [CrossRef] [PubMed]
- Ilesanmi, O.O. Pathological basis of symptoms and crises in sickle cell disorder: Implications for counseling and psychotherapy. Hematol. Rep. 2010, 2, e2. [Google Scholar] [CrossRef] [PubMed]
- Sun, Y.; Peng, R.; Peng, H.; Liu, H.; Wen, L.; Wu, T.; Yi, H.; Li, A.; Zhang, Z. miR-451 suppresses the NF-kappaB-mediated proinflammatory molecules expression through inhibiting LMP7 in diabetic nephropathy. Mol. Cell. Endocrinol. 2016, 433, 75–86. [Google Scholar] [CrossRef]
- Eyler, C.E.; Jackson, T.; Elliott, L.E.; De Castro, L.M.; Jonassaint, J.; Ashley-Koch, A.; Telen, M.J. beta(2)-Adrenergic receptor and adenylate cyclase gene polymorphisms affect sickle red cell adhesion. Br. J. Haematol. 2008, 141, 105–108. [Google Scholar] [CrossRef] [PubMed]
- Hines, P.C.; Zen, Q.; Burney, S.N.; Shea, D.A.; Ataga, K.I.; Orringer, E.P.; Telen, M.J.; Parise, L.V. Novel epinephrine and cyclic AMP-mediated activation of BCAM/Lu-dependent sickle (SS) RBC adhesion. Blood 2003, 101, 3281–3287. [Google Scholar] [CrossRef] [PubMed]
- Hoppe, C.; Klitz, W.; Cheng, S.; Apple, R.; Steiner, L.; Robles, L.; Girard, T.; Vichinsky, E.; Styles, L. Gene interactions and stroke risk in children with sickle cell anemia. Blood 2004, 103, 2391–2396. [Google Scholar] [CrossRef] [PubMed]
- Gladek, I.; Ferdin, J.; Horvat, S.; Calin, G.A.; Kunej, T. HIF1A gene polymorphisms and human diseases: Graphical review of 97 association studies. Genes Chromosomes Cancer 2017, 56, 439–452. [Google Scholar] [CrossRef] [PubMed]
- MacKinney, A.; Woska, E.; Spasojevic, I.; Batinic-Haberle, I.; Zennadi, R. Disrupting the vicious cycle created by NOX activation in sickle erythrocytes exposed to hypoxia/reoxygenation prevents adhesion and vasoocclusion. Redox Biol. 2019, 101097. [Google Scholar] [CrossRef]
- Payen, E.; Leboulch, P. Advances in stem cell transplantation and gene therapy in the beta-hemoglobinopathies. Hematol. Am. Soc. Hematol. Educ. Program. 2012, 2012, 276–283. [Google Scholar] [CrossRef]
- Ecsedi, M.; Grosshans, H. LIN-41/TRIM71: Emancipation of a miRNA target. Genes Dev. 2013, 27, 581–589. [Google Scholar] [CrossRef] [PubMed]
- Lee, Y.T.; de Vasconcellos, J.F.; Yuan, J.; Byrnes, C.; Noh, S.J.; Meier, E.R.; Kim, K.S.; Rabel, A.; Kaushal, M.; Muljo, S.A.; et al. LIN28B-mediated expression of fetal hemoglobin and production of fetal-like erythrocytes from adult human erythroblasts ex vivo. Blood 2013, 122, 1034–1041. [Google Scholar] [CrossRef] [PubMed]
- Fathallah, H.; Atweh, G.F. Induction of fetal hemoglobin in the treatment of sickle cell disease. Hematol. Am. Soc. Hematol. Educ. Program. 2006, 58–62. [Google Scholar] [CrossRef]
- Kahle, K.T.; Rinehart, J.; Lifton, R.P. Phosphoregulation of the Na-K-2Cl and K-Cl cotransporters by the WNK kinases. Biochim. Biophys. Acta 2010, 1802, 1150–1158. [Google Scholar] [CrossRef]
- Luo, N.; Li, G.; Li, Y.; Fan, X.; Wang, Y.; Ye, X.; Mo, X.; Zhou, J.; Yuan, W.; Tan, M.; et al. SAMD4B, a novel SAM-containing protein, inhibits AP-1-, p53- and p21-mediated transcriptional activity. BMB Rep. 2010, 43, 355–361. [Google Scholar] [CrossRef] [PubMed]
- Alawadhi, A.; Saint-Martin, C.; Bhanji, F.; Srour, M.; Atkinson, J.; Sebire, G. Acute Hemorrhagic Encephalitis Responding to Combined Decompressive Craniectomy, Intravenous Immunoglobulin, and Corticosteroid Therapies: Association with Novel RANBP2 Variant. Front. Neurol. 2018, 9, 130. [Google Scholar] [CrossRef]
- Li, S.M.; Wu, H.L.; Yu, X.; Tang, K.; Wang, S.G.; Ye, Z.Q.; Hu, J. The putative tumour suppressor miR-1-3p modulates prostate cancer cell aggressiveness by repressing E2F5 and PFTK1. J. Exp. Clin. Cancer Res. 2018, 37, 219. [Google Scholar] [CrossRef] [PubMed]
- Xing, D.; Suryo Rahmanto, Y.; Zeppernick, F.; Hannibal, C.G.; Kjaer, S.K.; Vang, R.; Shih, I.M.; Wang, T.L. Mutation of NRAS is a rare genetic event in ovarian low-grade serous carcinoma. Hum. Pathol. 2017, 68, 87–91. [Google Scholar] [CrossRef]
- Froimchuk, E.; Jang, Y.; Ge, K. Histone H3 lysine 4 methyltransferase KMT2D. Gene 2017, 627, 337–342. [Google Scholar] [CrossRef]
- Ro, M.; Park, J.; Nam, M.; Bang, H.J.; Yang, J.W.; Choi, K.S.; Kim, S.K.; Chung, J.H.; Kwack, K. Associations between single-nucleotide polymorphism in the FNDC3A and autism spectrum disorder in a Korean population. Psychiatry Res. 2013, 209, 246–248. [Google Scholar] [CrossRef]
- Haupt, S.; Hernandez, O.M.; Vijayakumaran, R.; Keam, S.; Haupt, Y. The long and the short of it: The MDM4 tail so far. J. Mol. Cell Biol. 2019, 11, 231–244. [Google Scholar] [CrossRef] [PubMed]
- Akinlade, K.S.; Kumuyi, A.S.; Rahamon, S.K.; Olaniyi, J.A. Insulin Sensitivity, Inflammation, and Basal Metabolic Rate in Adults with Sickle Cell Anemia. Int. J. Appl. Basic Med. Res. 2018, 8, 106–110. [Google Scholar] [CrossRef] [PubMed]
- Smiley, D.; Dagogo-Jack, S.; Umpierrez, G. Therapy insight: Metabolic and endocrine disorders in sickle cell disease. Nat. Clin. Practice. Endocrinol. Metab. 2008, 4, 102–109. [Google Scholar] [CrossRef] [PubMed]
- Yu, D.; dos Santos, C.O.; Zhao, G.; Jiang, J.; Amigo, J.D.; Khandros, E.; Dore, L.C.; Yao, Y.; D’Souza, J.; Zhang, Z.; et al. miR-451 protects against erythroid oxidant stress by repressing 14-3-3zeta. Genes Dev. 2010, 24, 1620–1633. [Google Scholar] [CrossRef] [PubMed]
- Tokumaru, S.; Suzuki, M.; Yamada, H.; Nagino, M.; Takahashi, T. let-7 regulates Dicer expression and constitutes a negative feedback loop. Carcinogenesis 2008, 29, 2073–2077. [Google Scholar] [CrossRef] [PubMed]
- Noh, S.J.; Miller, S.H.; Lee, Y.T.; Goh, S.H.; Marincola, F.M.; Stroncek, D.F.; Reed, C.; Wang, E.; Miller, J.L. Let-7 microRNAs are developmentally regulated in circulating human erythroid cells. J. Transl. Med. 2009, 7, 98. [Google Scholar] [CrossRef]
- Hou, W.; Tian, Q.; Steuerwald, N.M.; Schrum, L.W.; Bonkovsky, H.L. The let-7 microRNA enhances heme oxygenase-1 by suppressing Bach1 and attenuates oxidant injury in human hepatocytes. Biochim. Biophys. Acta 2012, 1819, 1113–1122. [Google Scholar] [CrossRef]
- Dossing, K.B.; Binderup, T.; Kaczkowski, B.; Jacobsen, A.; Rossing, M.; Winther, O.; Federspiel, B.; Knigge, U.; Kjaer, A.; Friis-Hansen, L. Down-Regulation of miR-129-5p and the let-7 Family in Neuroendocrine Tumors and Metastases Leads to Up-Regulation of Their Targets Egr1, G3bp1, Hmga2 and Bach1. Genes 2014, 6, 1–21. [Google Scholar] [CrossRef]
- Pamplona, A.; Hanscheid, T.; Epiphanio, S.; Mota, M.M.; Vigario, A.M. Cerebral malaria and the hemolysis/methemoglobin/heme hypothesis: Shedding new light on an old disease. Int. J. Biochem. Cell. Biol. 2009, 41, 711–716. [Google Scholar] [CrossRef] [PubMed]
- Pamplona, A.; Ferreira, A.; Balla, J.; Jeney, V.; Balla, G.; Epiphanio, S.; Chora, A.; Rodrigues, C.D.; Gregoire, I.P.; Cunha-Rodrigues, M.; et al. Heme oxygenase-1 and carbon monoxide suppress the pathogenesis of experimental cerebral malaria. Nat. Med. 2007, 13, 703–710. [Google Scholar] [CrossRef]
- Hunt, N.H.; Stocker, R. Heme moves to center stage in cerebral malaria. Nat. Med. 2007, 13, 667–669. [Google Scholar] [CrossRef] [PubMed]
- Epiphanio, S.; Campos, M.G.; Pamplona, A.; Carapau, D.; Pena, A.C.; Ataide, R.; Monteiro, C.A.; Felix, N.; Costa-Silva, A.; Marinho, C.R.; et al. VEGF promotes malaria-associated acute lung injury in mice. PLoS Pathog. 2010, 6, e1000916. [Google Scholar] [CrossRef]
- Geuken, E.; Buis, C.I.; Visser, D.S.; Blokzijl, H.; Moshage, H.; Nemes, B.; Leuvenink, H.G.; de Jong, K.P.; Peeters, P.M.; Slooff, M.J.; et al. Expression of heme oxygenase-1 in human livers before transplantation correlates with graft injury and function after transplantation. Am. J. Transplant. 2005, 5, 1875–1885. [Google Scholar] [CrossRef]
- Datta, D.; Banerjee, P.; Gasser, M.; Waaga-Gasser, A.M.; Pal, S. CXCR3-B can mediate growth-inhibitory signals in human renal cancer cells by down-regulating the expression of heme oxygenase-1. J. Biol. Chem. 2010, 285, 36842–36848. [Google Scholar] [CrossRef]
- Pae, H.O.; Oh, G.S.; Choi, B.M.; Kim, Y.M.; Chung, H.T. A molecular cascade showing nitric oxide-heme oxygenase-1-vascular endothelial growth factor-interleukin-8 sequence in human endothelial cells. Endocrinology 2005, 146, 2229–2238. [Google Scholar] [CrossRef]
- Bussolati, B.; Mason, J.C. Dual role of VEGF-induced heme-oxygenase-1 in angiogenesis. Antioxid. Redox Signal. 2006, 8, 1153–1163. [Google Scholar] [CrossRef] [PubMed]
- Datta, D.; Dormond, O.; Basu, A.; Briscoe, D.M.; Pal, S. Heme oxygenase-1 modulates the expression of the anti-angiogenic chemokine CXCL-10 in renal tubular epithelial cells. Am. J. Physiol. Renal. Physiol. 2007, 293, F1222–F1230. [Google Scholar] [CrossRef][Green Version]
- Williams, T.N. Human red blood cell polymorphisms and malaria. Curr. Opin. Microbiol. 2006, 9, 388–394. [Google Scholar] [CrossRef] [PubMed]
- Reiter, C.D.; Wang, X.; Tanus-Santos, J.E.; Hogg, N.; Cannon, R.O., 3rd; Schechter, A.N.; Gladwin, M.T. Cell-free hemoglobin limits nitric oxide bioavailability in sickle-cell disease. Nat. Med. 2002, 8, 1383–1389. [Google Scholar] [CrossRef]
- Muller-Eberhard, U.; Javid, J.; Liem, H.H.; Hanstein, A.; Hanna, M. Plasma concentrations of hemopexin, haptoglobin and heme in patients with various hemolytic diseases. Blood 1968, 32, 4. [Google Scholar] [CrossRef]
- Hebbel, R.P. Perspectives series: Cell adhesion in vascular biology. Adhesive interactions of sickle erythrocytes with endothelium. J. Clin. Investig. 1997, 99, 2561–2564. [Google Scholar] [CrossRef] [PubMed]
- Amin, B.R.; Bauersachs, R.M.; Meiselman, H.J.; Mohandas, N.; Hebbel, R.P.; Bowen, P.E.; Schlegel, R.A.; Williamson, P.; Westerman, M.P. Monozygotic twins with sickle cell anemia and discordant clinical courses: Clinical and laboratory studies. Hemoglobin 1991, 15, 247–256. [Google Scholar] [CrossRef] [PubMed]
- Ferreira, A.; Marguti, I.; Bechmann, I.; Jeney, V.; Chora, A.; Palha, N.R.; Rebelo, S.; Henri, A.; Beuzard, Y.; Soares, M.P. Sickle hemoglobin confers tolerance to Plasmodium infection. Cell 2011, 145, 398–409. [Google Scholar] [CrossRef]
- Hebbel, R.P.; Morgan, W.T.; Eaton, J.W.; Hedlund, B.E. Accelerated autoxidation and heme loss due to instability of sickle hemoglobin. Proc. Natl. Acad. Sci. USA 1988, 85, 237–241. [Google Scholar] [CrossRef]
- Seixas, E.; Gozzelino, R.; Chora, A.; Ferreira, A.; Silva, G.; Larsen, R.; Rebelo, S.; Penido, C.; Smith, N.R.; Coutinho, A.; et al. Heme oxygenase-1 affords protection against noncerebral forms of severe malaria. Proc. Natl. Acad. Sci. USA 2009, 106, 15837–15842. [Google Scholar] [CrossRef]
- Gozzelino, R.; Jeney, V.; Soares, M.P. Mechanisms of cell protection by heme oxygenase-1. Annu. Rev. Pharmacol. Toxicol. 2010, 50, 323–354. [Google Scholar] [CrossRef]
- Balla, J.; Jacob, H.S.; Balla, G.; Nath, K.; Vercellotti, G.M. Endothelial cell heme oxygenase and ferritin induction by heme proteins: A possible mechanism limiting shock damage. Trans. Assoc. Am. Physicians 1992, 105, 1–6. [Google Scholar]
- Harp, K.O.; Botchway, F.; Dei-Adomakoh, Y.; Wilson, M.D.; Hood, J.L.; Adjei, A.A.; Stiles, J.K.; Driss, A. Hemoglobin Genotypes Modulate Inflammatory Response to Plasmodium Infection. Front. Immunol. 2020, 11, 593546. [Google Scholar] [CrossRef]
- Komba, A.N.; Makani, J.; Sadarangani, M.; Ajala-Agbo, T.; Berkley, J.A.; Newton, C.R.; Marsh, K.; Williams, T.N. Malaria as a cause of morbidity and mortality in children with homozygous sickle cell disease on the coast of Kenya. Clin. Infect. Dis. 2009, 49, 216–222. [Google Scholar] [CrossRef] [PubMed]
- Albiti, A.H.; Nsiah, K. Comparative haematological parameters of HbAA and HbAS genotype children infected with Plasmodium falciparum malaria in Yemen. Hematology 2014, 19, 169–174. [Google Scholar] [CrossRef] [PubMed]


Publisher’s Note: MDPI stays neutral with regard to jurisdictional claims in published maps and institutional affiliations. |
© 2022 by the authors. Licensee MDPI, Basel, Switzerland. This article is an open access article distributed under the terms and conditions of the Creative Commons Attribution (CC BY) license (https://creativecommons.org/licenses/by/4.0/).