
An Expert-Supervised Registration Method for Multiparameter Description of the Knee Joint Using Serial Imaging

 , , , and
Abstract
:1. Introduction
2. Materials and Methods
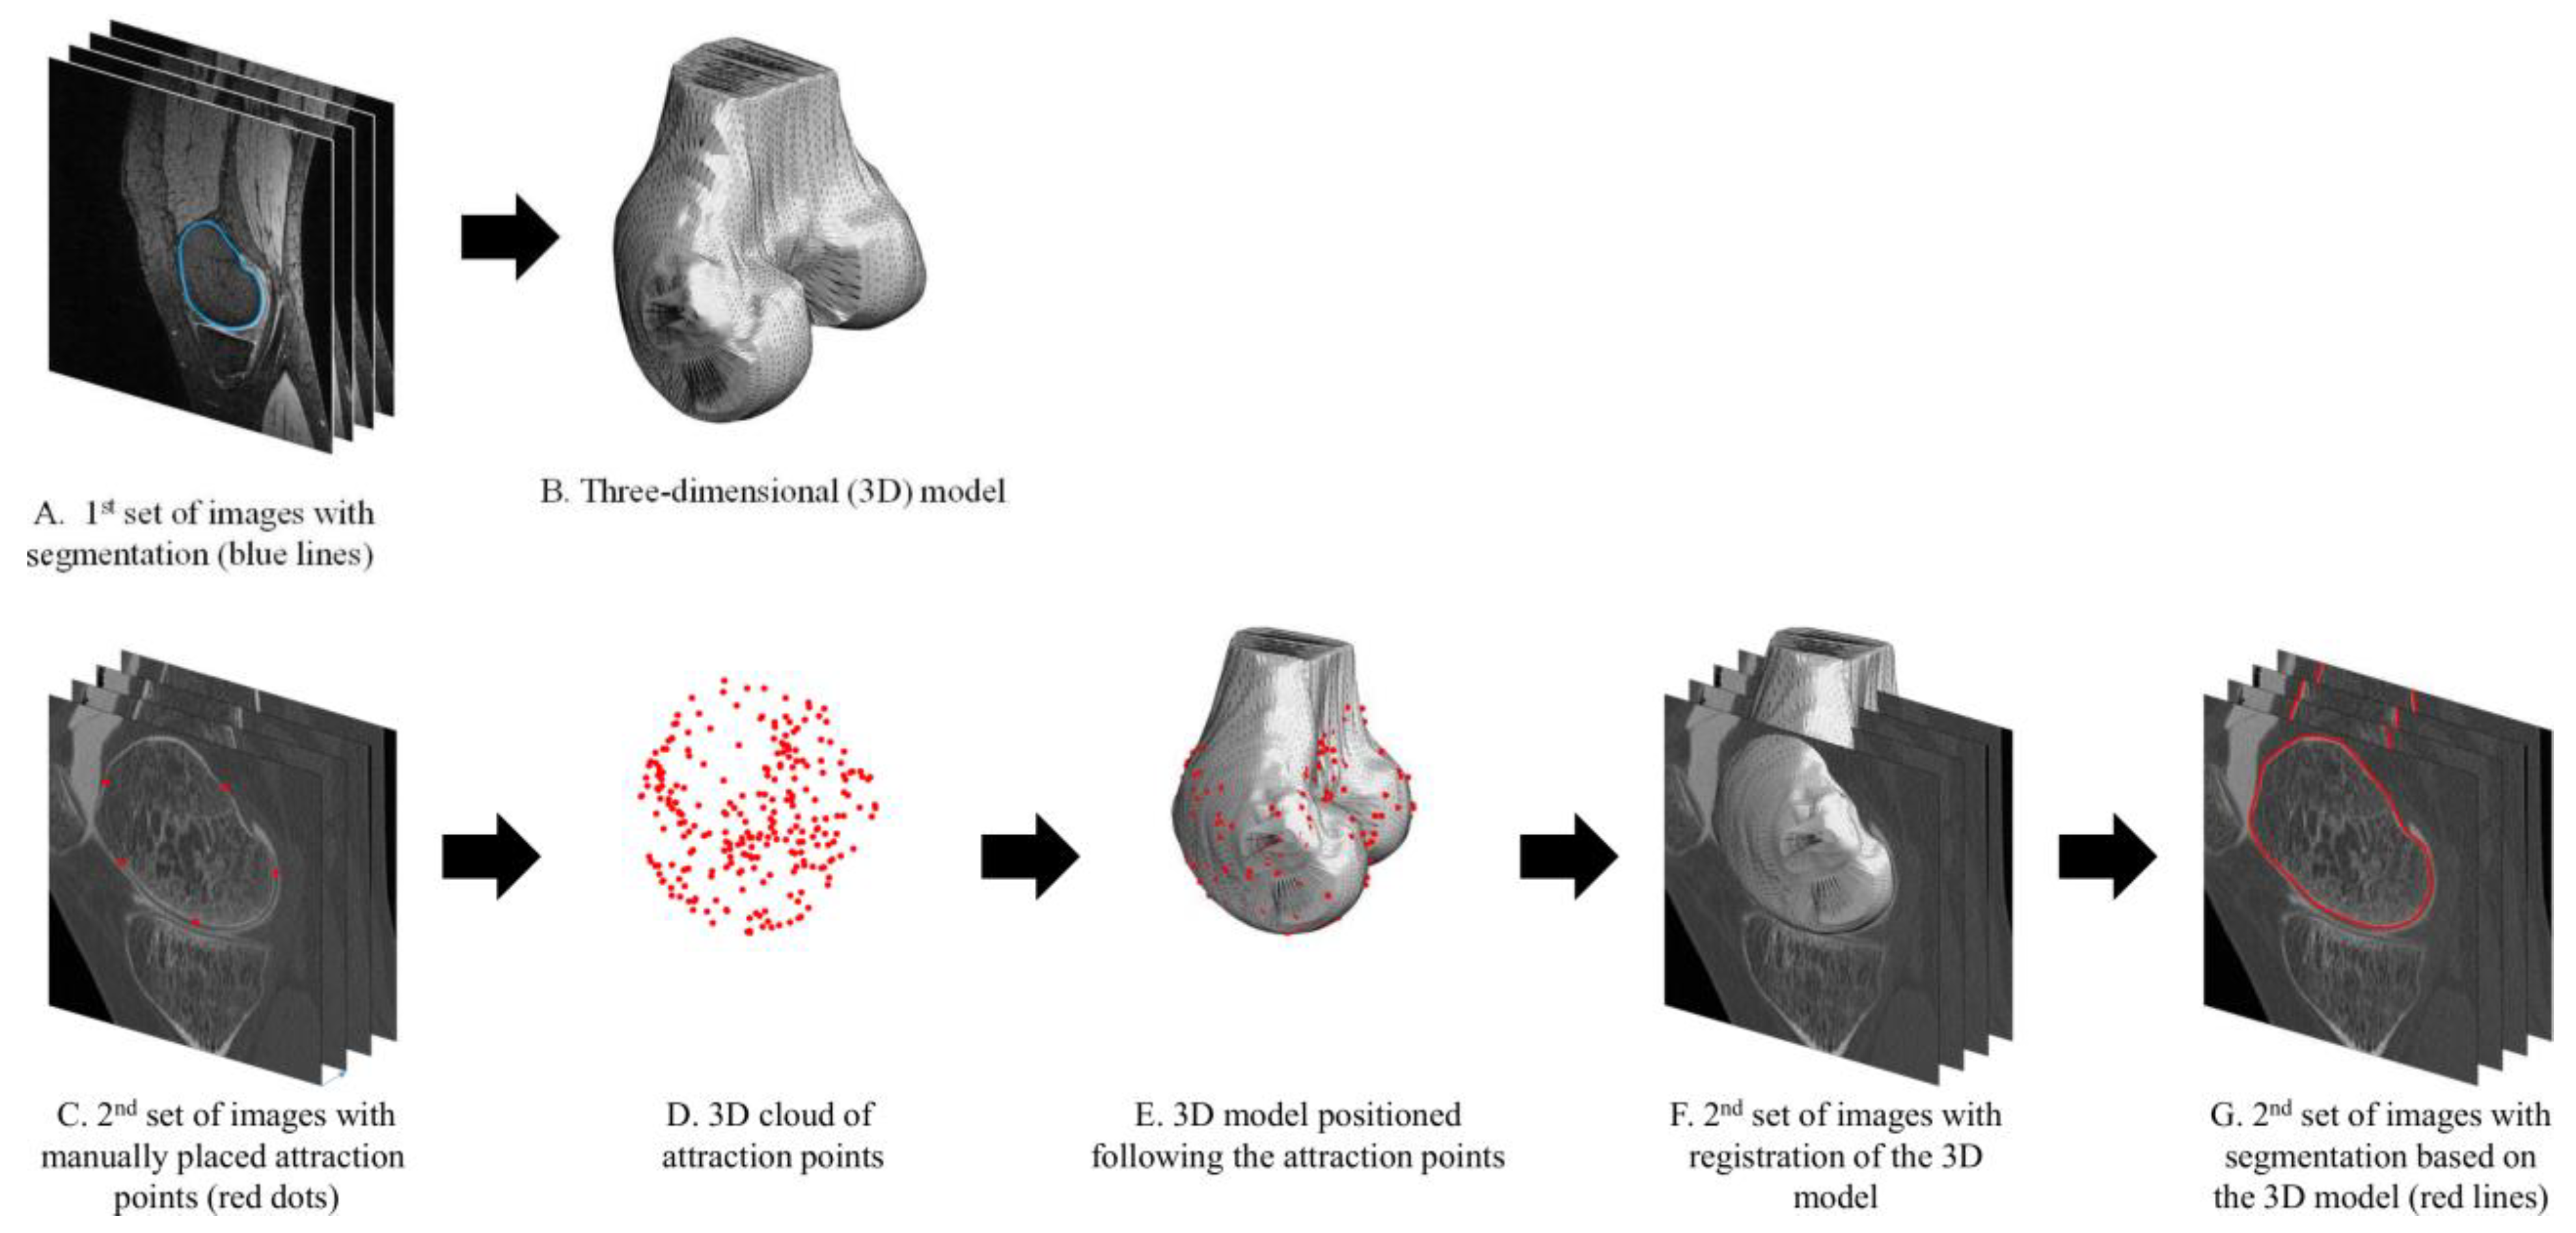
2.1. Expert-Supervised Registration Method
2.2. Imaging Datasets
2.3. Number of Attraction Points
2.4. Intraprotocol Registration Error
2.5. Intermodality Registration Error
3. Results
3.1. Number of Attraction Points
3.2. Intraprotocol Registration Error
3.3. Intermodality Registration Error
4. Discussion
5. Conclusions
Author Contributions
Funding
Institutional Review Board Statement
Informed Consent Statement
Data Availability Statement
Acknowledgments
Conflicts of Interest
References
- Conaghan, P.G.; Kloppenburg, M.; Schett, G.; Bijlsma, J.W.J. Osteoarthritis research priorities: A report from a EULAR ad hoc expert committee. Ann. Rheum. Dis. 2014, 73, 1442–1445. [Google Scholar] [CrossRef] [PubMed] [Green Version]
- Safiri, S.; Kolahi, A.-A.; Smith, E.; Hill, C.; Bettampadi, D.; Mansournia, M.A.; Hoy, D.; Ashrafi-Asgarabad, A.; Sepidarkish, M.; Almasi-Hashiani, A.; et al. Global, regional and national burden of osteoarthritis 1990–2017: A systematic analysis of the Global Burden of Disease Study 2017. Ann. Rheum. Dis. 2020, 79, 819–828. [Google Scholar] [CrossRef]
- Vos, T.; Flaxman, A.D.; Naghavi, M.; Lozano, R.; Michaud, C.; Ezzati, M.; Shibuya, K.; Salomon, J.A.; Abdalla, S.; Aboyans, V.; et al. Years lived with disability (YLDs) for 1160 sequelae of 289 diseases and injuries 1990–2010: A systematic analysis for the Global Burden of Disease Study 2010. Lancet 2012, 380, 2163–2196. [Google Scholar] [CrossRef]
- Edd, S.N.; Omoumi, P.; Andriacchi, T.; Jolles, B.; Favre, J. Modeling knee osteoarthritis pathophysiology using an integrated joint system (IJS): A systematic review of relationships among cartilage thickness, gait mechanics, and subchondral bone mineral density. Osteoarthr. Cartil. 2018, 26, 1425–1437. [Google Scholar] [CrossRef] [PubMed] [Green Version]
- Andriacchi, T.P.; Favre, J.; Erhart-Hledik, J.; Chu, C.R. A systems view of risk factors for knee osteoarthritis reveals insights into the pathogenesis of the disease. Ann. Biomed. Eng. 2014, 43, 376–387. [Google Scholar] [CrossRef] [PubMed]
- Peterfy, C.; Gold, G.; Eckstein, F.; Cicuttini, F.; Dardzinski, B.; Stevens, R. MRI protocols for whole-organ assessment of the knee in osteoarthritis. Osteoarthr. Cartil. 2006, 14, 95–111. [Google Scholar] [CrossRef] [Green Version]
- Hayashi, D.; Roemer, F.; Guermazi, A. Imaging for osteoarthritis. Ann. Phys. Rehabil. Med. 2016, 59, 161–169. [Google Scholar] [CrossRef] [PubMed]
- Eckstein, F.; Wirth, W.; Nevitt, M.C. Recent advances in osteoarthritis imaging—The osteoarthritis initiative. Nat. Rev. Rheumatol. 2012, 8, 622–630. [Google Scholar] [CrossRef]
- Burstein, D.; Gray, M.; Mosher, T.; Dardzinski, B. Measures of molecular composition and structure in osteoarthritis. Radiol. Clin. N. Am. 2009, 47, 675–686. [Google Scholar] [CrossRef]
- Babel, H.; Omoumi, P.; Cosendey, K.; Cadas, H.; Jolles, B.M.; Favre, J. Three-dimensional quantification of bone mineral density in the distal femur and proximal tibia based on computed tomography: In vitro evaluation of an extended standardization method. J. Clin. Med. 2021, 10, 160. [Google Scholar] [CrossRef]
- Cao, Y.; Stannus, O.P.; Aitken, D.; Cicuttini, F.; Antony, B.S.E.; Jones, G.; Ding, C. Cross-sectional and longitudinal associations between systemic, subchondral bone mineral density and knee cartilage thickness in older adults with or without radiographic osteoarthritis. Ann. Rheum. Dis. 2013, 73, 2003–2009. [Google Scholar] [CrossRef] [PubMed]
- Lo, G.H.; Tassinari, A.M.; Driban, J.B.; Price, L.L.; Schneider, E.; Majumdar, S.; McAlindon, T.E. Cross-sectional DXA and MR measures of tibial periarticular bone associate with radiographic knee osteoarthritis severity. Osteoarthr. Cartil. 2012, 20, 686–693. [Google Scholar] [CrossRef] [PubMed] [Green Version]
- Multanen, J.; Heinonen, A.; Häkkinen, A.; Kautiainen, H.; Kujala, U.; Lammentausta, E.; Jämsä, T.; Kiviranta, I.; Nieminen, M. Bone and cartilage characteristics in postmenopausal women with mild knee radiographic osteoarthritis and those without radiographic osteoarthritis. J. Musculoskelet. Neuronal Interact. 2015, 15, 69–77. [Google Scholar] [PubMed]
- Ahn, C.; Bui, T.D.; Lee, Y.-W.; Shin, J.; Park, H. Fully automated, level set-based segmentation for knee MRIs using an adaptive force function and template: Data from the osteoarthritis initiative. Biomed. Eng. Online 2016, 15, 99. [Google Scholar] [CrossRef] [Green Version]
- Tack, A.; Mukhopadhyay, A.; Zachow, S. Knee menisci segmentation using convolutional neural networks: Data from the osteoarthritis initiative. Osteoarthr. Cartil. 2018, 26, 680–688. [Google Scholar] [CrossRef]
- Kapur, T.; Beardsley, P.; Gibson, S.; Grimson, W.; Wells, W. Model-based segmentation of clinical knee MRI. In Proceedings of the IEEE International Workshop on Model-Based 3D Image Analysis, Bombay, India, 4–7 January 1998; pp. 97–106. [Google Scholar]
- Dam, E.B.; Lillholm, M.; Marques, J.; Nielsen, M. Automatic segmentation of high- and low-field knee MRIs using knee image quantification with data from the osteoarthritis initiative. J. Med. Imaging 2015, 2, 24001. [Google Scholar] [CrossRef] [Green Version]
- Shim, H.; Chang, S.; Tao, C.; Wang, J.-H.; Kwoh, C.K.; Bae, K.T. Knee cartilage: Efficient and reproducible segmentation on high-spatial-resolution MR images with the semiautomated graph-cut algorithm method. Radiology 2009, 251, 548–556. [Google Scholar] [CrossRef]
- Lo, G.H.; Hunter, D.J.; Zhang, Y.; McLennan, C.E.; LaValley, M.P.; Kiel, D.P.; McLean, R.R.; Genant, H.K.; Guermazi, A.; Felson, D.T. Bone marrow lesions in the knee are associated with increased local bone density. Arthritis Rheum. 2005, 52, 2814–2821. [Google Scholar] [CrossRef] [PubMed]
- Lo, G.H.; Niu, J.; McLennan, C.E.; Kiel, D.P.; McLean, R.R.; Guermazi, A.; Genant, H.K.; McAlindon, T.E.; Hunter, D.J. Meniscal damage associated with increased local subchondral bone mineral density: A Framingham study. Osteoarthr. Cartil. 2008, 16, 261–267. [Google Scholar] [CrossRef] [Green Version]
- Williams, A.; Winalski, C.S.; Chu, C.R. Early articular cartilage MRI T2 changes after anterior cruciate ligament reconstruction correlate with later changes in T2 and cartilage thickness. J. Orthop. Res. 2016, 35, 699–706. [Google Scholar] [CrossRef] [Green Version]
- Babel, H.; Omoumi, P.; Andriacchi, T.P.; Jolles, B.M.; Favre, J. New insight on the subchondral bone and cartilage functional unit: Bone mineral density and cartilage thickness are spatially correlated in non-osteoarthritic femoral condyles. Osteoarthr. Cartil. Open 2020, 2, 100079. [Google Scholar] [CrossRef]
- Favre, J.; Erhart-Hledik, J.C.; Blazek, K.; Fasel, B.; Gold, G.E.; Andriacchi, T.P. Anatomically standardized maps reveal distinct patterns of cartilage thickness with increasing severity of medial compartment knee osteoarthritis. J. Orthop. Res. 2017, 35, 2442–2451. [Google Scholar] [CrossRef] [PubMed] [Green Version]
- Favre, J.; Scanlan, S.F.; Erhart-Hledik, J.C.; Blazek, K.; Andriacchi, T.P. Patterns of femoral cartilage thickness are different in asymptomatic and osteoarthritic knees and can be used to detect disease-related differences between samples. J. Biomech. Eng. 2013, 135, 101002–101010. [Google Scholar] [CrossRef] [PubMed] [Green Version]
- Li, X.; Ma, C.B.; Link, T.M.; Castillo, D.-D.; Blumenkrantz, G.; Lozano, J.; Carballido-Gamio, J.; Ries, M.; Majumdar, S. In vivo T1ρ and T2 mapping of articular cartilage in osteoarthritis of the knee using 3T MRI. Osteoarthr. Cartil. 2007, 15, 789–797. [Google Scholar] [CrossRef] [PubMed] [Green Version]
- Carballido-Gamio, J.; Stahl, R.; Blumenkrantz, G.; Romero, A.; Majumdar, S.; Link, T.M. Spatial analysis of magnetic resonance T1ρ and T2 relaxation times improves classification between subjects with and without osteoarthritis. Med. Phys. 2009, 36, 4059–4067. [Google Scholar] [CrossRef] [Green Version]
- Lowitz, T.; Museyko, O.; Bousson, V.; Laouisset, L.; Kalender, W.A.; Laredo, J.-D.; Engelke, K. Bone marrow lesions identified by MRI in knee osteoarthritis are associated with locally increased bone mineral density measured by QCT. Osteoarthr. Cartil. 2013, 21, 957–964. [Google Scholar] [CrossRef] [Green Version]
- Li, X.; Pai, A.; Blumenkrantz, G.; Carballido-Gamio, J.; Link, T.; Ma, B.; Ries, M.; Majumdar, S. Spatial distribution and relationship of T1ρ and T2 relaxation times in knee cartilage with osteoarthritis. Magn. Reson. Med. Off. J. Int. Soc. Magn. Reson. Med. 2009, 61, 1310–1318. [Google Scholar] [CrossRef] [Green Version]
- Oliveira, F.P.; Tavares, J.M. Medical image registration: A review. Comput. Methods Biomech. Biomed. Eng. 2014, 17, 73–93. [Google Scholar] [CrossRef]
- Pluim, J.P.W.; Maintz, J.B.A.; Viergever, M.A. Mutual-information-based registration of medical images: A survey. IEEE Trans. Med. Imaging 2003, 22, 986–1004. [Google Scholar] [CrossRef]
- Edd, S.N.; Babel, H.; Kerkour, N.; Jolles, B.M.; Omoumi, P.; Favre, J. Comprehensive description of T2 value spatial variations in non-osteoarthritic femoral cartilage using three-dimensional registration of morphological and relaxometry data. Knee 2019, 26, 555–563. [Google Scholar] [CrossRef]
- Omoumi, P.; Babel, H.; Jolles, B.M.; Favre, J. Quantitative regional and sub-regional analysis of femoral and tibial subchondral bone mineral density (sBMD) using computed tomography (CT): Comparison of non-osteoarthritic (OA) and severe OA knees. Osteoarthr. Cartil. 2017, 25, 1850–1857. [Google Scholar] [CrossRef] [Green Version]
- Koo, S.; Gold, G.E.; Andriacchi, T.P. Considerations in measuring cartilage thickness using MRI: Factors influencing reproducibility and accuracy. Osteoarthr. Cartil. 2005, 13, 782–789. [Google Scholar] [CrossRef] [Green Version]
- Favre, J.; Babel, H.; Cavinato, A.; Blazek, K.; Jolles, B.M.; Andriacchi, T.P. Analyzing femorotibial cartilage thickness using anatomically standardized maps: Reproducibility and reference data. J. Clin. Med. 2021, 10, 461. [Google Scholar] [CrossRef]
- Myronenko, A.; Song, X. Point set registration: Coherent point drift. IEEE Trans. Pattern Anal. Mach. Intell. 2010, 32, 2262–2275. [Google Scholar] [CrossRef] [PubMed] [Green Version]
- Peterfy, C.G.; Guermazi, A.; Zaim, S.; Tirman, P.F.; Miaux, Y.; White, D.; Kothari, M.; Lu, Y.; Fye, K.; Zhao, S.; et al. Whole-organ magnetic resonance imaging score (WORMS) of the knee in osteoarthritis. Osteoarthr. Cartil. 2004, 12, 177–190. [Google Scholar] [CrossRef] [PubMed] [Green Version]
- Felson, D.T.; McAlindon, T.E.; Anderson, J.J.; Weissman, B.W.; Aliabadi, P.; Evans, S.; Levy, D.; LaValley, M.P. Defining radiographic osteoarthritis for the whole knee. Osteoarthr. Cartil. 1997, 5, 241–250. [Google Scholar] [CrossRef] [Green Version]
- Babalola, K.O.; Patenaude, B.; Aljabar, P.; Schnabel, J.; Kennedy, D.; Crum, W.; Smith, S.; Cootes, T.; Jenkinson, M.; Rueckert, D. An evaluation of four automatic methods of segmenting the subcortical structures in the brain. NeuroImage 2009, 47, 1435–1447. [Google Scholar] [CrossRef]
- Dice, L.R. Measures of the amount of ecologic association between species. Ecology 1945, 26, 297–302. [Google Scholar] [CrossRef]
- Wilcoxon, F. Individual comparisons by ranking methods. In Breakthroughs in Statistics; Kotz, S., Johnson, N.L., Eds.; Springer: Berlin/Heidelberg, Germany, 1992; pp. 196–202. [Google Scholar]
- Veldpaus, F.; Woltring, H.; Dortmans, L. A least-squares algorithm for the equiform transformation from spatial marker co-ordinates. J. Biomech. 1988, 21, 45–54. [Google Scholar] [CrossRef] [Green Version]
- Hayashi, D.; Roemer, F.W.; Guermazi, A. Recent advances in research imaging of osteoarthritis with focus on MRI, ultrasound and hybrid imaging. Clin. Exp. Rheumatol. 2018, 43–52. [Google Scholar]
- Aptel, S.; Lecocq-Teixeira, S.; Olivier, P.; Regent, D.; Teixeira, P.G.; Blum, A. Multimodality evaluation of musculoskeletal sarcoidosis: Imaging findings and literature review. Diagn. Interv. Imaging 2016, 97, 5–18. [Google Scholar] [CrossRef] [PubMed] [Green Version]
- Ellmann, S.; Beck, M.; Kuwert, T.; Uder, M.; Baeuerle, T. Multimodal imaging of bone metastases: From preclinical to clinical applications. J. Orthop. Transl. 2015, 3, 166–177. [Google Scholar] [CrossRef] [PubMed] [Green Version]
- Sheybani, E.F.; Khanna, G.; White, A.J.; Demertzis, J.L. Imaging of juvenile idiopathic arthritis: A multimodality approach. RadioGraphics 2013, 33, 1253–1273. [Google Scholar] [CrossRef]
- Theodorou, D.J.; Malizos, K.N.; Beris, A.E.; Theodorou, S.J.; Soucacos, P.N. Multimodal imaging quantitation of the lesion size in osteonecrosis of the femoral head. Clin. Orthop. Relat. Res. 2001, 386, 54–63. [Google Scholar] [CrossRef] [PubMed]
- Taddei, F.; Cristofolini, L.; Martelli, S.; Gill, H.; Viceconti, M. Subject-specific finite element models of long bones: An in vitro evaluation of the overall accuracy. J. Biomech. 2006, 39, 2457–2467. [Google Scholar] [CrossRef]
- Bowes, M.A.; McLure, S.W.; Wolstenholme, C.B.; Vincent, G.R.; Williams, S.; Grainger, A.; Conaghan, P.G. Osteoarthritic bone marrow lesions almost exclusively colocate with denuded cartilage: A 3D study using data from the osteoarthritis initiative. Ann. Rheum. Dis. 2016, 75, 1852–1857. [Google Scholar] [CrossRef] [PubMed]
- Cuadra, M.B.; Favre, J.; Omoumi, P. Quantification in musculoskeletal imaging using computational analysis and machine learning: Segmentation and radiomics. In Seminars in Musculoskeletal Radiology; Thieme Medical Publishers: New York, NY, USA, 2020; Volume 24, pp. 50–64. [Google Scholar]
- Williams, T.G.; Holmes, A.P.; Bowes, M.; Vincent, G.; Hutchinson, C.E.; Waterton, J.C.; Maciewicz, R.A.; Taylor, C. Measurement and visualisation of focal cartilage thickness change by MRI in a study of knee osteoarthritis using a novel image analysis tool. Br. J. Radiol. 2010, 83, 940–948. [Google Scholar] [CrossRef]
- Moro-oka, T.A.; Hamai, S.; Miura, H.; Shimoto, T.; Higaki, H.; Fregly, B.J.; Iwamoto, Y.; Banks, S. Can magnetic resonance imaging-derived bone models be used for accurate motion measurement with single-plane three-dimensional shape registration? J. Orthop. Res. 2007, 25, 867–872. [Google Scholar] [CrossRef]
- Lowitz, T.; Museyko, O.; Bousson, V.; Chappard, C.; Laouisset, L.; Laredo, J.-D.; Engelke, K. Advanced knee structure analysis (AKSA): A comparison of bone mineral density and trabecular texture measurements using computed tomography and high-resolution peripheral quantitative computed tomography of human knee cadavers. Arthritis Res. 2017, 19, 1. [Google Scholar] [CrossRef] [PubMed]
- Batiste, D.L.; Kirkley, A.; Laverty, S.; Thain, L.M.; Spouge, A.R.; Gati, J.S.; Foster, P.; Holdsworth, D.W. High-resolution MRI and micro-CT in an ex vivo rabbit anterior cruciate ligament transection model of osteoarthritis. Osteoarthr. Cartil. 2004, 12, 614–626. [Google Scholar] [CrossRef] [Green Version]
- MacKay, J.W.; Kaggie, J.D.; Treece, G.M.; McDonnell, S.M.; Khan, W.; Roberts, A.R.; Janiczek, R.L.; Graves, M.J.; Turmezei, T.D.; McCaskie, A.W. Three-dimensional surface-based analysis of cartilage MRI data in knee osteoarthritis: Validation and initial clinical application. J. Magn. Reson. Imaging 2020, 52, 1139–1151. [Google Scholar] [CrossRef] [PubMed]
- Xue, N.; Doellinger, M.; Fripp, J.; Ho, C.P.; Surowiec, R.K.; Schwarz, R. Automatic model-based semantic registration of multimodal MRI knee data. J. Magn. Reson. Imaging 2015, 41, 633–644. [Google Scholar] [CrossRef]
- Stammberger, T.; Hohe, J.; Englmeier, K.-H.; Reiser, M.; Eckstein, F. Elastic registration of 3D cartilage surfaces from MR image data for detecting local changes in cartilage thickness. Magn. Reson. Med. 2000, 44, 592–601. [Google Scholar] [CrossRef]
- Carballido-Gamio, J.; Bauer, J.S.; Stahl, R.; Lee, K.-Y.; Krause, S.; Link, T.M.; Majumdar, S. Inter-subject comparison of MRI knee cartilage thickness. Med. Image Anal. 2008, 12, 120–135. [Google Scholar] [CrossRef] [PubMed] [Green Version]
- Borotikar, B.S.; Sipprell, W.H., III; Wible, E.E.; Sheehan, F.T. A methodology to accurately quantify patellofemoral cartilage contact kinematics by combining 3D image shape registration and cine-PC MRI velocity data. J. Biomech. 2012, 45, 1117–1122. [Google Scholar] [CrossRef] [PubMed] [Green Version]


| Number of Attraction Points | |||||||
|---|---|---|---|---|---|---|---|
| 32 | 64 | 128 | 256 | 512 | 1024 | ||
| Femur | MAD | 0.53 A | 0.47 A,b | 0.42 b | 0.4 | 0.39 | 0.39 |
| (0.46, 0.80) | (0.40, 0.56) | (0.38, 0.49) | (0.37, 0.46) | (0.35, 0.45) | (0.35, 0.44) | ||
| Dice index | 0.95 a | 0.97 a | 0.97 | 0.97 | 0.97 | 0.98 | |
| (0.93, 0.97) | (0.95, 0.97) | (0.95, 0.98) | (0.96, 0.98) | (0.96, 0.98) | (0.96, 0.98) | ||
| Tibia | MAD | 0.54 A | 0.45 A,B | 0.39 B | 0.36 | 0.35 | 0.35 |
| (0.46, 0.62) | (0.40, 0.53) | (0.34, 0.45) | (0.33, 0.41) | (0.31, 0.41) | (0.31, 0.40) | ||
| Dice index | 0.96 a | 0.97 a,b | 0.97 b | 0.97 | 0.97 | 0.97 | |
| (0.95, 0.97) | (0.95, 0.97) | (0.96, 0.97) | (0.96, 0.98) | (0.96, 0.98) | (0.96, 0.98) | ||
| Expert-Supervised | Gold Standard | Substitution Gold Standard | ||
|---|---|---|---|---|
| Femur | MAD | 0.43 (0.41, 0.44) ** | 0.37 (0.33, 0.38) | 0.37 (0.31, 0.39) |
| Dice index | 0.97 (0.97, 0.97) ** | 0.98 (0.97, 0.98) | 0.98 (0.97, 0.98) | |
| Tibia | MAD | 0.39 (0.34, 0.40) ** | 0.32 (0.30, 0.34) | 0.33 (0.29, 0.34) |
| Dice index | 0.97 (0.97, 0.98) ** | 0.97 (0.97, 0.98) | 0.97 (0.97, 0.98) |
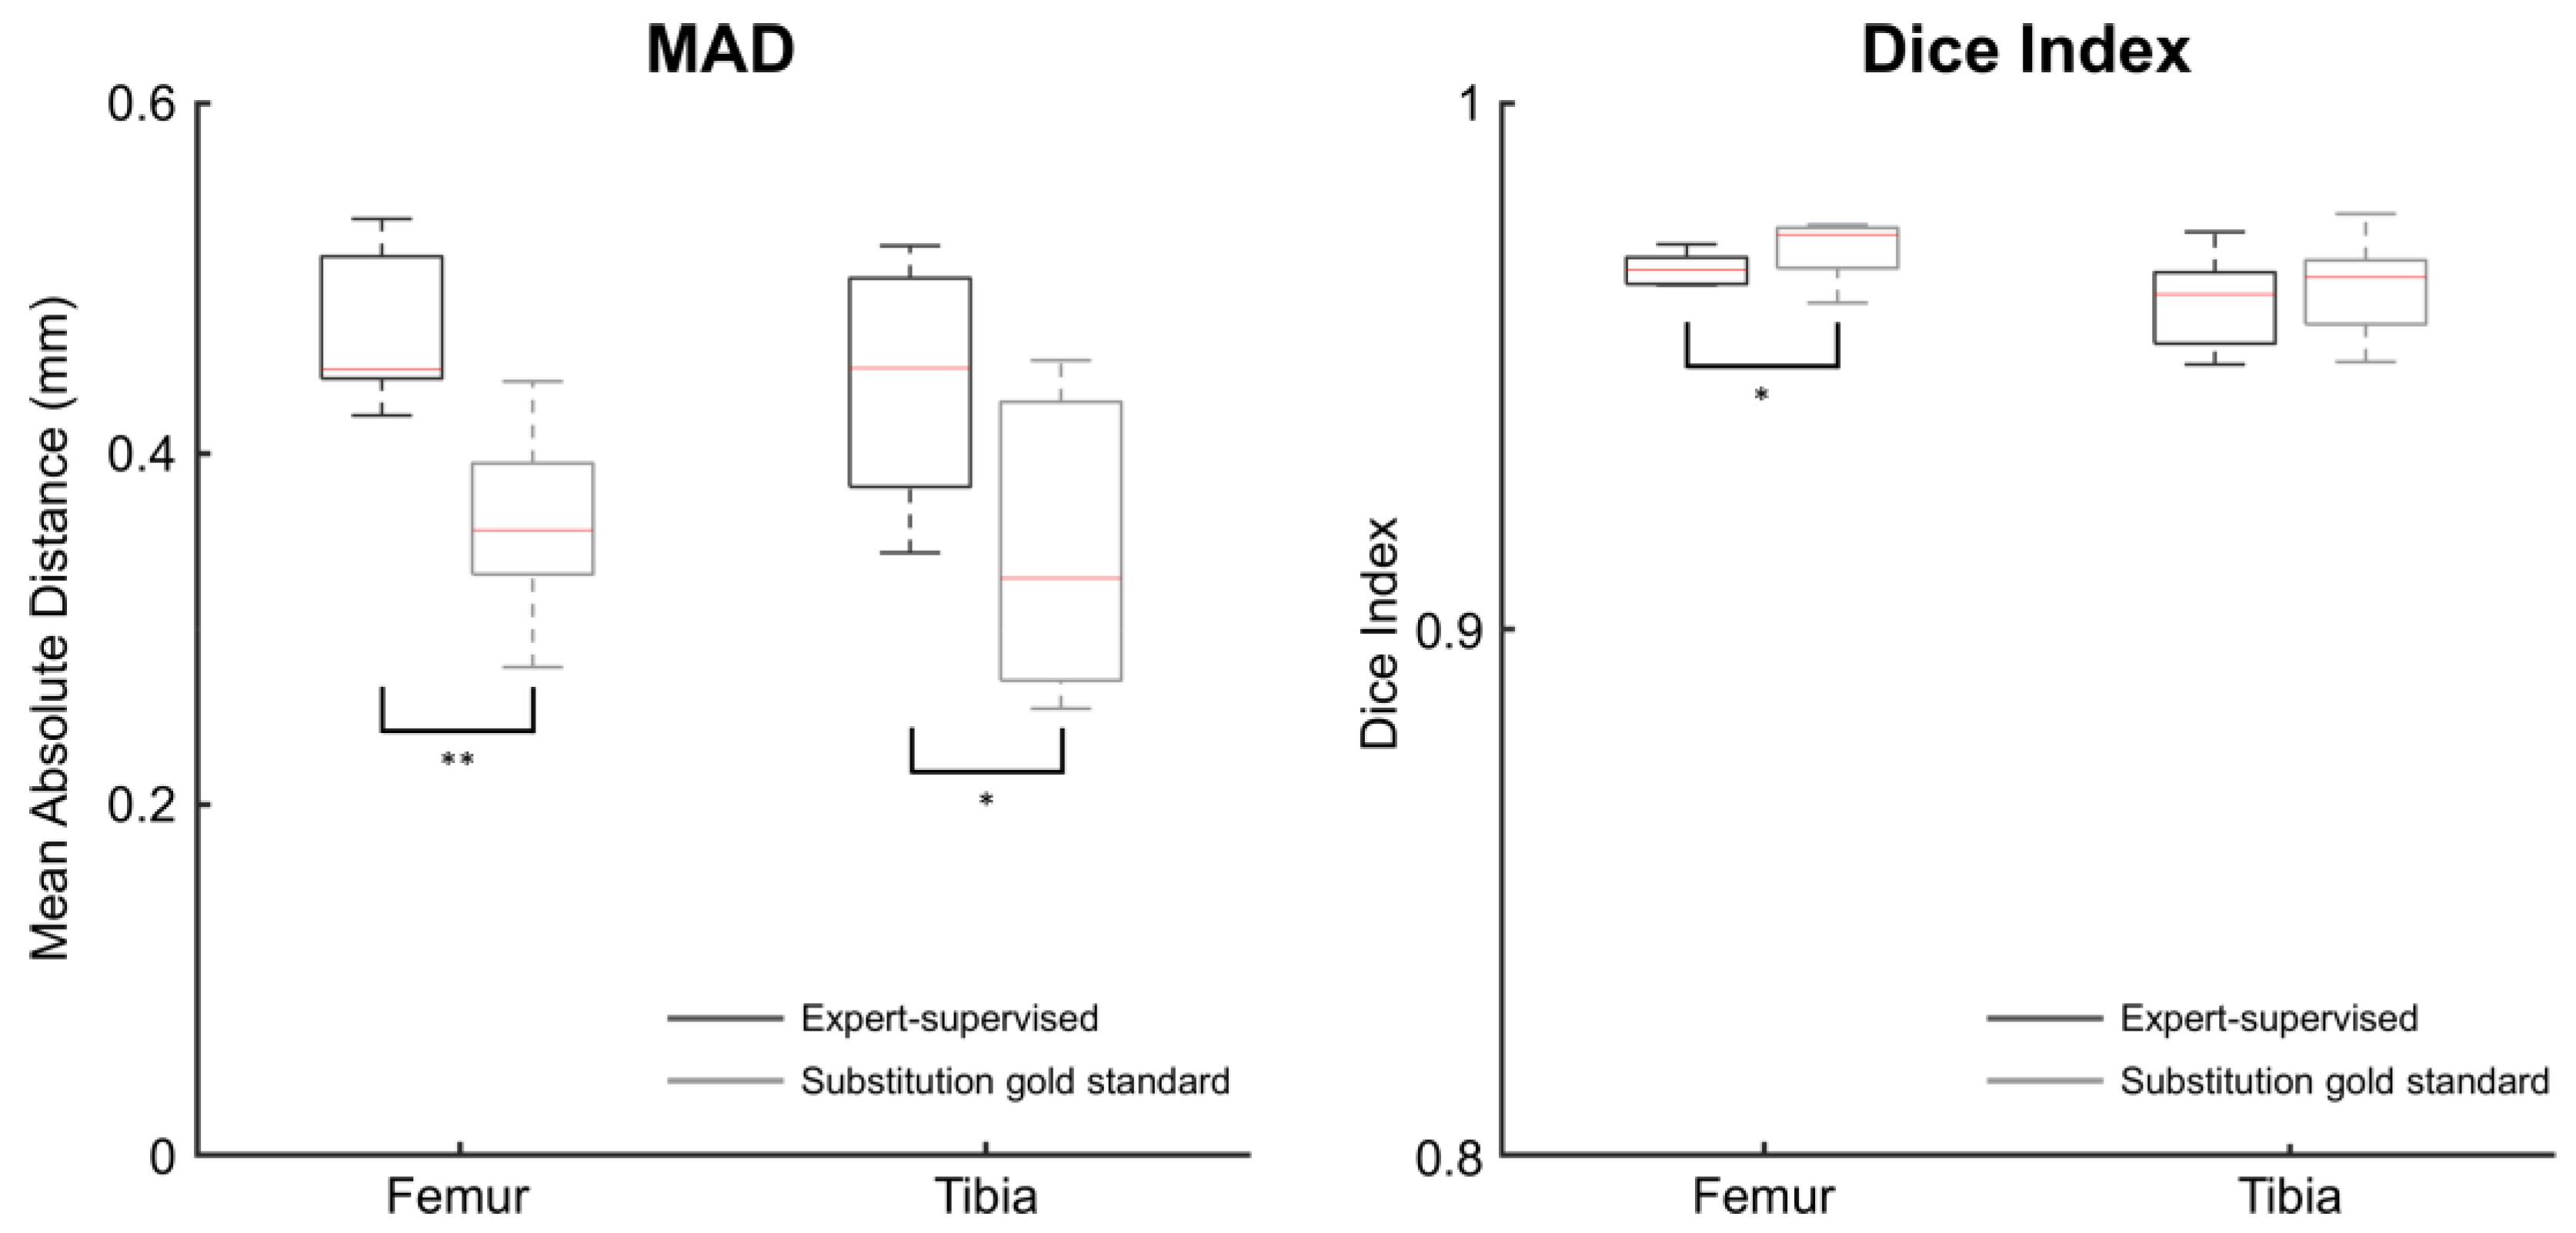
| Expert-Supervised | Substitution Gold Standard | ||
|---|---|---|---|
| Femur | MAD ** | 0.45 (0.44, 0.51) | 0.36 (0.33, 0.39) |
| Dice index * | 0.97 (0.97, 0.97) | 0.97 (0.97, 0.98) | |
| Tibia | MAD * | 0.45 (0.38, 0.50) | 0.33 (0.27, 0.43) |
| Dice index | 0.96 (0.95, 0.97) | 0.97 (0.96, 0.97) |
Publisher’s Note: MDPI stays neutral with regard to jurisdictional claims in published maps and institutional affiliations. |
© 2022 by the authors. Licensee MDPI, Basel, Switzerland. This article is an open access article distributed under the terms and conditions of the Creative Commons Attribution (CC BY) license (https://creativecommons.org/licenses/by/4.0/).
Share and Cite
Babel, H.; Omoumi, P.; Cosendey, K.; Stanovici, J.; Cadas, H.; Jolles, B.M.; Favre, J. An Expert-Supervised Registration Method for Multiparameter Description of the Knee Joint Using Serial Imaging. J. Clin. Med. 2022, 11, 548. https://doi.org/10.3390/jcm11030548
Babel H, Omoumi P, Cosendey K, Stanovici J, Cadas H, Jolles BM, Favre J. An Expert-Supervised Registration Method for Multiparameter Description of the Knee Joint Using Serial Imaging. Journal of Clinical Medicine. 2022; 11(3):548. https://doi.org/10.3390/jcm11030548
Chicago/Turabian StyleBabel, Hugo, Patrick Omoumi, Killian Cosendey, Julien Stanovici, Hugues Cadas, Brigitte M. Jolles, and Julien Favre. 2022. "An Expert-Supervised Registration Method for Multiparameter Description of the Knee Joint Using Serial Imaging" Journal of Clinical Medicine 11, no. 3: 548. https://doi.org/10.3390/jcm11030548