
Graft Failure Due to Nonadherence among 150 Prospectively-Followed Kidney Transplant Recipients at 18 Years Post-transplant: Our Results and Review of the Literature

 ,
, 
Abstract
:1. Introduction
2. Materials and Methods
2.1. Data Description
2.2. Statistical Analysis
3. Results
3.1. Distributions of Selected Baseline Variables
3.2. Cause-Specific Graft Loss for All Patients Combined and Stratified by Recipient Age
3.3. Multivariable Analyses of GFNA
3.4. Characterization of NA Occurrence
4. Discussion
5. Conclusions
Author Contributions
Funding
Institutional Review Board Statement
Informed Consent Statement
Data Availability Statement
Conflicts of Interest
References
- Gaynor, J.J.; Ciancio, G.; Guerra, G.; Sageshima, J.; Hanson, L.; Roth, D.; Chen, L.; Kupin, W.; Mattiazzi, A.; Tueros, L.; et al. Graft failure due to noncompliance among 628 kidney transplant recipients with long-term follow-up: A single-center observational study. Transplantation 2014, 97, 925–933. [Google Scholar] [CrossRef] [PubMed]
- Didlake, R.H.; Dreyfus, K.; Kerman, R.H.; Van Buren, C.T.; Kahan, B.D. Patient noncompliance: A major cause of late graft failure in cyclosporine-treated renal transplants. Transplant. Proc. 1988, 20, 63–69. [Google Scholar] [PubMed]
- Dunn, J.; Golden, D.; Van Buren, C.T.; Lewis, B.M.; Lawen, J.; Kahan, B.D. Causes of graft loss beyond two years in the cyclosporine era. Transplantation 1990, 49, 349–353. [Google Scholar] [CrossRef]
- Bergmann, L.S.; Roper, L.; Bow, L.M.; Hull, D.; Bartus, S.A.; Schweizer, R.T. Causes of late graft failure in cadaveric renal transplantation. Transplant. Proc. 1993, 25, 1340–1341. [Google Scholar]
- Gaston, R.S.; Hudson, S.L.; Ward, M.; Jones, P.; Macon, R. Late renal allograft loss: Noncompliance masquerading as chronic rejection. Transplant. Proc. 1999, 31, 21S–23S. [Google Scholar] [CrossRef]
- Matas, A.J.; Humar, A.; Gillingham, K.J.; Payne, W.D.; Gruessner, R.W.; Kandaswamy, R.; Dunn, D.L.; Najarian, J.S.; Sutherland, D.E. Five preventable causes of kidney graft loss in the 1990s: A single-center analysis. Kidney Int. 2002, 62, 704–714. [Google Scholar] [CrossRef] [Green Version]
- Michelon, T.F.; Piovesan, F.; Pozza, R.; Castilho, C.; Bittar, A.E.; Keitel, E.; Santos, A.; Goldani, J.C.; Garcia, C.D.; Neumann, J.; et al. Noncompliance as a cause of renal graft loss. Transplant. Proc. 2002, 34, 2768–2770. [Google Scholar] [CrossRef]
- Butler, J.A.; Roderick, P.; Mullee, M.; Mason, J.C.; Peveler, R.C. Frequency and impact of nonadherence to immunosuppressants after renal transplantation: A systematic review. Transplantation 2004, 77, 769–789. [Google Scholar] [CrossRef]
- Dunn, T.B.; Browne, B.J.; Gillingham, K.J.; Kandaswamy, R.; Humar, A.; Payne, W.D.; Sutherland, D.E.R.; Matas, A.J. Selective retransplant after graft loss to nonadherence: Success with a second chance. Am. J. Transplant. 2009, 9, 1337–1346. [Google Scholar] [CrossRef] [Green Version]
- Sellarés, J.; De Freitas, D.G.; Mengel, M.; Reeve, J.; Einecke, G.; Sis, B.; Hidalgo, L.G.; Famulski, K.; Matas, A.; Halloran, P.F. Understanding the causes of kidney transplant failure: The dominant role of antibody-mediated rejection and nonadherence. Am. J. Transplant. 2012, 12, 388–399. [Google Scholar] [CrossRef]
- Ciancio, G.; Gaynor, J.J.; Guerra, G.; Roth, D.; Chen, L.; Kupin, W.; Mattiazzi, A.; Ortigosa-Goggins, M.; Moni, L.; Burke, G.W. Randomized trial of 3 maintenance regimens (TAC/SRL vs. TAC/MMF vs. CSA/SRL) with low-dose corticosteroids in primary kidney transplantation: 18-year results. Clin. Transplant. 2020, 34, e14123. [Google Scholar] [CrossRef] [PubMed]
- Guerra, G.; Ciancio, G.; Gaynor, J.J.; Zarak, A.; Brown, R.; Hanson, L.; Sageshima, J.; Roth, D.; Chen, L.; Kupin, W.; et al. Randomized trial of immunosuppressive regimens in renal transplantation. J. Am. Soc. Nephrol. 2011, 22, 1758–1768. [Google Scholar] [CrossRef] [PubMed]
- Greenstein, S.; Siegal, B. Evaluation of a multivariate model predicting noncompliance with medication regimens among renal transplant patients. Transplantation 2000, 69, 2226–2228. [Google Scholar] [CrossRef] [PubMed]
- Chisholm, M.A.; Lance, C.E.; Mulloy, L.L. Patient factors associated with adherence to immunosuppressant therapy in renal transplant recipients. Am. J. Health-Syst. Pharm. 2005, 62, 1775–1781. [Google Scholar] [CrossRef] [PubMed]
- Rosenberger, J.; Geckova, A.M.; van Dijk, J.P.; Nagyova, I.; Roland, R.; van den Heuvel, W.J.A.; Groothoff, J.W. Prevalence and characteristics of noncompliant behaviour and its risk factors in kidney transplant recipients. Transplant. Int. 2005, 18, 1072–1078. [Google Scholar] [CrossRef] [Green Version]
- Denhaerynck, K.; Desmyttere, A.; Dobbels, F.; Moons, P.; Young, J.; Siegal, B.; Greenstein, S.; Steiger, J.; Vanrenterghem, Y.; Squifflet, J.P.; et al. Nonadherence with immunosuppressive drugs: US compared with European kidney transplant recipients. Prog. Transplant. 2006, 16, 206–214. [Google Scholar] [CrossRef]
- Dobbels, F.; Berben, L.; De Geest, S.; Drent, G.; Lennerling, A.; Whittaker, C.; Kugler, C. The psychometric properties and practicability of self-report instruments to identify medication nonadherence in adult transplant patients: A systematic review. Transplantation 2010, 90, 205–219. [Google Scholar] [CrossRef]
- De Bleser, L.; Dobbels, F.; Berben, L.; Vanhaecke, J.; Verleden, G.; Nevens, F.; De Geest, S. The spectrum of nonadherence with medication in heart, liver, and lung transplant patients assessed in various ways. Transplant. Int. 2011, 24, 882–891. [Google Scholar] [CrossRef]
- Lennerling, A.; Forsberg, A. Self-reported non-adherence and beliefs about medication in a Swedish kidney transplant population. Open Nurs. J. 2012, 6, 41–46. [Google Scholar] [CrossRef] [Green Version]
- Couzi, L.; Moulin, B.; Morin, M.P.; Albano, L.; Godin, M.; Barrou, B.; Alamartine, E.; Morelon, E.; Girardot-Seguin, S.; Mendes, L.; et al. Factors predictive of medication nonadherence after renal transplantation: A French observational study. Transplantation 2013, 95, 326–332. [Google Scholar] [CrossRef]
- Massey, E.K.; Tielen, M.; Laging, M.; Beck, D.K.; Khemai, R.; van Gelder, T.; Weimar, W. The role of goal cognitions, illness perceptions and treatment beliefs in self-reported adherence after kidney transplantation: A cohort study. J. Psychosom. Res. 2013, 75, 229–234. [Google Scholar] [CrossRef] [PubMed]
- Massey, E.K.; Meys, K.; Kerner, R.; Weimar, W.; Roodnat, J.; Cransberg, K. Young adult kidney transplant recipients: Nonadherent and happy. Transplantation 2015, 99, e89–e96. [Google Scholar] [CrossRef] [PubMed]
- Massey, E.K.; Tielen, M.; Laging, M.; Timman, R.; Beck, D.K.; Khemai, R.; van Gelder, T.; Weimar, W. Discrepancies between beliefs and behavior: A prospective study into immunosuppressive medication adherence after kidney transplantation. Transplantation 2015, 99, 375–380. [Google Scholar] [CrossRef] [PubMed]
- Dobbels, F.; De Bleser, L.; Berben, L.; Kristanto, P.; Dupont, L.; Nevens, F.; Vanhaecke, J.; Verleden, G.; De Geest, S. Efficacy of a medication adherence enhancing intervention in transplantation: The MAESTRO-Tx trial. J. Heart Lung Transplant. 2017, 36, 499–508. [Google Scholar] [CrossRef] [Green Version]
- Gustavsen, M.T.; Midtvedt, K.; Lønning, K.; Jacobsen, T.; Reisaeter, A.V.; De Geest, S.; Andersen, M.H.; Hartmann, A.; Åsberg, A. Evaluation of tools for annual capture of adherence to immunosuppressive medications after renal transplantation—A single-centre open prospective trial. Transplant. Int. 2019, 32, 614–625. [Google Scholar] [CrossRef] [Green Version]
- Xia, M.; Yan, J.; Liu, S.; Liu, J. Beliefs of immunosuppressive medication among Chinese renal transplant recipients, as assessed in a cross-sectional study with the Basel Assessment of Adherence to Immunosuppressive Medications Scale. Transplant. Proc. 2019, 51, 742–748. [Google Scholar] [CrossRef]
- Kuypers, D.R.J. From nonadherence to adherence. Transplantation 2020, 104, 1330–1340. [Google Scholar] [CrossRef]
- Fellström, B.; Holmdahl, J.; Sundvall, N.; Cockburn, E.; Kilany, S.; Wennberg, L. Adherence of renal transplant recipients to once-daily, prolonged-release and twice-daily, immediate-release tacrolimus-based regimens in a real-life setting in Sweden. Transplant. Proc. 2020, 52, 3238–3245. [Google Scholar] [CrossRef]
- Prezelin-Reydit, M.; Dubois, V.; Caillard, S.; Parissiadis, A.; Etienne, I.; Hau, F.; Albano, L.; Pourtein, M.; Barrou, B.; Taupin, J.-L.; et al. Prospective measures of adherence by questionnaire, low immunosuppression and graft outcome in kidney transplantation. J. Clin. Med. 2021, 10, 2032. [Google Scholar] [CrossRef]
- Liu, J.; Zhu, X.; Yan, J.; Gong, L.; Wu, X.; Liu, M.; Mao, P. Association between regultaory emotional self-efficacy and immunosuppressive medication adherence in renal transplant recipients: Does medication belief act as a mediator? Front. Pharmacol. 2021, 12, 559368. [Google Scholar] [CrossRef]
- Ciancio, G.; Burke, G.W.; Gaynor, J.J.; Ruiz, P.; Roth, D.; Kupin, W.; Rosen, A.; Miller, J. A randomized long-term trial of tacrolimus/sirolimus versus tacrolimus/mycophenolate versus cyclosporine/sirolimus in renal transplantation: Three-year analysis. Transplantation 2006, 81, 845–852. [Google Scholar] [CrossRef] [PubMed]
- Ciancio, G.; Burke, G.W.; Gaynor, J.J.; Mattiazzi, A.; Roth, D.; Kupin, W.; Nicolas, M.; Ruiz, P.; Rosen, A.; Miller, J. A randomized long-term trial of tacrolimus and sirolimus versus tacrolimus and mycophenolate mofetil versus cyclosporine (NEORAL) and sirolimus in renal transplantation. I. Drug interactions and rejection at one year. Transplantation 2004, 77, 244–251. [Google Scholar] [CrossRef] [PubMed]
- Ciancio, G.; Burke, G.W.; Gaynor, J.J.; Mattiazzi, A.; Roth, D.; Kupin, W.; Nicolas, M.; Ruiz, P.; Rosen, A.; Miller, J. A randomized long-term trial of tacrolimus/sirolimus versus tacrolimus/mycophenolate mofetil versus cyclosporine (NEORAL)/sirolimus in renal transplantation. II. Survival, function, and protocol compliance at 1 year. Transplantation 2004, 77, 252–258. [Google Scholar] [CrossRef] [PubMed]
- Prentice, R.L.; Kalbfleisch, J.D.; Peterson, A.; Flournoy, N.; Farewell, V.; Breslow, N. The analysis of failure times in the presence of competing risks. Biometrics 1978, 34, 541–554. [Google Scholar] [CrossRef] [PubMed]
- Gaynor, J.J.; Feuer, E.J.; Tan, C.C.; Wu, D.H.; Little, C.R.; Straus, D.J.; Clarkson, B.D.; Brennan, M.F. On the use of cause-specific failure and conditional failure probabilities: Examples from clinical oncology data. J. Am. Stat. Assoc. 1993, 88, 400–409. [Google Scholar] [CrossRef]
- Fine, J.P.; Gray, R.J. A proportional hazards model for the subdistribution of a competing risk. J. Am. Stat. Assoc. 1999, 94, 496–509. [Google Scholar] [CrossRef]
- Putter, H.; Fiocco, M.; Geskus, R.B. Tutorial in biostatistics: Competing risks and multi-state models. Stat. Med. 2007, 26, 2389–2430. [Google Scholar] [CrossRef]
- Rovelli, M.; Palmeri, D.; Vossler, E.; Bartus, S.; Hull, D.; Schweizer, R. Noncompliance in renal transplant recipients: Evaluation by socioeconomic groups. Transplant. Proc. 1989, 21, 3979–3981. [Google Scholar]
- Rovelli, M.; Palmeri, D.; Vossler, E.; Bartus, S.; Hull, D.; Schweizer, R. Noncompliance in organ transplant recipients. Transplant. Proc. 1989, 21, 833–834. [Google Scholar]
- Ghods, A.J.; Nasrollahzadeh, D.; Argani, H. Risk factors for noncompliance to immunosuppressive medications in renal transplant recipients. Transplant. Proc. 2003, 35, 2609–2611. [Google Scholar] [CrossRef]
- Takemoto, S.K.; Pinsky, B.W.; Schnitzler, M.A.; Lentine, K.L.; Willoughby, L.M.; Burroughs, T.E.; Bunnapradist, S. A retrospective analysis of immunosuppression compliance, dose reduction and discontinuation in kidney transplant recipients. Am. J. Transplant. 2007, 7, 2704–2711. [Google Scholar] [CrossRef]
- Pinsky, B.W.; Takemoto, S.K.; Lentine, K.L.; Burroughs, T.E.; Schnitzler, M.A.; Salvalaggio, P.R. Transplant outcomes and economic costs associated with patient noncompliance to immunosuppression. Am. J. Transplant. 2009, 9, 2597–2606. [Google Scholar] [CrossRef] [PubMed]
- Frazier, P.; Davis-Ali, S.; Dahl, K. Correlates of noncompliance among renal transplant recipients. Clin. Transplant. 1994, 8, 550–557. [Google Scholar] [PubMed]
- Sketris, I.; Waite, N.; Grobler, K.; West, M.; Gerus, S. Factors affecting compliance with cyclosporine in adult renal transplant patients. Transplant. Proc. 1994, 26, 2538–2541. [Google Scholar] [PubMed]
- Greenstein, S.; Siegal, B. Compliance and noncompliance in patients with a functioning renal transplant: A multicenter study. Transplantation 1998, 66, 1718–1726. [Google Scholar] [CrossRef]
- Raiz, L.R.; Kilty, K.M.; Henry, M.L.; Ferguson, R.M. Medication compliance following renal transplantation. Transplantation 1999, 68, 51–55. [Google Scholar] [CrossRef]
- Schweizer, R.T.; Rovelli, M.; Palmeri, D.; Vossler, E.; Hull, D.; Bartus, S. Noncompliance in organ transplant recipients. Transplantation 1990, 49, 374–377. [Google Scholar] [CrossRef]
- Butkus, D.E.; Meydrech, E.F.; Raju, S.S. Racial differences in the survival of cadaveric renal allografts: Overriding effects of HLA matching and socioeconomic factors. N. Engl. J. Med. 1992, 327, 840–845. [Google Scholar] [CrossRef]
- Kiley, D.J.; Lam, C.S.; Pollak, R. A study of treatment compliance following kidney transplantation. Transplantation 1993, 55, 51–56. [Google Scholar] [CrossRef]
- Nevins, T.E.; Kruse, L.; Skeans, M.A.; Thomas, W. The natural history of azathioprine compliance after renal transplantation. Kidney Int. 2001, 60, 1565–1570. [Google Scholar] [CrossRef] [Green Version]
- Weng, F.L.; Israni, A.K.; Joffe, M.M.; Hoy, T.; Gaughan, C.A.; Newman, M.; Abrams, J.D.; Kamoun, M.; Rosas, S.E.; Mange, K.C.; et al. Race and electronically measured adherence to immunosuppressive medications after deceased donor renal transplantation. J. Am. Soc. Nephrol. 2005, 16, 1839–1848. [Google Scholar] [CrossRef] [PubMed] [Green Version]
- Woodward, R.S.; Schnitzler, M.A.; Lowell, J.A.; Spitznagel, E.L.; Brennan, D.C. Effect of extended coverage of immunosuppression medications by Medicare on the survival of cadaveric renal transplants. Am. J. Transplant. 2001, 1, 69–73. [Google Scholar] [CrossRef] [PubMed] [Green Version]
- Yen, E.F.; Hardinger, K.; Brennan, D.C.; Woodward, R.S.; Desai, N.M.; Crippin, J.S.; Gage, B.F.; Schnitzler, M.A. Cost-effectiveness of extending Medicare coverage of immunosuppressive medications to the life of a kidney transplant. Am. J. Transplant. 2004, 4, 1703–1708. [Google Scholar] [CrossRef] [PubMed] [Green Version]
- Woodward, R.S.; Page, T.F.; Soares, R.; Schnitzler, M.A.; Lentine, K.L.; Brennan, D.C. Income-related disparities in kidney transplant graft failures are eliminated by Medicare’s immunosuppression coverage. Am. J. Transplant. 2008, 8, 2636–2646. [Google Scholar] [CrossRef]
- Pullen, L.C. The economy of transplant: Saving money and saving lives. Am. J. Transplant. 2021, 21, 1353–1354. [Google Scholar] [CrossRef]
- Russell, C.L.; Hathaway, D.; Remy, L.M.; Aholt, D.; Clark, D.; Miller, C.; Ashbaugh, C.; Wakefield, M.; Ye, S.; Staggs, V.S.; et al. Improving medication adherence and outcomes in adult kidney transplant patients using a personal systems approach: SystemCHANGETM results of the MAGIC randomized clinical trial. Am. J. Transplant. 2020, 20, 125–136. [Google Scholar] [CrossRef]
- Foster, B.J.; Pai, A.L.; Zelikovsky, N.; Amaral, S.; Bell, L.; Dharnidharka, V.R.; Hebert, D.; Holly, C.; Knauper, B.; Matsell, D.; et al. A randomized trial of a multicomponent intervention to promote medication adherence: The teen adherence in kidney transplant effectiveness of intervention trial (TAKE-IT). Am. J. Kidney Dis. 2018, 72, 30–41. [Google Scholar] [CrossRef]
- Foster, B.J. Multicomponent interventions improve adherence—Where do we go from here? Am. J. Transplant. 2020, 20, 5–6. [Google Scholar] [CrossRef] [Green Version]


| Baseline Variable | Percentage with Characteristic if Categorical | Mean ± SE if Continuous |
|---|---|---|
| Recipient age (years) | 46.9 ± 1.2 (N = 150) | |
| (Median = 48.0, range: 14–78) | ||
| Recipient gender | ||
| Female | 33.3% (50/150) | |
| Male | 66.7% (100/150) | |
| Recipient race/ethnicity | ||
| Black (non-Hispanic) | 20.7% (31/150) | |
| Hispanic | 37.3% (56/150) | |
| White (non-Hispanic) a | 42.0% (63/150) | |
| Recipient BMI (kg/m2) | 25.6 ± 0.4 (N = 150) | |
| (Median = 25.0, range: 16.0–44.0) | ||
| Recipient pretransplant diabetes mellitus | ||
| No | 82.7% (124/150) | |
| Yes | 17.3% (26/150) | |
| Recipient pretransplant history of cardiovascular disease | ||
| No | 81.3% (122/150) | |
| Yes | 18.7% (28/150) | |
| Preemptive transplant | ||
| No | 88.0% (132/150) | |
| Yes | 12.0% (18/150) | |
| Pretransplant time on dialysis (months) b | 29.1 ± 2.5 (N = 150) | |
| (Median = 20.7, range: 0–173.0) | ||
| Donor age (years) | 37.7 ± 1.2 (N = 150) | |
| (Median = 37.5, range: 11–66) | ||
| Donor type | ||
| LD | 19.3% (29/150) | |
| DD | 80.7% (121/150) | |
| CIT (h) among DD recipients | 32.2 ± 0.7 (N = 121) | |
| (Median = 32, range: 17–59) | ||
| DCD status | ||
| No | 96.0% (144/150) | |
| Yes | 4.0% (6/150) | |
| ECD status | ||
| No | 90.0% (135/150) | |
| Yes | 10.0% (15/150) | |
| PRA >5% | ||
| No | 95.3% (143/150) | |
| Yes | 4.7% (7/150) | |
| Total no. of HLA Mismatches | 3.6 ± 0.1 (N = 150) | |
| (Median = 4, Range: 0–6) |
| (a) All Patients Combined (N = 150) | ||||
| Months | CIF: NFG | CIF: GFNA | CIF: Other GF | CIF: DWFG |
| Post-Transplant | % ± SE | % ± SE | % ± SE | % ± SE |
| 60 | 2.7 ± 1.3 | 6.1 ± 2.0 | 7.4 ± 2.1 | 10.1 ± 2.5 |
| 120 | 2.7 ± 1.3 | 11.1 ± 2.6 | 13.0 ± 2.8 | 16.4 ± 3.1 |
| 180 | 2.7 ± 1.3 | 13.5 ± 2.9 | 18.8 ± 3.3 | 25.2 ± 3.7 |
| 216 | 2.7 ± 1.3 | 16.9 ± 3.4 | 23.8 ± 3.8 | 30.2 ± 4.1 |
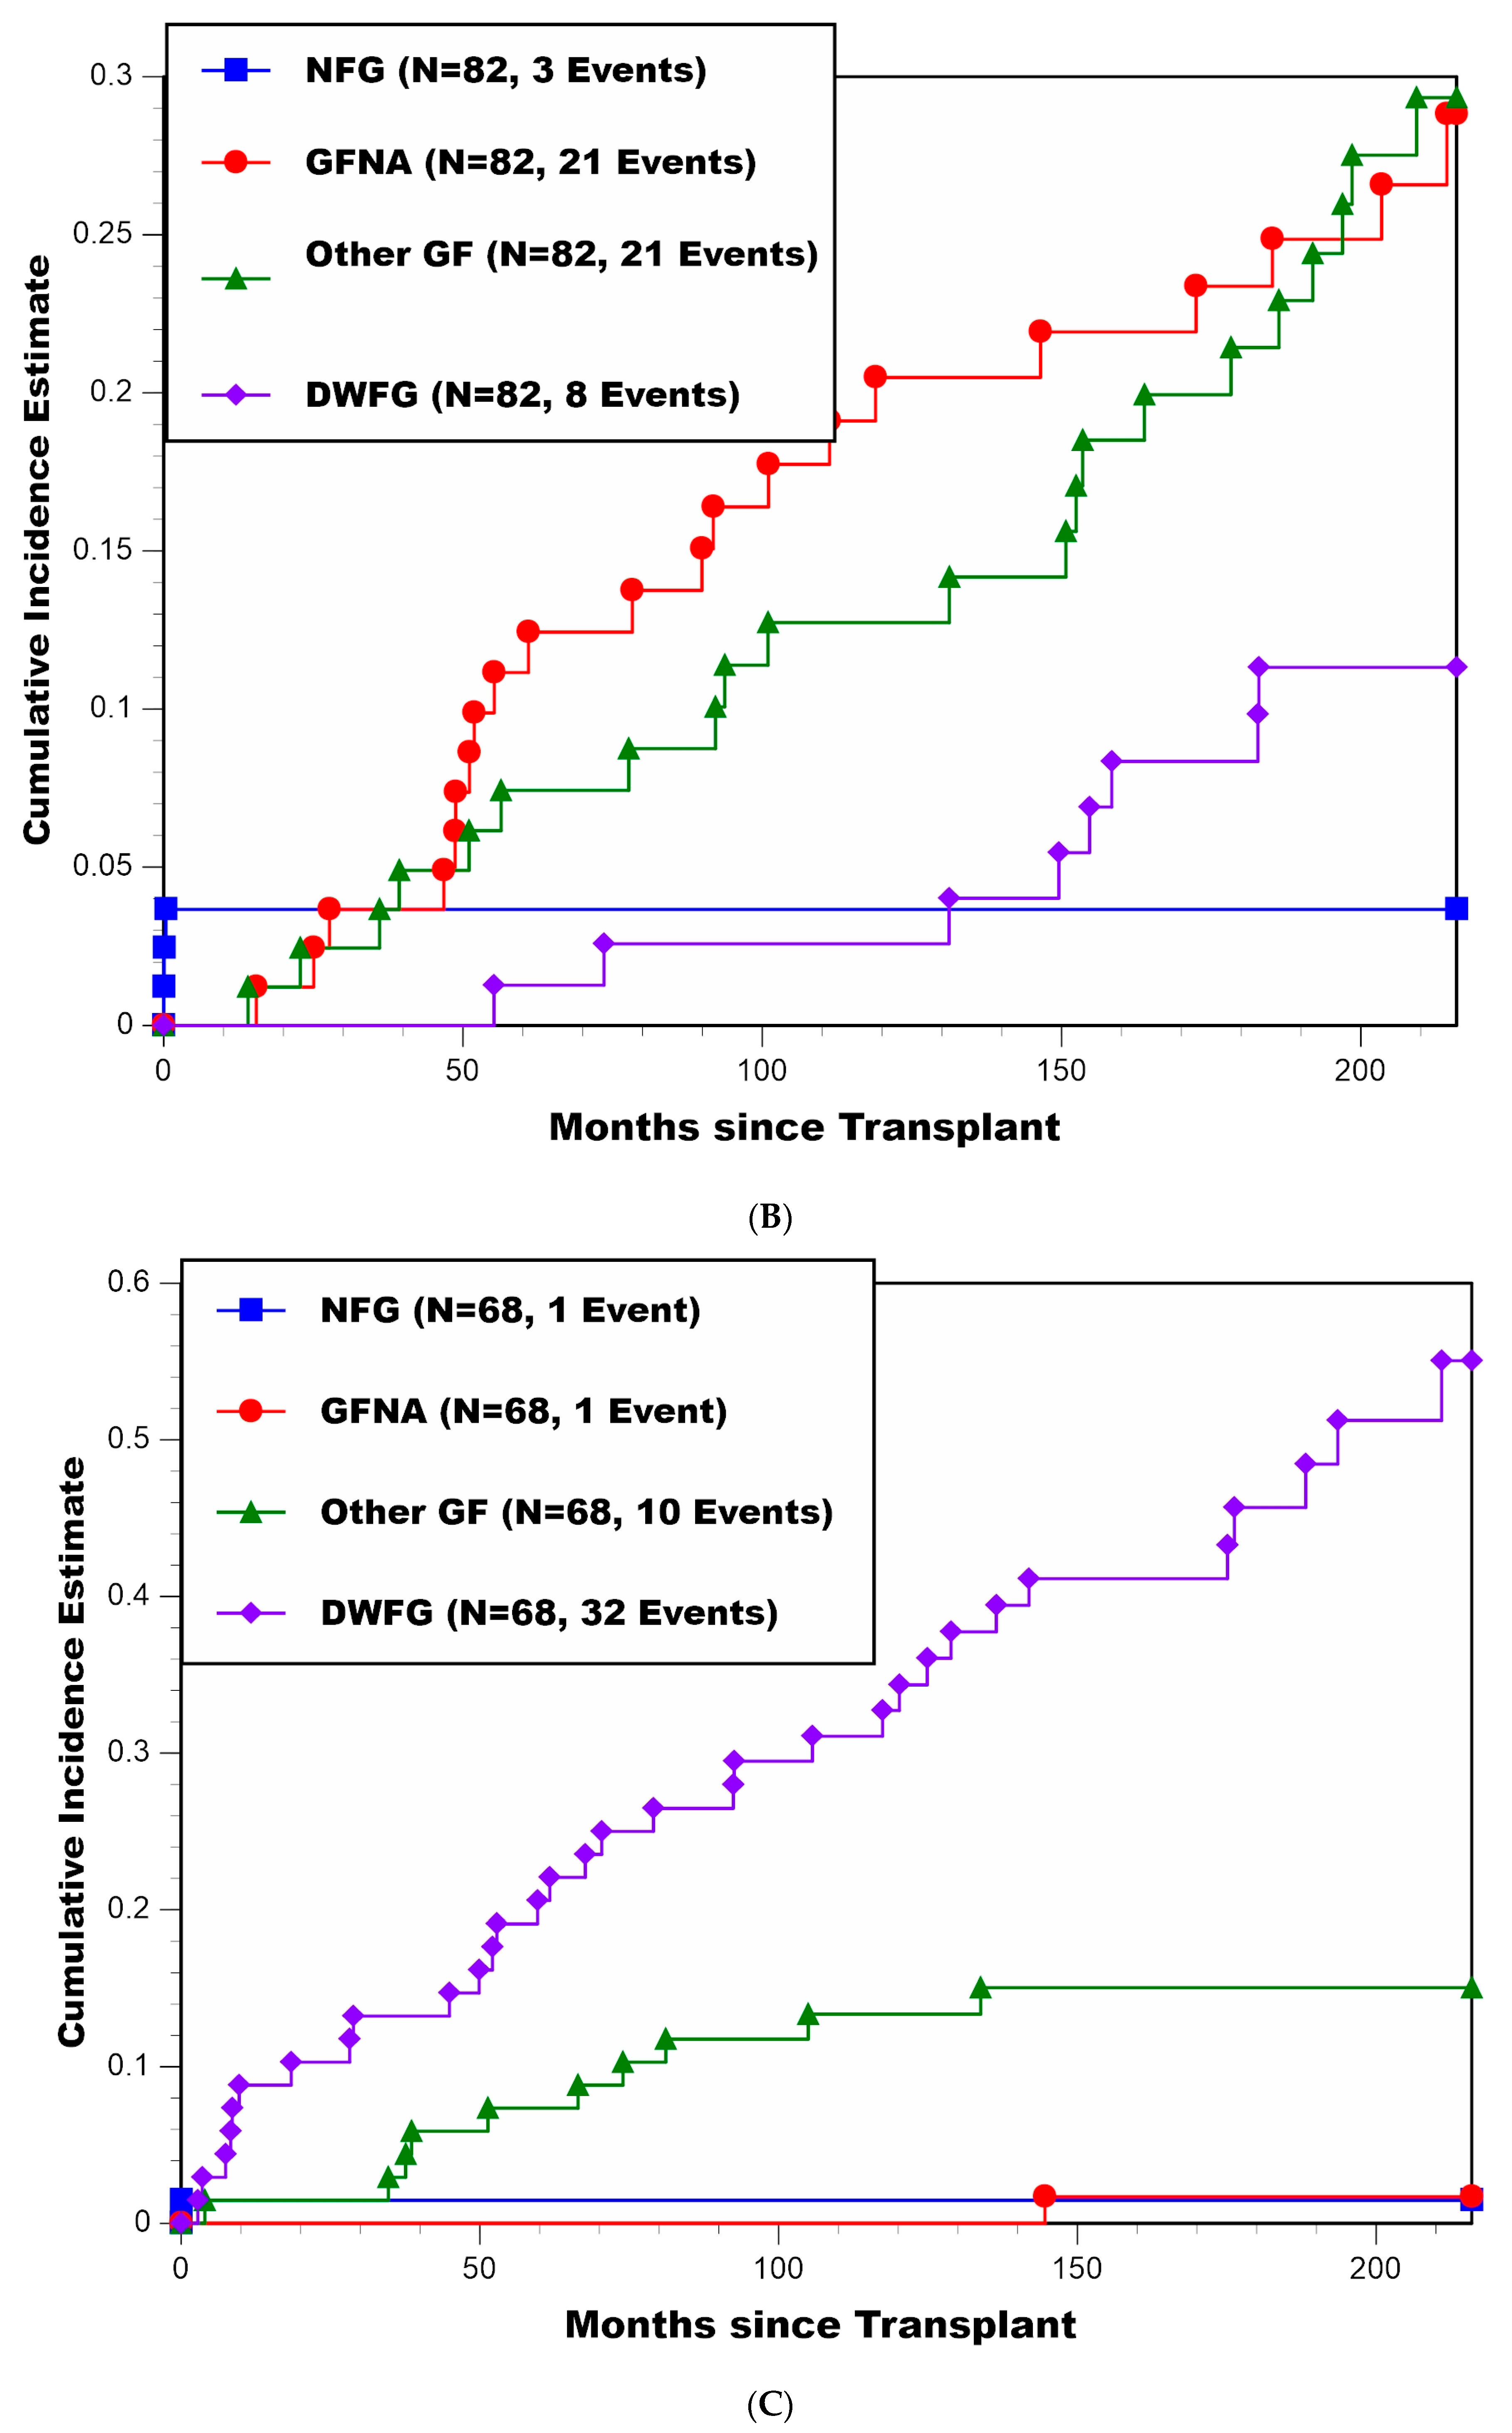
| (b) Patients <50 Years of Age at Transplant (N = 82) | ||||
| Months | CIF: NFG | CIF: GFNA | CIF: Other GF | CIF: DWFG |
| Post-Transplant | % ± SE | % ± SE | % ± SE | % ± SE |
| 60 | 3.7 ± 2.1 | 11.2 ± 3.5 | 7.4 ± 2.9 | 1.3 ± 1.3 |
| 120 | 3.7 ± 2.1 | 20.5 ± 4.6 | 12.7 ± 3.8 | 2.6 ± 1.8 |
| 180 | 3.7 ± 2.1 | 23.4 ± 4.8 | 21.4 ± 4.8 | 8.3 ± 3.3 |
| 216 | 3.7 ± 2.1 | 28.8 ± 5.4 | 29.3 ± 5.4 | 11.3 ± 3.8 |
| (c) Patients ≥50 Years of Age at Transplant (N = 68) | ||||
| Months | CIF: NFG | CIF: GFNA | CIF: Other GF | CIF: DWFG |
| Post-Transplant | % ± SE | % ± SE | % ± SE | % ± SE |
| 60 | 1.5 ± 1.5 | 0.0 ± 0.0 | 7.4 ± 3.2 | 20.6 ± 4.9 |
| 120 | 1.5 ± 1.5 | 0.0 ± 0.0 | 13.4 ± 4.1 | 32.7 ± 5.7 |
| 180 | 1.5 ± 1.5 | 1.7 ± 1.7 | 15.1 ± 4.4 | 45.7 ± 6.4 |
| 216 | 1.5 ± 1.5 | 1.7 ± 1.7 | 15.1 ± 4.4 | 55.1 ± 7.2 |
| (i) Hazard Rate of GF due to Nonadherence | |||
| Univariable | Multivariable | Multivariable Model 2 | |
| Baseline Variable 1 | p-value | p-value | Coeff ± SE |
| Recipient age | 0.00007 | (√) 0.0001 | −0.065 ± 0.018 |
| Afr-Am or Hisp recipient | 0.0004 | (√) 0.0007 | 2.647 ± 1.025 |
| (ii) Subdistribution Hazard of GF due to Nonadherence | |||
| Univariable | Multivariable | Multivariable Model 2 | |
| Baseline Variable 1 | p-value | p-value | Coeff ± SE |
| Recipient age | 0.000005 | (√) 0.00003 | −0.067 ± 0.017 |
| Afr-Am or Hisp recipient | 0.0003 | (√) 0.001 | 2.575 ± 1.024 |
| (a) Non-African-American and Non-Hispanic Recipients (N = 63) | |||
| Recipient Age | |||
| Months | <35 years (N = 17) | 35–49 years (N = 9) | ≥50 years (N = 37) |
| Post-Transplant | % ± SE | % ± SE | % ± SE |
| 60 | 6.7 ± 6.4 | 0.0 ± 0.0 | 0.0 ± 0.0 |
| 120 | 6.7 ± 6.4 | 0.0 ± 0.0 | 0.0 ± 0.0 |
| 180 | 6.7 ± 6.4 | 0.0 ± 0.0 | 0.0 ± 0.0 |
| 216 | 6.7 ± 6.4 | 0.0 ± 0.0 | 0.0 ± 0.0 |
| (b) African-American or Hispanic Recipients (N = 87) | |||
| Recipient Age | |||
| Months | <35 years (N = 26) | 35–49 years (N = 30) | ≥50 years (N = 31) |
| Post-Transplant | % ± SE | % ± SE | % ± SE |
| 60 | 19.5 ± 7.8 | 10.0 ± 5.5 | 0.0 ± 0.0 |
| 120 | 35.8 ± 9.6 | 20.4 ± 7.4 | 0.0 ± 0.0 |
| 180 | 35.8 ± 9.6 | 27.4 ± 8.3 | 3.4 ± 3.4 |
| 216 | 41.5 ± 10.2 | 36.9 ± 9.6 | 3.4 ± 3.4 |
| Univariable | Multivariable | Multivariable Model 2 | |
|---|---|---|---|
| Baseline Variable 1 | p-value | p-value | Coeff ± SE |
| Recipient age | 0.000003 | (√) 0.000004 | −0.072 ± 0.017 |
| Afr-Am or Hisp recipient | 0.00006 | (√) 0.00007 | 2.372 ± 0.738 |
| Approximate | Documented | Indicated/ | ||||||||
|---|---|---|---|---|---|---|---|---|---|---|
| Length | Patient | Low/ | Acknowledged | |||||||
| Month to First | Month from | of Time | Admits | Undetectable | Reason(s) for | |||||
| Age at | Race/ | Month to | BPAR/CR | Month to | NA to | with NA | to the NA | Trough | the NA | |
| Patient | Tx | Ethnicity | NA 1 | (Grade) 1 | GFNA | GFNA 1 | Behavior | Behavior | Levels | Behavior 9 |
| #1 | 34 | Black | 3.3 | 4.0 (IB) 2 | 15.5 | 12.2 | 12.2 | Y | U | F/P |
| #2 | 32 | Black | 9.5 | 10.1 (IIA) | 25.1 | 15.6 | 15.6 | Y 8 | L | P |
| #3 | 31 | White | 11.3 | 51.1 (CR) 4 | 51.1 | 39.8 | 39.8 | Y | L | F(Ins)/P |
| #4 | 29 | Black | 15.3 | 76.6 (IB) 3 | 78.3 | 63.0 | 2.0 + 26.0 | Y 7 | L | F(Ins)/P |
| #5 | 31 | Black | 15.5 | 17.2 (IIA) | 27.7 | 12.2 | 12.2 | Y 8 | L | F/P(CDep) |
| #6 | 36 | Hispanic | 27.9 | 146.1 (Bord) 2 | 146.5 | 118.6 | 118.6 | Y 8 | L & U | F/P(CDep) |
| #7 | 14 | Black | 30.5 | 32.1 (IIA) 3 | 48.8 | 18.3 | 18.3 | N | L | P |
| #8 | 45 | Hispanic | 34.3 | 40.4 (IA) | 46.8 | 12.5 | 12.5 | Y 7 | L | P |
| #9 | 33 | Hispanic | 35.4 | 41.3 (IB) | 91.8 | 56.4 | 56.4 | Y 8 | L & U | F(Ins)/P |
| #10 | 46 | Hispanic | 40.1 | 41.6 (IB) 3 | ----- 5 | ----- 5 | 14.9 | Y 8 | L | F(Ins)/P |
| #11 | 15 | Black | 42.7 | 103.0 (IB) 2 | ----- 5 | ----- 5 | 1.0 + 2.0 | Y8 | L & U | F(Ins)/P(CDep) |
| #12 | 44 | Hispanic | 43.1 | 51.2 (IB) | 51.9 | 8.8 | 8.8 | Y 8 | L | F(Ins)/P |
| #13 | 17 | Hispanic | 45.3 | 48.3 (IB) | 60.9 | 15.6 | 15.6 | Y 8 | L & U | P(CDep) |
| #14 | 22 | Hispanic | 46.0 | 53.3 (IA) 3 | 55.2 | 9.2 | 9.2 | Y 8 | L & U | F(Ins)/P |
| #15 | 40 | Hispanic | 46.3 | 48.7 (CR) 4 | 48.7 | 2.4 | 2.4 | Y 7 | N/A | F(Ins)/P |
| #16 | 33 | White | 52.6 | ----- | ----- 6 | ----- 6 | 16.0 | Y | L & U | F(Ins)/P |
| #17 | 40 | Hispanic | 68.8 | 79.4 (Bord) | 101.1 | 32.3 | 32.3 | Y 8 | L & U | F(Ins)/P(CDep) |
| #18 | 37 | Hispanic | 82.3 | 89.9 (CR) 4 | 89.9 | 7.6 | 7.6 | Y 8 | N/A | P |
| #19 | 19 | Hispanic | 84.4 | 111.2 (CR) 3 | 111.2 | 26.8 | 26.8 | Y | L | F(Ins)/P |
| #20 | 53 | Hispanic | 106.8 | 141.8 (Bord) 2 | 144.6 | 37.8 | 37.8 | Y | L | F(Ins)/P |
| #21 | 37 | Hispanic | 107.6 | 214.4 (CR) 4 | 214.4 | 106.8 | 106.8 | Y | L&U | F(Ins)/P(CDep) |
| #22 | 41 | Black | 108.8 | 109.5 (IA) 2 | 118.9 | 10.1 | 10.1 | Y 8 | L | P |
| #23 | 25 | Hispanic | 117.1 | 169.2 (IIA) 2 | ----- 5 | ----- 5 | 97.9 | Y 7 | L | F(Ins)/P(CDep) |
| #24 | 45 | Black | 120.0 | ----- | ----- 6 | ----- 6 | 84.0 | Y | L | P |
| #25 | 38 | Hispanic | 144.1 | 172.5 (CR) 4 | 172.5 | 28.4 | 28.4 | Y | L | F(Ins)/P |
| #26 | 39 | Black | 162.1 | 185.2 (CR) 4 | 185.2 | 23.1 | 23.1 | N/A | U | N/A |
| #27 | 27 | Hispanic | 171.5 | 193.2 (Bord) 2 | 203.5 | 32.0 | 32.0 | N/A | L | F(Ins)/P |
| #28 | 56 | Hispanic | 179.6 | ----- | ----- 6 | ----- 6 | 41.4 | Y | L & U | F(Ins)/P |
Publisher’s Note: MDPI stays neutral with regard to jurisdictional claims in published maps and institutional affiliations. |
© 2022 by the authors. Licensee MDPI, Basel, Switzerland. This article is an open access article distributed under the terms and conditions of the Creative Commons Attribution (CC BY) license (https://creativecommons.org/licenses/by/4.0/).
Share and Cite
Gaynor, J.J.; Guerra, G.; Roth, D.; Chen, L.; Kupin, W.; Mattiazzi, A.; Ortigosa-Goggins, M.; Tabbara, M.M.; Moni, L.; Burke, G.W., III; et al. Graft Failure Due to Nonadherence among 150 Prospectively-Followed Kidney Transplant Recipients at 18 Years Post-transplant: Our Results and Review of the Literature. J. Clin. Med. 2022, 11, 1334. https://doi.org/10.3390/jcm11051334
Gaynor JJ, Guerra G, Roth D, Chen L, Kupin W, Mattiazzi A, Ortigosa-Goggins M, Tabbara MM, Moni L, Burke GW III, et al. Graft Failure Due to Nonadherence among 150 Prospectively-Followed Kidney Transplant Recipients at 18 Years Post-transplant: Our Results and Review of the Literature. Journal of Clinical Medicine. 2022; 11(5):1334. https://doi.org/10.3390/jcm11051334
Chicago/Turabian StyleGaynor, Jeffrey J., Giselle Guerra, David Roth, Linda Chen, Warren Kupin, Adela Mattiazzi, Mariella Ortigosa-Goggins, Marina M. Tabbara, Lissett Moni, George W. Burke, III, and et al. 2022. "Graft Failure Due to Nonadherence among 150 Prospectively-Followed Kidney Transplant Recipients at 18 Years Post-transplant: Our Results and Review of the Literature" Journal of Clinical Medicine 11, no. 5: 1334. https://doi.org/10.3390/jcm11051334
APA StyleGaynor, J. J., Guerra, G., Roth, D., Chen, L., Kupin, W., Mattiazzi, A., Ortigosa-Goggins, M., Tabbara, M. M., Moni, L., Burke, G. W., III, & Ciancio, G. (2022). Graft Failure Due to Nonadherence among 150 Prospectively-Followed Kidney Transplant Recipients at 18 Years Post-transplant: Our Results and Review of the Literature. Journal of Clinical Medicine, 11(5), 1334. https://doi.org/10.3390/jcm11051334