Article

Value of CT-Textural Features and Volume-Based PET Parameters in Comparison to Serologic Markers for Response Prediction in Patients with Diffuse Large B-Cell Lymphoma Undergoing CD19-CAR-T Cell Therapy

by
Christian Philipp Reinert
1,*,
Regine Mariette Perl
1,
Christoph Faul
2,
Claudia Lengerke
2,
Konstantin Nikolaou
1,3,
Helmut Dittmann
4,
Wolfgang A. Bethge
2,† and
Marius Horger
1,†
1
Department of Radiology, Diagnostic and Interventional Radiology, University Hospital Tuebingen, Hoppe-Seyler-Str. 3, 72076 Tuebingen, Germany
2
Department of Hematology, Oncology, Clinical Immunology and Rheumatology, University Hospital Tuebingen, Hoppe-Seyler-Str. 3, 72076 Tuebingen, Germany
3
Cluster of Excellence iFIT (EXC 2180) Image Guided and Functionally Instructed Tumor Therapies, University of Tuebingen, 72074 Tuebingen, Germany
4
Department of Radiology, Nuclear Medicine, University Hospital Tuebingen, Hoppe-Seyler-Str. 3, 72076 Tuebingen, Germany
*
Author to whom correspondence should be addressed.
These authors contributed equally to this work.
J. Clin. Med. 2022, 11(6), 1522; https://doi.org/10.3390/jcm11061522
Submission received: 23 January 2022 / Revised: 7 March 2022 / Accepted: 8 March 2022 / Published: 10 March 2022
(This article belongs to the Special Issue PET/CT Imaging in Oncology: Clinical Updates and Perspectives)

Abstract

:
The goal of this study was to investigate the value of CT-textural features and volume-based PET parameters in comparison to serologic markers for response prediction in patients with diffuse large B-cell lymphoma (DLBCL) undergoing cluster of differentiation (CD19)-chimeric antigen receptor (CAR)-T cell therapy. We retrospectively analyzed the whole-body (WB)-metabolic tumor volume (MTV), the WB-total lesion glycolysis (TLG) and first order textural features derived from 18F-FDG-PET/CT, as well as serologic parameters (C-reactive protein [CRP] and lactate dehydrogenase [LDH], leucocytes) prior and after CAR-T cell therapy in 21 patients with DLBCL (57.7 ± 14.7 year; 7 female). Interleukin 6 (IL-6) and IL-2 receptor peaks were monitored after treatment onset and compared with patient outcome judged by follow-up 18F-FDG-PET/CT. In 12/21 patients (57%), complete remission (CR) was observed, whereas 9/21 patients (43%) showed partial remission (PR). At baseline, WB-MTV and WB-TLG were lower in patients achieving CR (35 ± 38 mL and 319 ± 362) compared to patients achieving PR (88 ± 110 mL and 1487 ± 2254; p < 0.05). The “entropy” proved lower (1.81 ± 0.09) and “uniformity” higher (0.33 ± 0.02) in patients with CR compared to PR (2.08 ± 0.22 and 0.28 ± 0.47; p < 0.05). Patients achieving CR had lower levels of CRP, LDH and leucocytes at baseline compared to patients achieving PR (p < 0.05). In the entire cohort, WB-MTV and WB-TLG decreased after therapy onset (p < 0.01) becoming not measurable in the CR-group. Leucocytes and CRP significantly dropped after therapy (p < 0.01). The IL-6 and IL-2R peaks after therapy were lower in patients with CR compared to PR (p > 0.05). In conclusion, volume-based PET parameters derived from PET/CT and CT-textural features have the potential to predict therapy response in patients with DLBCL undergoing CAR-T cell therapy.

1. Introduction

Diffuse large B-cell lymphoma (DLBCL) is the most common subtype of non-Hodgkin’s lymphoma in adults with a prevalence of almost 40% [1]. Standard treatment regimens are efficacious, but up to 15% of patients will exhibit primary refractory disease and another 30–35% will experience relapse after initial response [2,3]. In the refractory/relapsed DLBCL patients, incidence of disease recurrence is high, even after salvage therapy combined with autologous stem cell support, leading to a dismal long-term survival rate [4]. In this setting, novel treatment strategies are explored. A promising, emerging therapy option are CD19 CAR (chimeric antigen receptor)-T cells, which consist of genetically modified autologous T cells by retroviral or lentiviral vectors containing DNA encoding a CAR [1]. It has been shown that CD19 CAR-T cells provide high and durable response rates even in refractory and relapsed DLBCL [5,6,7].
Imaging is playing a major role for diagnosis and treatment monitoring in patients with DLBCL, and the most frequently recommended technique is the positron emission tomography (PET) using 18F- Fluorodeoxyglucose (FDG) as a tracer targeting glucose metabolism mostly in combination with computed tomography (CT) [8]. Hence, morphologic and glucometabolic changes in tumor herald either lymphoma response or relapse. The latter has been further refined by calculating the entire metabolic tumor volume (MTV) and the total lesion glycolysis (TLG). Both PET and CT image data can be additionally analyzed by using texture analysis with potential for tumor characterization either in the primary setting (baseline) for prognosis evaluation, or during therapy as an adjunct to morphologic and metabolic changes for more accurate response assessment [9,10]. Finally, some laboratory biomarkers like lactate dehydrogenase (LDH) in serum have been used for a long time as prognostic factors in lymphoma patients.
CD19-CAR T cell therapy as immunotherapy leads to a strong immunological response with T cell activation and cytokine release as illustrated by the most commonly observed adverse effect: cytokine release syndrome (CRS) and immune effector cell-associated neurotoxicity syndrome (ICANS). Manifestation of CRS goes along with hypersecretion of IL6, IL2-R, ferritin and CRP from activated macrophages following CAR-T cell activation [11].
Hence, the intention of this study was to investigate the value of CT-textural features and volume-based PET parameters in comparison to serologic markers for response prediction in patients with DLBCL undergoing CD19-CAR-T cell therapy.

2. Material and Methods

This retrospective image and laboratory data analysis was approved by the local ethics committee and the patients waived written consent (project number 277/2020BO2).

2.1. Patient Characteristics

Twenty-one consecutive patients with DLBCL (mean age 57.7 ± 14.7 year; seven female) undergoing CAR-T cell therapy from 06/2018 to 02/2021 were retrospectively evaluated. All patients had pathologically confirmed DLBCL. According to Ann-Arbor classification, 2/21 patients had a stage I, 3/21 patients had stage II, 5/21 patients had stage III and 11/21 patients were classified stage IV. According to the International Prognostic Index (IPI) scoring system, 3/21 patients were rated score 1, 9/21 patients were rated score 3 and 9/21 patients were rated score 4. Patient characteristics are summarized in Table 1.
At baseline staging, before CAR-T cell therapy, 17/21 patients underwent 18F-FDG-PET/CT and 4/21 patients underwent CT using standardized protocols. All patients were additionally monitored by serologic parameters. At first follow-up after CAR-T cell therapy, 18/21 patients underwent 18F-FDG-PET/CT and 3/21 patients underwent CT.
Therapy response was classified according to the Lugano classification system including CT-based response criteria and the Deauville five-point scale (Deauville 5PS) scoring system [12]. Each FDG-avid (or previously FDG-avid) lesion was rated independently by two readers. Response to CAR-T cell therapy was defined as PR in case of metabolically active disease (Deauville score 4), which is defined as lymphoma manifestations with 18F-FDG-uptake slightly to moderately higher than the liver background 18F-FDG-uptake without metric progression on CT. In case of no measurable 18F-FDG-uptake and 18F-FDG-uptake below or equal to uptake in the liver (Deauville score 1–3), CR was assigned.

2.2. Imaging Protocols

All PET/CT examinations were performed on a state-of-the art clinical scanner (Biograph mCT®, Siemens Healthineers, Erlangen, Germany). All patients fasted overnight before examination. Approximately 300 MBq 18F-FDG were injected intravenously 60 min prior to image acquisition. Standardized CT examination protocols included weight-adapted 90–120 mL intravenous CT contrast agent (Ultravist 370®, Bayer Vital, Leverkusen, Germany). Portal-venous phase acquisitions were obtained with 70 s delay time using a tube voltage of 120 kV and a reference dose of 200 mAs. Image reconstruction was performed using iterative CT reconstruction (Siemens SAFIRE®, Forchheim, Germany). PET was acquired from the skull to the mid-thigh level over six to eight bed positions and reconstructed using a 3D ordered subset expectation maximization algorithm (two iterations, 21 subsets, Gaussian filter 2.0 mm, matrix size 400  ×  400, and slice thickness 2.0 mm). PET acquisition time was 2–3 min per bed position.
CT was performed with patients in the supine position using a 128-slice MDCT scanner (SOMATOM Definition Flash, Siemens Healthcare, Erlangen, Germany). Contrast-enhanced portal-venous phases were obtained using 120-kV photon energy, 200-mAs tube current, a soft tissue image reconstruction kernel, and 1-mm slice thickness for image reconstruction. A weight-adapted iodine contrast agent (Ultravist [Iopromide] 370, Bayer Vital, Leverkusen, Germany) was given intravenously at a rate of 2 mL/s followed by a 30-mL saline chaser. Image acquisition began 70 s after the start of contrast agent injection. Image reconstruction was performed in all patients using filtered back projection.

2.3. Quantitative Image Analysis

The segmentation of lymphoma manifestations was performed by one reader using approved software for quantification of PET parameters on Syngo.via VB 30A (Siemens Healthineers, Erlangen, Germany). Evaluation included all lesions which were characterized by increased 18F-FDG uptake above liver background activity (Deauville score 4). Segmentation of each lesion was performed manually using 50%-isocontour volumes of interests (VOIs) for quantification. Whole-body MTV and whole-body TLG were calculated as the sum of all quantified lymphoma manifestations per patient.
CT-texture analysis (CTTA) was performed in contrast-enhanced CT images derived from whole-body CT or whole-body 18F-FDG-PET/CT obtained in the portal-venous enhancement phase using a standardized protocol and dedicated radiomics software (Siemens Healthcare, Erlangen, Germany) that is based on the pyradiomics package, a python package for the extraction of radiomics features from medical imaging [13]. A slice thickness of 1 mm was used. Regions of interests (ROIs) were drawn manually in lymphatic tissue carefully excluding neighboring tissues like blood vessels. This standardized procedure of ROI setting was performed by a radiologist with five years of experience in CTTA. Standardized measurements were performed to provide comparability for all data sets. All set ROIs were used to generate specific VOIs. The first step consisted of image filtration for selectively extracting features of different sizes and intensity variation. In the 2nd step, quantification of tissue texture followed. The computation of each texture type for an input VOI involved assigning a new value (“texture value”) to all voxel of that VOI and thus creating a “texture image”. This involved the creation of a three-dimensional VOI within the largest lymph node, the features of which were used to calculate texture values on a fine spatial scale. Computation was performed on the current voxel and its neighborhood, and the results of that were stored as the current voxel’s texture value. To ensure reliable statistics for this patient cohort, we limited analysis of textural parameters to the following 1st order features which describe the distribution of voxel intensities within the mask through commonly used and basic metrics: mean, uniformity, entropy, skewness. The definitions of these textural parameters are provided in Table 2.

2.4. Laboratory Parameters

Laboratory parameters were extracted from the clinical data base on the same day as imaging. The upper limits of the reference ranges were: 250 U/L for serum LDH, 0.5 μg/dL for CRP, 130 U/L for AP, 4100–11,800 1/μL for leucocyte count, 158–613 U/mL for soluble IL-2R and 0–4 ng/L for IL-6.

2.5. Statistical Analysis

Statistical analysis was performed using SPSS Version 22 (IBM Corporation, Armonk, NY, USA). We tested all parameters for the normality with a Kolmogorov-Smirnov test. A Mann-Whitney-U test was used to test the differences in tumor volumetric parameters, 1st order textural features and laboratory parameters between the patient groups achieving CR or PR. To address the multiple comparisons, a Benjamin Hochberg correction was applied. The adjusted p-values were considered significant at a level of 0.05.

3. Results

In 12/21 DLBCL patients (57%), CR was observed after CAR-T cell therapy, whereas 9/21 patients (43%) showed PR. No patient had a progression at first follow-up after CAR-T cell therapy.

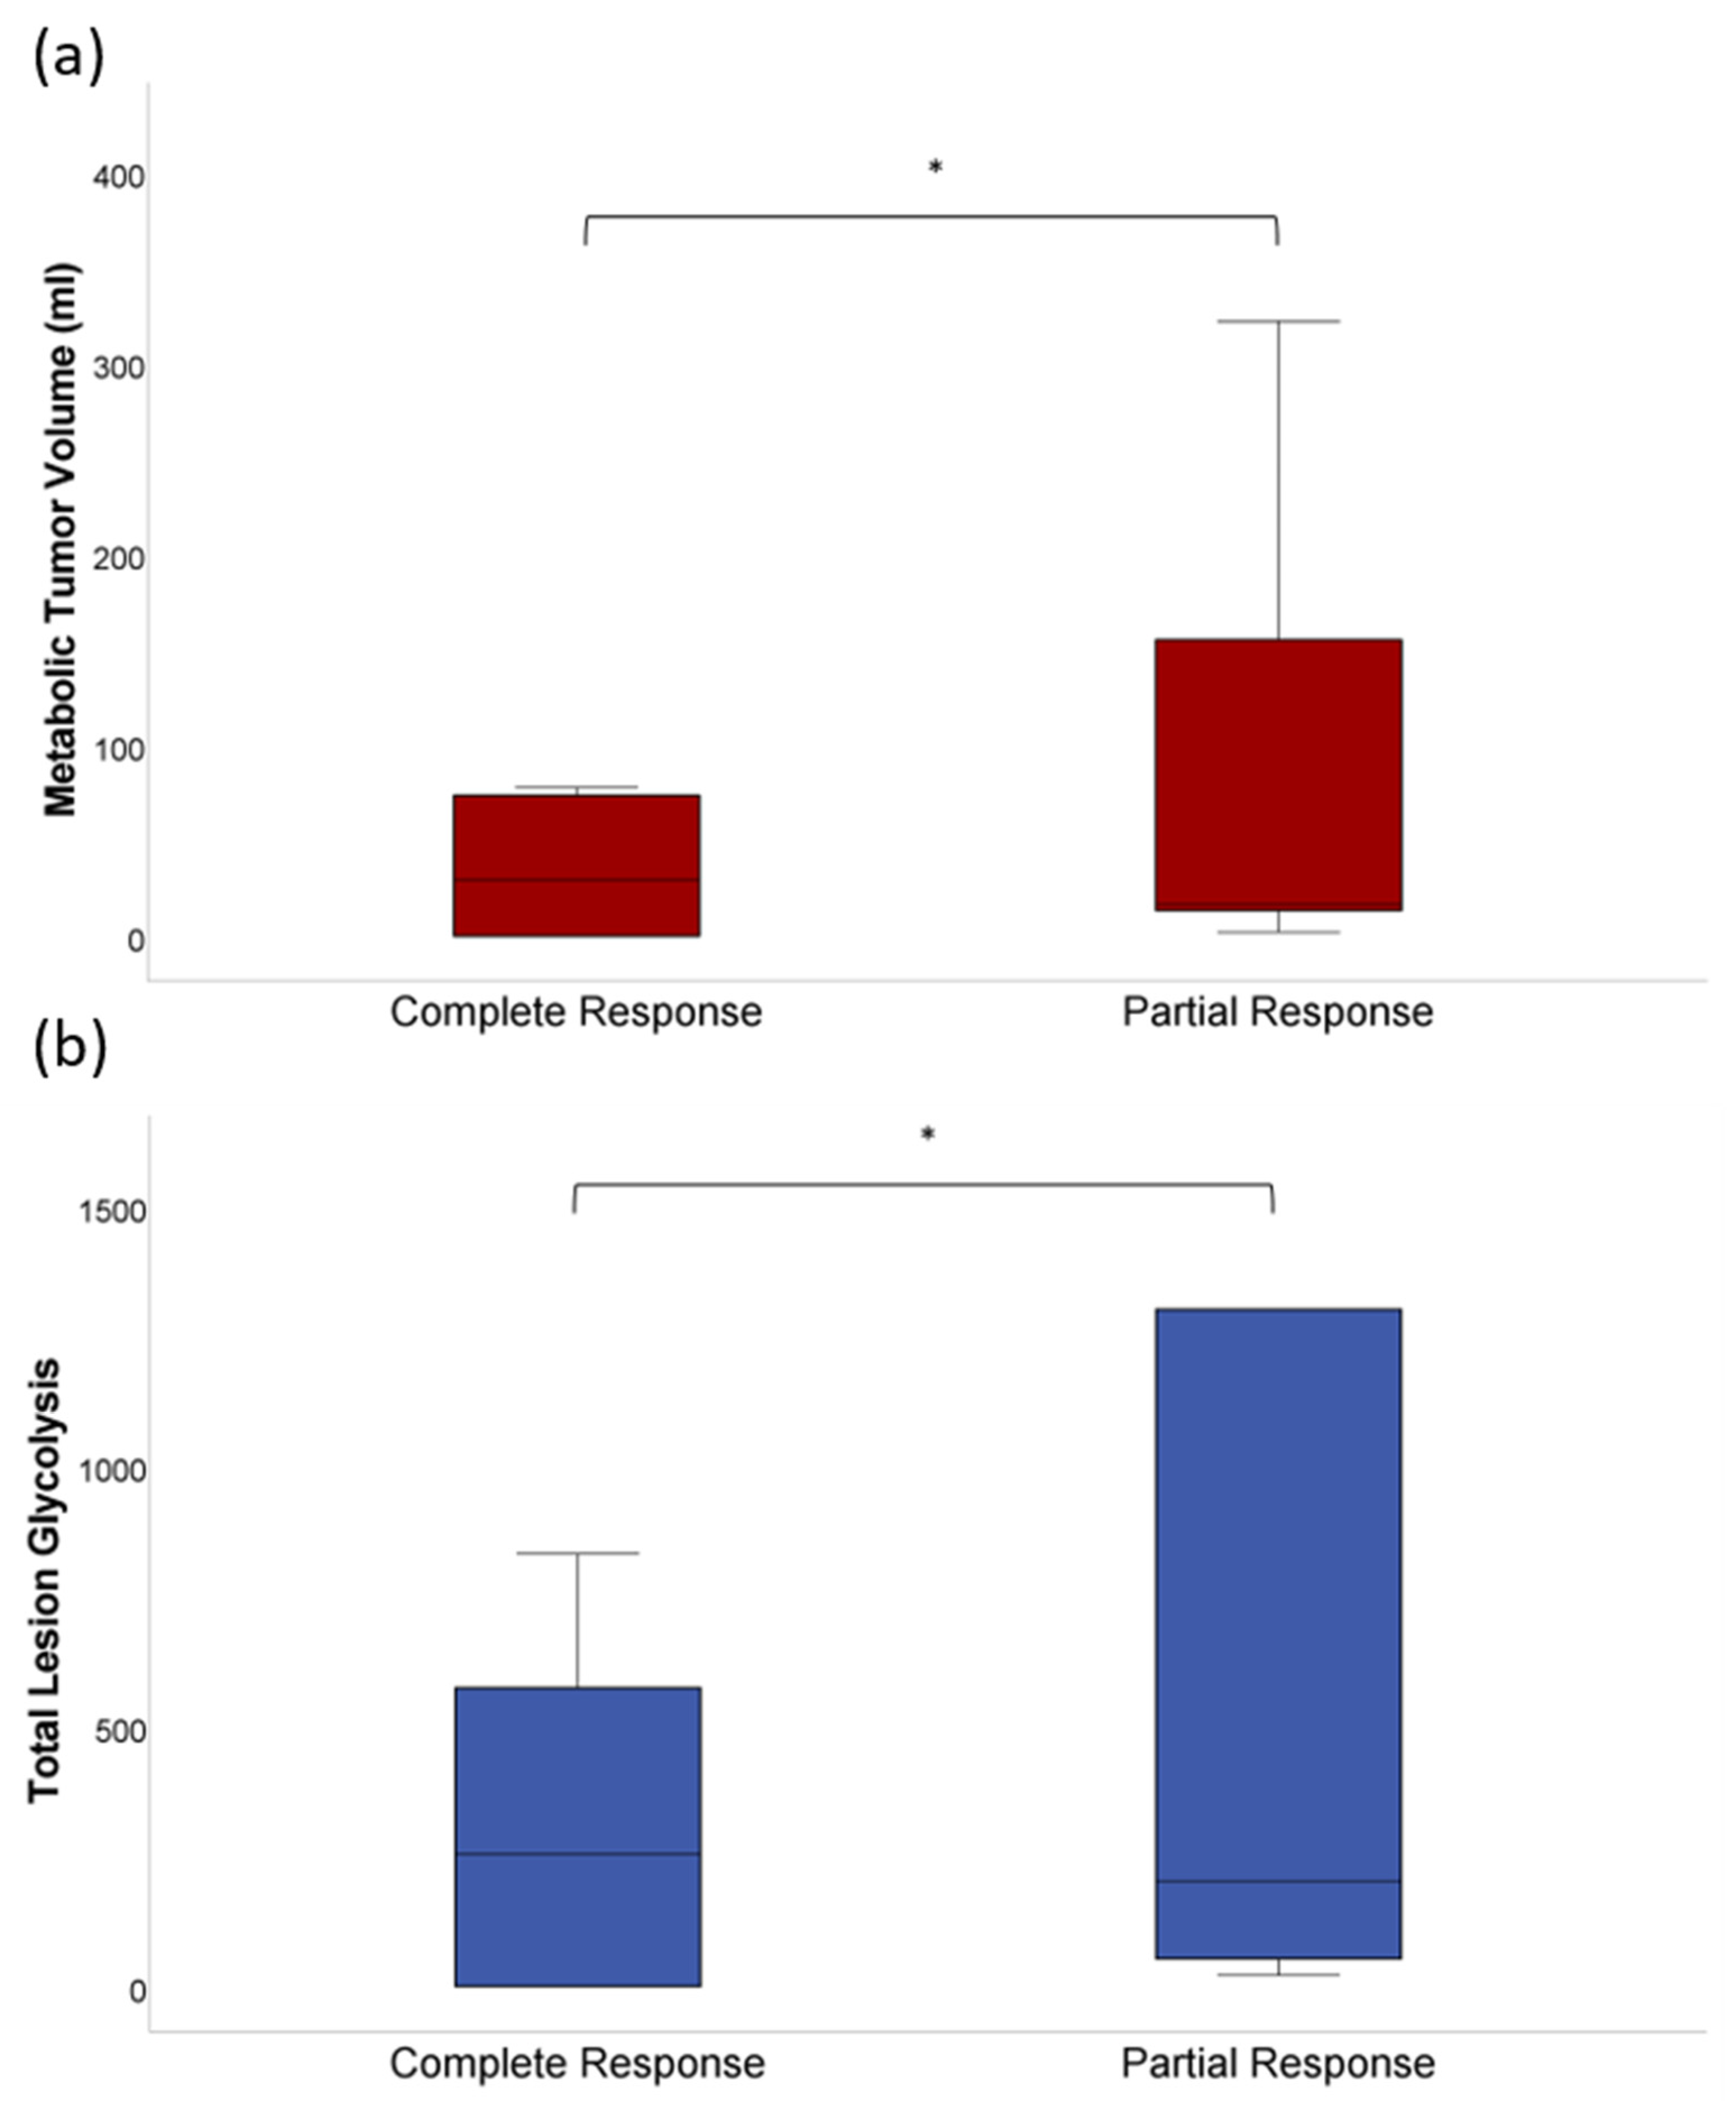
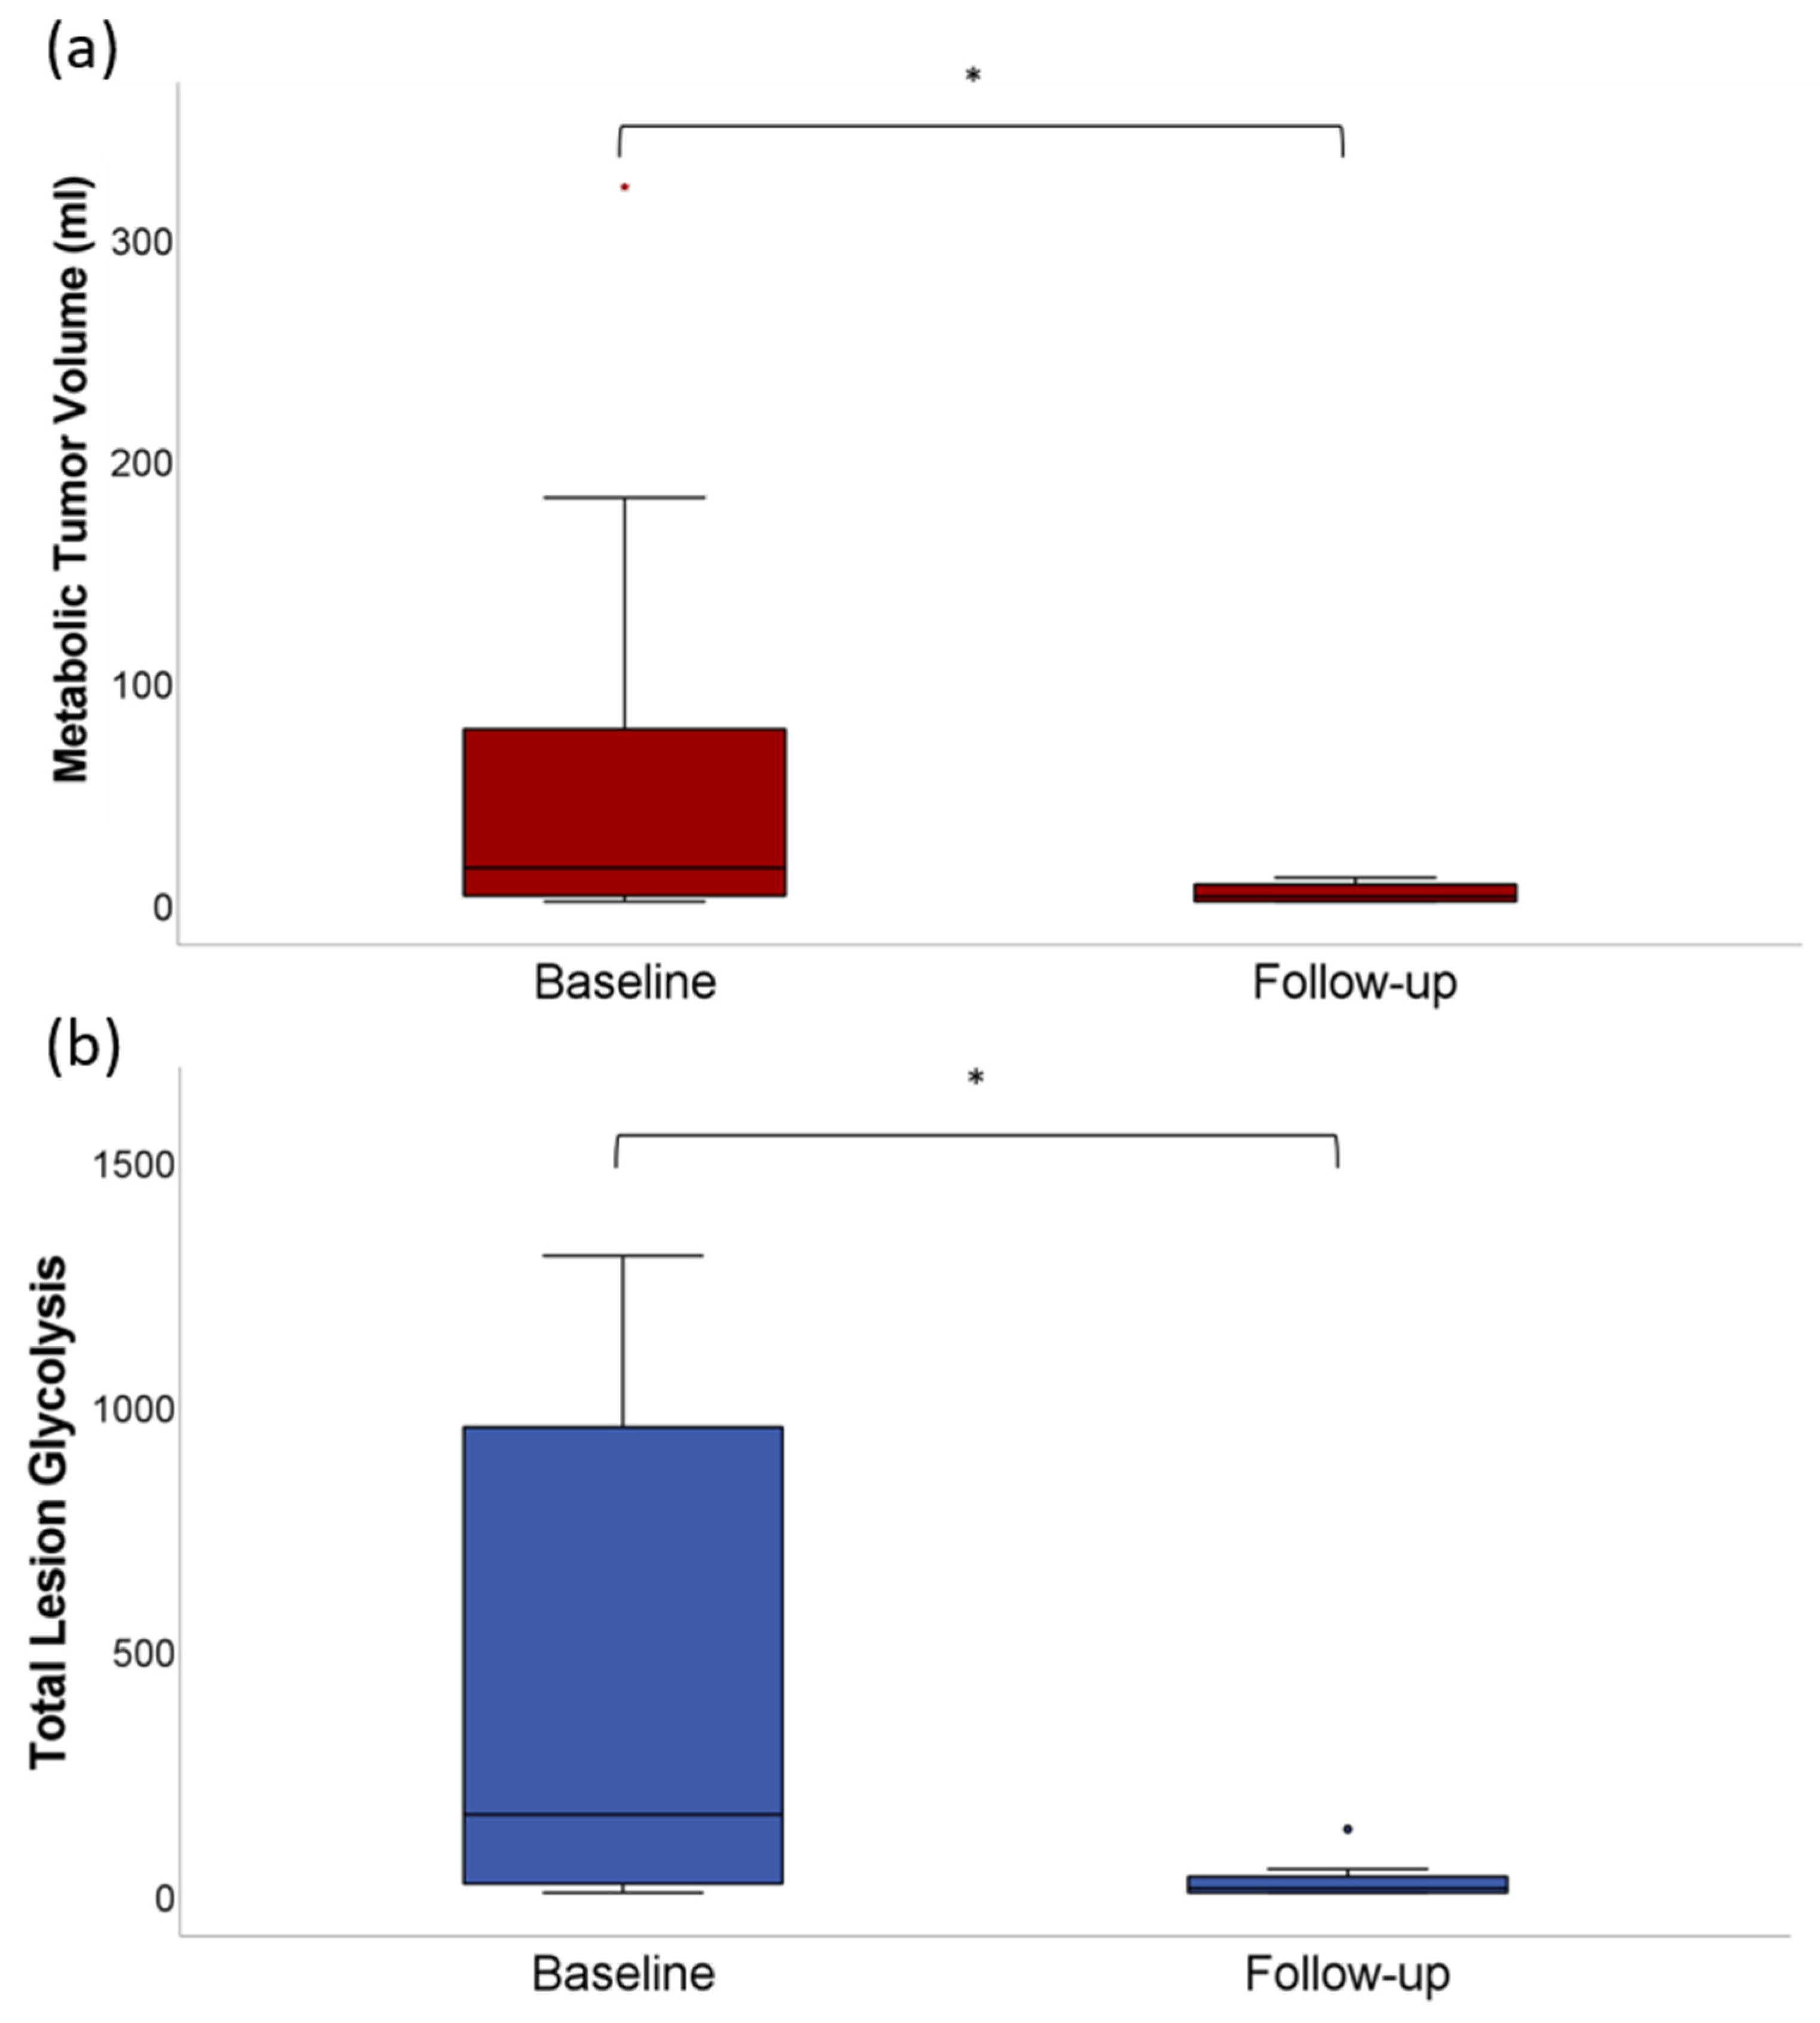
3.1. Quantitative Analysis of Tumor Volumetric Parameters

The whole-body MTV and whole-body TLG differed significantly (p < 0.01 and p < 0.05, respectively) between the subgroups assigned to CR or PR showing lower levels in the CR group at baseline (MTV: 35 ± 38 mL vs. 88 ± 110 mL; TLG: 319 ± 362 vs. 1488 ± 2254) (Figure 1).
In the entire patient cohort, a significant (p < 0.01) decrease was observed for whole-body MTV (62 ± 86 mL vs. 4 ± 5 mL) and whole-body-TLG (925 ± 1722 vs. 33 ± 59) (Figure 2). After CAR-T cell therapy, MTV and TLG were not measurable in the subgroup achieving CR, whereas in the subgroup with PR, MTV (88 ± 110 mL vs. 7 ± 4 mL) and TLG (1488 ± 2254 vs. 41 ± 39) significantly decreased (p < 0.01).

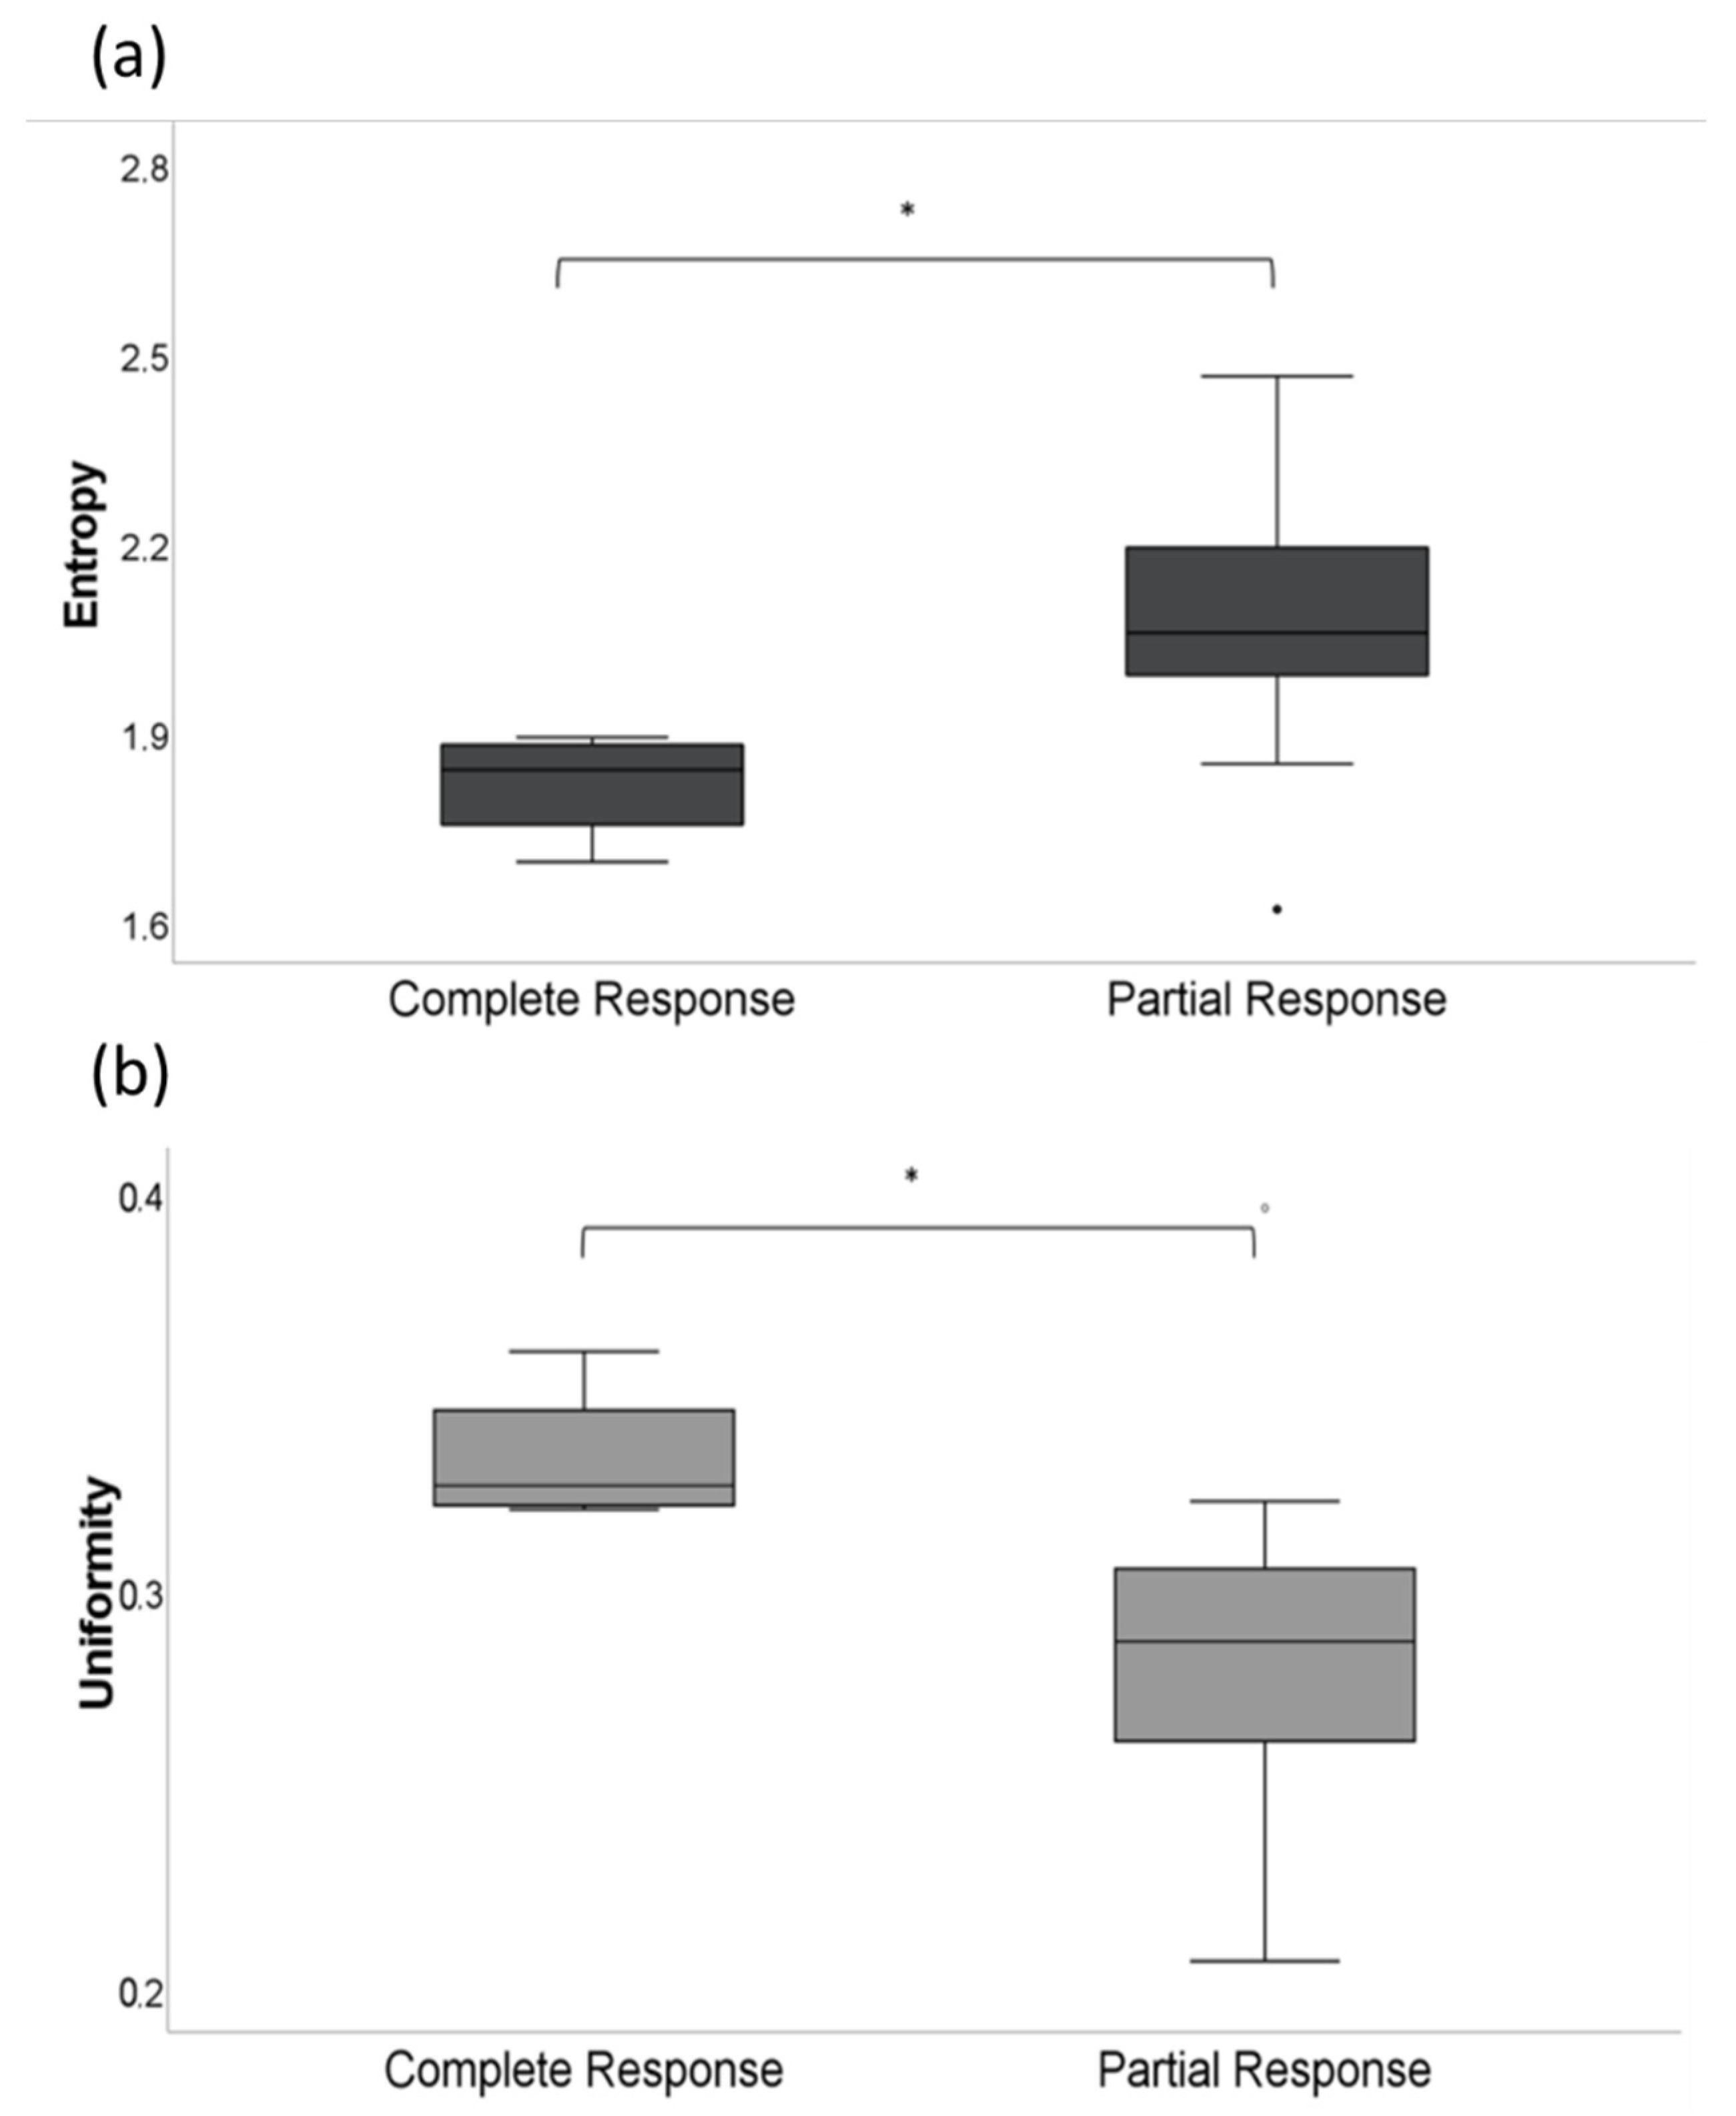
3.2. CT-Texture Analysis

At baseline, the “entropy” proved lower (1.81 ± 0.1) in patients achieving CR compared to patients achieving PR (2.08 ± 0.2; p < 0.05) (Figure 3a). In contrast, the “uniformity” was higher in patients with CR (0.33 ± 0.02) compared to patients with PR (0.28 ± 0.47; p < 0.05) (Figure 3b). No significant differences were found for “skewness” (0.11 ± 0.21 [CR] vs. −0.32 ± 1.23 [PR]; p > 0.05) and “mean” (66.1 ± 18.89 [CR] vs. 49.3 ± 23.9 [PR]; p > 0.05) with a trend in “mean” for higher values in patients with CR.

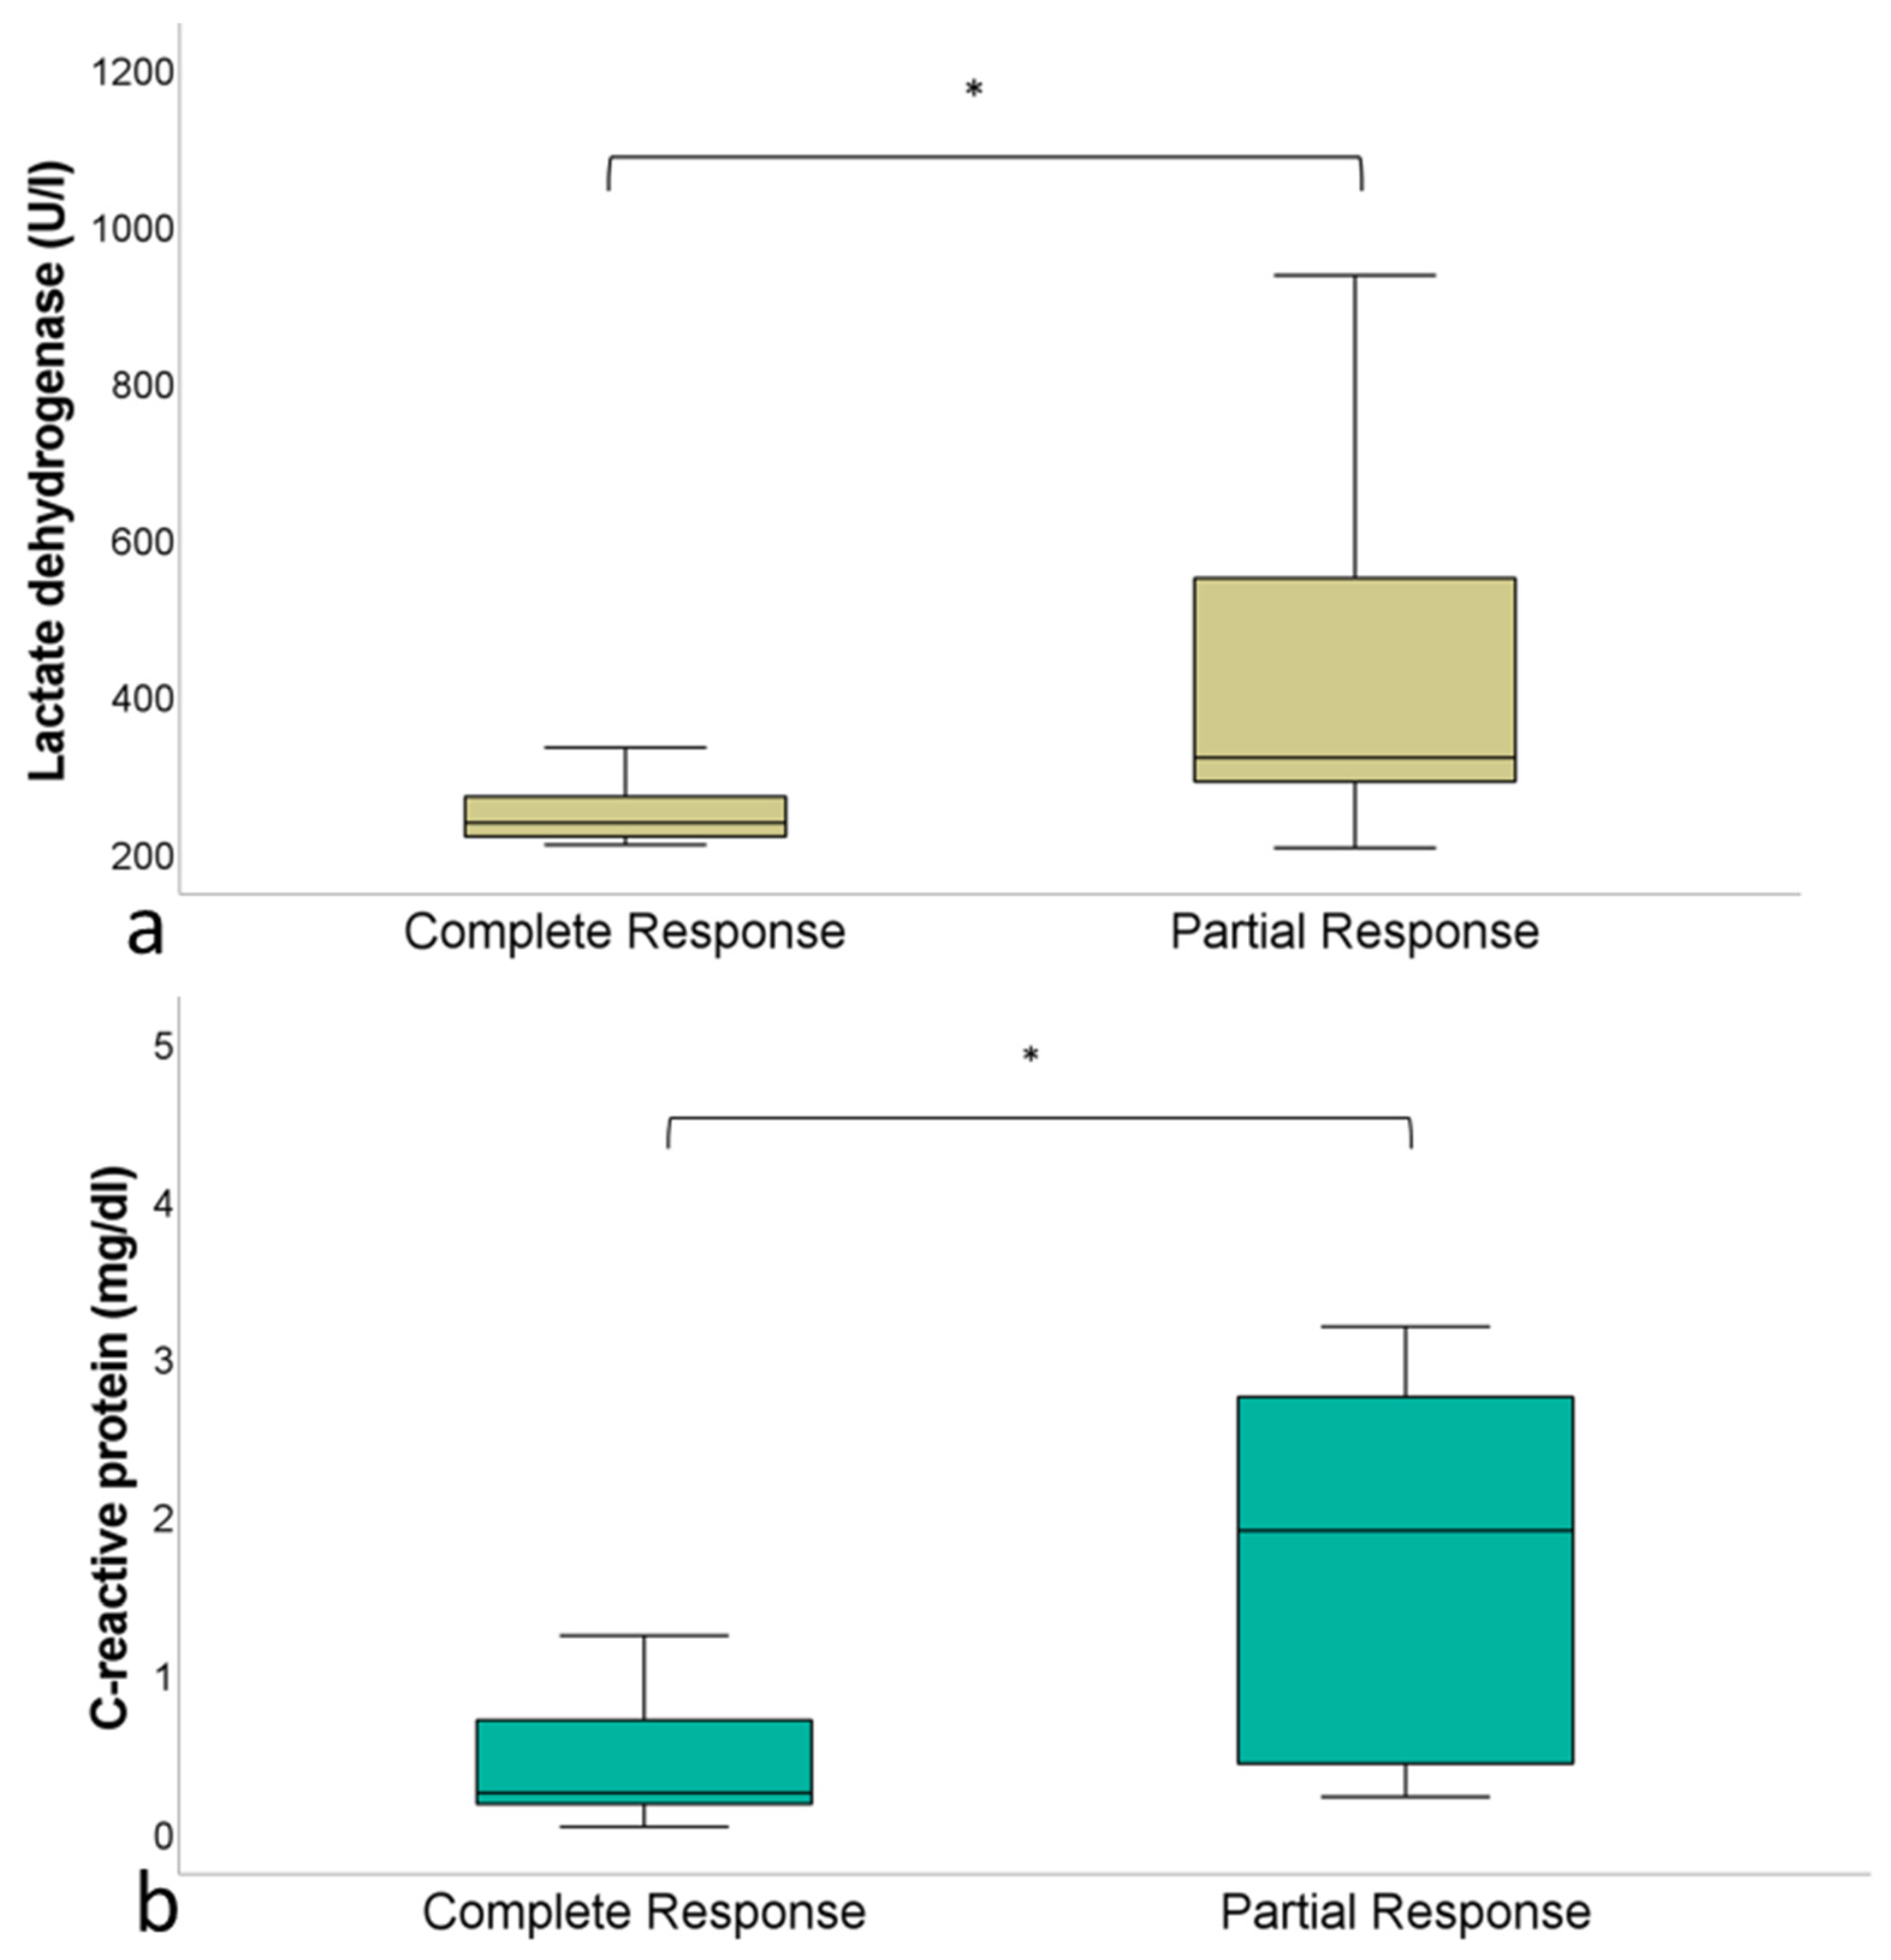
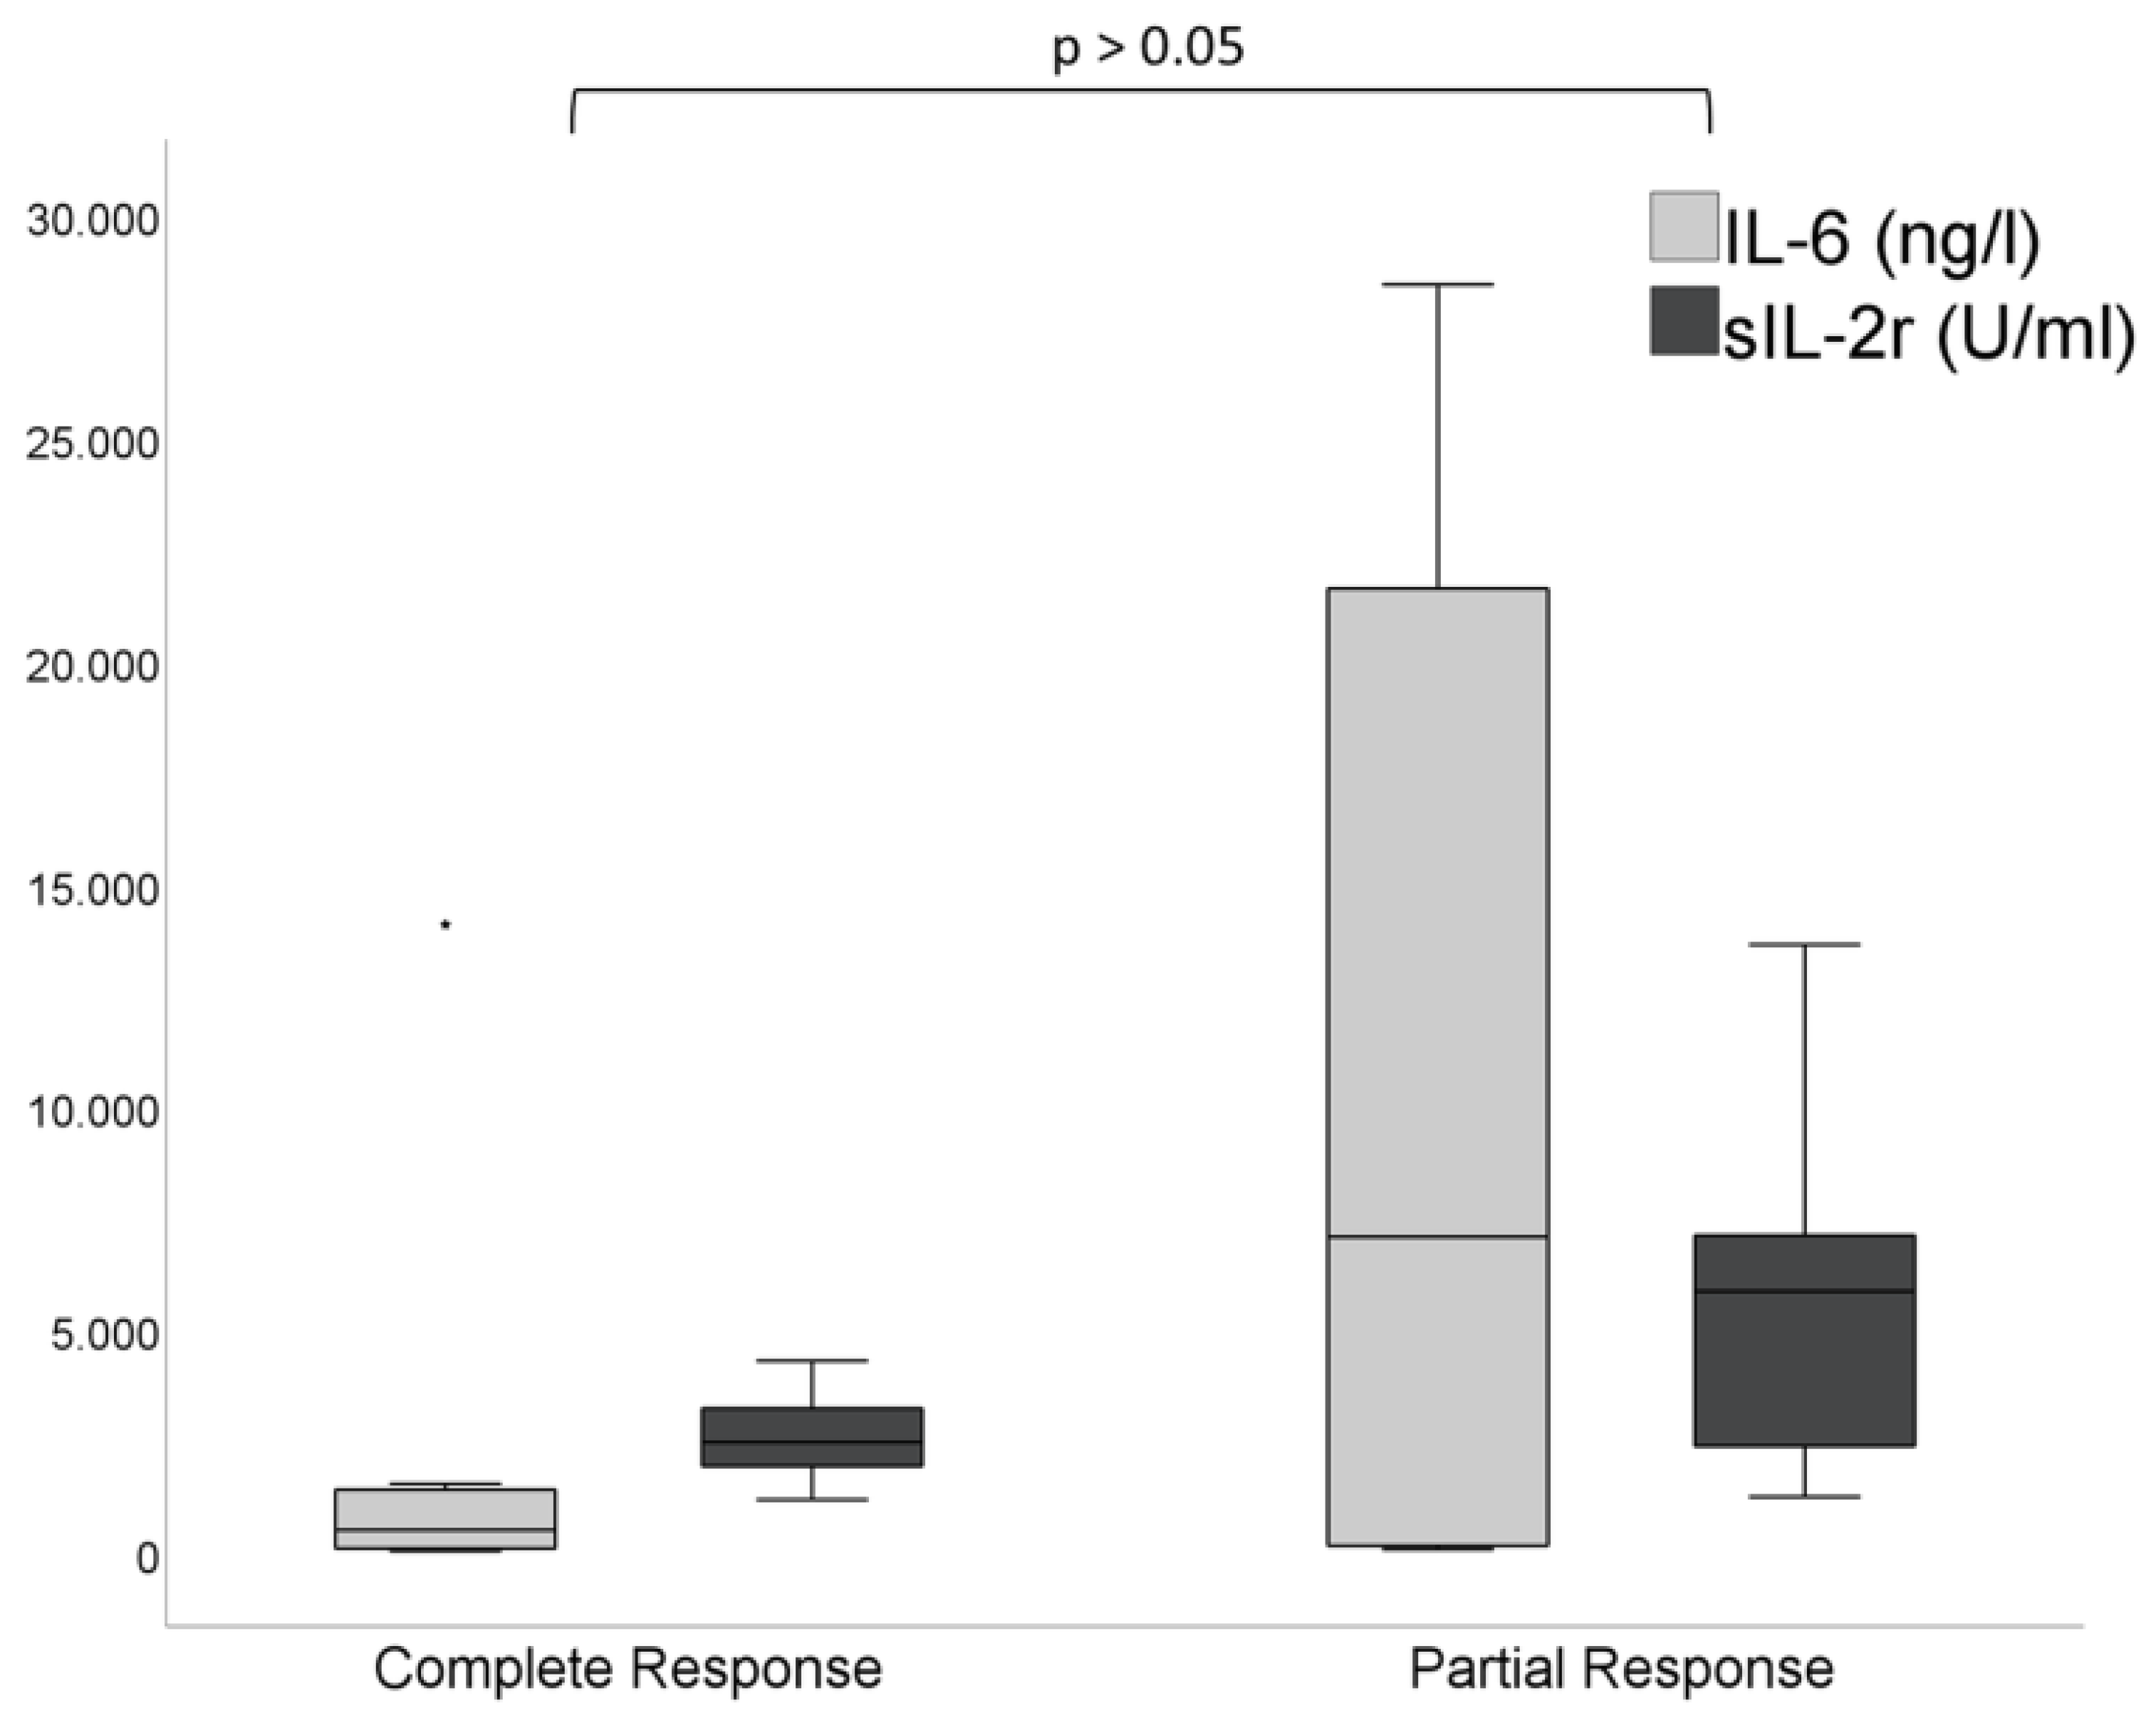
3.3. Laboratory Parameters

In the group of patients achieving CR after CAR-T cell therapy, the mean serum LDH proved significantly lower compared to the PR group at baseline (240 ± 28 U/L [CR] vs. 443 ± 262 U/L [PR]; p < 0.05) (Figure 4a). The CRP levels in serum at baseline also proved significantly lower in the CR group compared to the PR group (2.6 ± 4.6 μg/dL [CR] vs. 4.2 ± 6.6 μg/dL [PR]; p < 0.05) (Figure 4b). At baseline, no differences were found for the leucocyte count between patients achieving CR (5127 ± 766 1/μL) and PR (5290 ± 3142 1/μL; p > 0.05).
In the whole patient cohort, we observed a significant decrease of CRP (2.8 ± 5.6 μg/dL vs. 0.1 ± 0.2 μg/dL; p < 0.01) and leucocyte count (5348 ± 2514 1/μL vs. 2954 ± 2024 1/μL; p < 0.01) and trend towards lower serum LDH (366 ± 235 U/L vs. 242 ± 69 U/L; p > 0.05) after CAR-T cell therapy.
The mean time interval between re-infusion of CAR-T cells and IL-6 peak was 6.5 ± 4.3 days and between re-infusion of CAR-T cells and Il-2R peak the time was 7.4 ± 4.1 days. The IL-6 peak (867 ± 951 ng/L vs. 9121 ± 11,266 ng/L) and IL-2R peak (2483 ± 1164 U/mL vs. 5548 ± 3949 U/mL) were lower in patients with CR compared to PR, without statistical significance (p > 0.05) (Figure 5).
After CAR-T cell therapy, 20/21 patients developed a cytokine release syndrome (CRS). Of these, 10/21 patients had a CRS grade I, 7/21 patients had a CRS grade II, 2/21 patients had a CRS grade III and 1/21 patient had a CRS grade IV. In the group of patients with CR after CAR-T cell therapy, two patients had a manifest CRS (grade > 1), whereas eight patients with PR developed a manifest CRS.

4. Discussion

In this study, we investigated the predictive value of textural features derived from CT and volume-based parameters derived from 18F-FDG-PET/CT in comparison to serologic markers in patients with DLBCL undergoing CD19-CAR-T cell therapy.
Patients achieving PR had a considerably higher MTV and TLG in the baseline setting compared to patients achieving morphological and metabolic CR. This is not surprising, as the MTV was already found to have predictive value in lymphoma [14,15,16]. Xie et al. reported a negative progression-free survival (PFS) in patients with DLBCL presenting high MTV and SUVmax values in the pre-treatment setting, irrespective of the applied treatment regimen [14]. Similarly, Zhou et al. described MTV as the only independent predictor of progression-free survival and overall survival in their patient cohort with DLBCL undergoing R-CHOP therapy [15]. In a subsequent analysis, the same authors found baseline TLG to be a significant predictor of PFS [16]. Quantification of the volumetric parameters MTV and TLG and calculation of cut-off values for response prediction were also performed by Xie and Sasanelli [16,17]. Furthermore, response prediction based on MTV was performed in patients with follicular lymphoma undergoing immuno-chemotherapy [18].
Expectedly, quantitative 18F-FDG-PET proved also to be a good therapy monitoring tool with significant reduction in glucose metabolism in patients achieving PR and no residual uptake in patients achieving metabolic CR.
Other quantitative predicting and response monitoring metric features are those derived from texture analysis of either PET-metabolic or CT-morphologic image data, which are then post-processed by using radiomics parameters [13]. At this point, our results obtained from CT-radiomics analysis indicate that with increasing tumor tissue homogeneity and correspondingly decreasing heterogeneity in the baseline setting, the chances of achieving CR significantly increase. Similar results were reported in DLBCL patients undergoing immunochemotherapy [10]. Aide et al. demonstrated that 18F-FDG-PET heterogeneity of the largest lymphoma lesion was an independent predictor of two years-event-free survival [10]. In this study, the only independent predictor when analyzed together with IPI and MTV was the long-zone high-grade level emphasis.
Texture analysis was further demonstrated to have potential in improving the value of pretreatment PET/CT for prediction of the interim response of primary gastrointestinal-DLBCL [9]. In this report, the SUVmax, MTV, as well as the entropy were significantly higher in the non-CR group. In the report by Aide et al., texture analysis of the skeleton in patients with DLBCL proved beneficial for diagnosis of infiltration with skewness being the only independent predictor of PFS [19].
The assumption that images contain information of disease-specific processes is the basis for the use of radiomics, which aims at enhancing the existing data by means of advanced mathematical analysis. Various studies from different fields in imaging highlight the potential of radiomics to support clinical decision-making [20,21]. However, various technical factors may influence the extracted radiomic features, which is a limitation of this approach that needs to be considered [22].
Although radiomics applications have yet to arrive in routine clinical practice, image interpretation using radiomics has potential in terms of a more personalized medicine in the future.
Another discipline in which radiomics is now increasingly being applied is pathology [23]. The idea to genetically classify tumors without biopsy using non-invasive extraction of image information promises support in diagnostics, individualized prognosis and therapy planning.
LDH is a non-specific marker for lymphoma whose prognostic significance is well established for both indolent and aggressive lymphomas at the time of diagnosis, which indirectly reflects the tumor burden. As expected, we found lower serum levels of LDH at baseline in DLBCL patients, which reached CR after CAR-T cell therapy. LDH significantly decreased after therapy accompanied also by decreasing serum levels of CRP and leucocyte count.
Of interest, the IL-6 and IL-2R serum peaks measured in the first week after CAR-T cell therapy onset proved lower in patients classified CR compared to patients classified PR. Almost half of our patient cohort developed a manifest CRS (grade 2 or higher) after CAR-T cell therapy, which was mainly observed in patients with PR after treatment.
Our results are in line with already existing data with respect to response prediction in DLBCL showing similar results of studies exploring the role of PET/CT and CT in immunotherapy.
Our study has some limitations. First, not all patients received the same CD19-CAR-T cells compound. Second, due to the retrospective study design, a selection bias or other confounding factors cannot be excluded. Third, the histologic subtype of DLBCL was not considered because of the small size of the entire cohort hampering an otherwise statistical analysis. Our observations have to be confirmed by larger prospective studies using multivariate analyses which include tumor volumetric and serologic markers.
In conclusion, volume-based PET parameters derived from PET/CT and CT-textural features have the potential to predict therapy response in patients with DLBCL undergoing CAR-T cell therapy.

Author Contributions

Conceptualization, C.P.R. and M.H.; Data curation, C.P.R.; Formal analysis, C.P.R.; Investigation, M.H.; Methodology, C.P.R., C.F., H.D. and W.A.B.; Project administration, M.H.; Resources, C.L., K.N. and W.A.B.; Supervision, C.L., K.N., W.A.B. and M.H.; Validation, R.M.P. and H.D.; Writing—original draft, C.P.R. and M.H.; Writing—review & editing, R.M.P., C.F., C.L., K.N., H.D. and W.A.B. All authors have read and agreed to the published version of the manuscript.

Funding

This research received no external funding.

Institutional Review Board Statement

Our study protocol was approved for retrospective evaluation of patient data by our institutional ethics committee with a waiver of the informed consent requirement (Project number 277/2020BO2).

Informed Consent Statement

Not applicable.

Data Availability Statement

The data presented in this study are available on request from the corresponding author. The data are not publicly available due to privacy and ethical restrictions.

Conflicts of Interest

Marius Horger received institutional research funds and speaker’s honorarium from Siemens Healthineers and is a scientific advisor of Siemens Healthcare Germany. The other authors have declared that no competing interests exist.

Abbreviations

CARchimeric antigen receptor
CD19cluster of differentiation 19
CRcomplete remission
CRScytokine release syndrome
CTTACT texture analysis
Deauville 5PSDeauville five-point scale
DLBCLdiffuse large B-cell lymphoma
FDG18F- Fluorodeoxyglucose
ICANSimmune effector cell-associated neurotoxicity
ILinterleukin
IPIinternational prognostic index
LDHlactate dehydrogenase
MBqmegabecquerel
MTVmetabolic tumor volume
PFSprogression-free survival
PRpartial remission
R-CHOPRituximab in combination with cyclophosphamide, doxorubicin, vincristine, and prednisone
ROIregion of interest
SUVuptake value
TLGtotal lesion glycolysis
VOIvolume of interest

References

  1. Hosen, N. CAR T cell therapy. Immunol. Med. 2020, 44, 69–73. [Google Scholar] [CrossRef] [PubMed]
  2. Rovira, J.; Valera, A.; Colomo, L.; Setoain, X.; Rodríguez, S.; Martínez-Trillos, A.; Giné, E.; Dlouhy, I.; Magnano, L.; Gaya, A.; et al. Prognosis of patients with diffuse large B cell lymphoma not reaching complete response or relapsing after frontline chemotherapy or immunochemotherapy. Ann. Hematol. 2014, 94, 803–812. [Google Scholar] [CrossRef] [PubMed] [Green Version]
  3. Bishton, M.; Hughes, S.M.; Richardson, F.; James, E.; Bessell, E.; Sovani, V.; Ganatra, R.; Haynes, A.P.; McMillan, A.K.; Fox, C.P. Delineating outcomes of patients with diffuse large b cell lymphoma using the national comprehensive cancer network-international prognostic index and positron emission tomography-defined remission status; a population-based analysis. Br. J. Haematol. 2015, 172, 246–254. [Google Scholar] [CrossRef] [PubMed] [Green Version]
  4. Gisselbrecht, C.; Glass, B.; Mounier, N.; Gill, D.S.; Linch, D.C.; Trneny, M.; Bosly, A.; Ketterer, N.; Shpilberg, O.; Hagberg, H.; et al. Salvage Regimens With Autologous Transplantation for Relapsed Large B-Cell Lymphoma in the Rituximab Era. J. Clin. Oncol. 2010, 28, 4184–4190. [Google Scholar] [CrossRef] [PubMed] [Green Version]
  5. Neelapu, S.S.; Locke, F.L.; Bartlett, N.L.; Lekakis, L.J.; Miklos, D.B.; Jacobson, C.A.; Braunschweig, I.; Oluwole, O.O.; Siddiqi, T.; Lin, Y.; et al. Axicabtagene Ciloleucel CAR T-Cell Therapy in Refractory Large B-Cell Lymphoma. N. Engl. J. Med. 2017, 377, 2531–2544. [Google Scholar] [CrossRef] [PubMed]
  6. Locke, F.L.; Ghobadi, A.; Jacobson, C.A.; Miklos, D.B.; Lekakis, L.J.; Oluwole, O.O.; Lin, Y.; Braunschweig, I.; Hill, B.T.; Timmerman, J.M.; et al. Long-term safety and activity of axicabtagene ciloleucel in refractory large B-cell lymphoma (ZUMA-1): A single-arm, multicentre, phase 1–2 trial. Lancet Oncol. 2019, 20, 31–42. [Google Scholar] [CrossRef]
  7. Schuster, S.J.; Bishop, M.R.; Tam, C.S.; Waller, E.K.; Borchmann, P.; McGuirk, J.P.; Jäger, U.; Jaglowski, S.; Andreadis, C.; Westin, J.R.; et al. Tisagenlecleucel in Adult Relapsed or Refractory Diffuse Large B-Cell Lymphoma. N. Engl. J. Med. 2019, 380, 45–56. [Google Scholar] [CrossRef]
  8. Baratto, L.; Wu, F.; Minamimoto, R.; Hatami, N.; Liang, T.; Sabile, J.; Advani, R.H.; Mittra, E. Correlation of 18-fluorodeoxyglucose PET/computed tomography parameters and clinical features to predict outcome for diffuse large B-cell lymphoma. Nucl. Med. Commun. 2021, 42, 792–799. [Google Scholar] [CrossRef] [PubMed]
  9. Sun, Y.; Qiao, X.; Jiang, C.; Liu, S.; Zhou, Z. Texture Analysis Improves the Value of Pretreatment 18F-FDG PET/CT in Predicting Interim Response of Primary Gastrointestinal Diffuse Large B-Cell Lymphoma. Contrast Media Mol. Imaging 2020, 2020, 2981585. [Google Scholar] [CrossRef] [PubMed]
  10. Aide, N.; Fruchart, C.; Nganoa, C.; Gac, A.-C.; Lasnon, C. Baseline 18F-FDG PET radiomic features as predictors of 2-year event-free survival in diffuse large B cell lymphomas treated with immunochemotherapy. Eur. Radiol. 2020, 30, 4623–4632. [Google Scholar] [CrossRef]
  11. Shagera, Q.A.; Cheon, G.J.; Koh, Y.; Yoo, M.Y.; Kang, K.W.; Lee, D.S.; Kim, E.E.; Yoon, S.-S.; Chung, J.-K. Prognostic value of metabolic tumour volume on baseline 18F-FDG PET/CT in addition to NCCN-IPI in patients with diffuse large B-cell lymphoma: Further stratification of the group with a high-risk NCCN-IPI. Eur. J. Pediatr. 2019, 46, 1417–1427. [Google Scholar] [CrossRef] [PubMed]
  12. Cheson, B.D.; Fisher, R.I.; Barrington, S.F.; Cavalli, F.; Schwartz, L.H.; Zucca, E.; Lister, T.A. Recommendations for initial evaluation, stag-ing, and response assessment of Hodgkin and non-Hodgkin lymphoma: The Lugano classification. J. Clin. Oncol. 2014, 32, 3059–3068. [Google Scholar] [CrossRef] [PubMed]
  13. Van Griethuysen, J.; Fedorov, A.; Parmar, C.; Hosny, A.; Aucoin, N.; Narayan, V.; Beets-Tan, R.; Fillion-Robin, J.C.; Pieper, S.; Aerts, H. Computational Radiomics System to Decode the Radiographic Phenotype. Cancer Res. 2017, 77, e104–e107. [Google Scholar] [CrossRef] [PubMed] [Green Version]
  14. Xie, M.; Zhai, W.; Cheng, S.; Zhang, H.; Xie, Y.; He, W. Predictive value of F-18 FDG PET/CT quantization parameters for progression-free survival in patients with diffuse large B-cell lymphoma. Hematology 2015, 21, 99–105. [Google Scholar] [CrossRef] [PubMed] [Green Version]
  15. Zhou, M.; Chen, Y.; Huang, H.; Zhou, X.; Liu, J.; Huang, G. Prognostic value of total lesion glycolysis of baseline 18F-fluorodeoxyglucose positron emission tomography/computed tomography in diffuse large B-cell lymphoma. Oncotarget 2016, 7, 83544–83553. [Google Scholar] [CrossRef] [PubMed] [Green Version]
  16. Xie, M.; Wu, K.; Liu, Y.; Jiang, Q.; Xie, Y. Predictive value of F-18 FDG PET/CT quantization parameters in diffuse large B cell lymphoma: A meta-analysis with 702 participants. Med. Oncol. 2014, 32, 1–10. [Google Scholar] [CrossRef] [PubMed]
  17. Sasanelli, M.; Meignan, M.; Haioun, C.; Berriolo-Riedinger, A.; Casasnovas, R.-O.; Biggi, A.; Gallamini, A.; Siegel, B.A.; Cashen, A.F.; Véra, P.; et al. Pretherapy metabolic tumour volume is an independent predictor of outcome in patients with diffuse large B-cell lymphoma. Eur. J. Pediatr. 2014, 41, 2017–2022. [Google Scholar] [CrossRef] [PubMed]
  18. Meignan, M.; Cottereau, A.-S.; Versari, A.; Chartier, L.; Dupuis, J.; Boussetta, S.; Grassi, I.; Casasnovas, R.-O.; Haioun, C.; Tilly, H.; et al. Baseline Metabolic Tumor Volume Predicts Outcome in High–Tumor-Burden Follicular Lymphoma: A Pooled Analysis of Three Multicenter Studies. J. Clin. Oncol. 2016, 34, 3618–3626. [Google Scholar] [CrossRef] [PubMed]
  19. Aide, N.; Talbot, M.; Fruchart, C.; Damaj, G.; Lasnon, C. Diagnostic and prognostic value of baseline FDG PET/CT skeletal textural features in diffuse large B cell lymphoma. Eur. J. Pediatr. 2017, 45, 699–711. [Google Scholar] [CrossRef] [Green Version]
  20. Mannil, M.; von Spiczak, J.; Manka, R.; Alkadhi, H. Texture Analysis and Machine Learning for Detecting Myocardial Infarction in Noncontrast Low-Dose Computed Tomography: Unveiling the Invisible. Investig. Radiol. 2018, 53, 338–343. [Google Scholar] [CrossRef] [PubMed]
  21. Neisius, U.; El-Rewaidy, H.; Nakamori, S.; Rodriguez, J.; Manning, W.J.; Nezafat, R. Radiomic Analysis of Myocardial Native T1 Imaging Discriminates Between Hypertensive Heart Disease and Hypertrophic Cardiomyopathy. JACC Cardiovasc. Imaging 2019, 12, 1946–1954. [Google Scholar] [CrossRef] [PubMed]
  22. Chalkidou, A.; O’Doherty, M.J.; Marsden, P.K. False Discovery Rates in PET and CT Studies with Texture Features: A Systematic Review. PLoS ONE 2015, 10, e0124165. [Google Scholar] [CrossRef] [PubMed] [Green Version]
  23. Lu, C.; Shiradkar, R.; Liu, Z. Integrating pathomics with radiomics and genomics for cancer prognosis: A brief review. Chin. J. Cancer Res. (Chung-Kuo Yen Cheng Yen Chiu) 2021, 33, 563–573. [Google Scholar] [CrossRef] [PubMed]
Figure 1. (a) At baseline 18F-FDG PET/CT before CAR-T cell therapy, both the whole-body MTV (35 ± 38 mL vs. 88 ± 110 mL) and (b) the whole-body TLG (319 ± 362 vs. 1488 ± 2254) were lower in patients achieving CR compared to patients achieving PR (p < 0.01 and p < 0.05). The asterisk (*) indicates clinical significance (p < 0.05).
Jcm 11 01522 g001
Figure 2. (a) Whole-body MTV at baseline 18F-FDG-PET/CT before CAR T cell therapy (62 ± 86 mL) and at first follow-up 18F-FDG-PET/CT (4 ± 5 mL) after CAR T cell therapy in the entire patient cohort (p < 0.01). (b) Whole-body TLG at baseline 18F-FDG-PET/CT before CAR-T cell therapy (925 ± 1722) and at first follow-up 18F-FDG-PET/CT (33 ± 59) after CAR-T cell therapy in the entire patient cohort (p < 0.01). The asterisk (*) indicates clinical significance (p < 0.05).
Jcm 11 01522 g002
Figure 3. (a) Entropy at baseline imaging before CAR-T cell therapy in patients achieving CR (1.81 ± 0.1) vs. PR (2.08 ± 0.2; p < 0.05). (b) Uniformity at baseline imaging before CAR-T cell therapy in patients achieving CR (0.33 ± 0.02) vs. PR (0.28 ± 0.47; p < 0.05). The asterisk (*) indicates clinical significance (p < 0.05).
Jcm 11 01522 g003
Figure 4. (a) Serum LDH at baseline before CAR-T cell therapy in patients achieving CR (240 ± 28 U/L) vs. patients achieving PR (443 ± 262 U/L; p < 0.05). (b) CRP at baseline before CAR-T cell therapy in patients achieving CR (2.6 ± 4.6 μg/dL) vs. patients achieving PR (4.2 ± 6.6 μg/dL; p < 0.05). The asterisk (*) indicates clinical significance (p < 0.05).
Jcm 11 01522 g004
Figure 5. IL-6 peak (867 ± 951 ng/L vs. 9121 ± 11,266 ng/L) and IL-2R peak (2483 ± 1164 U/mL vs. 5548 ± 3949 U/mL) in patients with CR vs. PR (p > 0.05).
Jcm 11 01522 g005
Table 1. Patient characteristics.
IIIIIIIV
Ann-Arbor stage23511
International Prognostic Index Score3099
Cytokine Release Syndrome Grade10721
Table 2. Definitions of measured 1st order textural features *.
1st Order FeatureDefinition
Entropy
  • Specifies the uncertainty/randomness in the image values.
  • Measures the average amount of information required to encode the image values.
Mean
  • Mean of voxel intensities within the region
Skewness
  • Measures the asymmetry of the distribution of values about the mean value.
  • Depends on where the tail is elongated and where the mass of the distribution is concentrated
  • Can be positive or negative.
Uniformity
  • Sum of the squares of each intensity value.
  • Measure of the homogeneity of the image array, where a greater uniformity implies a greater homogeneity or a smaller range of discrete intensity values.
* Describe the distribution of voxel intensities within the image region defined by the mask through commonly used and basic metrics.
Publisher’s Note: MDPI stays neutral with regard to jurisdictional claims in published maps and institutional affiliations.

