
Measuring Recovery and Understanding Long-Term Deficits in Balance, Ankle Mobility and Hip Strength in People after an Open Reduction and Internal Fixation of Bimalleolar Fracture and Their Impact on Functionality: A 12-Month Longitudinal Study

 , , ,
, , , 

Abstract
:1. Introduction
2. Materials and Methods
2.1. Participants
2.2. Experimental Procedure
2.2.1. Functional Status Questionnaires
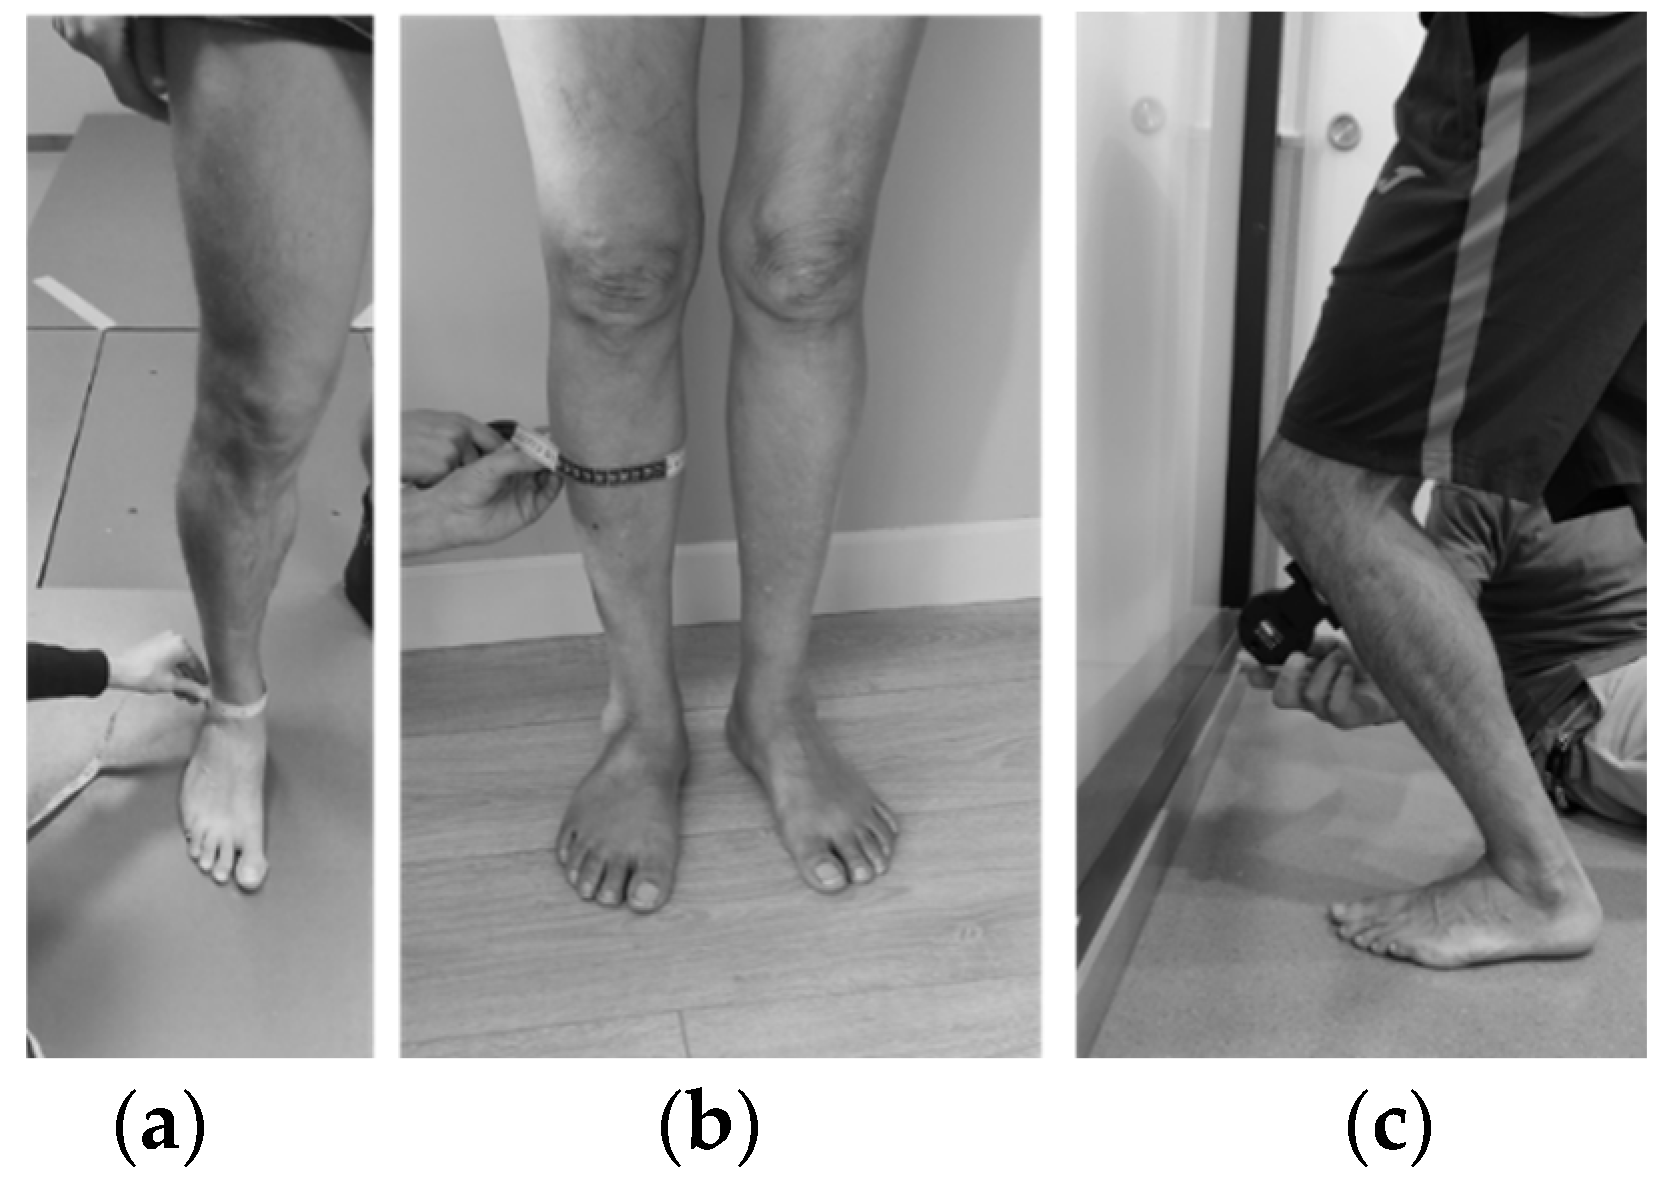
2.2.2. Ankle Dorsiflexion Range of Movement
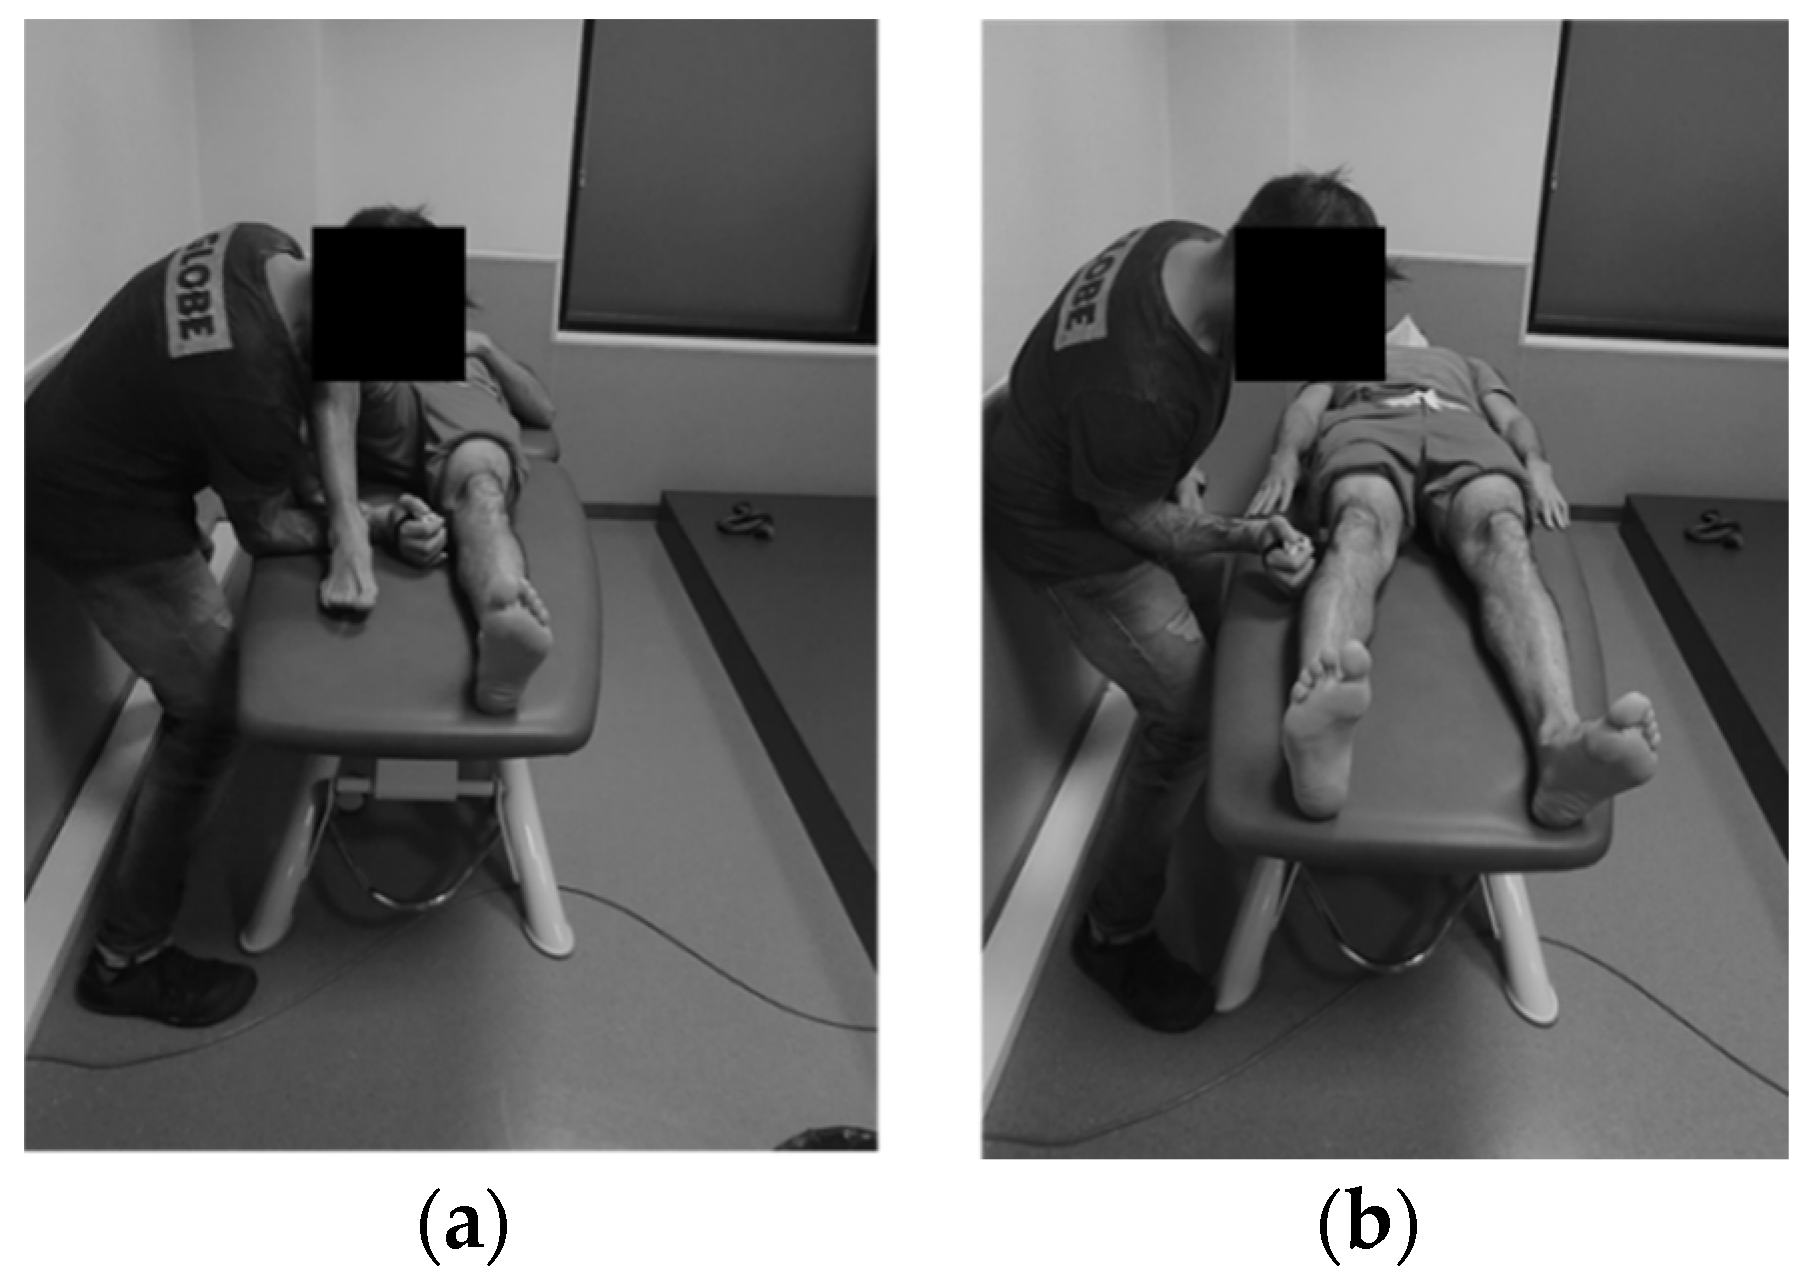
2.2.3. Hip Strength
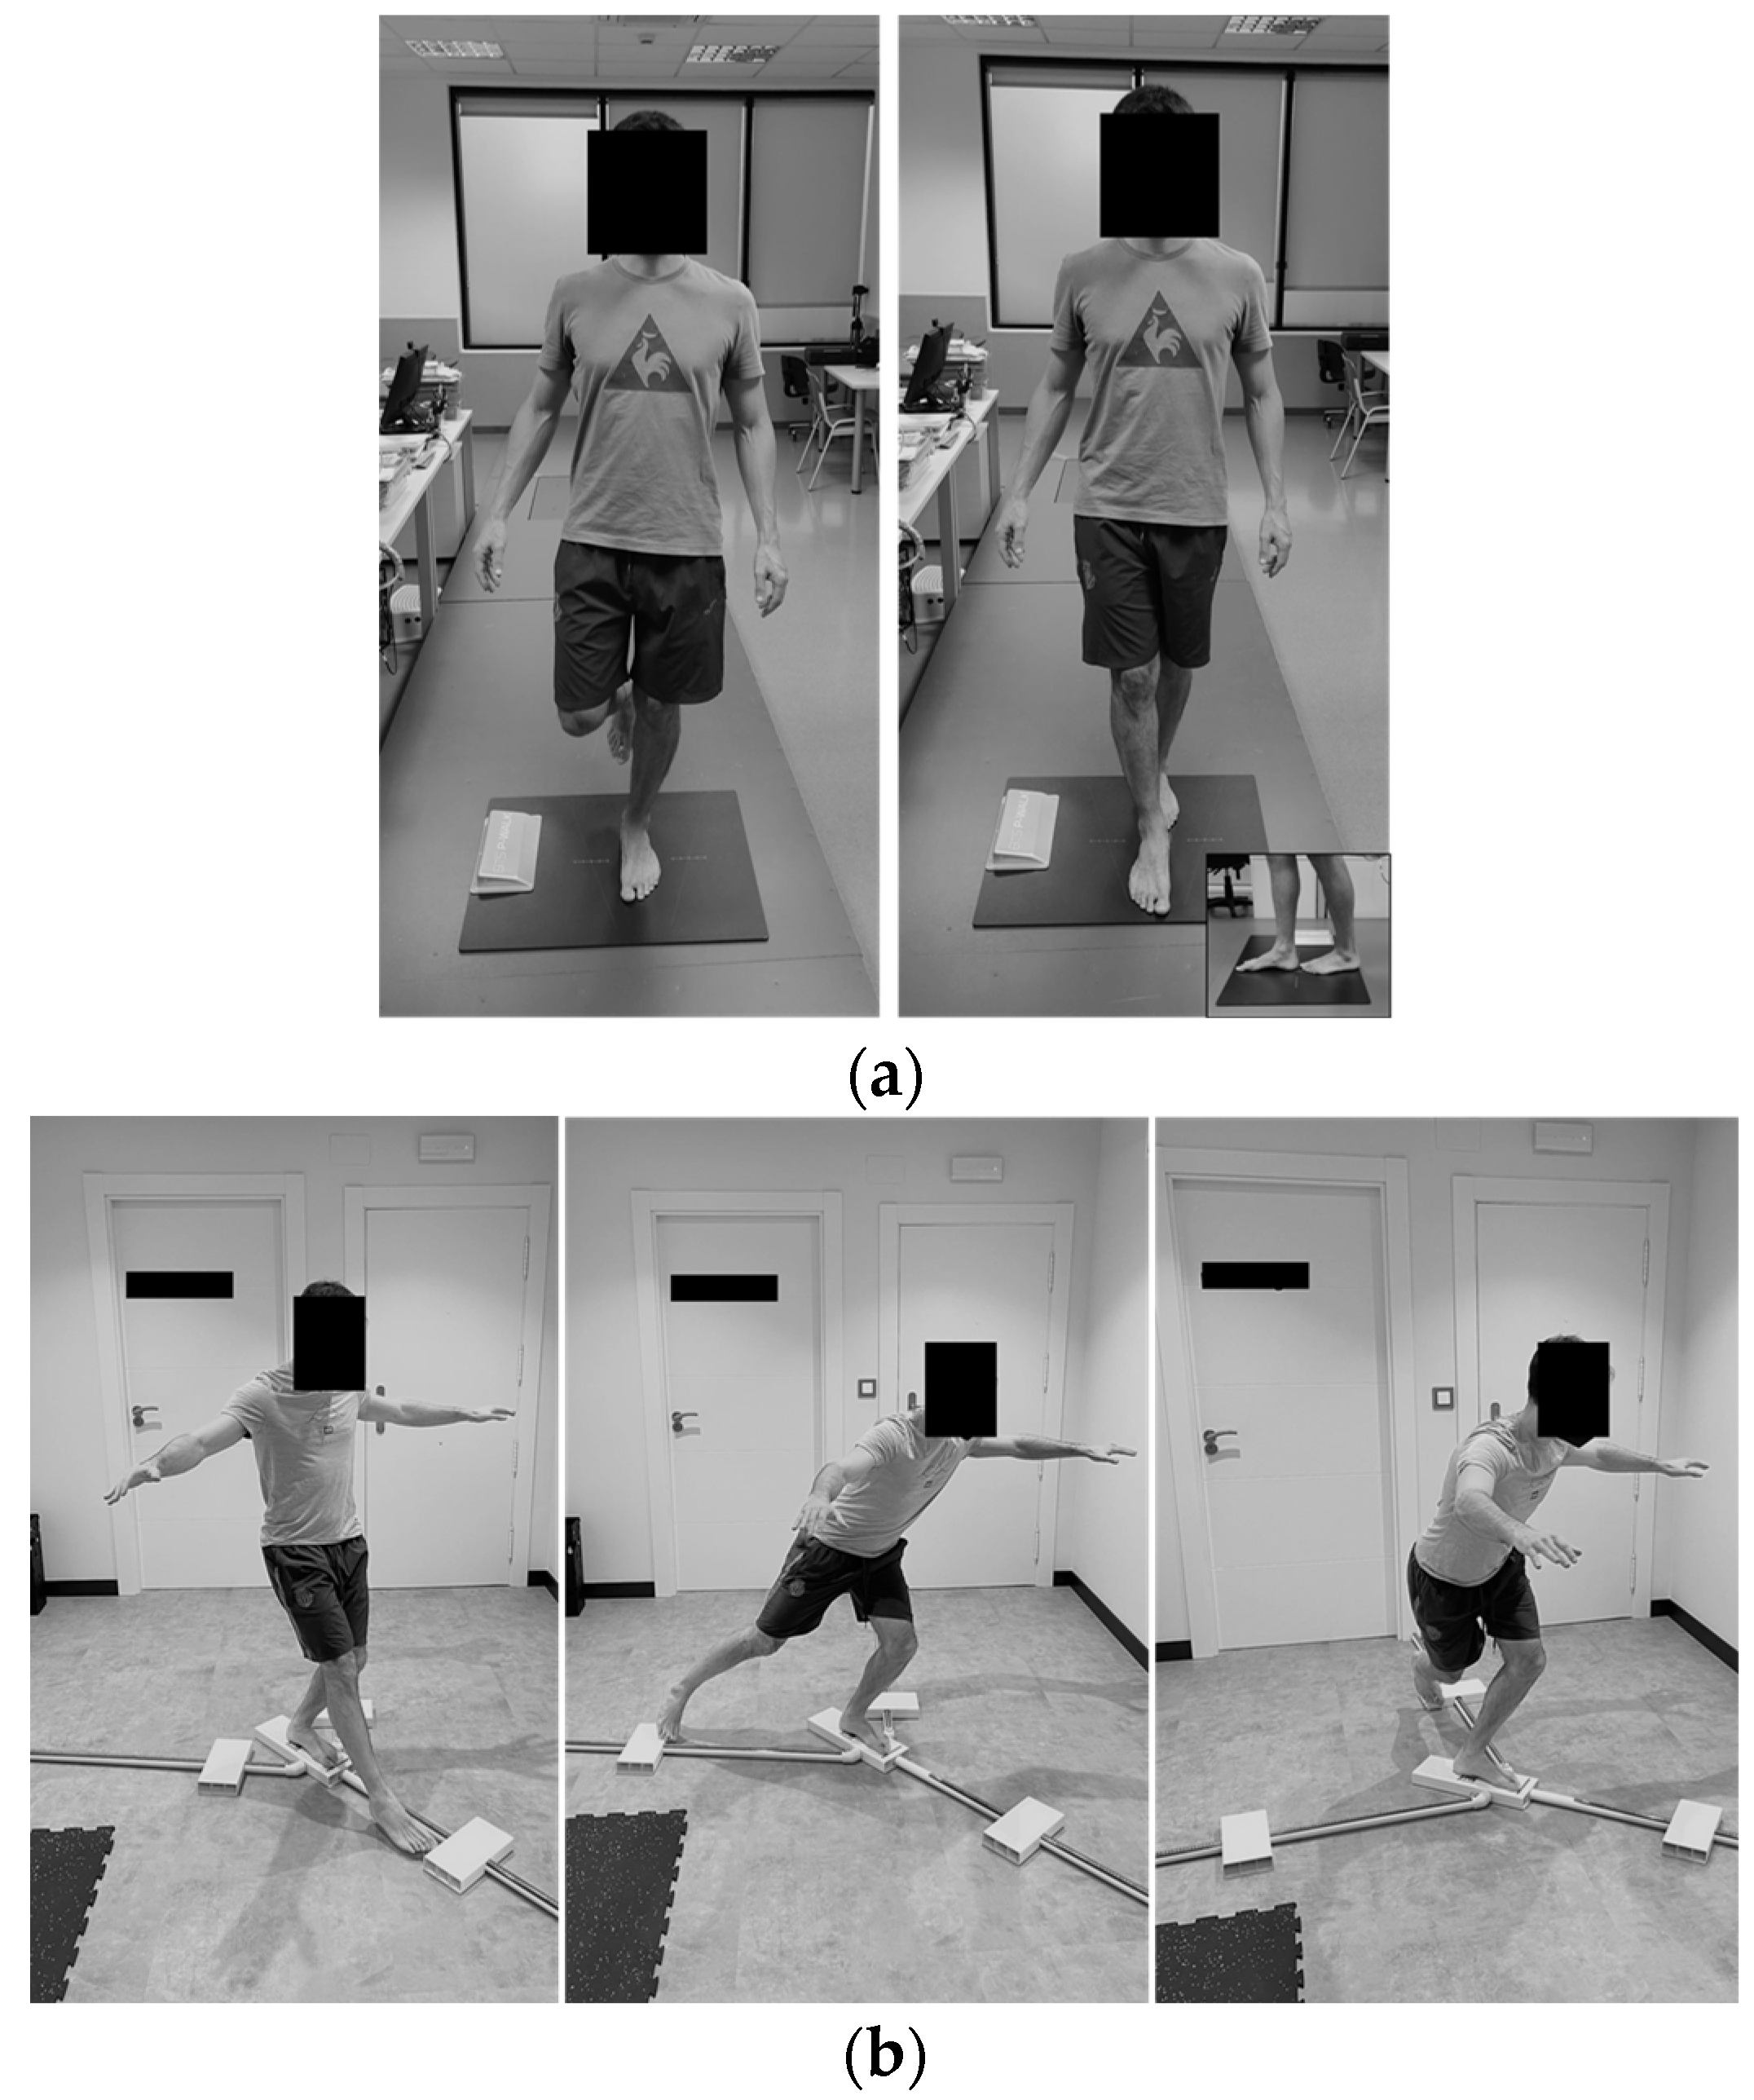
2.2.4. Balance
2.2.5. Data Reduction
2.3. Statistical Analysis
3. Results
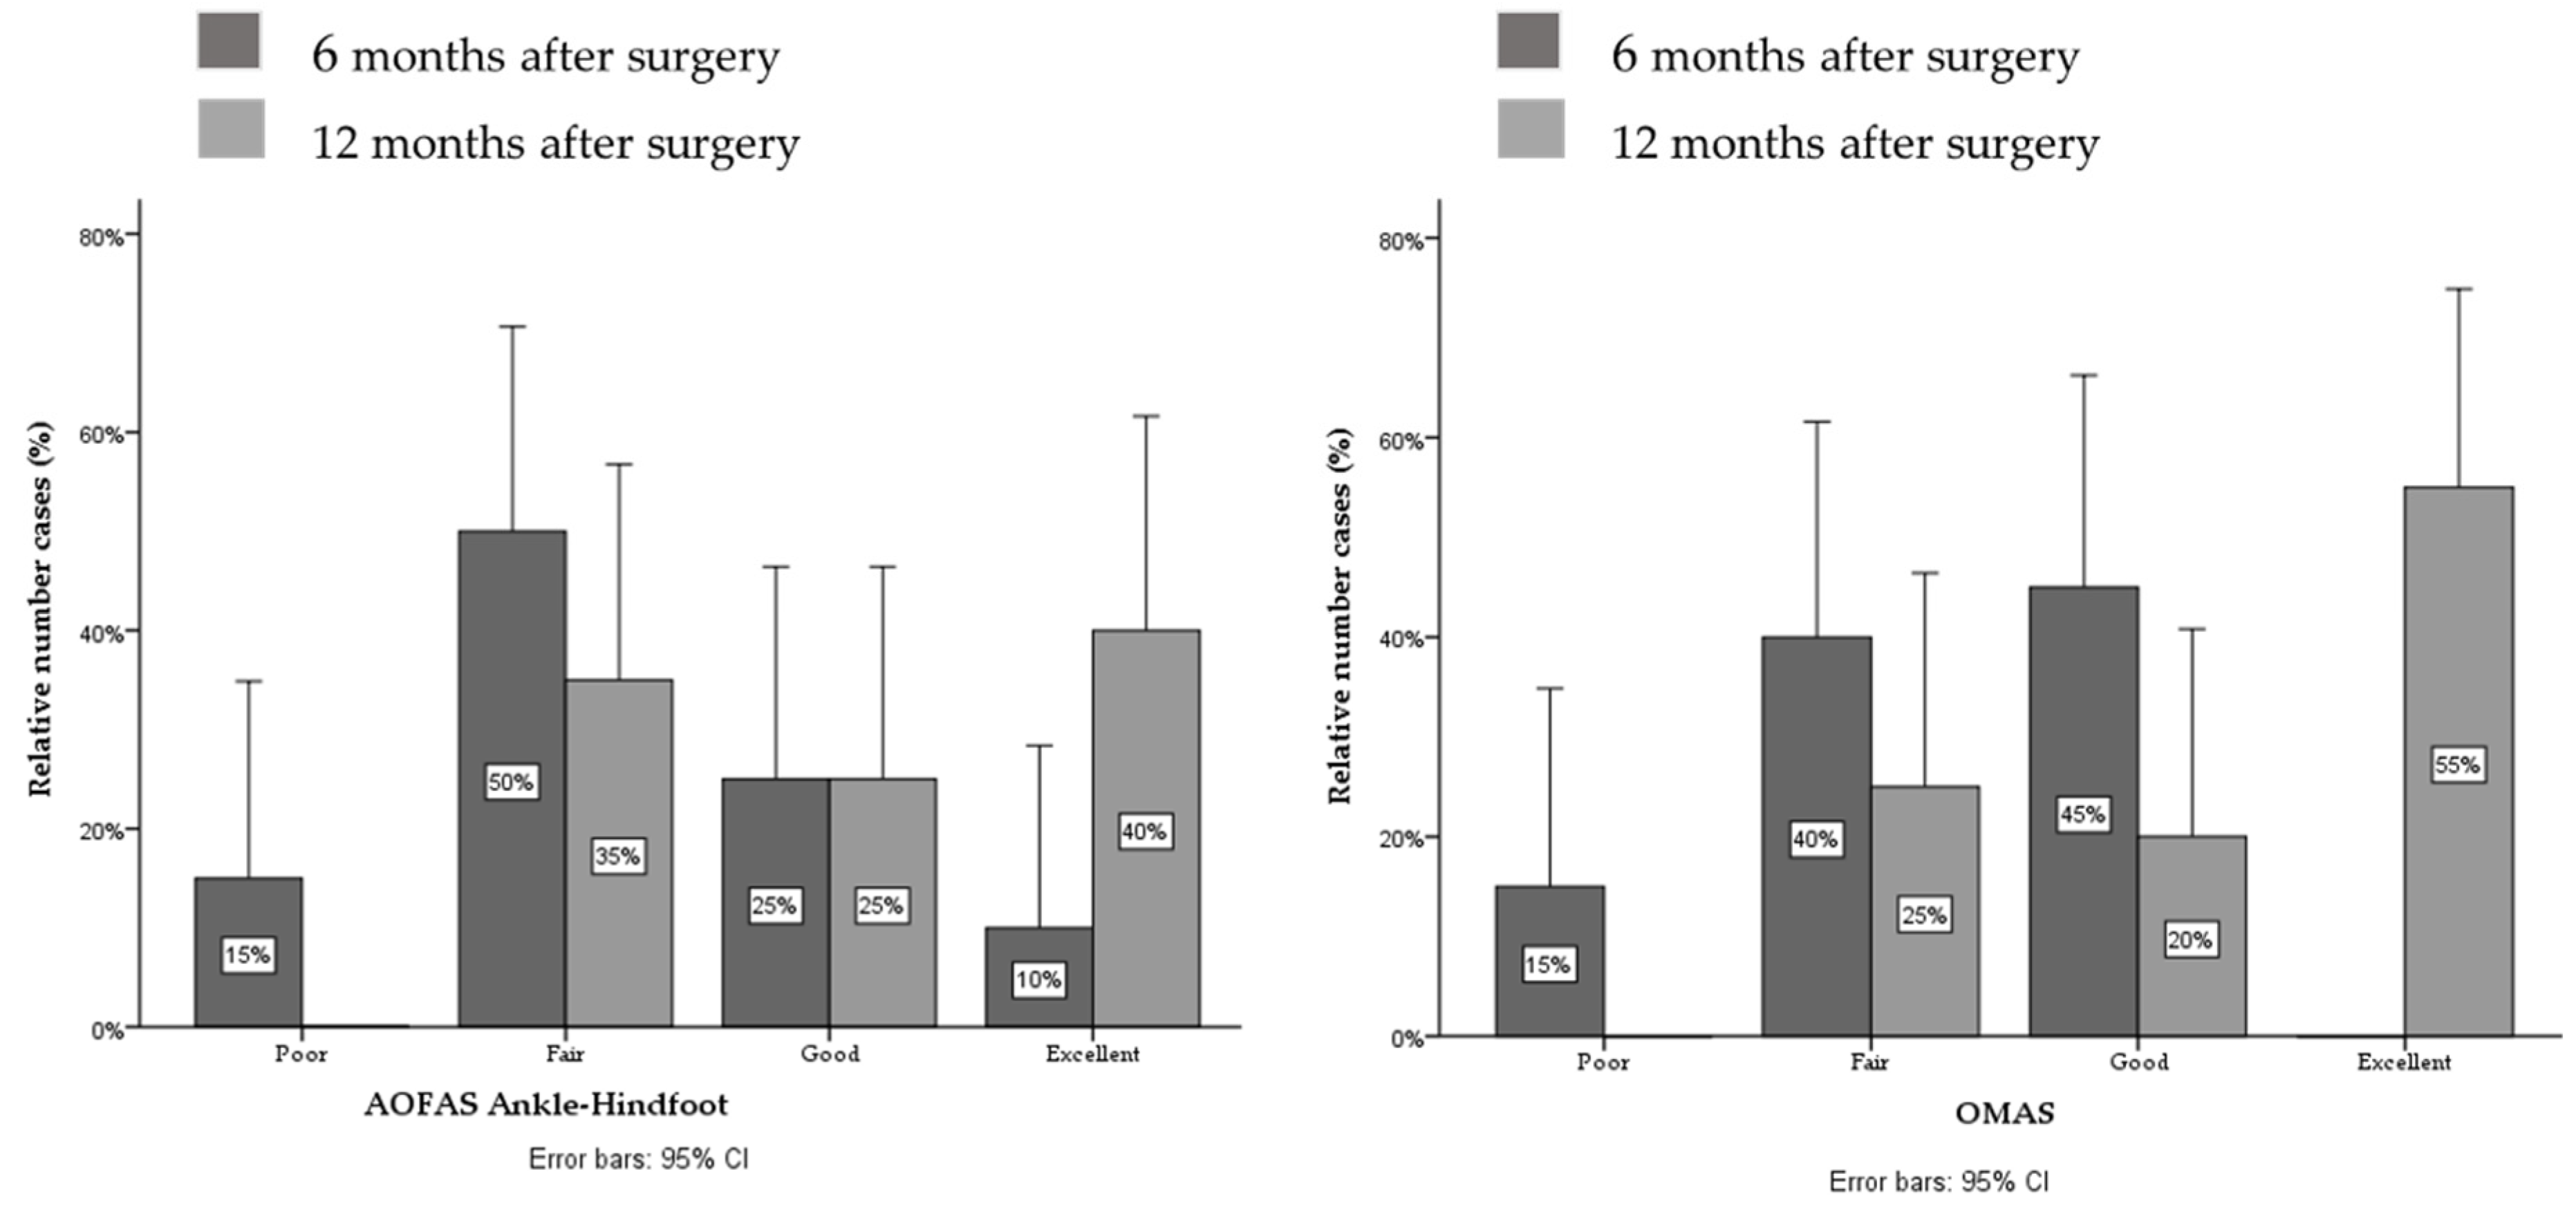
3.1. Functional Status
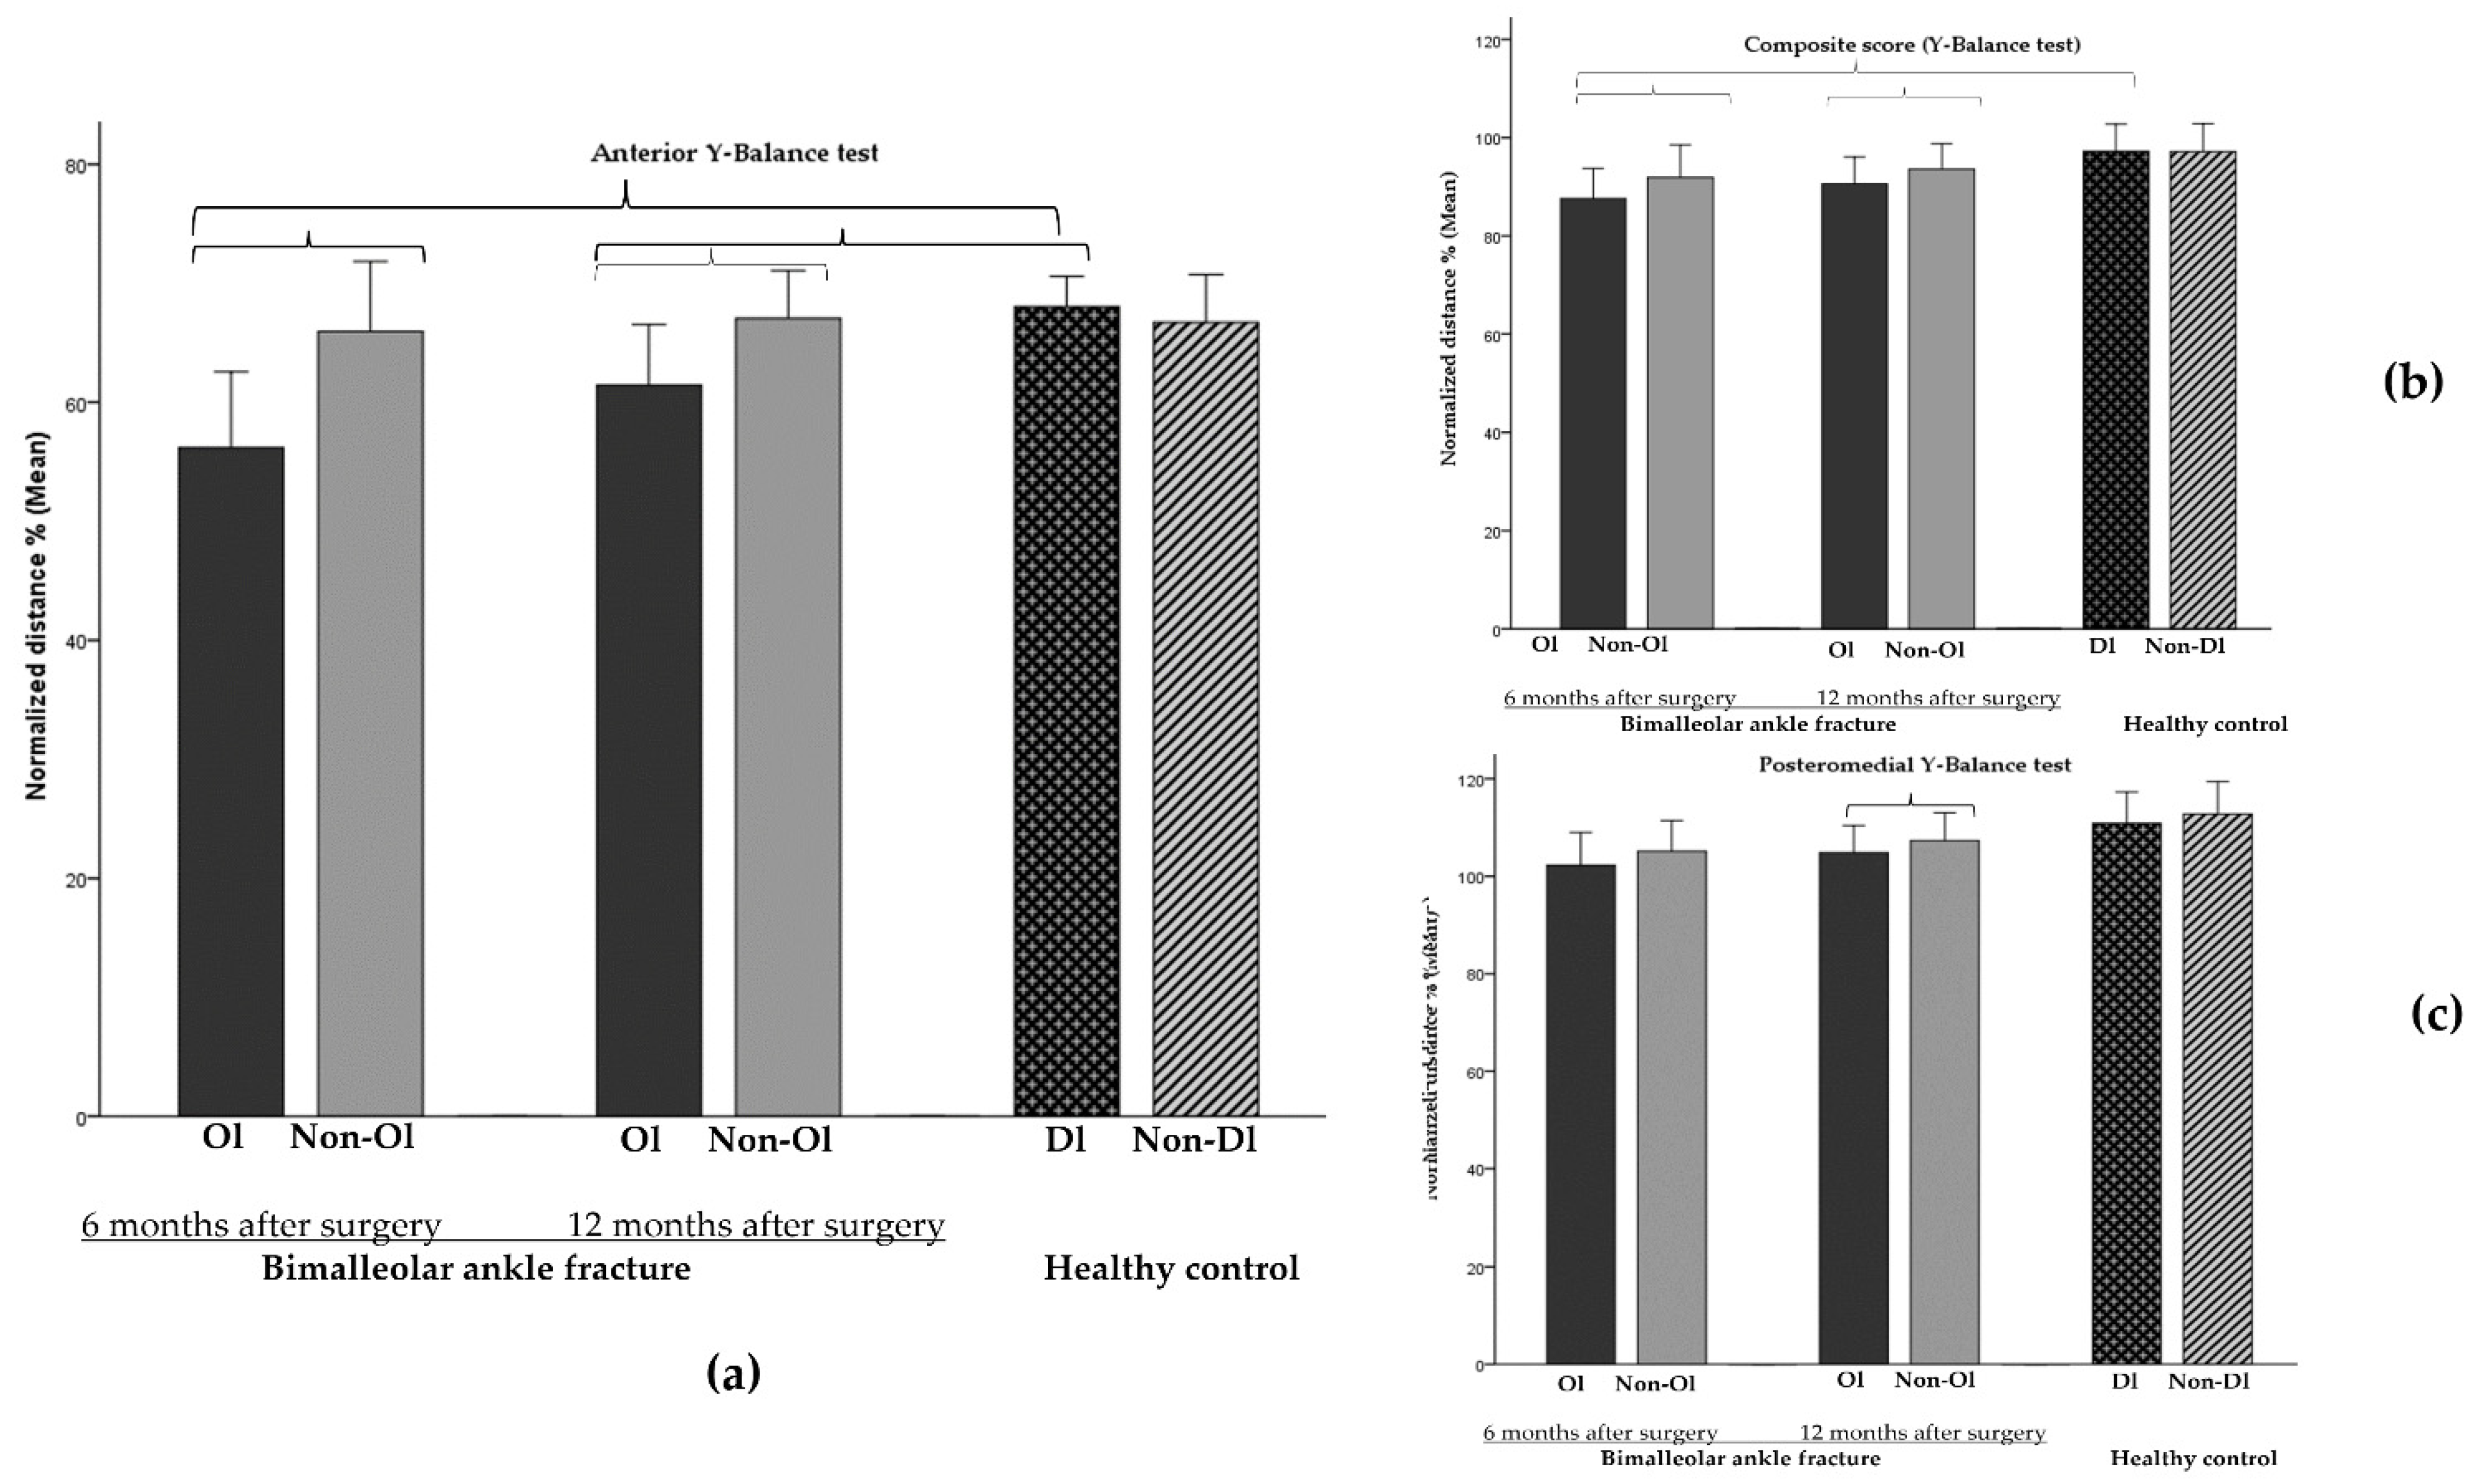
3.2. Evolution of Static and Dynamic Balance
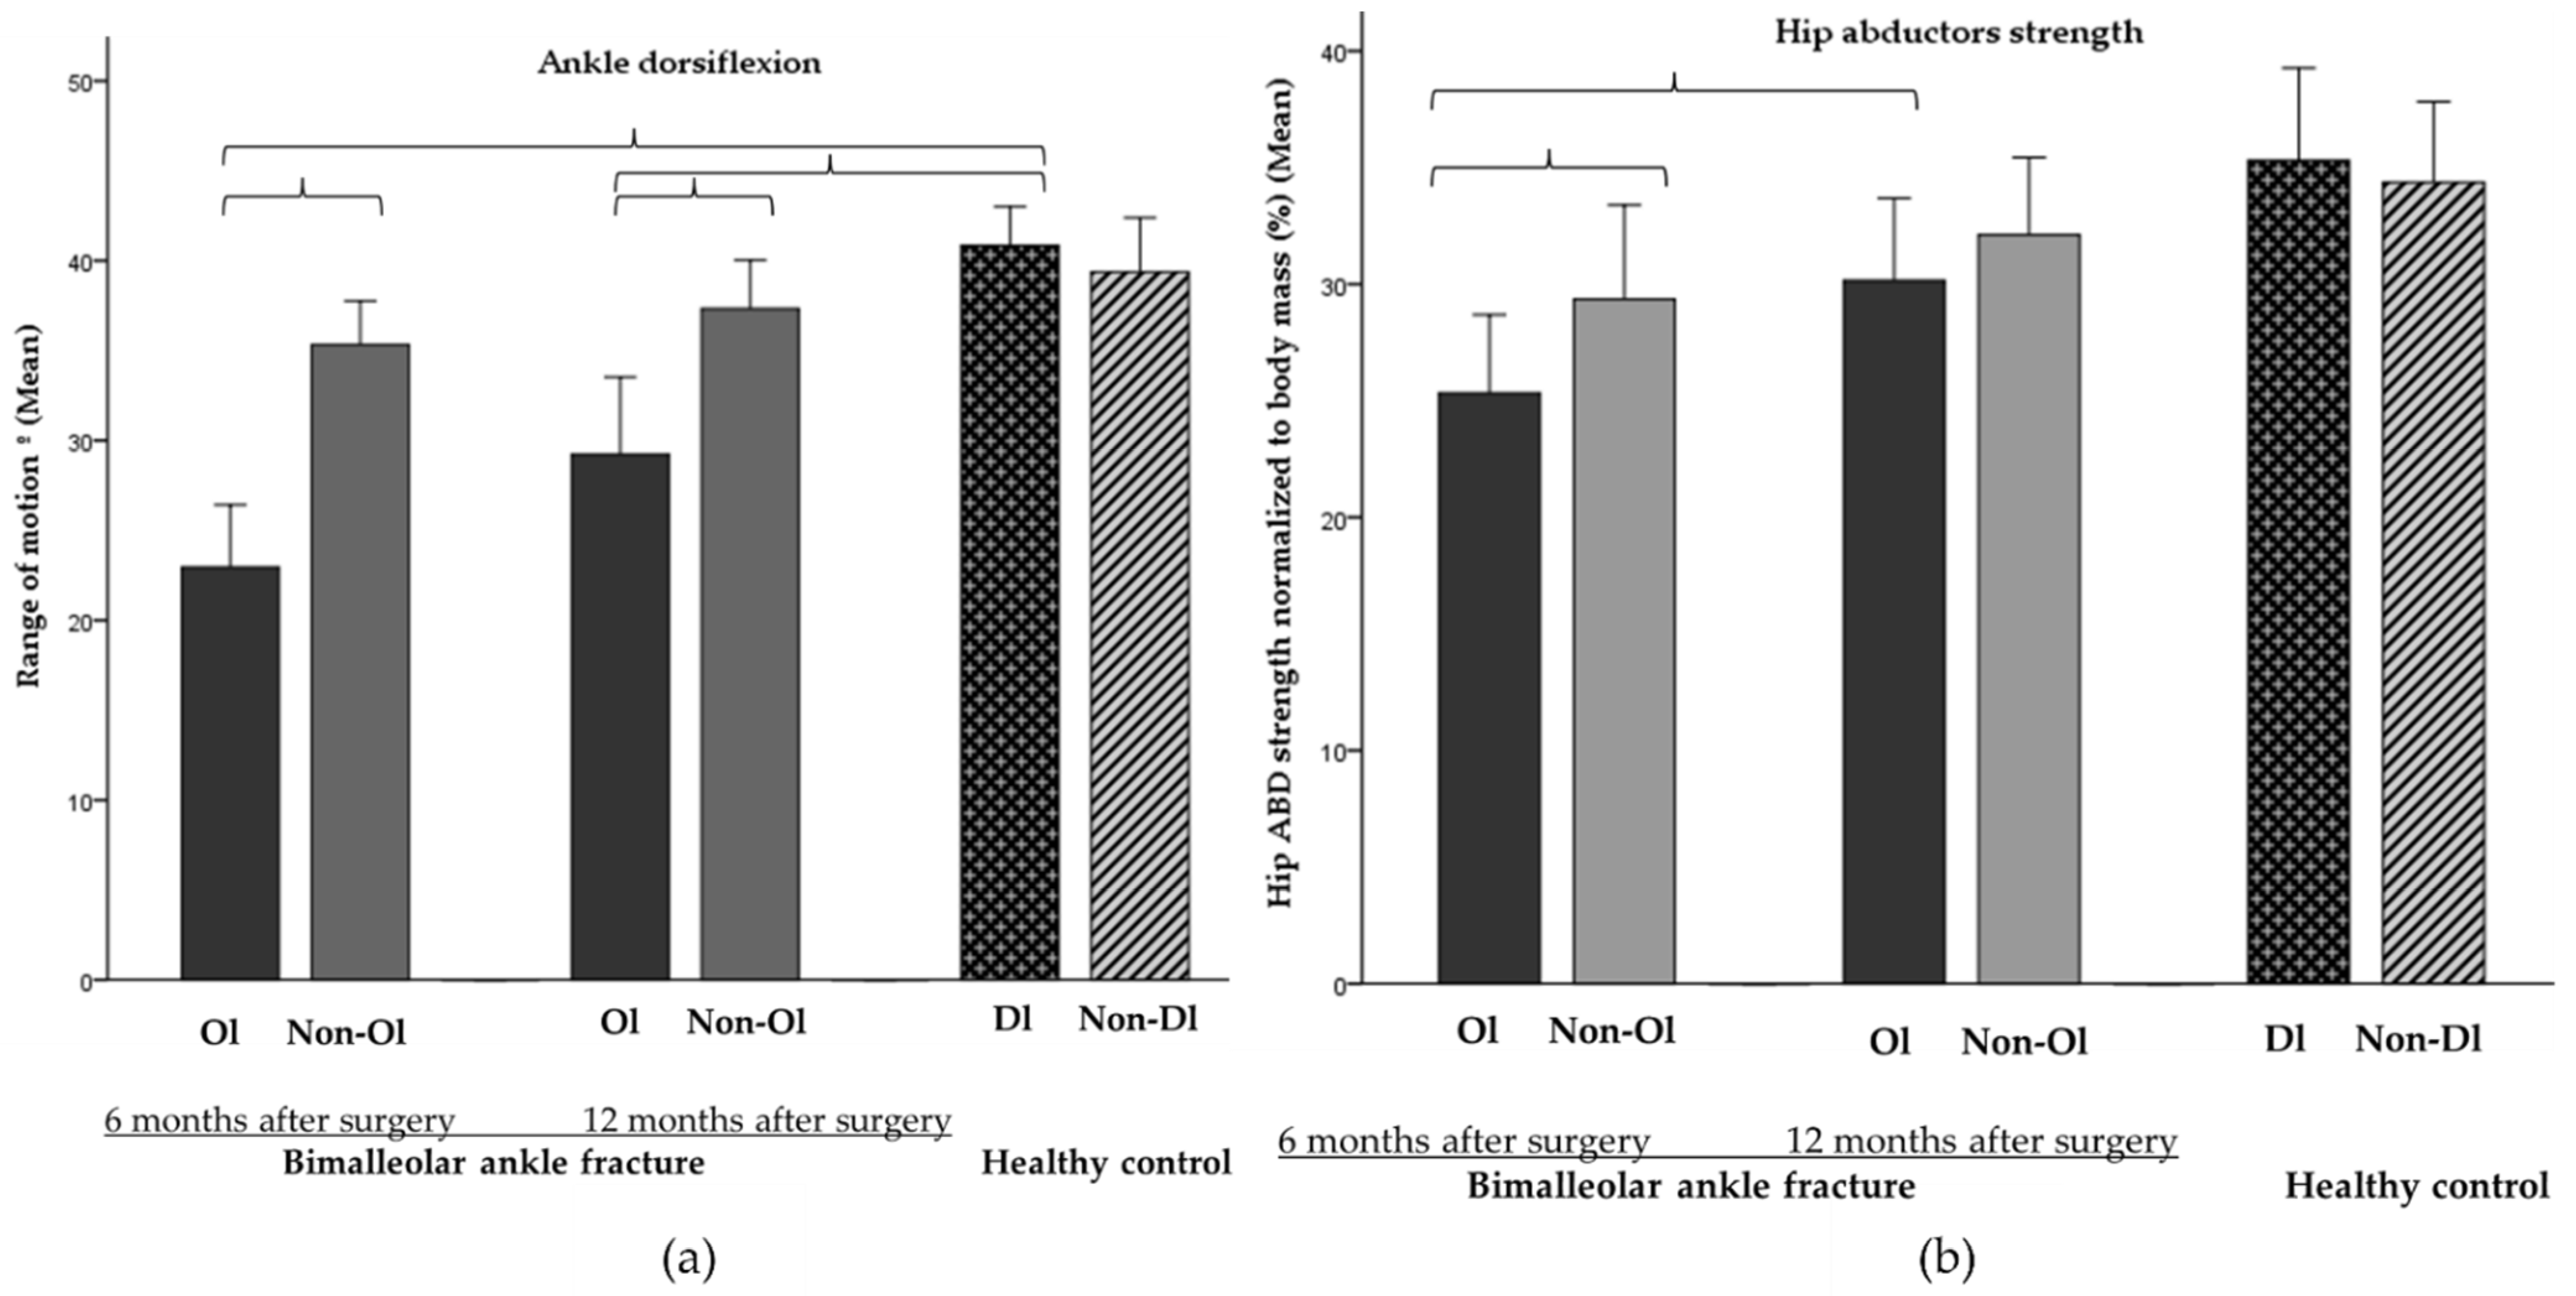
3.3. Evolution of Ankle ROM and Hip Strength and Circumferences
3.4. Correlation Analysis between Balance, Physical Capacities, Clinical Variables and Questionnaires
3.5. Relative Weight Analysis
4. Discussion
4.1. Evolution of Balance, Ankle ROM and Hip Strength from 6 to 12 Months after Surgery
4.2. Correlation Analysis between Balance, Physical Capacities, Clinical Variables and Questionnaires
4.3. Relative Weight Analyses
4.4. Limitations
4.5. Clinical Implication
5. Conclusions
Supplementary Materials
Author Contributions
Funding
Institutional Review Board Statement
Informed Consent Statement
Data Availability Statement
Acknowledgments
Conflicts of Interest
References
- O’Hara, N.N.; Isaac, M.; Slobogean, G.P.; Klazinga, N.S. The Socioeconomic Impact of Orthopaedic Trauma: A Systematic Review and Meta-Analysis. PLoS ONE 2020, 15, e0227907. [Google Scholar] [CrossRef] [PubMed]
- Wang, C.; Chen, S.; Qiao, M.; Xu, Y.; Zhao, J. Assessment of Balance Disorders in Patients after Ankle Fractures. J. Nurs. 2016, 5, 5–7. [Google Scholar] [CrossRef] [Green Version]
- Tantigate, D.; Ho, G.; Kirschenbaum, J.; Bäcker, H.; Asherman, B.; Freibott, C.; Greisberg, J.K.; Vosseller, J.T. Timing of Open Reduction and Internal Fixation of Ankle Fractures. Foot Ankle Spec. 2019, 12, 401–408. [Google Scholar] [CrossRef] [PubMed]
- McKeown, R.; Kearney, R.S.; Liew, Z.H.; Ellard, D.R. Patient Experiences of an Ankle Fracture and the Most Important Factors in Their Recovery: A Qualitative Interview Study. BMJ Open 2020, 10, e033539. [Google Scholar] [CrossRef] [Green Version]
- Nilsson, G.; Jonsson, K.; Ekdahl, C.; Eneroth, M. Outcome and Quality of Life after Surgically Treated Ankle Fractures in Patients 65 Years or Older. BMC Musculoskelet Disord. 2007, 8, 127. [Google Scholar] [CrossRef] [Green Version]
- Ziegler, P.; Schlemer, D.; Flesch, I.; Bahrs, S.; Stoeckle, U.; Werner, S.; Bahrs, C. Quality of Life and Clinical-Radiological Long-Term Results after Implant-Associated Infections in Patients with Ankle Fracture: A Retrospective Matched-Pair Study. J. Orthop. Surg. Res. 2017, 12, 114. [Google Scholar] [CrossRef] [Green Version]
- McPhail, S.M.; Dunstan, J.; Canning, J.; Haines, T.P. Life Impact of Ankle Fractures: Qualitative Analysis of Patient and Clinician Experiences. BMC Musculoskelet Disord. 2012, 13, 224. [Google Scholar] [CrossRef] [Green Version]
- Nilsson, G.; Ageberg, E.; Ekdahl, C.; Eneroth, M. Balance in Single-Limb Stance after Surgically Treated Ankle Fractures: A 14-Month Follow-Up. BMC Musculoskelet Disord. 2006, 7, 35. [Google Scholar] [CrossRef] [Green Version]
- Lash, N.; Horne, G.; Fielden, J.; Devane, P. Ankle Fractures: Functional and Lifestyle Outcomes at 2 Years. ANZ J. Surg. 2002, 72, 724–730. [Google Scholar] [CrossRef]
- Egol, K.A.; Tejwani, N.C.; Walsh, M.G.; Capla, E.L.; Koval, K.J. Predictors of Short-Term Functional Outcome Following Ankle Fracture Surgery. J. Bone Jt. Surg. Am. 2006, 88, 974–979. [Google Scholar] [CrossRef]
- Regan, D.K.; Gould, S.; Manoli, A.; Egol, K.A. Outcomes over a Decade after Surgery for Unstable Ankle Fracture: Functional Recovery Seen 1 Year Postoperatively Does Not Decay with Time. J. Orthop. Trauma 2016, 30, e236–e241. [Google Scholar] [CrossRef] [PubMed]
- Olerud, C.; Molander, H. A Scoring Scale for Symptom Evaluation after Ankle Fracture. Arch. Orthop. Trauma Surg. 1984, 103, 190–194. [Google Scholar] [CrossRef] [PubMed]
- Kitaoka, H.B.; Alexander, I.J.; Adelaar, R.S.; Nunley, J.A.; Myerson, M.S.; Sanders, M. Clinical Rating Systems for the Ankle-Hindfoot, Midfoot, Hallux, and Lesser Toes. Foot Ankle Int. 1994, 15, 349–353. [Google Scholar] [CrossRef] [PubMed]
- da Fonseca, L.L.; Nunes, I.G.; Nogueira, R.R.; Martins, G.E.V.; Mesencio, A.C.; Kobata, S.I. Reproducibility of the Lauge-Hansen, Danis-Weber, and AO Classifications for Ankle Fractures. Rev. Bras. Ortop. 2017, 53, 101–106. [Google Scholar] [CrossRef]
- Goost, H.; Wimmer, M.D.; Barg, A.; Kabir, K.; Valderrabano, V.; Burger, C. Fractures of the Ankle Joint. Dtsch. Arztebl. Int. 2014, 111, 377–388. [Google Scholar] [CrossRef] [Green Version]
- Mirando, M.; Conti, C.; Zeni, F.; Pedicini, F.; Nardone, A.; Pavese, C. Gait Alterations in Adults after Ankle Fracture: A Systematic Review. Diagnostics 2022, 12, 199. [Google Scholar] [CrossRef]
- Terrier, P.; Luthi, F.; Dériaz, O. Do Orthopaedic Shoes Improve Local Dynamic Stability of Gait? An Observational Study in Patients with Chronic Foot and Ankle Injuries. BMC Musculoskelet Disord. 2013, 14, 94. [Google Scholar] [CrossRef] [Green Version]
- Jansen, H.; Fenwick, A.; Doht, S.; Frey, S.; Meffert, R. Clinical Outcome and Changes in Gait Pattern after Pilon Fractures. Int. Orthop. 2013, 37, 51–58. [Google Scholar] [CrossRef] [Green Version]
- Albin, S.R.; Koppenhaver, S.L.; Marcus, R.; Dibble, L.; Cornwall, M.; Fritz, J.M. Short-Term Effects of Manual Therapy in Patients After Surgical Fixation of Ankle and/or Hindfoot Fracture: A Randomized Clinical Trial. J. Orthop. Sports Phys. Ther. 2019, 49, 310–319. [Google Scholar] [CrossRef]
- Segal, G.; Elbaz, A.; Parsi, A.; Heller, Z.; Palmanovich, E.; Nyska, M.; Feldbrin, Z.; Kish, B. Clinical Outcomes Following Ankle Fracture: A Cross-Sectional Observational Study. J. Foot Ankle Res. 2014, 7, 50. [Google Scholar] [CrossRef]
- Schneider, W.; Jurenitsch, S. Normative Data for the American Orthopedic Foot and Ankle Society Ankle-Hindfoot, Midfoot, Hallux and Lesser Toes Clinical Rating System. Int. Orthop. 2016, 40, 301–306. [Google Scholar] [CrossRef] [PubMed]
- de Boer, A.S.; Tjioe, R.J.C.; Van der Sijde, F.; Meuffels, D.E.; den Hoed, P.T.; Van der Vlies, C.H.; Tuinebreijer, W.E.; Verhofstad, M.H.J.; Van Lieshout, E.M.M.; AOFAS Study Group. The American Orthopaedic Foot and Ankle Society Ankle-Hindfoot Scale; Translation and Validation of the Dutch Language Version for Ankle Fractures. BMJ Open 2017, 7, e017040. [Google Scholar] [CrossRef] [PubMed] [Green Version]
- Bechenhamp, P.R.; Chung-Wei, C.L.; Chagpar, S.; Herbert, R.D.; van der Ploeg, H.; Moseley, A.M. Prognosis of Physical Function Following Ankle Fracture: A Systematic Review with Meta-Analysis. J. Orthop. Sports Phys. Ther. 2014, 44, 841–851. [Google Scholar] [CrossRef]
- Dudek, K.; Drużbicki, M.; Przysada, G.; Śpiewak, D. Assessment of Standing Balance in Patients after Ankle Fractures. Acta Bioeng. Biomech. 2014, 16, 59–65. [Google Scholar]
- Sibley, K.M.; Beauchamp, M.K.; Van Ooteghem, K.; Straus, S.E.; Jaglal, S.B. Using the Systems Framework for Postural Control to Analyze the Components of Balance Evaluated in Standardized Balance Measures: A Scoping Review. Arch. Phys. Med. Rehabil. 2015, 96, 122e.29–132.e29. [Google Scholar] [CrossRef] [Green Version]
- Kiss, R.; Schedler, S.; Muehlbauer, T. Associations between Types of Balance Performance in Healthy Individuals across the Lifespan: A Systematic Review and Meta-Analysis. Front. Physiol. 2018, 9, 1366. [Google Scholar] [CrossRef]
- Pau, M.; Arippa, F.; Leban, B.; Corona, F.; Ibba, G.; Todde, F.; Scorcu, M. Relationship between Static and Dynamic Balance Abilities in Italian Professional and Youth League Soccer Players. Phys. Ther. Sport 2015, 16, 236–241. [Google Scholar] [CrossRef]
- Karimi, M.T.; Solomonidis, S. The Relationship between Parameters of Static and Dynamic Stability Tests. J. Res. Med Sci. Off. J. Isfahan Univ. Med. Sci. 2011, 16, 530–535. [Google Scholar]
- Bisson, E.J.; McEwen, D.; Lajoie, Y.; Bilodeau, M. Effects of Ankle and Hip Muscle Fatigue on Postural Sway and Attentional Demands during Unipedal Stance. Gait Posture 2011, 33, 83–87. [Google Scholar] [CrossRef] [Green Version]
- Hoch, M.C.; Farwell, K.E.; Gaven, S.L.; Weinhandl, J.T. Weight-Bearing Dorsiflexion Range of Motion and Landing Biomechanics in Individuals with Chronic Ankle Instability. J. Athl. Train. 2015, 50, 833–839. [Google Scholar] [CrossRef] [Green Version]
- Hsu, C.-Y.; Tsai, Y.-S.; Yau, C.-S.; Shie, H.-H.; Wu, C.-M. Differences in Gait and Trunk Movement between Patients after Ankle Fracture and Healthy Subjects. Biomed. Eng. Online 2019, 18, 26. [Google Scholar] [CrossRef] [Green Version]
- Terada, M.; Harkey, M.S.; Wells, A.M.; Pietrosimone, B.G.; Gribble, P.A. The Influence of Ankle Dorsiflexion and Self-Reported Patient Outcomes on Dynamic Postural Control in Participants with Chronic Ankle Instability. Gait Posture 2014, 40, 193–197. [Google Scholar] [CrossRef]
- Basnett, C.R.; Hanish, M.J.; Wheeler, T.J.; Miriovsky, D.J.; Danielson, E.L.; Barr, J.B.; Grindstaff, T.L. Ankle Dorsiflexion Range of Motion Influences Dynamic Balance in Individuals with Chronic Ankle Instability. Int. J. Sports Phys. Ther. 2013, 8, 121–128. [Google Scholar]
- DeJong, A.F.; Mangum, L.C.; Hertel, J. Ultrasound Imaging of the Gluteal Muscles during the Y-Balance Test in Individuals With or Without Chronic Ankle Instability. J. Athl. Train. 2019, 55, 49–57. [Google Scholar] [CrossRef] [Green Version]
- Painter, E.E.; Deyle, G.D.; Allen, C.; Petersen, E.J.; Croy, T.; Rivera, K.P. Manual Physical Therapy Following Immobilization for Stable Ankle Fracture: A Case Series. J. Orthop. Sports Phys. Ther. 2015, 45, 665–674. [Google Scholar] [CrossRef]
- Lohman, T.G.; Roche, A.F.; Martorell, R. Anthropometric Standardization Reference Manual; Human Kinetics Books: Champaign, IL, USA, 1991; ISBN 978-0-87322-331-7. [Google Scholar]
- Meinberg, E.G.; Agel, J.; Roberts, C.S.; Karam, M.D.; Kellam, J.F. Fracture and Dislocation Classification Compendium-2018. J. Orthop. Trauma 2018, 32 (Suppl. S1), S1–S170. [Google Scholar] [CrossRef]
- Ceccarelli, F.; Calderazzi, F.; Pedrazzi, G. Is There a Relation between AOFAS Ankle-Hindfoot Score and SF-36 in Evaluation of Achilles Ruptures Treated by Percutaneous Technique? J. Foot Ankle Surg. Off. Publ. Am. Coll. Foot Ankle Surg. 2013, 53, 16–21. [Google Scholar] [CrossRef]
- Turhan, E.; Demirel, M.; Daylak, A.; Huri, G.; Doral, M.N.; Çelik, D. Translation, Cross-Cultural Adaptation, Reliability and Validity of the Turkish Version of the Olerud-Molander Ankle Score (OMAS). Acta Orthop. Traumatol. Turc. 2017, 51, 60–64. [Google Scholar] [CrossRef]
- Dill, K.E.; Begalle, R.L.; Frank, B.S.; Zinder, S.M.; Padua, D.A. Altered Knee and Ankle Kinematics during Squatting in Those with Limited Weight-Bearing-Lunge Ankle-Dorsiflexion Range of Motion. J. Athl. Train. 2014, 49, 723–732. [Google Scholar] [CrossRef] [Green Version]
- Konor, M.M.; Morton, S.; Eckerson, J.M.; Grindstaff, T.L. Reliability of Three Measures of Ankle Dorsiflexion Range of Motion. Int. J. Sports Phys. Ther. 2012, 7, 279–287. [Google Scholar]
- Larsen, P.; Nielsen, H.B.; Lund, C.; Sørensen, D.S.; Larsen, B.T.; Matthews, M.; Vicenzino, B.; Elsoe, R. A Novel Tool for Measuring Ankle Dorsiflexion: A Study of Its Reliability in Patients Following Ankle Fractures. Foot Ankle Surg. 2016, 22, 274–277. [Google Scholar] [CrossRef]
- Stark, T.; Walker, B.; Phillips, J.K.; Fejer, R.; Beck, R. Hand-Held Dynamometry Correlation with the Gold Standard Isokinetic Dynamometry: A Systematic Review. PMR 2011, 3, 472–479. [Google Scholar] [CrossRef]
- Salas-Gómez, D.; Fernández-Gorgojo, M.; Sanchez-Juan, P.; Bercero, E.L.; Isabel Perez-Núñez, M.; Barbado, D. Quantifying Balance Deficit in People with Ankle Fracture Six Months after Surgical Intervention through the Y-Balance Test. Gait Posture 2020. [Google Scholar] [CrossRef]
- Youdas, J.W.; Mraz, S.T.; Norstad, B.J.; Schinke, J.J.; Hollman, J.H. Determining Meaningful Changes in Hip Abductor Muscle Strength Obtained by Handheld Dynamometry. Physiother. Theory Pract. 2008, 24, 215–220. [Google Scholar] [CrossRef]
- Kawai, H.; Taniguchi, Y.; Seino, S.; Sakurai, R.; Osuka, Y.; Obuchi, S.; Watanabe, Y.; Kim, H.; Inagaki, H.; Kitamura, A.; et al. Reference Values of Gait Parameters Measured with a Plantar Pressure Platform in Community-Dwelling Older Japanese Adults. Clin. Interv. Aging 2019, 14, 1265–1276. [Google Scholar] [CrossRef] [Green Version]
- Plisky, P.J.; Gorman, P.P.; Butler, R.J.; Kiesel, K.B.; Underwood, F.B.; Elkins, B. The Reliability of an Instrumented Device for Measuring Components of the Star Excursion Balance Test. N. Am. J. Sports Phys. Ther. 2009, 4, 92–99. [Google Scholar]
- Li, Z.; Liang, Y.-Y.; Wang, L.; Sheng, J.; Ma, S.-J. Reliability and Validity of Center of Pressure Measures for Balance Assessment in Older Adults. J. Phys. Ther. Sci. 2016, 28, 1364–1367. [Google Scholar] [CrossRef] [Green Version]
- Hertel, J.; Braham, R.A.; Hale, S.A.; Olmsted-Kramer, L.C. Simplifying the Star Excursion Balance Test: Analyses of Subjects with and without Chronic Ankle Instability. J. Orthop. Sports Phys. Ther. 2006, 36, 131–137. [Google Scholar] [CrossRef] [Green Version]
- Fatima, S.; Bhati, P.; Singla, D.; Choudhary, S.; Hussain, M.E. Electromyographic Activity of Hip Musculature During Functional Exercises in Participants with and Without Chronic Ankle Instability. J. Chiropr. Med. 2020, 19, 82–90. [Google Scholar] [CrossRef]
- Hedges, L.; Olkin, I. Statistical Methods in Meta-Analysis; Academic Press: Orlando, FL, USA, 1985. [Google Scholar]
- Johnson, J.W. A Heuristic Method for Estimating the Relative Weight of Predictor Variables in Multiple Regression. Multivar. Behav. Res. 2000, 35, 1–19. [Google Scholar] [CrossRef]
- Tonidandel, S.; LeBreton, J.M. RWA Web: A Free, Comprehensive, Web-Based, and User-Friendly Tool for Relative Weight Analyses. J. Bus. Psychol. 2015, 30, 207–216. [Google Scholar] [CrossRef] [Green Version]
- Ryu, C.H.; Park, J.; Kang, M.; Oh, J.H.; Kim, Y.K.; Kim, Y.I.; Lee, H.S.; Seo, S.G. Differences in Lower Quarter Y-Balance Test with Player Position and Ankle Injuries in Professional Baseball Players. J. Orthop. Surg. 2019, 27. [Google Scholar] [CrossRef] [Green Version]
- Gribble, P.A.; Hertel, J. Considerations for Normalizing Measures of the Star Excursion Balance Test. Meas. Phys. Educ. Exerc. Sci. 2003, 7, 89–100. [Google Scholar] [CrossRef]
- Gkrilias, P.; Zavvos, A.; Fousekis, K.; Billis, E.; Matzaroglou, C.; Tsepis, E. Dynamic Balance Asymmetries in Pre-Season Injury-Prevention Screening in Healthy Young Soccer Players Using the Modified Star Excursion Balance Test—A Pilot Study. J. Phys. Ther. Sci. 2018, 30, 1141–1144. [Google Scholar] [CrossRef] [Green Version]
- Plisky, P.J.; Rauh, M.J.; Kaminski, T.W.; Underwood, F.B. Star Excursion Balance Test as a Predictor of Lower Extremity Injury in High School Basketball Players. J. Orthop. Sports Phys. Ther. 2006, 36, 911–919. [Google Scholar] [CrossRef]
- Ageberg, E.; Zätterström, R.; Fridén, T.; Moritz, U. Individual Factors Affecting Stabilometry and One-Leg Hop Test in 75 Healthy Subjects, Aged 15–44 Years. Scand. J. Med. Sci. Sports 2001, 11, 47–53. [Google Scholar] [CrossRef]
- Nilsson, G.; Nyberg, P.; Ekdahl, C.; Eneroth, M. Performance after Surgical Treatment of Patients with Ankle Fractures—14-Month Follow-Up. Physiother. Res. Int. 2003, 8, 69–82. [Google Scholar] [CrossRef]
- Lindsjö, U. Operative Treatment of Ankle Fracture-Dislocations. A Follow-up Study of 306/321 Consecutive Cases. Clin. Orthop. Relat. Res. 1985, 199, 28–38. [Google Scholar]
- Hubbard, T.J.; Kramer, L.C.; Denegar, C.R.; Hertel, J. Correlations among Multiple Measures of Functional and Mechanical Instability in Subjects with Chronic Ankle Instability. J. Athl. Train. 2007, 42, 361–366. [Google Scholar]
- McCann, R.S.; Crossett, I.D.; Terada, M.; Kosik, K.B.; Bolding, B.A.; Gribble, P.A. Hip Strength and Star Excursion Balance Test Deficits of Patients with Chronic Ankle Instability. J. Sci. Med. Sport 2017, 20, 992–996. [Google Scholar] [CrossRef]
- Kanamiya, Y.; Ota, S.; Sato, D. Ankle and Hip Balance Control Strategies with Transitions. In Proceedings of the 2010 IEEE International Conference on Robotics and Automation, Anchorage, AK, USA, 4–8 May 2010. [Google Scholar] [CrossRef]
- Gillette, J.C.; Abbas, J.J. Foot Placement Alters the Mechanisms of Postural Control while Standing and Reaching. IEEE Trans. Neural. Syst. Rehabil. Eng. 2003, 11, 377–385. [Google Scholar] [CrossRef] [Green Version]
- Kim, M.-K.; Kim, S.-G. Analysis of the Correlation between the Differences in Muscle Strengths between the Bilateral Lower Extremities and Postural Stability in Healthy Adults. J. Phys. Ther. Sci. 2015, 27, 3103–3104. [Google Scholar] [CrossRef] [Green Version]
- Jaber, H.; Lohman, E.; Daher, N.; Bains, G.; Nagaraj, A.; Mayekar, P.; Shanbhag, M.; Alameri, M. Neuromuscular Control of Ankle and Hip during Performance of the Star Excursion Balance Test in Subjects with and without Chronic Ankle Instability. PLoS ONE 2018, 13, e0201479. [Google Scholar] [CrossRef] [Green Version]
- Tsai, A.C.; Chang, T.-L. The Effectiveness of BMI, Calf Circumference and Mid-Arm Circumference in Predicting Subsequent Mortality Risk in Elderly Taiwanese. Br. J. Nutr. 2011, 105, 275–281. [Google Scholar] [CrossRef]
- López-Valenciano, A.; Ayala, F.; De Ste Croix, M.; Barbado, D.; Vera-Garcia, F.J. Different Neuromuscular Parameters Influence Dynamic Balance in Male and Female Football Players. Knee Surg. Sports Traumatol. Arthrosc. 2019, 27, 962–970. [Google Scholar] [CrossRef]
- Hancock, M.J.; Herbert, R.D.; Stewart, M. Prediction of Outcome after Ankle Fracture. J. Orthop. Sports Phys. Ther. 2005, 35, 786–792. [Google Scholar] [CrossRef] [Green Version]
- van der Sluis, C.K.; Eisma, W.H.; Groothoff, J.W.; ten Duis, H.J. Long-Term Physical, Psychological and Social Consequences of a Fracture of the Ankle. Injury 1998, 29, 277–280. [Google Scholar] [CrossRef]
- Smeeing, D.P.J.; Houwert, R.M.; Briet, J.P.; Groenwold, R.H.H.; Lansink, K.W.W.; Leenen, L.P.H.; van der Zwaal, P.; Hoogendoorn, J.M.; van Heijl, M.; Verleisdonk, E.J.; et al. Weight-Bearing or Non-Weight-Bearing after Surgical Treatment of Ankle Fractures: A Multicenter Randomized Controlled Trial. Eur. J. Trauma Emerg. Surg. 2020, 46, 121–130. [Google Scholar] [CrossRef] [Green Version]
- Smeeing, D.P.J.; Houwert, R.M.; Briet, J.P.; Kelder, J.C.; Segers, M.J.M.; Verleisdonk, E.J.M.M.; Leenen, L.P.H.; Hietbrink, F. Weight-Bearing and Mobilization in the Postoperative Care of Ankle Fractures: A Systematic Review and Meta-Analysis of Randomized Controlled Trials and Cohort Studies. PLoS ONE 2015, 10, e0118320. [Google Scholar] [CrossRef]
- Gul, A.; Batra, S.; Mehmood, S.; Gillham, N. Immediate Unprotected Weight-Bearing of Operatively Treated Ankle Fractures. Acta Orthop. Belg. 2007, 73, 360–365. [Google Scholar]
- Black, J.D.J.; Bhavikatti, M.; Al-Hadithy, N.; Hakmi, A.; Kitson, J. Early Weight-Bearing in Operatively Fixed Ankle Fractures: A Systematic Review. Foot 2013, 23, 78–85. [Google Scholar] [CrossRef]
- Jansen, H.; Jordan, M.; Frey, S.; Hölscher-Doht, S.; Meffert, R.; Heintel, T. Active Controlled Motion in Early Rehabilitation Improves Outcome after Ankle Fractures: A Randomized Controlled Trial. Clin. Rehabil. 2018, 32, 312–318. [Google Scholar] [CrossRef]
- Braun, M.T.; Converse, P.D.; Oswald, F.L. The Accuracy of Dominance Analysis as a Metric to Assess Relative Importance: The Joint Impact of Sampling Error Variance and Measurement Unreliability. J. Appl. Psychol. 2019, 104, 593–602. [Google Scholar] [CrossRef]
- Evans, T.; Hertel, J.; Sebastianelli, W. Bilateral Deficits in Postural Control Following Lateral Ankle Sprain. Foot Ankle Int. 2004, 25, 833–839. [Google Scholar] [CrossRef]
- Fullam, K.; Caulfield, B.; Coughlan, G.F.; Delahunt, E. Kinematic Analysis of Selected Reach Directions of the Star Excursion Balance Test Compared with the Y-Balance Test. J. Sport Rehabil. 2014, 23, 27–35. [Google Scholar] [CrossRef]


| People with Bimalleolar Ankle Fractures (N = 21) | Healthy Control (N = 10) | p-Value | |
|---|---|---|---|
| Mean ± SD | Mean ± SD | ||
| Age | 44.1 ± 11.1 | 39.4 ± 8.8 | >0.05 |
| Gender (% female) | 47.6 | 40 | >0.05 |
| Height (cm) | 168.8 ± 9.2 | 171.8 ± 6.9 | >0.05 |
| Weight (kg) | 77.9 ± 17.0 | 65.4 ± 8.2 | >0.05 |
| Injury mechanism (% low trauma) | 85.5 | ||
| Infrasyndesmal fracture 44A (%) | 4.8 | ||
| Transyndesmal fracture 44B (%) | 66.6 | ||
| Suprasyndesmal fracture 44C (%) | 28.6 | ||
| Most common ORIF employed (%) | 33.3 | ||
| Immobilization time (weeks) | 3.4 ± 1.2 | ||
| Unloading period (weeks) | 6.1 ± 1.3 | ||
| Rehabilitation time (months) | 3.2 ± 2.5 |
| People with Bimalleolar Ankle Fractures (N = 21) | Mean ± SD | Mean Diference ± SD (Lcl–Ucl) | p-Value | |||
|---|---|---|---|---|---|---|
| AOFAS Ankle–Hindfoot | Total score | 6 months | 73.7 ± 11.5 | 10.8 ± 9.3 (6.5; 14.9) | <0.001 | |
| 12 months | 84.4 ± 12.4 | |||||
| Domain pain | 6 months | 28.1 ± 6.8 | 2.0 ± 6.0 (0.7; 4.7) | 0.09 | ||
| 12 months | 30.5 ± 8.0 | |||||
| Domain function | 6 months | 36.1 ± 6.5 | 8.4 ± 4.7 (6.24; 10.5) | <0.001 | ||
| 12 months | 44.4 ± 5.0 | |||||
| Domain alignment | 6 and 12 months | 9.5 ± 1.5 | ||||
| OMAS | Total score | 6 months | 57.0 ± 22.1 | 22.6 ± 13.0 (16.7; 28.5) | <0.001 | |
| 12 months | 80.0 ± 25.0 | |||||
| People with Bimalleolar Ankle Fractures | Healthy Controls | Asymmetry between Limbs | ||||||
|---|---|---|---|---|---|---|---|---|
| People with Bimalleolar Ankle Fractures | Healthy Controls | |||||||
| 6 Months | 12 Months | 6 Months | 12 Months | |||||
| Single leg with open eyes | DISCOP (mm) | |||||||
| Ol | 733.8 ± 326.5 B | 680.6 ± 234.4 | Dl | 571.7 ± 274.0 | 103.8 (0.9; 216.5) | 82.1 (−25.4; 151.7) | 11.0 (−127.4; 150.0) | |
| Non-Ol | 630.7 ± 236.5 C | 762.7 ± 287.4 | Non-Dl | 560.7 ± 250.0 | ||||
| MVCOP (mm/s) | ||||||||
| Ol | 24.4 ± 10.7 | 23.0 ± 7.8 | Dl | 18.5 ± 7.0 | 3.1 (−0.4; 6.7) | 2.4 (−0.8; 5.1) | 0.1 (−0.1; 0.3) | |
| Non-Ol | 21.0 ± 7.4 | 25.4 ± 9.5 | Non-Dl | 17.6 ± 6.7 | ||||
| LFS | ||||||||
| Ol | 1.6 ± 0.7 A | 1.6 ± 0.8 | Dl | 2.3 ± 1.3 | −0.2 (−0.6; 0.4) | −0.1 (−0.6; 0.4) | 0.3 (−1.0; 0.5) | |
| Non-Ol | 1.8 ± 0.8 | 1.5 ± 0.6 | Non-Dl | 2.0 ± 0.7 | ||||
| Tandem position with open eyes | DISCOP (mm) | |||||||
| Ol | 799.2 ± 325.7 A,B | 675.8 ± 289.1 | Dl | 516.3 ± 253.9 | 228.6 (63; 386.0) | 23.5 (−106.1; 153.2) | −13.3 (−190.0; 164.1) | |
| Non-Ol | 570.6 ± 304.9 | 699.3 ± 310.7 | Non-Dl | 529.3 ± 165.9 | ||||
| MVCOP (mm/s) | ||||||||
| Ol | 26.6 ± 27.4 A,B | 22.4 ± 9.6 | Dl | 16.4 ± 5.0 | 7.5 (2.1; 12.8) | 0.1 (−3.5; 5.1) | −1.4 (−5.4: 2.5) | |
| Non-Ol | 19.0 ± 10.0 | 22.3 ± 10.0 | Non-Dl | 17.7 ± 6.3 | ||||
| LFS | ||||||||
| Ol | 1.3 ± 0.5 | 1.2 ± 0.6 | Dl | 1.5 ± 0.9 | −0.02 (−0.4; 0.4) | 0.04 (−0.6; 0.3) | 0.04 (−0.4; 0.5) | |
| Non-Ol | 1.3 ± 0.9 | 1.2 ± 0.7 | Non-Dl | 1.4 ± 0.6 | ||||
| People with Bimalleolar Ankle Fractures * | Healthy Controls | Asymmetry between Limbs | |||||
|---|---|---|---|---|---|---|---|
| People with Bimalleolar Ankle Fractures * | Healthy Controls | ||||||
| 6 Months | 12 Months | 6 Months | 12 Months | ||||
| Normalized reach distance (%) obtained from the anterior direction | |||||||
| Ol | 56.4 ± 13.3 A,B,C | 61.3 ± 10.7 A,B | Dl | 68.0 ± 5.4 | −9.4 (6.0; 12.7) A | −5.6 (2.4; 8.7) A | 1.3 (−5.6; 3.0) |
| Non-Ol | 65.8 ± 12.3 | 66.9 ± 8.4 | Non-Dl | 66.7 ± 8.6 | |||
| Normalized reach distance (%) obtained from the posteromedial direction | |||||||
| Ol | 102.2 ± 14.4 | 104.9 ± 11.7 B | Dl | 110.6 ± 13.3 | −2.9 (−0.4; 6.1) | −2.5 (0.4; 6.1) | −2.2 (−2.1; 6.6) |
| Non-Ol | 105.1 ± 13.5 | 107.3 ± 12.1 | Non-Dl | 112.0 ± 14.1 | |||
| Normalized reach distance (%) obtained from the posterolateral direction | |||||||
| Ol | 99.4 ± 14.8 | 102.2 ± 13.8 | Dl | 111.2 ± 15.5 | −2.9 (−1.7; 7.6) | −2.5 (−2.3; 7.3) | 2.1 (−6.8; 2.5) |
| Non-Ol | 102.3 ± 15.7 | 104.7 ± 11.7 | Non-Dl | 109.1 ± 13.5 | |||
| Composite score normalized reach distance (%) | |||||||
| Ol | 86.6 ± 12.8 A,B | 90.1 ± 11.0 B | Dl | 96.6 ± 11.0 | −4.7 (2.2; 7.3) A | −3.3 (0.8; 5.8) | 0.4 (−3.3; 2.5) |
| Non-Ol | 91.3 ± 12.9 | 93.4 ± 10.0 | Non-Dl | 96.2 ± 11.5 | |||
| Explained Variance (%, Adjusted R2) | ||||||||
|---|---|---|---|---|---|---|---|---|
| 12 Months | Total Variance Explained | Age | Ankle DF ROM | Hip ABD | Hip ADD | Immobilization Time | Unloading Period | |
| 6 Months | 6 Months | 6 Months | ||||||
| YBTA | 63% | Rel. weight CI | 20 (2.4; 44.0) | 17 (2.8; 25.1) | 26 (7.0; 56.0) | |||
| YBTPM | 64% | Rel. weight CI | 40 (16.0; 58.0) | 24 (7.6; 4.3) | ||||
| YBTCS | 60% | Rel. weight CI | 40 (10.0; 63.1) | 20 (1.9; 40.7) | ||||
| AOFAS | 44% | Rel. weight CI | 25 (5.4; 44.4) | 19 (5.3; 29.0) | ||||
| Domain function | 47% | Rel. weight CI | 16 (2.6; 32.8) | 15 (3.5; 28.4) | 16 (5.1; 27.7) | |||
| OMAS | 35% | Rel. weight CI | 18 (1.4; 40.1) | 17 (2.7; 28.1) | ||||
| ADFROM | 55% | Rel. weight CI | 23 (6.9; 42.7) | 32 (13.1; 47.0) | ||||
Publisher’s Note: MDPI stays neutral with regard to jurisdictional claims in published maps and institutional affiliations. |
© 2022 by the authors. Licensee MDPI, Basel, Switzerland. This article is an open access article distributed under the terms and conditions of the Creative Commons Attribution (CC BY) license (https://creativecommons.org/licenses/by/4.0/).
Share and Cite
Salas-Gómez, D.; Fernández-Gorgojo, M.; Sánchez-Juan, P.; Pérez-Núñez, M.I.; Laguna-Bercero, E.; Prat-Luri, A.; Barbado, D. Measuring Recovery and Understanding Long-Term Deficits in Balance, Ankle Mobility and Hip Strength in People after an Open Reduction and Internal Fixation of Bimalleolar Fracture and Their Impact on Functionality: A 12-Month Longitudinal Study. J. Clin. Med. 2022, 11, 2539. https://doi.org/10.3390/jcm11092539
Salas-Gómez D, Fernández-Gorgojo M, Sánchez-Juan P, Pérez-Núñez MI, Laguna-Bercero E, Prat-Luri A, Barbado D. Measuring Recovery and Understanding Long-Term Deficits in Balance, Ankle Mobility and Hip Strength in People after an Open Reduction and Internal Fixation of Bimalleolar Fracture and Their Impact on Functionality: A 12-Month Longitudinal Study. Journal of Clinical Medicine. 2022; 11(9):2539. https://doi.org/10.3390/jcm11092539
Chicago/Turabian StyleSalas-Gómez, Diana, Mario Fernández-Gorgojo, Pascual Sánchez-Juan, María Isabel Pérez-Núñez, Esther Laguna-Bercero, Amaya Prat-Luri, and David Barbado. 2022. "Measuring Recovery and Understanding Long-Term Deficits in Balance, Ankle Mobility and Hip Strength in People after an Open Reduction and Internal Fixation of Bimalleolar Fracture and Their Impact on Functionality: A 12-Month Longitudinal Study" Journal of Clinical Medicine 11, no. 9: 2539. https://doi.org/10.3390/jcm11092539