
Exploration of Risk Factors for Pancreatic Cancer and Development of a Clinical High-Risk Group Rating Scale
 ,
,
Abstract
:1. Introduction
2. Materials and Methods
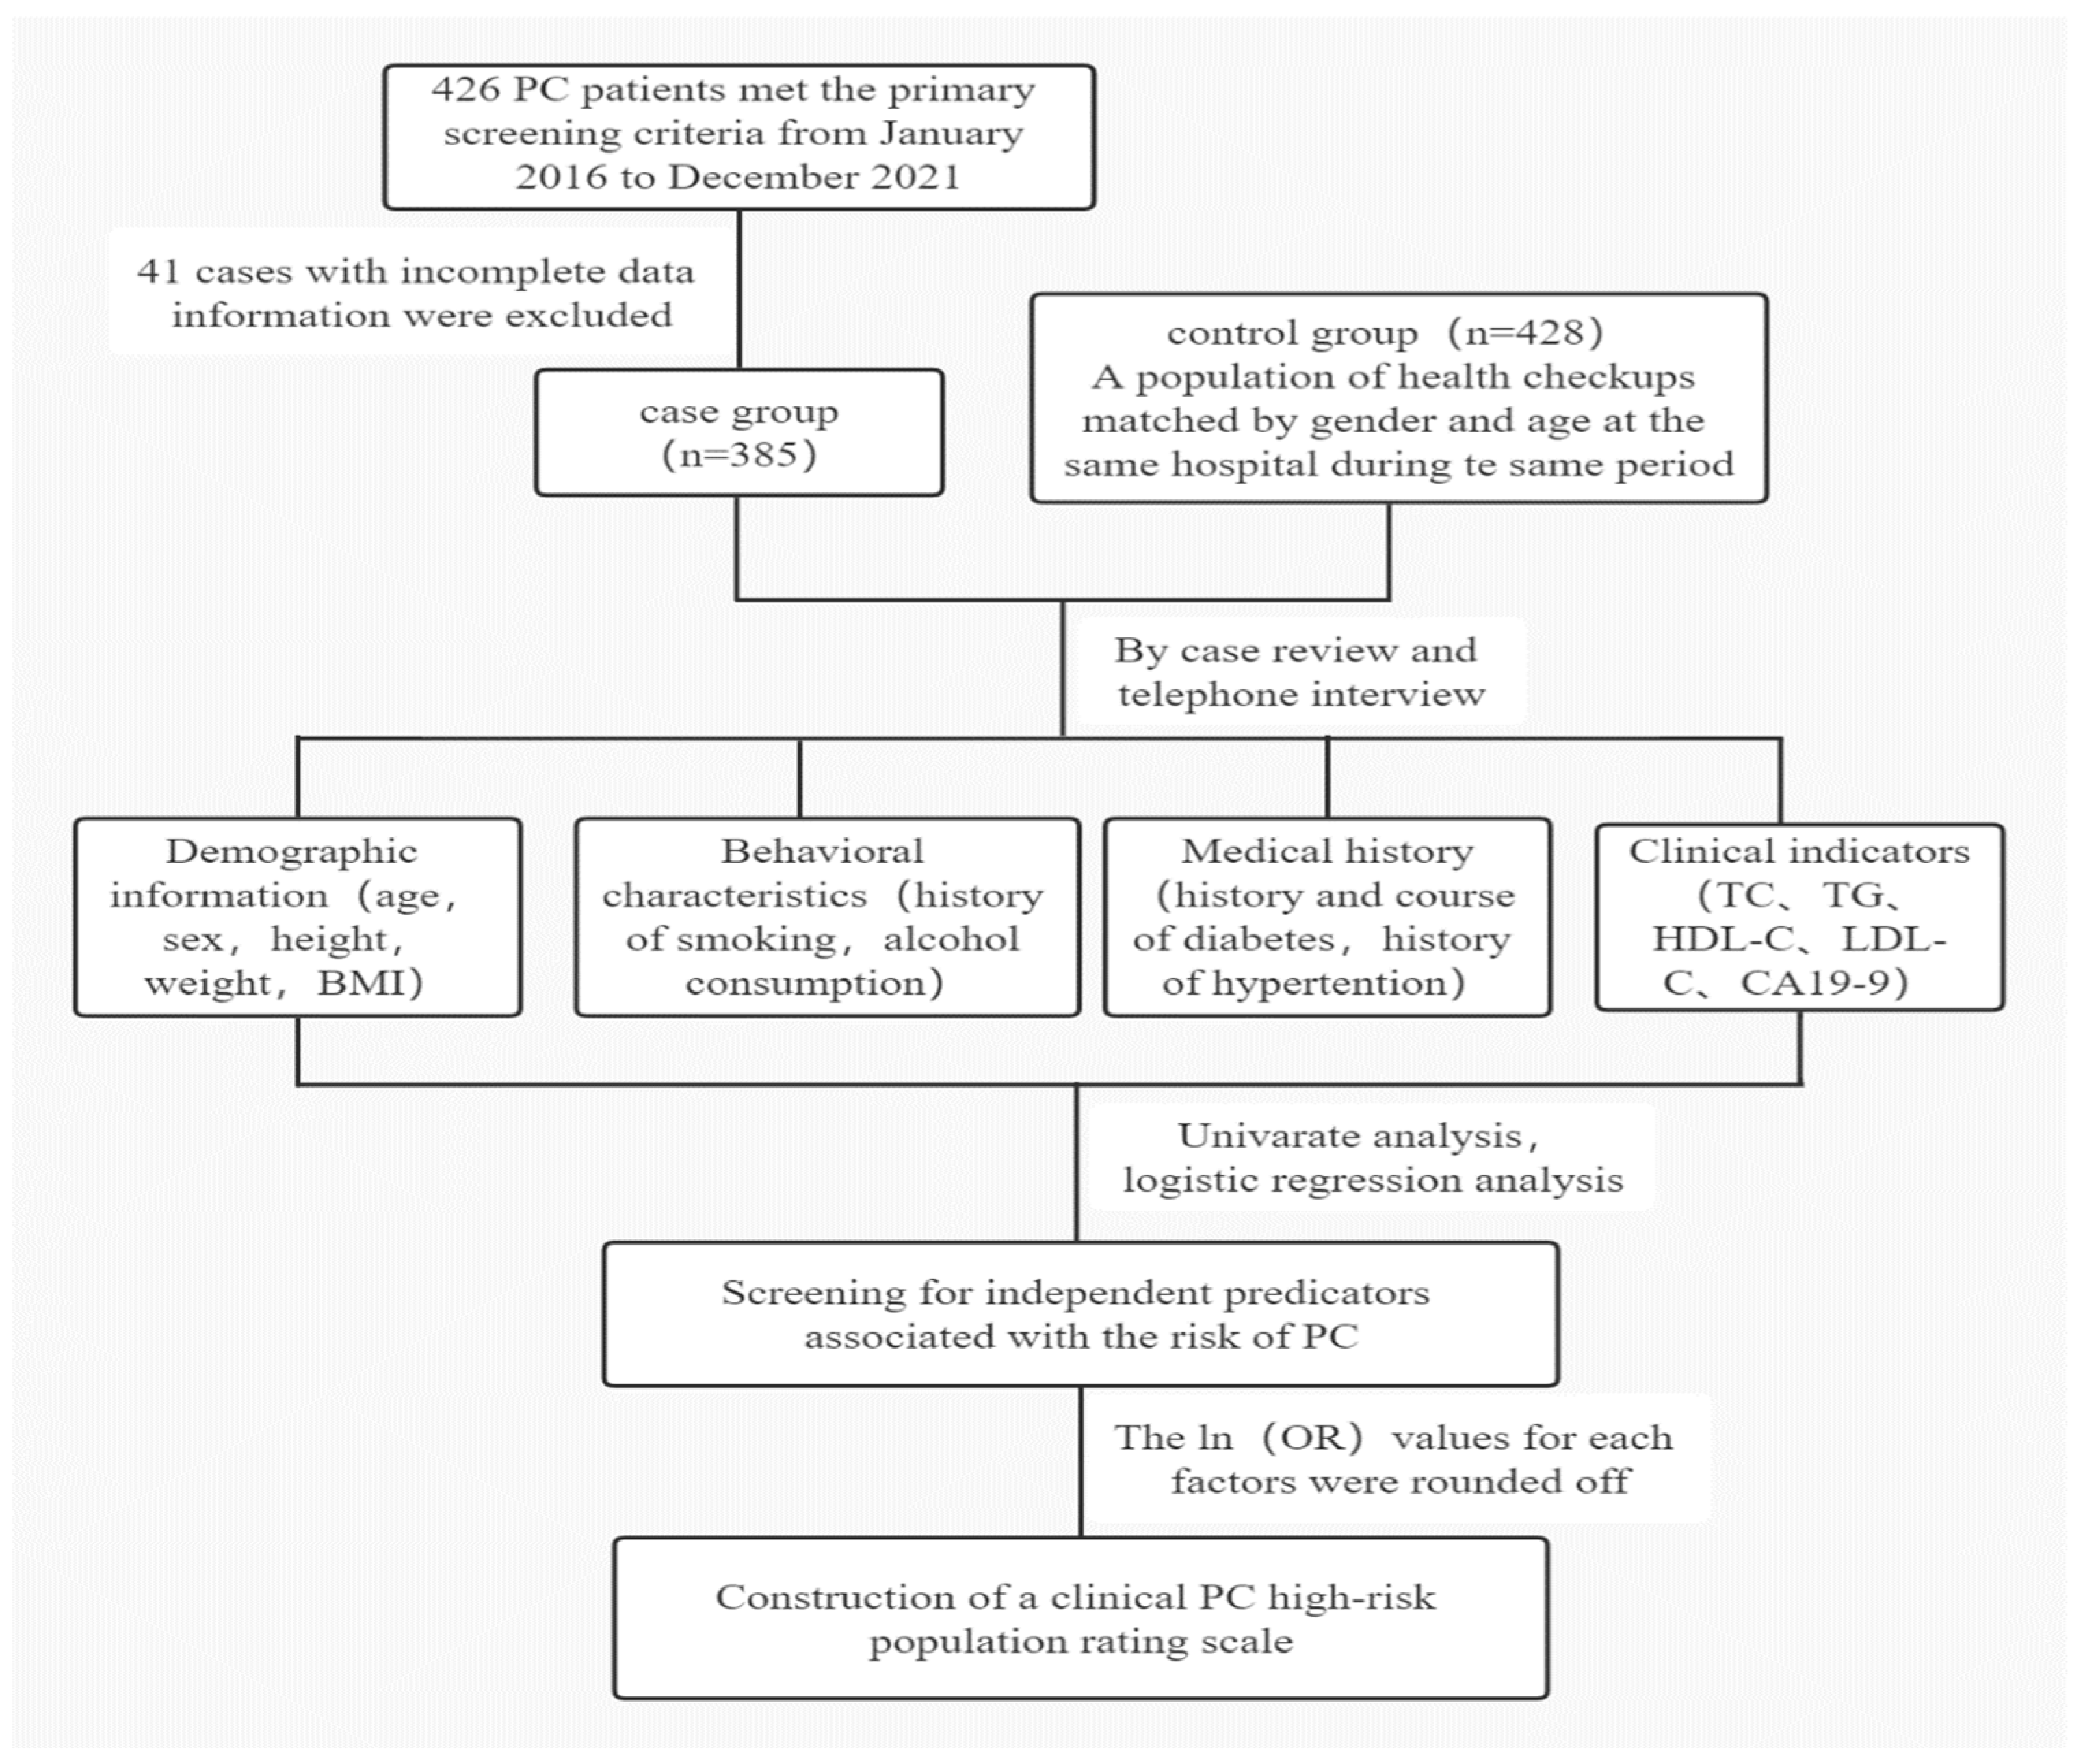
2.1. Study Population
2.2. Study Design
2.3. Variable Definition
2.4. Data Analysis
3. Results
3.1. Basic Information of the Study Subjects
3.2. Univariate Analysis of Risk Factors for PC
3.3. Multi-Factor Analysis of Risk Factors for PC
3.4. Construction of a Clinical PC Screening Score Scale for High-Risk Groups
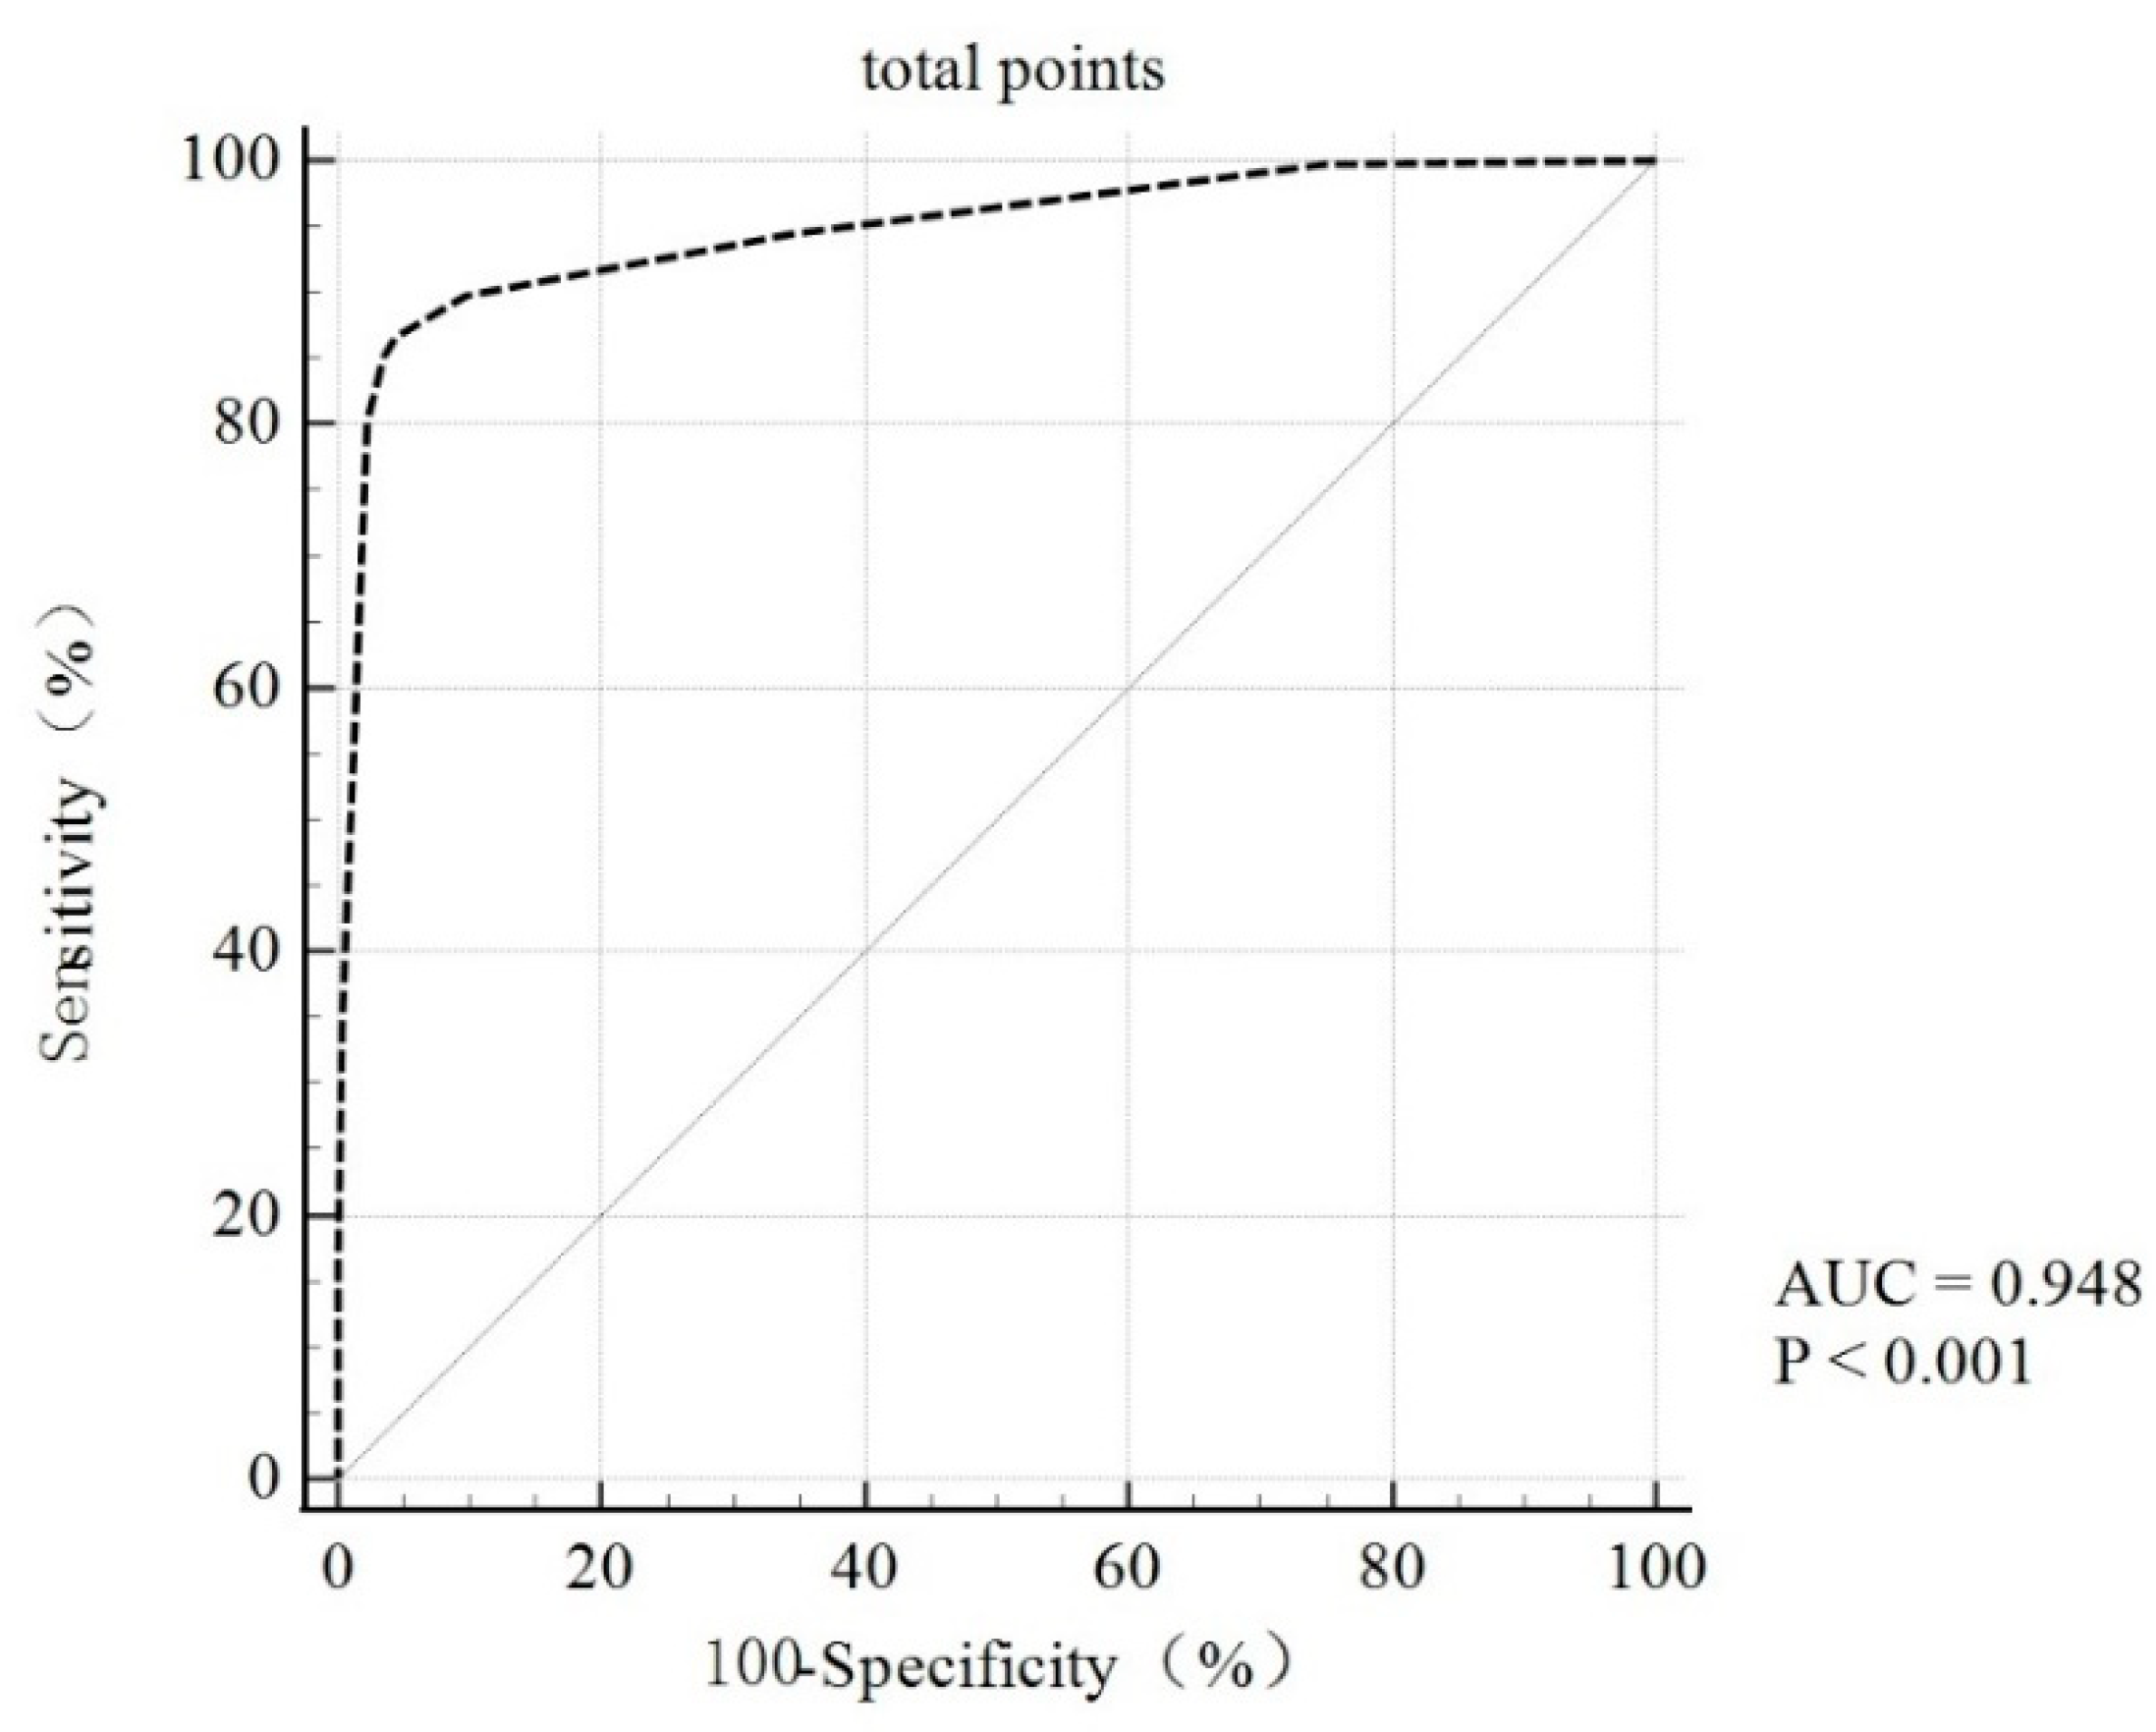
3.5. Validation and Evaluation of the Screening Scoring Criteria for Clinical PC Risk Populations
4. Discussion
5. Conclusions
Author Contributions
Funding
Institutional Review Board Statement
Informed Consent Statement
Data Availability Statement
Acknowledgments
Conflicts of Interest
References
- Cai, J.; Chen, H.; Lu, M.; Zhang, Y.; Lu, B.; You, L.; Zhang, T.; Dai, M.; Zhao, Y. Advances in the epidemiology of pancreatic cancer: Trends, risk factors, screening, and prognosis. Cancer Lett. 2021, 520, 1–11. [Google Scholar] [CrossRef] [PubMed]
- Sung, H.; Ferlay, J.; Siegel, R.L.; Laversanne, M.; Soerjomataram, I.; Jemal, A.; Bray, F. Global Cancer Statistics 2020: GLOBOCAN Estimates of Incidence and Mortality Worldwide for 36 Cancers in 185 Countries. CA Cancer J. Clin. 2021, 71, 209–249. [Google Scholar] [CrossRef] [PubMed]
- Siegel, R.L.; Miller, K.D.; Fuchs, H.E.; Jemal, A. Cancer Statistics, 2021. CA Cancer J. Clin. 2021, 71, 7–33. [Google Scholar] [CrossRef]
- Zhao, C.; Gao, F.; Li, Q.; Liu, Q.; Lin, X. The Distributional Characteristic and Growing Trend of Pancreatic Cancer in China. Pancreas 2019, 48, 309–314. [Google Scholar] [CrossRef] [PubMed]
- Cao, W.; Chen, H.D.; Yu, Y.W.; Li, N.; Chen, W.Q. Changing profiles of cancer burden worldwide and in China: A secondary analysis of the global cancer statistics 2020. Chin. Med J. 2021, 134, 783–791. [Google Scholar] [CrossRef]
- Rawla, P.; Sunkara, T.; Gaduputi, V. Epidemiology of Pancreatic Cancer: Global Trends, Etiology and Risk Factors. World J. Oncol. 2019, 10, 10–27. [Google Scholar] [CrossRef]
- Bond-Smith, G.; Banga, N.; Hammond, T.M.; Imber, C.J. Pancreatic adenocarcinoma. BMJ 2012, 344, e2476. [Google Scholar] [CrossRef]
- Midha, S.; Chawla, S.; Garg, P.K. Modifiable and non-modifiable risk factors for pancreatic cancer: A review. Cancer Lett. 2016, 381, 269–277. [Google Scholar] [CrossRef]
- Lang, J.; Kunovský, L.; Kala, Z.; Trna, J. Risk factors of pancreatic cancer and their possible uses in diagnostics. Neoplasma 2021, 68, 227–239. [Google Scholar] [CrossRef]
- Ye, Y.; Chen, Z.; Shen, Y.; Qin, Y.; Wang, H. Development and validation of a four-lipid metabolism gene signature for diagnosis of pancreatic cancer. FEBS Open Bio 2021, 11, 3153–3170. [Google Scholar] [CrossRef]
- Szlasa, W.; Zendran, I.; Zalesinska, A.; Tarek, M.; Kulbacka, J. Lipid composition of the cancer cell membrane. J. Bioenerg. Biomembr. 2020, 52, 321–342. [Google Scholar] [CrossRef]
- Swierczynski, J.; Hebanowska, A.; Sledzinski, T. Role of abnormal lipid metabolism in development, progression, diagnosis and therapy of pancreatic cancer. World J. Gastroenterol. 2014, 20, 2279–2303. [Google Scholar] [CrossRef] [PubMed]
- Wang, H.; Liu, D.; Liang, H.; Ba, Z.; Ma, Y.; Xu, H.; Wang, J.; Wang, T.; Tian, T.; Yang, J.; et al. A Nomogram for Predicting Survival in Patients With Colorectal Cancer Incorporating Cardiovascular Comorbidities. Front. Cardiovasc. Med. 2022, 9, 875560. [Google Scholar] [CrossRef] [PubMed]
- Zhang, X.; Zhao, X.W.; Liu, D.B.; Han, C.Z.; Du, L.L.; Jing, J.X.; Wang, Y. Lipid levels in serum and cancerous tissues of colorectal cancer patients. World J. Gastroenterol. 2014, 20, 8646–8652. [Google Scholar] [CrossRef] [PubMed]
- Kitahara, C.M.; Berrington de Gonzalez, A.; Freedman, N.D.; Huxley, R.; Mok, Y.; Jee, S.H.; Samet, J.M. Total cholesterol and cancer risk in a large prospective study in Korea. J. Clin. Oncol. 2011, 29, 1592–1598. [Google Scholar] [CrossRef] [Green Version]
- Luo, G.; Jin, K.; Deng, S.; Cheng, H.; Fan, Z.; Gong, Y.; Qian, Y.; Huang, Q.; Ni, Q.; Liu, C.; et al. Roles of CA19-9 in pancreatic cancer: Biomarker, predictor and promoter. Biochim. Biophys. Acta Rev. Cancer 2021, 1875, 188409. [Google Scholar] [CrossRef]
- Luo, G.; Guo, M.; Jin, K.; Liu, Z.; Liu, C.; Cheng, H.; Lu, Y.; Long, J.; Liu, L.; Xu, J.; et al. Optimize CA19-9 in detecting pancreatic cancer by Lewis and Secretor genotyping. Pancreatology 2016, 16, 1057–1062. [Google Scholar] [CrossRef] [Green Version]
- Pannala, R.; Leirness, J.B.; Bamlet, W.R.; Basu, A.; Petersen, G.M.; Chari, S.T. Prevalence and clinical profile of pancreatic cancer-associated diabetes mellitus. Gastroenterology 2008, 134, 981–987. [Google Scholar] [CrossRef] [Green Version]
- Maitra, A.; Sharma, A.; Brand, R.E.; Van Den Eeden, S.K.; Fisher, W.E.; Hart, P.A.; Hughes, S.J.; Mather, K.J.; Pandol, S.J.; Park, W.G.; et al. A Prospective Study to Establish a New-Onset Diabetes Cohort: From the Consortium for the Study of Chronic Pancreatitis, Diabetes, and Pancreatic Cancer. Pancreas 2018, 47, 1244–1248. [Google Scholar] [CrossRef]
- Raggi, A.; Bianchi Marzoli, S.; Ciasca, P.; Cammarata, G.; Melzi, L.; Chiapparini, L.; Erbetta, A.; Ciceri, E.; Farago, G.; Gioppo, A.; et al. The Pre-Lumbar puncture Intracranial Hypertension Scale (PLIHS): A practical scale to identify subjects with normal cerebrospinal fluid pressure in the management of idiopathic intracranial hypertension. J. Neurol. Sci. 2021, 429, 118058. [Google Scholar] [CrossRef]
- Moons, K.G.; E Harrell, F.; Steyerberg, E.W. Should scoring rules be based on odds ratios or regression coefficients? J. Clin. Epidemiology 2002, 55, 1054–1055. [Google Scholar] [CrossRef] [PubMed]
- Al-Hawary, M. Role of Imaging in Diagnosing and Staging Pancreatic Cancer. J. Natl. Compr. Cancer Netw. 2016, 14, 678–680. [Google Scholar] [CrossRef] [PubMed]
- Hu, J.X.; Zhao, C.F.; Chen, W.B.; Liu, Q.C.; Li, Q.W.; Lin, Y.Y.; Gao, F. Pancreatic cancer: A review of epidemiology, trend, and risk factors. World J. Gastroenterol. 2021, 27, 4298–4321. [Google Scholar] [CrossRef] [PubMed]
- Jacobs, E.J.; Newton, C.C.; Patel, A.V.; Stevens, V.L.; Islami, F.; Flanders, W.D.; Gapstur, S.M. The Association Between Body Mass Index and Pancreatic Cancer: Variation by Age at Body Mass Index Assessment. Am. J. Epidemiology 2019, 189, 108–115. [Google Scholar] [CrossRef] [PubMed]
- Arjani, S.; Saint-Maurice, P.F.; Julian-Serrano, S.; Eibl, G.; Stolzenberg-Solomon, R. Body Mass Index Trajectories Across the Adult Life Course and Pancreatic Cancer Risk. JNCI Cancer Spectr. 2022, 6, pkac066. [Google Scholar] [CrossRef] [PubMed]
- Untawale, S.; Odegaard, A.O.; Koh, W.P.; Jin, A.Z.; Yuan, J.M.; Anderson, K.E. Body mass index and risk of pancreatic cancer in a Chinese population. PLoS One 2014, 9, e85149. [Google Scholar] [CrossRef] [Green Version]
- Maisonneuve, P. Epidemiology and burden of pancreatic cancer. Presse Med. 2019, 48, e113–e123. [Google Scholar] [CrossRef]
- Mocci, E.; Kundu, P.; Wheeler, W.; Arslan, A.A.; Beane-Freeman, L.E.; Bracci, P.M.; Brennan, P.; Canzian, F.; Du, M.; Gallinger, S.; et al. Smoking Modifies Pancreatic Cancer Risk Loci on 2q21.3. Cancer Res. 2021, 81, 3134–3143. [Google Scholar] [CrossRef]
- Pizzato, M.; Turati, F.; Rosato, V.; La Vecchia, C. Exploring the link between diabetes and pancreatic cancer. Expert Rev. Anticancer. Ther. 2019, 19, 681–687. [Google Scholar] [CrossRef]
- Pereira, S.P.; Oldfield, L.; Ney, A.; Hart, P.A.; Keane, M.G.; Pandol, S.J.; Li, D.; Greenhalf, W.; Jeon, C.Y.; Koay, E.J.; et al. Early detection of pancreatic cancer. Lancet Gastroenterol. Hepatol. 2020, 5, 698–710. [Google Scholar] [CrossRef]
- Zhang, J.J.; Jia, J.P.; Shao, Q.; Wang, Y.K. Diabetes mellitus and risk of pancreatic cancer in China: A meta-analysis based on 26 case-control studies. Prim. Care Diabetes 2019, 13, 276–282. [Google Scholar] [CrossRef] [PubMed]
- Carreras-Torres, R.; Johansson, M.; Gaborieau, V.; Haycock, P.C.; Wade, K.H.; Relton, C.L.; Martin, R.M.; Davey Smith, G.; Brennan, P. The Role of Obesity, Type 2 Diabetes, and Metabolic Factors in Pancreatic Cancer: A Mendelian Randomization Study. Gynecol. Oncol. 2017, 109, djx012. [Google Scholar] [CrossRef] [PubMed] [Green Version]
- Kuzmickiene, I.; Everatt, R.; Virviciute, D.; Tamosiunas, A.; Radisauskas, R.; Reklaitiene, R.; Milinaviciene, E. Smoking and other risk factors for pancreatic cancer: A cohort study in men in Lithuania. Cancer Epidemiol. 2013, 37, 133–139. [Google Scholar] [CrossRef] [PubMed]
- Wang, F.; Huang, L.; Zhang, J.; Fan, J.; Wu, H.; Xu, J. Dyslipidemia in Chinese Pancreatic Cancer Patients: A Two-Center Retrospective Study. J. Cancer 2021, 12, 5338–5344. [Google Scholar] [CrossRef]
- Strohmaier, S.; Edlinger, M.; Manjer, J.; Stocks, T.; Bjorge, T.; Borena, W.; Haggstrom, C.; Engeland, A.; Nagel, G.; Almquist, M.; et al. Total serum cholesterol and cancer incidence in the Metabolic syndrome and Cancer Project (Me-Can). PLoS One 2013, 8, e54242. [Google Scholar] [CrossRef] [PubMed] [Green Version]
- Bo, X.; Shi, J.; Liu, R.; Geng, S.; Li, Q.; Li, Y.; Jin, H.; Yang, S.; Jiang, H.; Wang, Z. Using the Risk Factors of Pancreatic Cancer and Their Interactions in Cancer Screening: A Case-Control Study in Shanghai, China. Ann. Glob. Heal. 2019, 85, 103. [Google Scholar] [CrossRef]
- Qu, F.; Chen, R.; Peng, Y.; Ye, Y.; Tang, Z.; Wang, Y.; Zong, B.; Yu, H.; Liu, S. Assessment of the Predictive Role of Serum Lipid Profiles in Breast Cancer Patients Receiving Neoadjuvant Chemotherapy. J. Breast Cancer 2020, 23, 246–258. [Google Scholar] [CrossRef]
- Patel, K.K.; Kashfi, K. Lipoproteins and cancer: The role of HDL-C, LDL-C, and cholesterol-lowering drugs. Biochem. Pharmacol. 2022, 196, 114654. [Google Scholar] [CrossRef]
- Scara, S.; Bottoni, P.; Scatena, R. CA 19-9: Biochemical and Clinical Aspects. Adv. Exp. Med. Biol. 2015, 867, 247–260. [Google Scholar] [CrossRef] [PubMed]
- Yang, M.; Zhang, C.Y. Diagnostic biomarkers for pancreatic cancer: An update. World J. Gastroenterol. 2021, 27, 7862–7865. [Google Scholar] [CrossRef]
- Yang, J.; Xu, R.; Wang, C.; Qiu, J.; Ren, B.; You, L. Early screening and diagnosis strategies of pancreatic cancer: A comprehensive review. Cancer Commun. 2021, 41, 1257–1274. [Google Scholar] [CrossRef] [PubMed]
 represents the composition ratio of the control group at the same score. The total score was 12 points.
represents the composition ratio of the control group at the same score. The total score was 12 points.
represents the composition ratio of the control group at the same score. The total score was 12 points.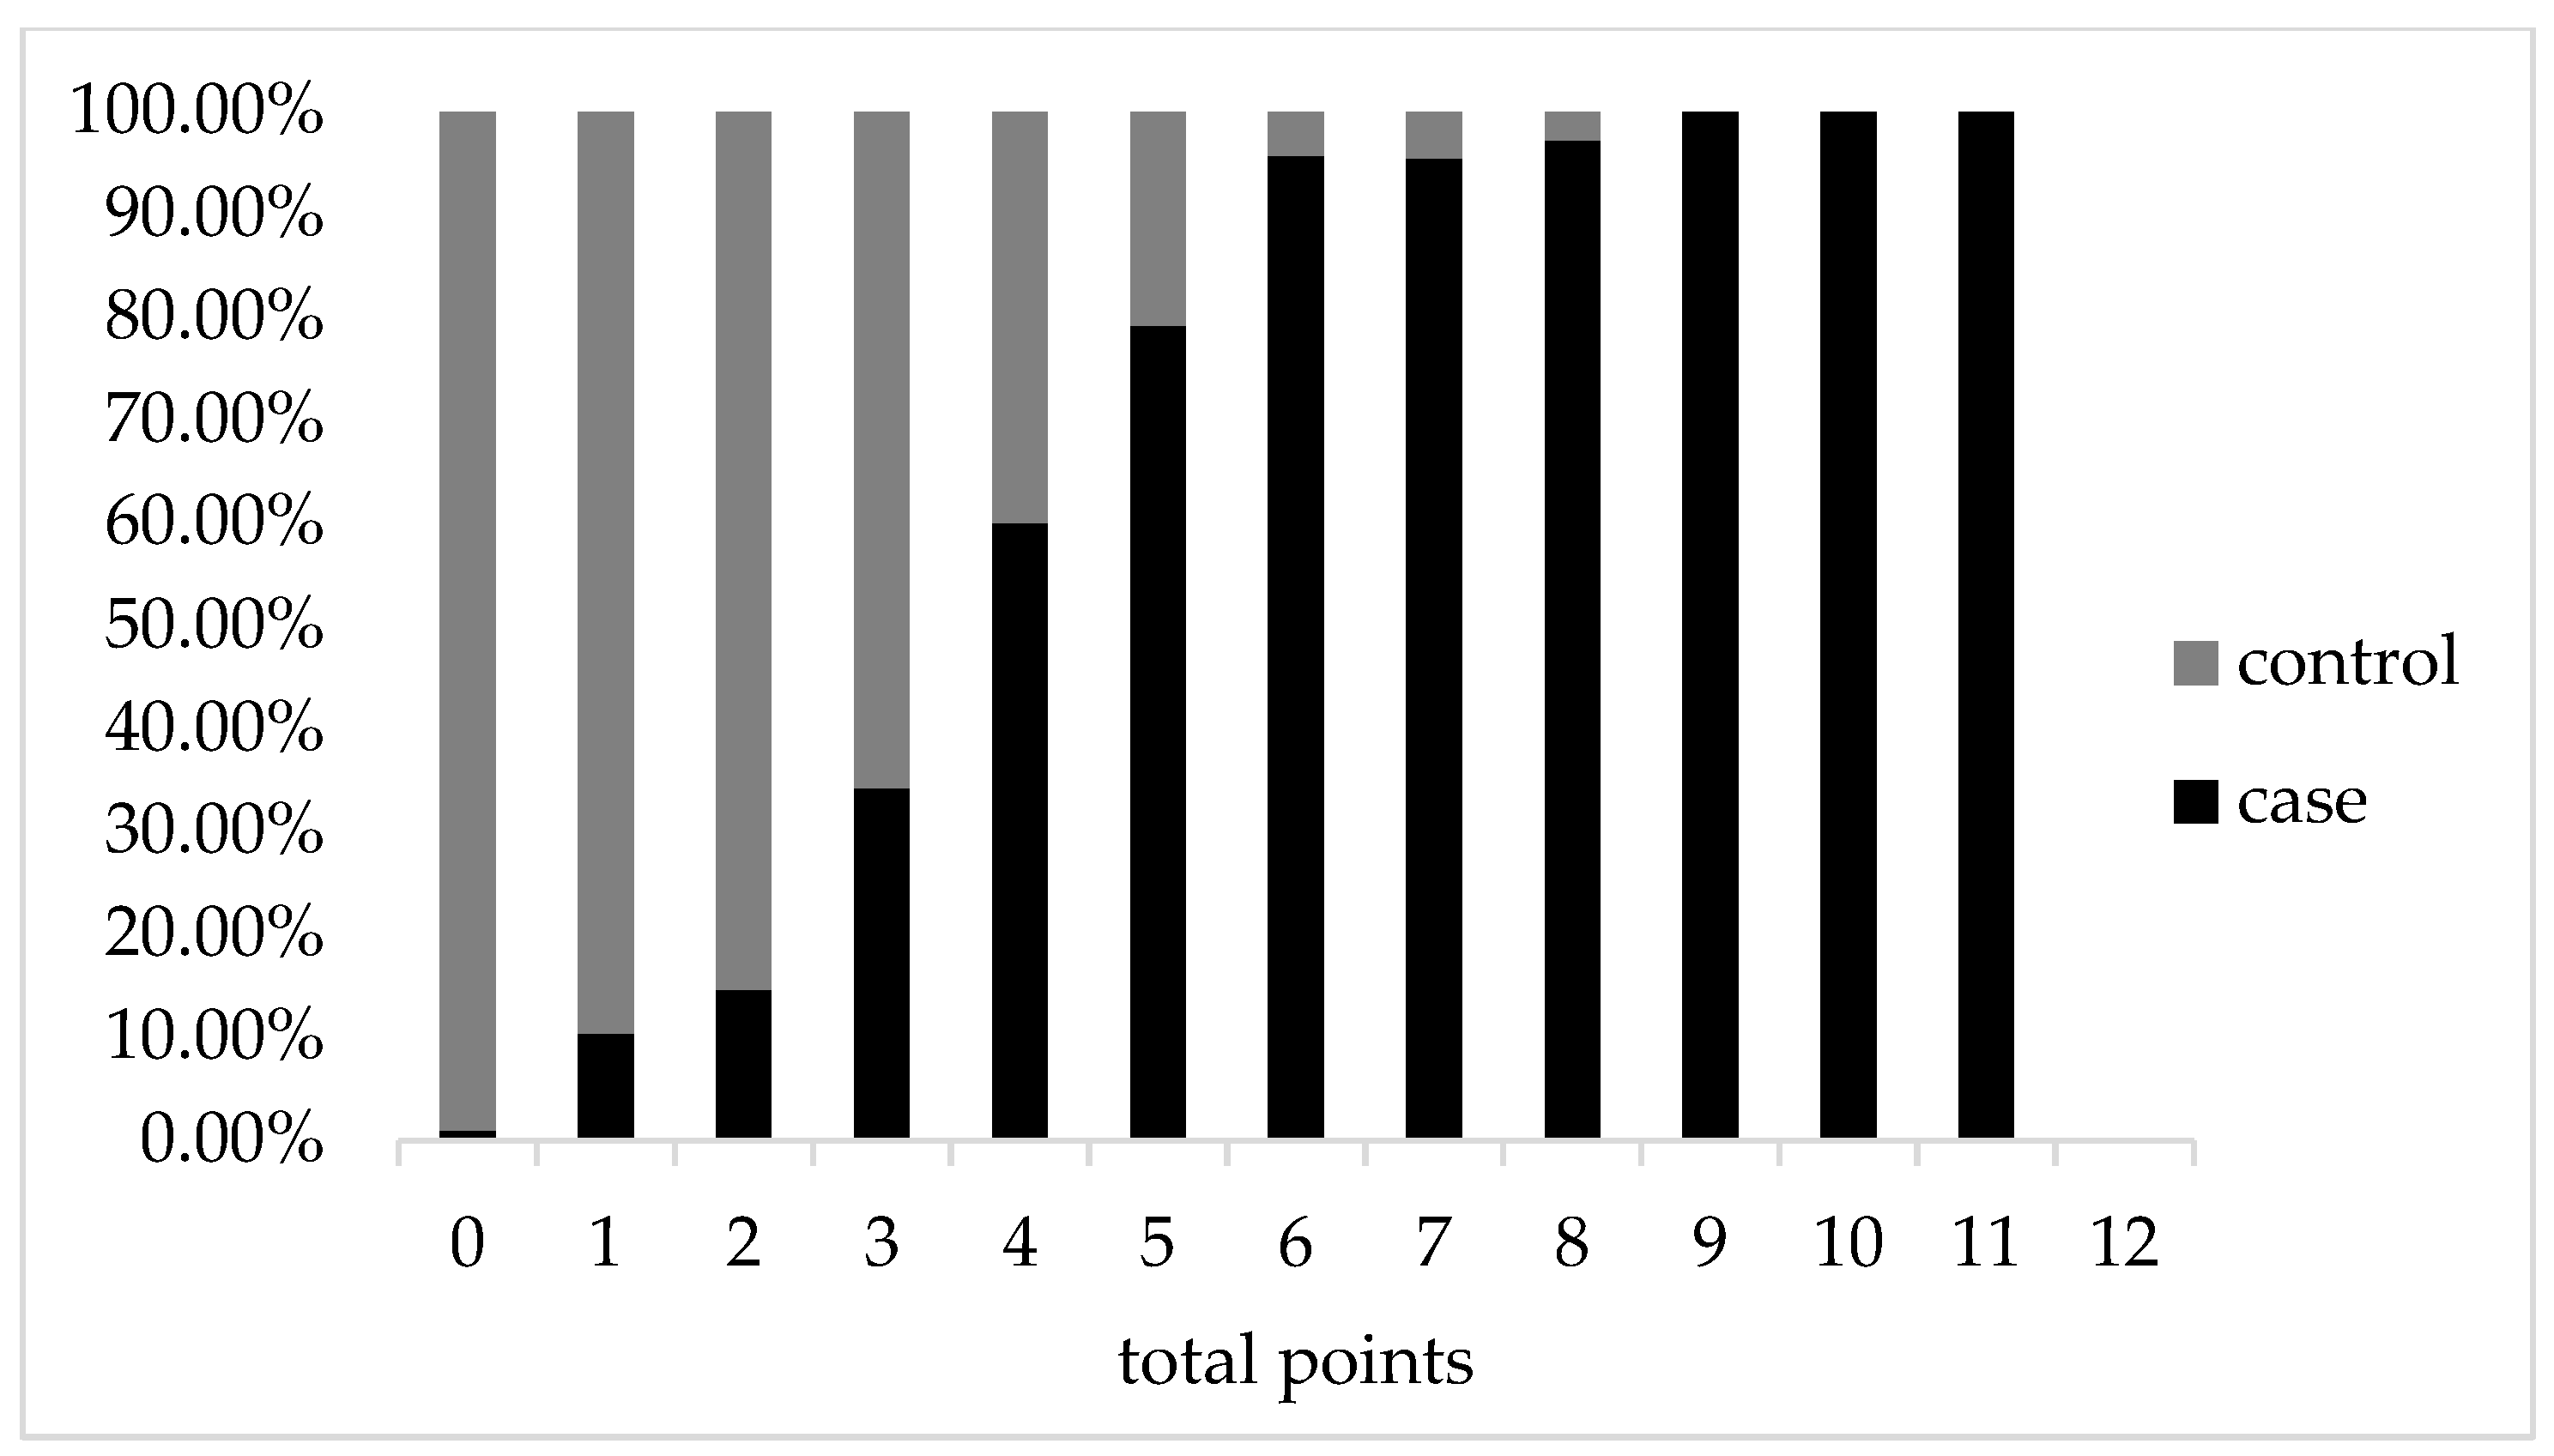

| Variables | Case (n = 385) | Control (n = 428) | t/Z/χ2 | p Value |
|---|---|---|---|---|
| Age, y | 64.75 ± 10.65 | 64.28 ± 10.65 | T = 0.622 | 0.534 |
| Sex [n, (%)] | χ2 = 0.511 | 0.475 | ||
| Male | 260(67.5) | 299(69.9) | ||
| Female | 125(32.5) | 129(30.1) | ||
| Smoking history [n, (%)] | χ2 = 29.559 | <0.001 *** | ||
| Yes | 137(35.6) | 80(18.7) | ||
| No | 248(64.4) | 348(81.3) | ||
| Drinking history [n, (%)] | χ2 = 2.645 | 0.104 | ||
| Yes | 82(21.3) | 72(16.8) | ||
| No | 303(78.7) | 356(83.2) | ||
| Status of diabetes [n, (%)] | χ2 = 38.026 | <0.001 *** | ||
| No diabetes | 279(72.5) | 364(85.0) | ||
| New-onset diabetes | 62(16.1) | 15(3.5) | ||
| Long-term diabetes | 44(11.4) | 49(11.4) | ||
| History of hypertension [n, (%)] | χ2 = 0.394 | 0.530 | ||
| Yes | 126(32.7) | 149(34.8) | ||
| No | 259(67.3) | 279(65.2) | ||
| BMI (kg/m2) | 21.75 ± 3.24 | 25.36 ± 3.23 | T = −15.912 | <0.001 *** |
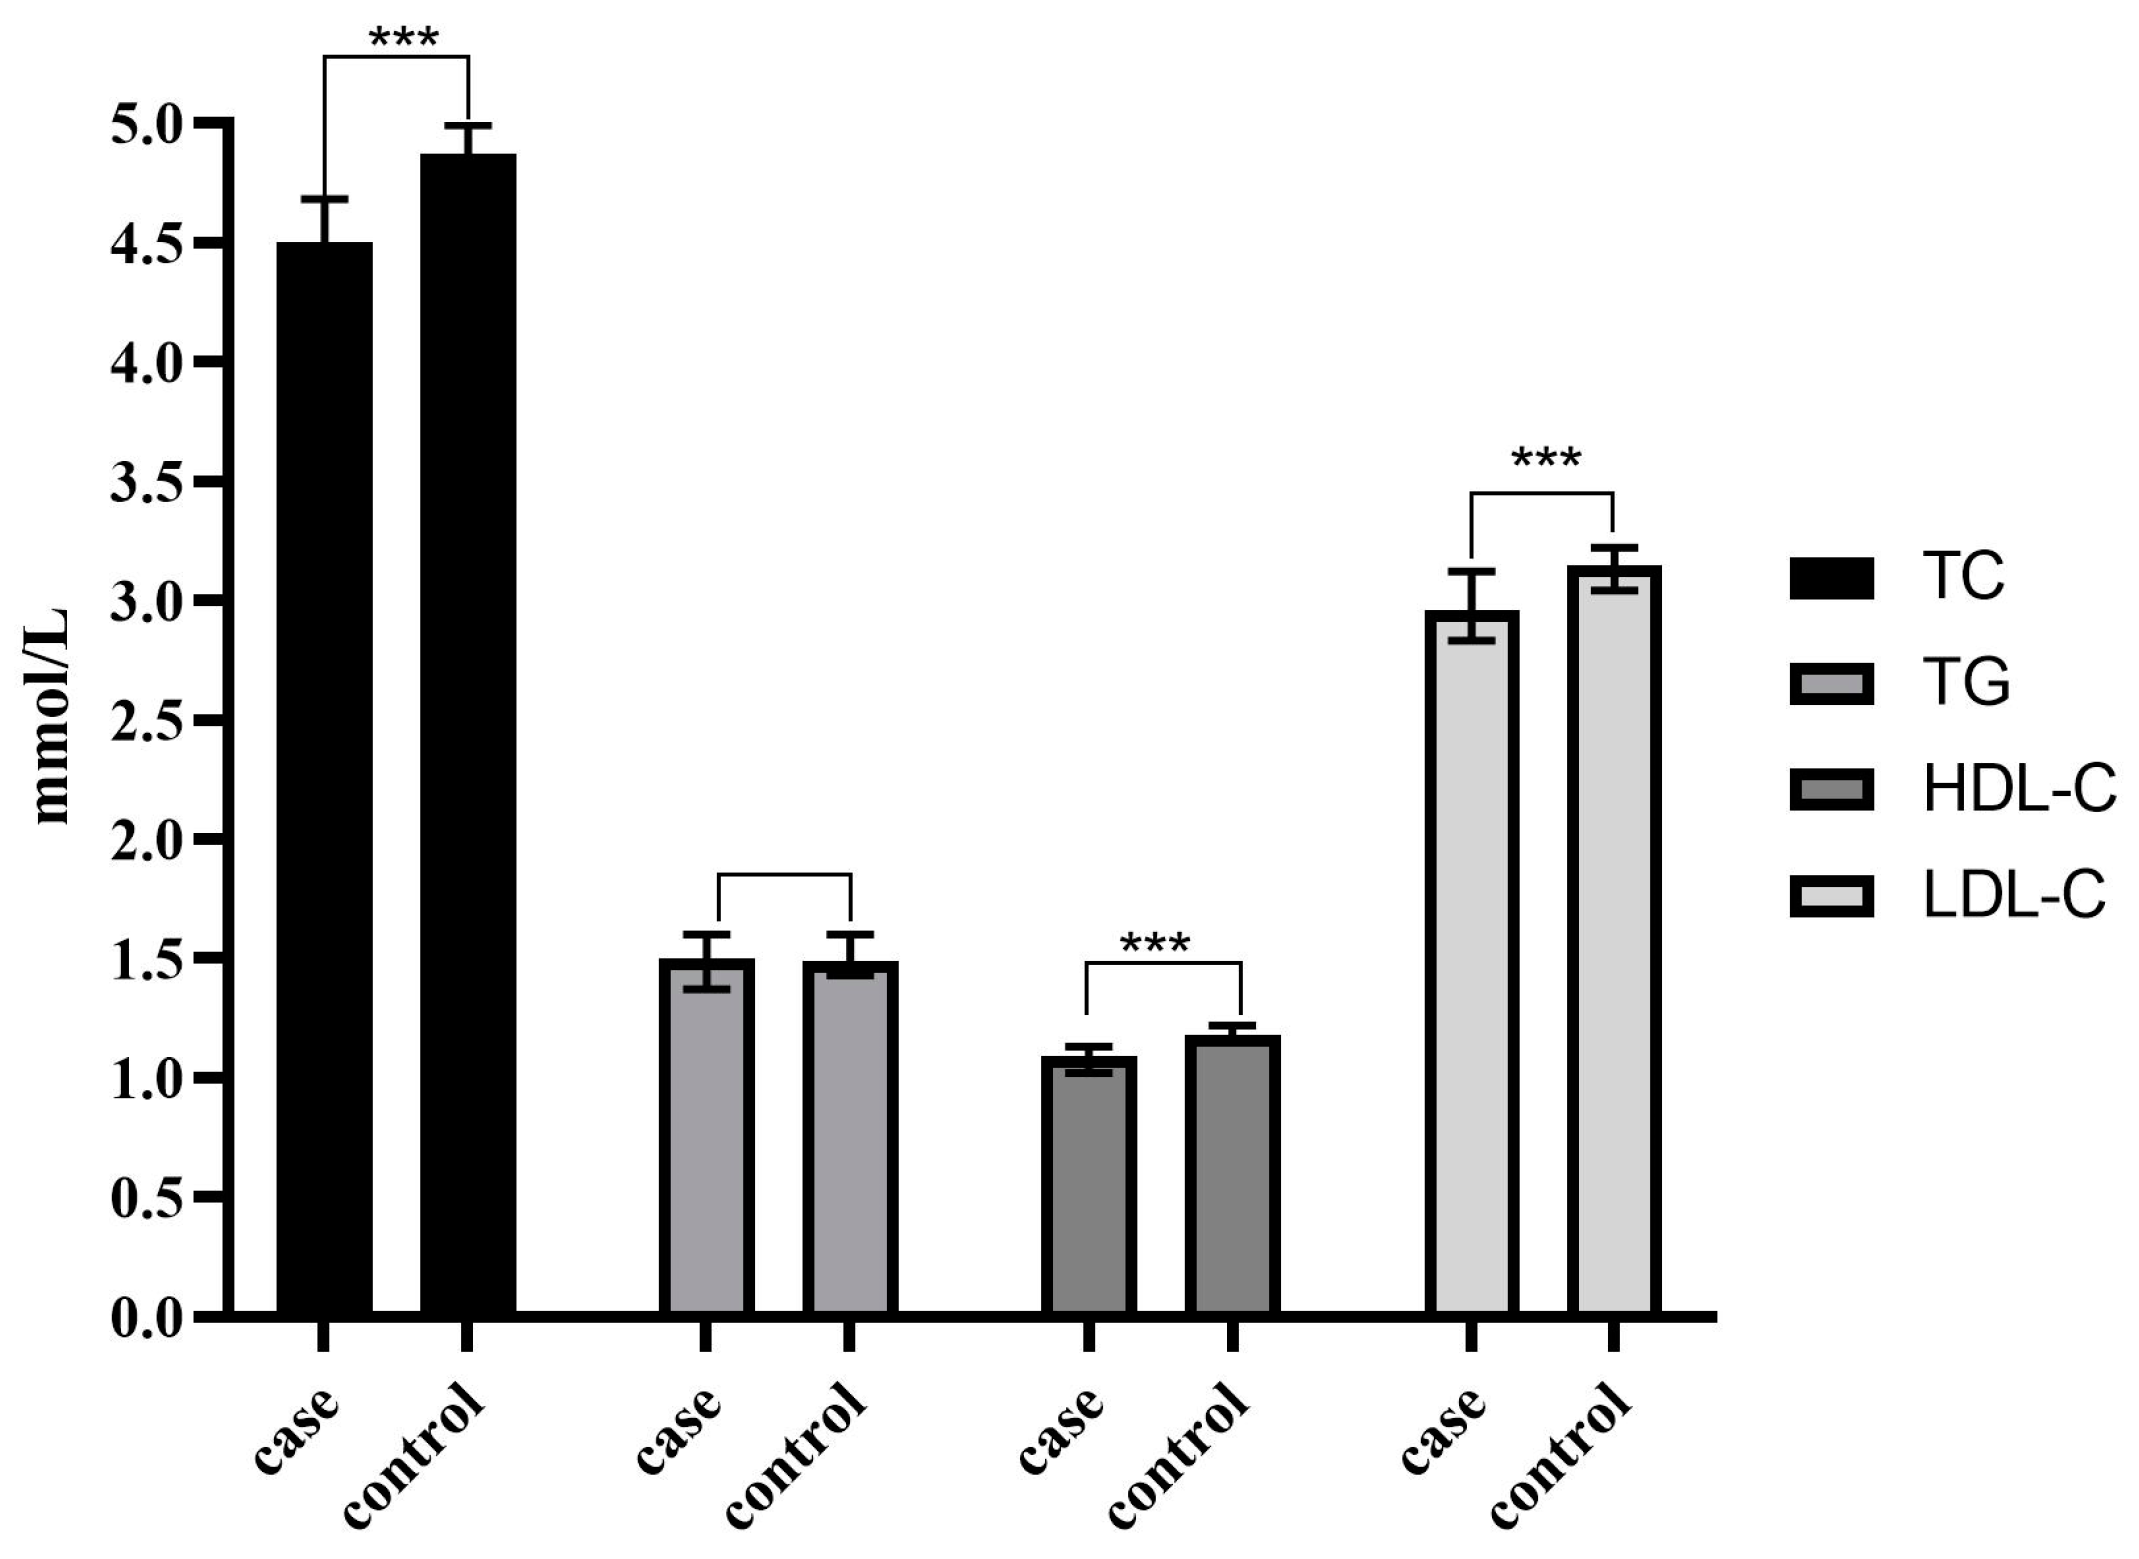
| TC (mmol/L) | 4.50(3.56~4.75) | 4.87(4.15~5.58) | Z = −7.870 | <0.001 *** |
| TG (mmol/L) | 1.50(1.04~1.71) | 1.49(1.09~2.04) | Z = −1.806 | 0.071 |
| HDL-C(mmol/L) | 1.09(0.82~1.14) | 1.18(1.04~1.39) | Z = −9.260 | <0.001 *** |
| LDL-C(mmol/L) | 2.96(2.24~3.16) | 3.15(2.64~3.71) | Z = −5.975 | <0.001 *** |
| CA19-9(U/mL) | 235.17 (62.3~1026.10) | 5.61 (3.50~9.00) | Z = −20.724 | <0.001 *** |
| Variables | Case (n = 385) | Control (n = 428) | t/χ2 | p Value |
|---|---|---|---|---|
| BMI [n, (%)] | χ2 = 52.151 | <0.001 *** | ||
| <18.5 | 60(15.6) | 7(1.6) | ||
| ≥18.5 | 325(84.4) | 421(98.4) | ||
| Smoking history [n, (%)] | χ2 = 29.559 | <0.001 *** | ||
| Yes | 137(35.6) | 80(18.7) | ||
| No | 248(64.4) | 348(81.3) | ||
| Drinking history [n, (%)] | χ2 = 2.645 | 0.104 | ||
| Yes | 82(21.3) | 72(16.8) | ||
| No | 303(78.7) | 356(83.2) | ||
| Status of diabetes [n, (%)] | χ2 = 38.026 | <0.001 *** | ||
| No diabetes | 279(72.5) | 364(85.0) | ||
| New-onset diabetes | 62(16.1) | 15(3.5) | ||
| Long-term diabetes | 44(11.4) | 49(11.4) | ||
| History of hypertension [n, (%)] | χ2 = 0.394 | 0.530 | ||
| Yes | 126(32.7) | 149(34.8) | ||
| No | 259(67.3) | 279(65.2) | ||
| TC [n, (%)] | χ2 = 52.069 | <0.001 *** | ||
| <5.2 mmol/L | 324(84.2) | 263(61.4) | ||
| ≥5.2 mmol/L | 61(15.8) | 165(38.6) | ||
| TG [n, (%)] | χ2 = 0.030 | 0.864 | ||
| <1.70 mmol/L | 228(59.2) | 256(59.8) | ||
| ≥1.70 mmol/L | 157(40.8) | 172(40.2) | ||
| HDL-C [n, (%)] | χ2 = 37.378 | <0.001 *** | ||
| >1.04 mmol/L | 208(54.0) | 319(74.5) | ||
| ≤1.04 mmol/L | 177(46.0) | 109(25.5) | ||
| LDL-C [n, (%)] | χ2 = 38.752 | <0.001 *** | ||
| <3.40 mmol/L | 316(82.1) | 267(62.4) | ||
| ≥3.40 mmol/L | 69(17.9) | 161(37.6) | ||
| CA19-9 [n, (%)] | χ2 = 552.587 | <0.001 *** | ||
| <35 U/ml | 60(15.6) | 415(97.0) | ||
| ≥35 U/ml | 325(84.4) | 13(3.0) |
| Variables | β | S. E | Wald χ2 | p Values | OR (95%CI) |
|---|---|---|---|---|---|
| BMI < 18.5 kg/m2 | |||||
| No | 1 | ||||
| Yes | 1.782 | 0.621 | 8.232 | 0.004 ** | 5.944(1.759~20.084) |
| Smoking history | |||||
| No | 1 | ||||
| Yes | 1.010 | 0.290 | 12.141 | <0.001 *** | 2.745(1.555~4.844) |
| High TC levels | |||||
| No | 1 | ||||
| Yes | −0.936 | 0.317 | 8.737 | 0.003 ** | 0.392(0.211~0.730) |
| Low HDL-C levels | 1 | ||||
| No | 1 | ||||
| Yes | 0.582 | 0.275 | 4.476 | 0.034 * | 1.790(1.044~3.069) |
| Status of diabetes | 12.500 | 0.002 ** | |||
| No diabetes ↑ | 1 | ||||
| New-onset diabetes | 1.656 | 0.469 | 12.493 | <0.001 *** | 5.239(2.091~13.125) |
| Long-term diabetes | 0.204 | 0.406 | 0.252 | 0.615 | 1.226(0.554~2.716) |
| CA19-9 ≥ 35 U/ml | |||||
| No | 1 | ||||
| Yes | 5.077 | 0.334 | 231.756 | <0.001 *** | 160.328(83.392~308.243) |
| Constant term | −2.401 | 0.235 | 104.013 | <0.001 |
| Variables | OR (95%CI) | p Values | ln (OR) | Scores |
|---|---|---|---|---|
| BMI < 18.5 kg/m2 | 0.004 ** | |||
| Yes | 5.944(1.759~20.084) | 1.782 | 2 | |
| No | 1 | 0 | ||
| Smoking history | <0.001 *** | |||
| Yes | 2.745(1.555~4.844) | 1.013 | 1 | |
| No | 1 | 0 | ||
| High TC levels | 0.003 ** | |||
| Yes | 0.392(0.211~0.730) | −0.936 | 0 | |
| No | 1 | |||
| Low HDL-C levels | 0.034 * | |||
| Yes | 1.790(1.044~3.069) | 0.582 | 1 | |
| No | 0 | |||
| CA19-9 ≥ 35 U/mL | <0.001 *** | |||
| Yes | 160.328(83.392~308.243) | 5.077 | 5 | |
| No | 0 | |||
| Status of diabetes | 0.002 ** | |||
| No diabetes | 0 | |||
| New-onset diabetes | 5.239(2.091~13.125) | <0.001 *** | 1.656 | 2 |
| Long-term diabetes | 1.226(0.554~2.716) | 0.615 | 0 |
Disclaimer/Publisher’s Note: The statements, opinions and data contained in all publications are solely those of the individual author(s) and contributor(s) and not of MDPI and/or the editor(s). MDPI and/or the editor(s) disclaim responsibility for any injury to people or property resulting from any ideas, methods, instructions or products referred to in the content. |
© 2023 by the authors. Licensee MDPI, Basel, Switzerland. This article is an open access article distributed under the terms and conditions of the Creative Commons Attribution (CC BY) license (https://creativecommons.org/licenses/by/4.0/).
Share and Cite
Zhao, Q.; Wang, Y.; Huo, T.; Li, F.; Zhou, L.; Feng, Y.; Wei, Z. Exploration of Risk Factors for Pancreatic Cancer and Development of a Clinical High-Risk Group Rating Scale. J. Clin. Med. 2023, 12, 358. https://doi.org/10.3390/jcm12010358
Zhao Q, Wang Y, Huo T, Li F, Zhou L, Feng Y, Wei Z. Exploration of Risk Factors for Pancreatic Cancer and Development of a Clinical High-Risk Group Rating Scale. Journal of Clinical Medicine. 2023; 12(1):358. https://doi.org/10.3390/jcm12010358
Chicago/Turabian StyleZhao, Qian, Yan Wang, Tianyu Huo, Furong Li, Lu Zhou, Yongliang Feng, and Zhigang Wei. 2023. "Exploration of Risk Factors for Pancreatic Cancer and Development of a Clinical High-Risk Group Rating Scale" Journal of Clinical Medicine 12, no. 1: 358. https://doi.org/10.3390/jcm12010358