
Donor-Specific Cell-Free DNA qPCR Quantification as a Noninvasive Accurate Biomarker for Early Rejection Detection in Liver Transplantation
 ,
,
Abstract
:1. Introduction
2. Materials and Methods
2.1. Study Subjects
2.2. Patient Surveillance and Treatment
2.3. Ethics Statement
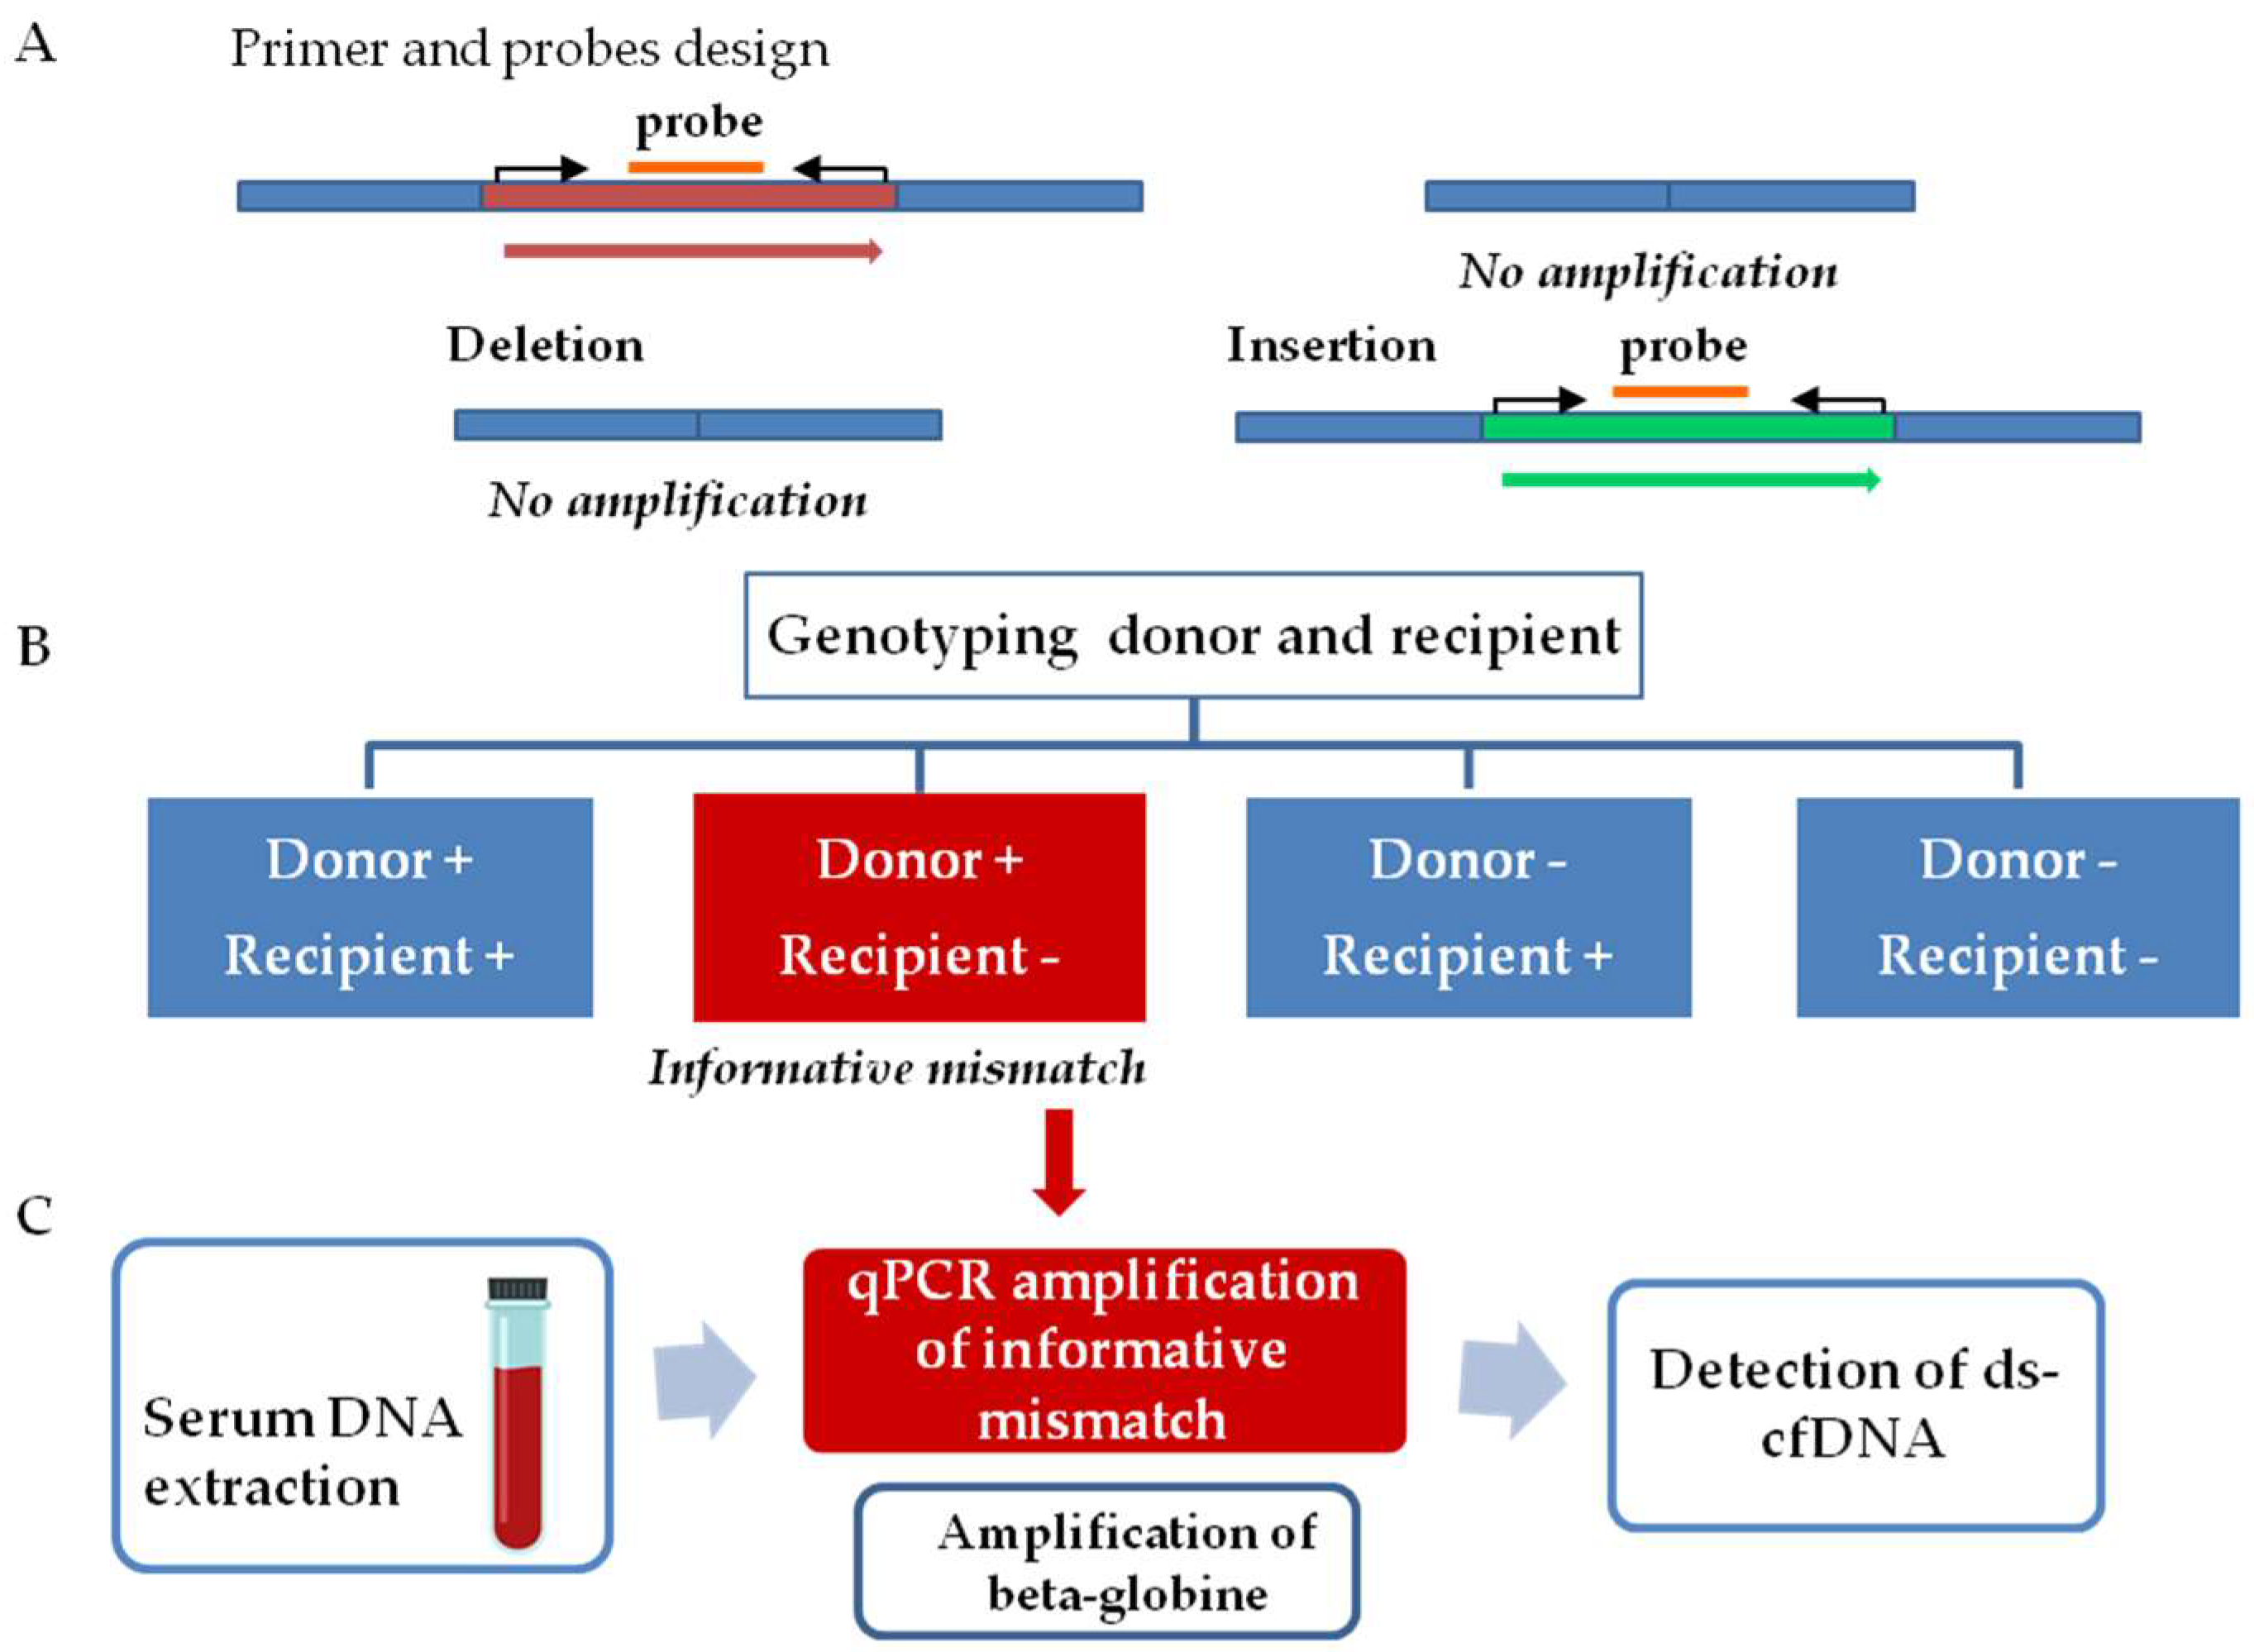
2.4. General Workflow
2.5. DNA Extraction from Tissue and Serum Samples
2.6. Determination of Donor–Recipient Mismatch and Monitoring Organ Specific cfDNA
2.7. Statistical Analysis
3. Results
3.1. Characteristic of the Patients
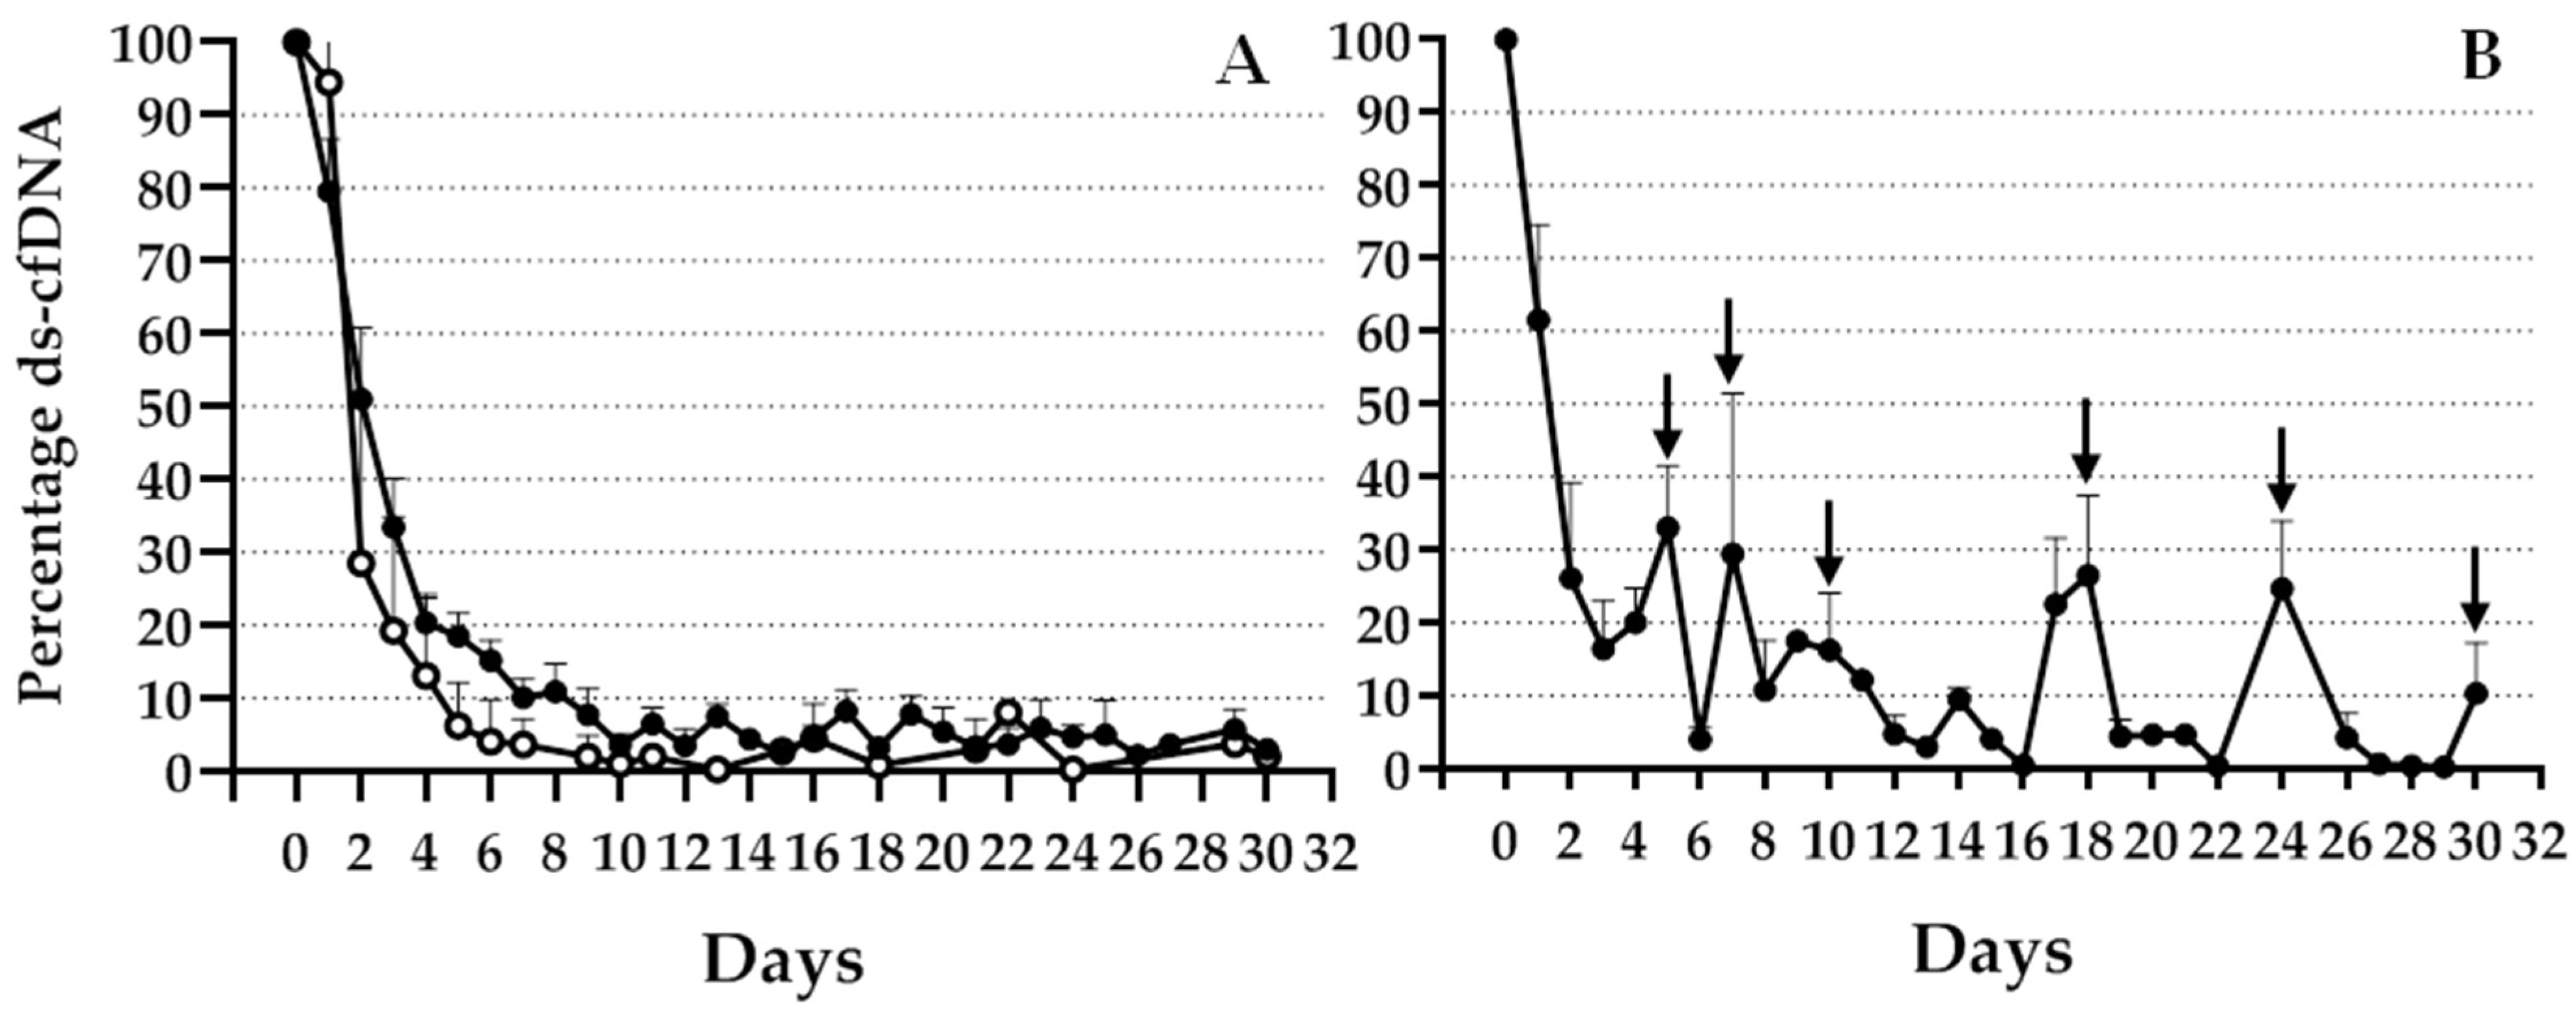
3.2. Graft cfDNA Monitoring during One Month after TX
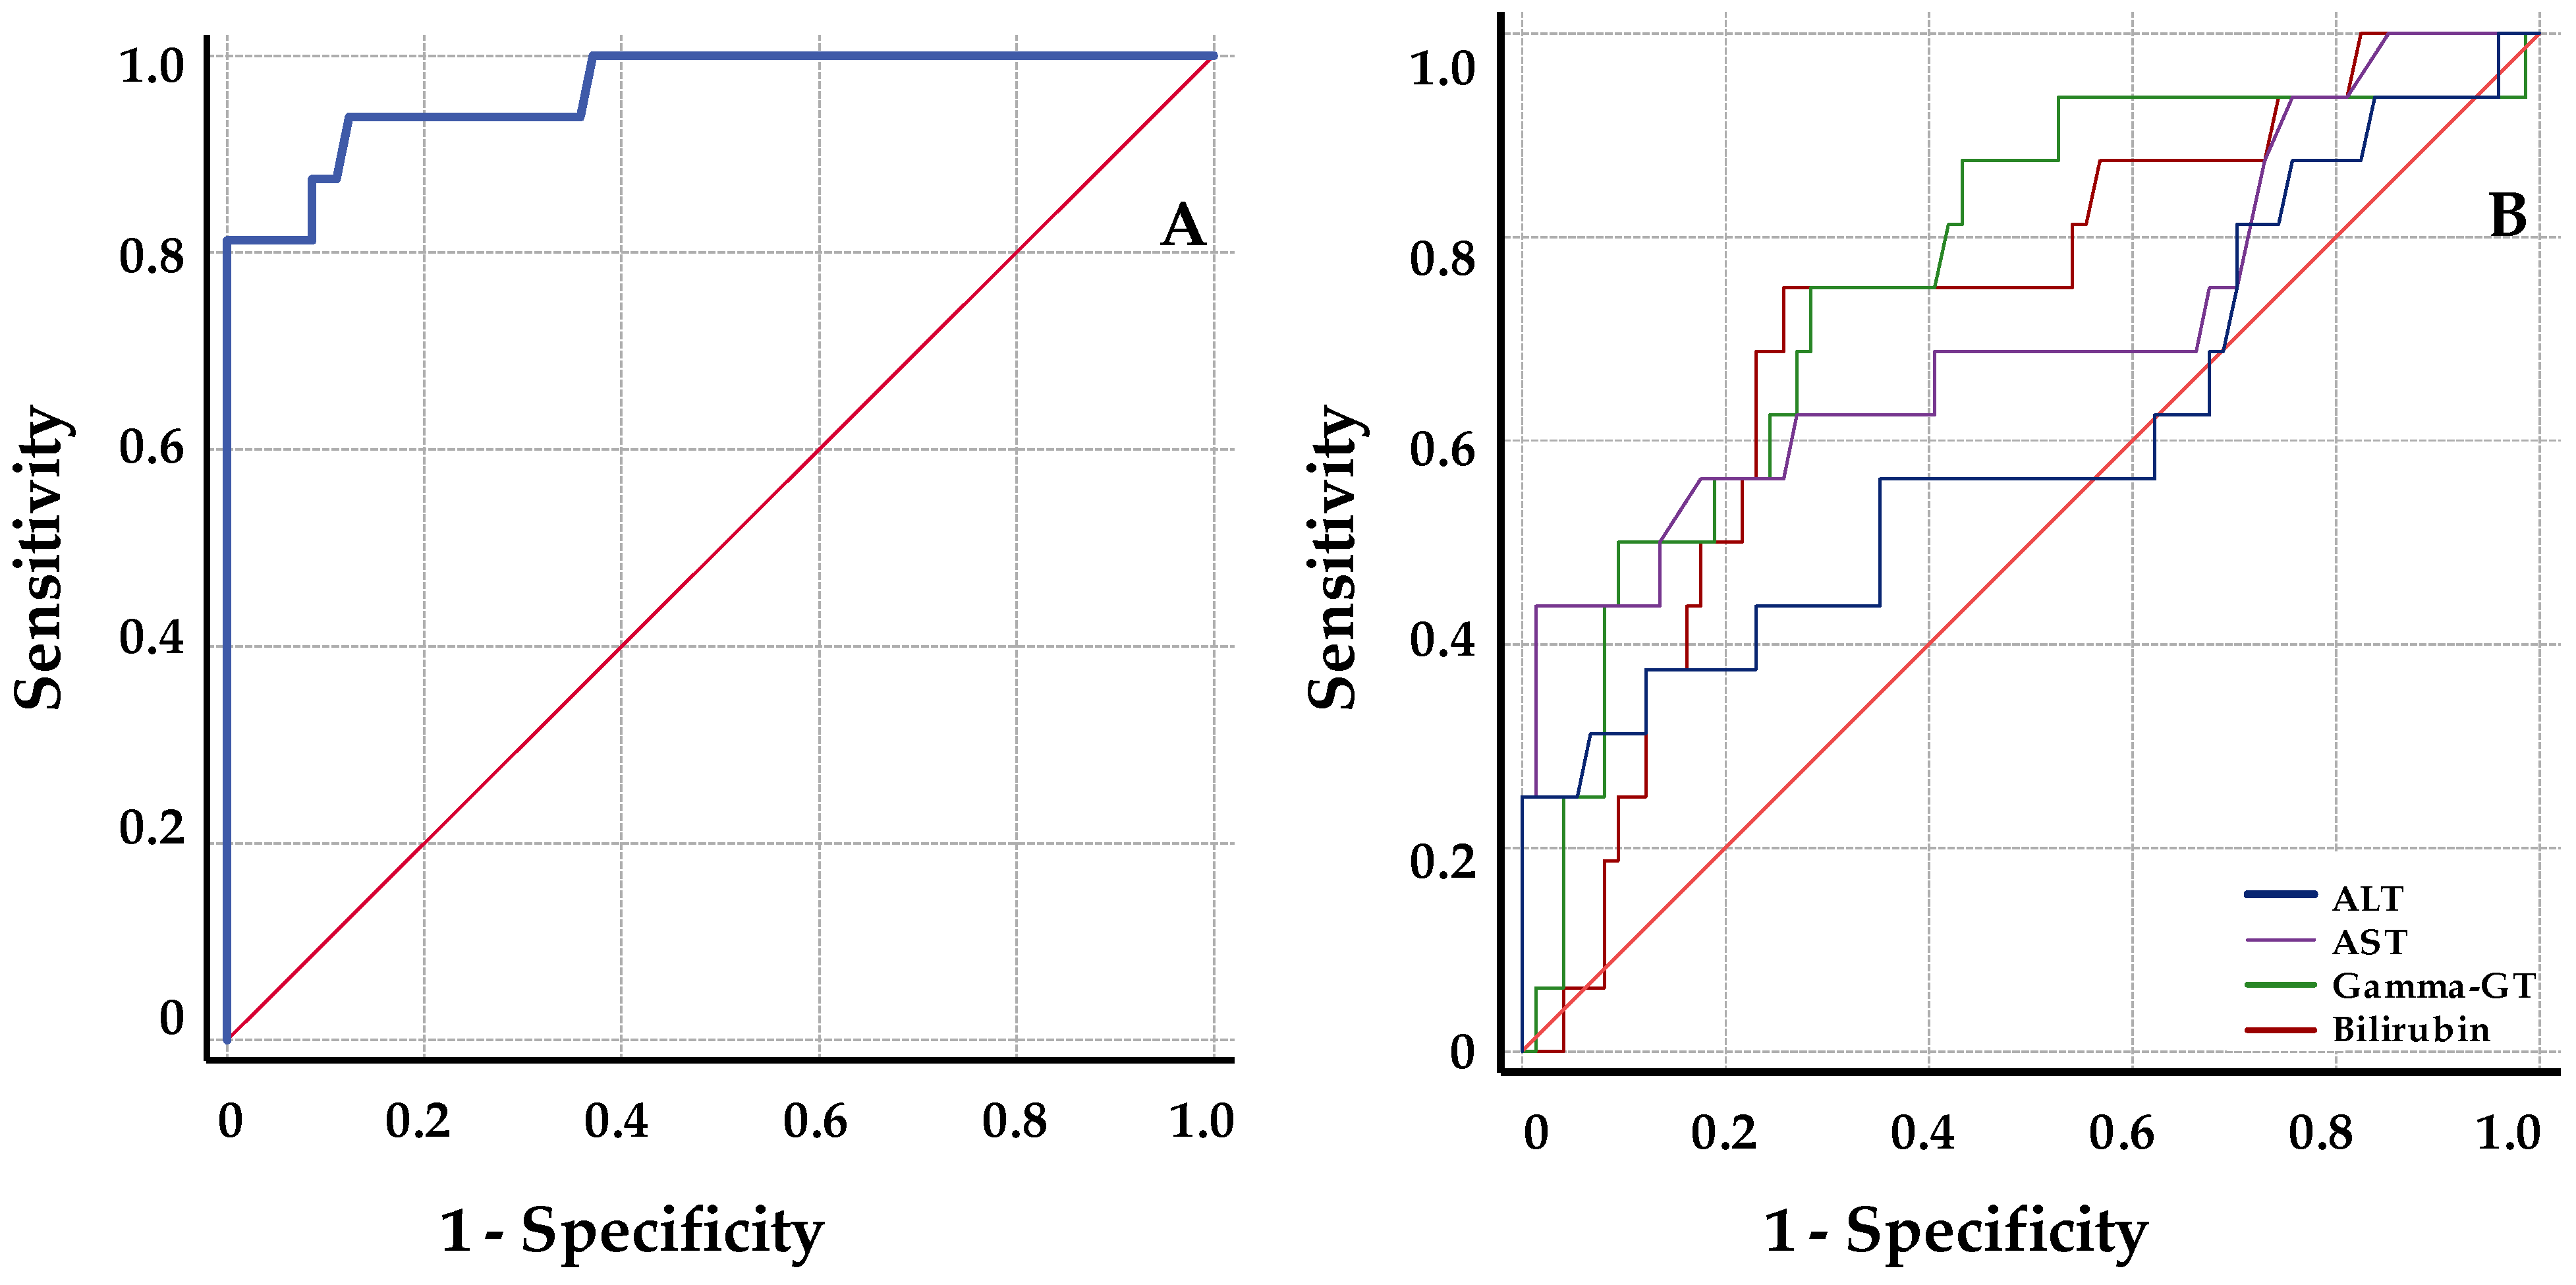
3.3. Changes in Percentage of Graft cfDNA and Classical Hepatic Markers at Rejection
4. Discussion
5. Conclusions
Supplementary Materials
Author Contributions
Funding
Institutional Review Board Statement
Informed Consent Statement
Data Availability Statement
Acknowledgments
Conflicts of Interest
References
- Grant, A.; Neuberger, J. Guidelines on the use of liver biopsy in clinical practice. Gut 1999, 45 (Suppl. S4), IV1–IV11. [Google Scholar] [CrossRef] [PubMed]
- Lo, Y.M.D.; Tein, M.S.C.; Pang, C.C.P.; Yeung, C.K.; Tong, K.L.; Hjelm, N.M. Presence of donor-specific DNA in plasma of kidney and liver-transplant recipients. Lancet 1998, 351, 1329–1330. [Google Scholar] [CrossRef]
- Snyder, T.M.; Khush, K.K.; Valantine, H.A.; Quake, S.R. Universal noninvasive detection of solid organ transplant rejection. Proc. Natl. Acad. Sci. USA 2011, 108, 6229–6234. [Google Scholar] [CrossRef] [PubMed] [Green Version]
- De Vlaminck, I.; Valantine, H.A.; Snyder, T.M.; Strehl, C.; Cohen, G.; Luikart, H.; Neff, N.F.; Okamoto, J.; Bernstein, D.; Weisshaar, D.; et al. Circulating cell-free DNA enables noninvasive diagnosis of heart transplant rejection. Sci. Transl. Med. 2014, 6, 241ra77. [Google Scholar] [CrossRef] [PubMed] [Green Version]
- Grskovic, M.; Hiller, D.J.; Eubank, L.A.; Sninsky, J.J.; Christopherson, C.; Collins, J.P.; Thompson, K.; Song, M.; Wang, Y.S.; Ross, D.; et al. Validation of a clinical- grade assay to measure donor- derived cell- free DNA in solid organ transplant recipients. J. Mol. Diagn. 2016, 18, 890–902. [Google Scholar] [CrossRef] [PubMed] [Green Version]
- Oellerich, M.; Christenson, R.H.; Beck, J.; Schütz, E.; Sherwood, K.; Price, C.P.; Keown, P.A.; Walson, P.D. Donor-derived cell-free DNA testing in solid organ transplantation: A value proposition. J. Appl. Lab. Med. 2020, 5, 993–1004. [Google Scholar] [CrossRef]
- Beck, J.; Bierau, S.; Balzer, S.; Andag, R.; Kanzow, P.; Schmitz, J.; Gaedcke, J.; Moerer, O.; Slotta, J.E.; Walson, P.; et al. Digital droplet PCR for rapid quantification of donor DNA in the circulation of transplant recipients as a potential universal biomarker of graft injury. Clin. Chem. 2013, 59, 1732–1741. [Google Scholar] [CrossRef] [Green Version]
- Macher, H.C.; García-Fernández, N.; Adsuar-Gómez, A.; Porras-López, M.; González-Calle, A.; Noval-Padillo, J.; Guerrero, J.M.; Molinero, P.; Borrego-Domínguez, J.M.; Herruzo-Avilés, Á.; et al. Donor-specific circulating cell free DNA as a noninvasive biomarker of graft injury in heart transplantation. Clin. Chim. Acta 2019, 495, 590–597. [Google Scholar] [CrossRef]
- Goh, S.K.; Muralidharan, V.; Christophi, C.; Do, H.; Dobrovic, A. Probe-free digital PCR quantitative methodology to measure donor-specific cell-free DNA after solid-organ transplantation. Clin. Chem. 2017, 63, 742–750. [Google Scholar] [CrossRef] [Green Version]
- Moreira, V.G.; García, B.P.; Martín, J.M.B.; Suarez, F.O.; Alvarez, F.V. Cell-free DNA as a noninvasive acute rejection marker in renal transplantation. Clin. Chem. 2009, 55, 1958–1966. [Google Scholar] [CrossRef]
- Macher, H.C.; Suarez-Artacho, G.; Guerrero, J.M.; Gómez-Bravo, M.A.; Álvarez-Gómez, S.; Bernal-Bellido, C.; Dominguez-Pascual, I.; Rubio, A. Monitoring of transplanted liver health by quantification of organ-specific genomic marker in circulating DNA from receptor. PLoS ONE 2014, 9, e113987. [Google Scholar] [CrossRef] [PubMed] [Green Version]
- Adamek, M.; Opelz, G.; Klein, K.; Morath, C.; Tran, T.H. A fast and simple method for detecting and quantifying donor-derived cell-free DNA in sera of solid organ transplant recipients as a biomarker for graft function. Clin. Chem. Lab. Med. 2015, 54, 1147–1155. [Google Scholar] [CrossRef] [PubMed]
- Jiménez-Velasco, A.; Barrios, M.; Román-Gómez, J.; Navarro, G.; Buño, I.; Castillejo, J.A.; Rodríguez, A.I.; García-Gemar, G.; Torres, A.; Heiniger, A.I. Reliable quantification of hematopoietic chimerism after allogeneic transplantation for acute leukemia using amplification by real-time PCR of null alleles and insertion/deletion polymorphisms. Leukemia 2005, 19, 336–343. [Google Scholar] [CrossRef] [PubMed]
- Bustin, S.A.; Benes, V.; Garson, J.A.; Hellemans, J.; Huggett, J.; Kubista, M.; Mueller, R.; Nolan, T.; Pfaffl, M.W.; Shipley, G.L.; et al. The MIQE Guidelines: Minimum Information for Publication of Quantitative Real-Time PCR Experiments. Clin. Chem. 2009, 55, 611–622. [Google Scholar] [CrossRef] [Green Version]
- Oellerich, M.; Sherwood, K.; Keown, P.; Schütz, E.; Beck, J.; Stegbauer, J.; Rump, L.C.; Walson, P.D. Liquid biopsies: Donor-derived cell-free DNA for the detection of kidney allograft injury. Nat. Rev. Nephrol. 2021, 17, 591–603. [Google Scholar] [CrossRef]
- Schütz, E.; Fischer, A.; Beck, J.; Harden, M.; Koch, M.; Wuensch, T.; Stockmann, M.; Nashan, B.; Kollmar, O.; Matthaei, J.; et al. Graft-derived cell-free DNA, a noninvasive early rejection and graft damage marker in liver transplantation: A prospective, observational, multicenter cohort study. PLoS Med. 2017, 25, e1002286. [Google Scholar] [CrossRef] [Green Version]
- Bloom, R.D.; Bromberg, J.S.; Poggio, E.D.; Bunnapradist, S.; Langone, A.J.; Sood, P.; Matas, A.J.; Mehta, S.; Mannon, R.B.; Sharfuddin, A.; et al. Circulating Donor-Derived Cell-Free DNA in Blood for Diagnosing Active Rejection in Kidney Transplant Recipients (DART) Study Investigators. Cell-Free DNA and Active Rejection in Kidney Allografts. J. Am. Soc. Nephrol. 2017, 28, 2221–2232. [Google Scholar] [CrossRef] [Green Version]
- Fernández-Galán, E.; Badenas, C.; Fondevila, C.; Jiménez, W.; Navasa, M.; Puig-Butillé, J.A.; Brunet, M. Monitoring of Donor-Derived Cell-Free DNA by Short Tandem Repeats: Concentration of Total Cell-Free DNA and Fragment Size for Acute Rejection Risk Assessment in Liver Transplantation. Liver Transpl. 2022, 28, 257–268. [Google Scholar] [CrossRef]
- Levitsky, J.; Kandpal, M.; Guo, K.; Kleiboeker, S.; Sinha, R.; Abecassis, M. Donor-derived cell-free DNA levels predict graft injury in liver transplant recipients. Am. J. Transplant. 2022, 22, 532–540. [Google Scholar] [CrossRef]
- Oellerich, M.; Schütz, E.; Kanzow, P.; Schmitz, J.; Beck, J.; Kollmar, O.; Streit, F.; Walson, P.D. Use of graft-derived cell-free DNA as an organ integrity biomarker to reexamine effective tacrolimus trough concentrations after liver transplantation. Ther. Drug. Monit. 2014, 36, 136–140. [Google Scholar] [CrossRef]
- Crespo-Leiro, M.G.; Zuckermann, A.; Bara, C.; Mohacsi, P.; Schulz, U.; Boyle, A.; Ross, H.J.; Parameshwar, J.; Zakliczyński, M.; Fiocchi, R.; et al. Concordance among pathologists in the second Cardiac Allograft Rejection Gene Expression Observational Study (CARGO II). Transplantation 2012, 94, 1172–1177. [Google Scholar] [CrossRef] [PubMed]
- Zheng, Y.W.; Chan, K.C.; Sun, H.; Jiang, P.; Su, X.; Chen, E.Z.; Lun, F.M.F.; Hung, E.C.W.; Lee, V.; Wong, J.; et al. Nonhematopoietically derived DNA is shorter than hematopoietically derived DNA in plasma: A transplantation model. Clin. Chem. 2012, 58, 549–558. [Google Scholar] [CrossRef] [PubMed]


| Total (n = 97) | Stable (n = 84) | Rejection (n = 13) | p | |
|---|---|---|---|---|
| Age (years) | 55 [18–71] | 56 [18–71] | 49 [21–60] | 0.0003 |
| Sex (male) | 50 (51.5%) | 42 (50%) | 8 (61.5%) | 0.55 |
| Warm ischemia (min) | 30 [12.5–60] | 30 [12.5–60] | 30 [22–36] | 0.54 |
| Cold ischemia (min) | 382 [250–551] | 382 [270–551] | 360 [250–425] | 0.16 |
| Previous ICU | 10 (10.3%) | 7 (8.3%) | 3 (23.1%) | 0.13 |
| Previous ICU (days) | 3 [1–58] | 3 [1–58] | 1 [1–34] | 0.42 |
| ICU post-TX (days) | 6 [3–54] | 6 [3–54] | 6 [4–14] | 0.768 |
| Hospitalization (days) | 18 [4–109] | 17 [4–109] | 30 [11–67] | 0.01 |
| Beta-globin 48 h (GKE/mL) | 321 [104–4979] | 346 [104–3232] | 270 [104–4979] | 0.19 |
| Rejection during first month | 13 (13.4%) | |||
| Rejection (two years after TX) | 20 (20.6%) |
| Mean + SEM | Basal | Pre-R | R | 2 Years | p |
|---|---|---|---|---|---|
| ds-cfDNA | 2.73 + 0.75 | 17.64 + 3.44 | 29.27+ 4.32 | - | <0.0001 |
| cfDNA | 60.07 + 7.17 | 85.17 + 9.23 | 70.08 + 4.15 | - | 0.061 |
| ALT | 104.81 + 47.13 | 222.22 + 104.53 | 226.11 + 76.11 | 26.0 9 + 4.47 | 0.089 |
| AST | 40.54 + 9.1 | 129.75 + 59.3 | 114.87 + 40.44 | 23.63 + 3.92 | 0.047 |
| Gamma-GT | 351.45 + 69.86 | 519.22 + 75.39 | 650.87 + 122.54 | 76.09 + 24.04 | <0.0001 |
| Bilirubin | 2.43 + 0.47 | 3.25 + 0.87 | 5.82 + 1.26 | 0.65 + 0.17 | 0.001 |
| ds-cfDNA | Total | Stable Patients | Patients with BPR | |||
|---|---|---|---|---|---|---|
| CC | p | CC | p | CC | p | |
| ALT | 0.58 ** | <0.0001 | 0.61 ** | <0.0001 | 0.43 ** | 0.0001 |
| AST | 0.66 ** | <0.0001 | 0.72 ** | <0.0001 | 0.50 ** | <0.0001 |
| Gamma-GT | −0.26 ** | <0.0001 | −0.32 ** | <0.0001 | −0.05 | 0.72 |
| Bilirubin | 0.2 ** | <0.0001 | 0.16 * | 0.01 | 0.38 ** | 0.001 |
| Determination | ÁUC (%) | Signification | 95% CI | Sensitivity (%) | Specificity (%) | Threshold Value at Maximum YI |
|---|---|---|---|---|---|---|
| ds-cfDNA | 96.5 | <0.0001 | 91.9–101.2 | 93.75 | 87.84 | 8.605 (%) |
| ALT | 60.3 | 0.242 | 43–77.6 | 37.5 | 87.84 | 144.5 |
| AST | 70.8 | 0.012 | 54.5–87.1 | 43.75 | 98.7 | 94.5 |
| Gamma-GT | 76.1 | 0.0001 | 62.7–89.5 | 75 | 71.7 | 401.5 |
| Bilirubin | 72.1 | 0.001 | 58.7–85.4 | 75 | 74.3 | 2.65 |
Disclaimer/Publisher’s Note: The statements, opinions and data contained in all publications are solely those of the individual author(s) and contributor(s) and not of MDPI and/or the editor(s). MDPI and/or the editor(s) disclaim responsibility for any injury to people or property resulting from any ideas, methods, instructions or products referred to in the content. |
© 2022 by the authors. Licensee MDPI, Basel, Switzerland. This article is an open access article distributed under the terms and conditions of the Creative Commons Attribution (CC BY) license (https://creativecommons.org/licenses/by/4.0/).
Share and Cite
García-Fernández, N.; Macher, H.C.; Suárez-Artacho, G.; Gómez-Bravo, M.Á.; Molinero, P.; Guerrero, J.M.; Porras-López, M.; Rubio, A. Donor-Specific Cell-Free DNA qPCR Quantification as a Noninvasive Accurate Biomarker for Early Rejection Detection in Liver Transplantation. J. Clin. Med. 2023, 12, 36. https://doi.org/10.3390/jcm12010036
García-Fernández N, Macher HC, Suárez-Artacho G, Gómez-Bravo MÁ, Molinero P, Guerrero JM, Porras-López M, Rubio A. Donor-Specific Cell-Free DNA qPCR Quantification as a Noninvasive Accurate Biomarker for Early Rejection Detection in Liver Transplantation. Journal of Clinical Medicine. 2023; 12(1):36. https://doi.org/10.3390/jcm12010036
Chicago/Turabian StyleGarcía-Fernández, Noelia, Hada C. Macher, Gonzalo Suárez-Artacho, Miguel Ángel Gómez-Bravo, Patrocinio Molinero, Juan Miguel Guerrero, Manuel Porras-López, and Amalia Rubio. 2023. "Donor-Specific Cell-Free DNA qPCR Quantification as a Noninvasive Accurate Biomarker for Early Rejection Detection in Liver Transplantation" Journal of Clinical Medicine 12, no. 1: 36. https://doi.org/10.3390/jcm12010036