
Urine 3-Nitrotyrosine and Serum HDL as Potential Biomarkers of Depression

 ,
,  ,
,  and
and 
Abstract
:1. Introduction
2. Materials and Methods
2.1. Study Population
2.2. Study Design
2.3. Biochemical Procedures
2.3.1. Anti-Oxidant Defense Systems Assays
2.3.2. Oxidative and Nitrosative Damage Assays
2.4. Statistical Analysis
3. Results
3.1. Analysis of Differences in Clinical Data between the Groups
3.2. Analysis of the Relationship between Clinical Parameters, Questionnaire Scores, and Duration of Disease Progression
3.3. Multivariate Analysis Effect of Clinical Parameters on the Depression Factor
4. Discussion
5. Conclusions
6. Limitations
Supplementary Materials
Author Contributions
Funding
Institutional Review Board Statement
Informed Consent Statement
Data Availability Statement
Conflicts of Interest
References
- Smith, K. Mental Health: A World of Depression. Nature 2014, 515, 180–181. [Google Scholar] [CrossRef] [PubMed] [Green Version]
- Terrill, A. Global Disability Adjusted Life-Years Attributed to Mental Disorders Increased From 1990 to 2019. Available online: https://www.psychiatryadvisor.com/home/topics/general-psychiatry/2019-global-burden-of-diseases-found-dalys-increased-from-3-1-to-4-9-percent/ (accessed on 10 October 2022).
- Czarny, P.; Wigner, P.; Galecki, P.; Sliwinski, T. The Interplay between Inflammation, Oxidative Stress, DNA Damage, DNA Repair and Mitochondrial Dysfunction in Depression. Prog. Neuro-Psychopharmacol. Biol. Psychiatry 2018, 80, 309–321. [Google Scholar] [CrossRef] [PubMed]
- Liu, T.; Zhong, S.; Liao, X.; Chen, J.; He, T.; Lai, S.; Jia, Y. A Meta-Analysis of Oxidative Stress Markers in Depression. PLoS ONE 2015, 10, e0138904. [Google Scholar] [CrossRef] [PubMed]
- Gawryluk, J.W.; Wang, J.-F.; Andreazza, A.C.; Shao, L.; Young, L.T. Decreased Levels of Glutathione, the Major Brain Antioxidant, in Post-Mortem Prefrontal Cortex from Patients with Psychiatric Disorders. Int. J. Neuropsychopharmacol. 2011, 14, 123–130. [Google Scholar] [CrossRef] [PubMed] [Green Version]
- Itoh, K.; Chiba, T.; Takahashi, S.; Ishii, T.; Igarashi, K.; Katoh, Y.; Oyake, T.; Hayashi, N.; Satoh, K.; Hatayama, I.; et al. An Nrf2/Small Maf Heterodimer Mediates the Induction of Phase II Detoxifying Enzyme Genes through Antioxidant Response Elements. Biochem. Biophys. Res. Commun. 1997, 236, 313–322. [Google Scholar] [CrossRef]
- Maes, M.; Carvalho, A.F. The Compensatory Immune-Regulatory Reflex System (CIRS) in Depression and Bipolar Disorder. Mol. Neurobiol. 2018, 55, 8885–8903. [Google Scholar] [CrossRef]
- Maes, M.; Mihaylova, I.; Kubera, M.; Uytterhoeven, M.; Vrydags, N.; Bosmans, E. Increased Plasma Peroxides and Serum Oxidized Low Density Lipoprotein Antibodies in Major Depression: Markers That Further Explain the Higher Incidence of Neurodegeneration and Coronary Artery Disease. J. Affect. Disord. 2010, 125, 287–294. [Google Scholar] [CrossRef]
- Hussain, M.; Kumar, P.; Khan, S.; Gordon, D.; Khan, S. Similarities Between Depression and Neurodegenerative Diseases: Pathophysiology, Challenges in Diagnosis and Treatment Options. Cureus 2020, 12, e11613. [Google Scholar] [CrossRef]
- Maes, M.; Yirmyia, R.; Noraberg, J.; Brene, S.; Hibbeln, J.; Perini, G.; Kubera, M.; Bob, P.; Lerer, B.; Maj, M. The Inflammatory & Neurodegenerative (I&ND) Hypothesis of Depression: Leads for Future Research and New Drug Developments in Depression. Metab. Brain Dis. 2009, 24, 27–53. [Google Scholar] [CrossRef]
- Arnone, D.; Saraykar, S.; Salem, H.; Teixeira, A.L.; Dantzer, R.; Selvaraj, S. Role of Kynurenine Pathway and Its Metabolites in Mood Disorders: A Systematic Review and Meta-Analysis of Clinical Studies. Neurosci. Biobehav. Rev. 2018, 92, 477–485. [Google Scholar] [CrossRef]
- Cheignon, C.; Tomas, M.; Bonnefont-Rousselot, D.; Faller, P.; Hureau, C.; Collin, F. Oxidative Stress and the Amyloid Beta Peptide in Alzheimer’s Disease. Redox. Biol. 2018, 14, 450–464. [Google Scholar] [CrossRef]
- Butterfield, D.A.; Boyd-Kimball, D. Oxidative Stress, Amyloid-β Peptide, and Altered Key Molecular Pathways in the Pathogenesis and Progression of Alzheimer’s Disease. J. Alzheimers. Dis. 2018, 62, 1345–1367. [Google Scholar] [CrossRef] [Green Version]
- Mahgoub, N.; Alexopoulos, G.S. Amyloid Hypothesis: Is There a Role for Antiamyloid Treatment in Late-Life Depression? Am J. Geriatr. Psychiatry 2016, 24, 239–247. [Google Scholar] [CrossRef] [Green Version]
- van Dyck, C.H.; O’Dell, R.S.; Mecca, A.P. Amyloid-Associated Depression-or Not? Biol. Psychiatry 2021, 89, 737–738. [Google Scholar] [CrossRef]
- Harrington, K.D.; Lim, Y.Y.; Gould, E.; Maruff, P. Amyloid-Beta and Depression in Healthy Older Adults: A Systematic Review. Aust. N. Z. J. Psychiatry 2015, 49, 36–46. [Google Scholar] [CrossRef]
- Wu, K.-Y.; Hsiao, I.-T.; Chen, C.-S.; Chen, C.-H.; Hsieh, C.-J.; Wai, Y.-Y.; Chang, C.-J.; Tseng, H.-J.; Yen, T.-C.; Liu, C.-Y.; et al. Increased Brain Amyloid Deposition in Patients with a Lifetime History of Major Depression: Evidenced on 18F-Florbetapir (AV-45/Amyvid) Positron Emission Tomography. Eur. J. Nucl. Med. Mol. Imaging 2014, 41, 714–722. [Google Scholar] [CrossRef]
- Kumar, A.; Kepe, V.; Barrio, J.R.; Siddarth, P.; Manoukian, V.; Elderkin-Thompson, V.; Small, G.W. Protein Binding in Patients with Late-Life Depression. Arch. Gen. Psychiatry 2011, 68, 1143–1150. [Google Scholar] [CrossRef] [Green Version]
- Krell-Roesch, J.; Lowe, V.J.; Neureiter, J.; Pink, A.; Roberts, R.O.; Mielke, M.M.; Vemuri, P.; Stokin, G.B.; Christianson, T.J.; Jack, C.R.; et al. Depressive and Anxiety Symptoms and Cortical Amyloid Deposition among Cognitively Normal Elderly Persons: The Mayo Clinic Study of Aging. Int. Psychogeriatr. 2018, 30, 245–251. [Google Scholar] [CrossRef] [Green Version]
- Wu, K.-Y.; Lin, K.-J.; Chen, C.-H.; Liu, C.-Y.; Wu, Y.-M.; Chen, C.-S.; Yen, T.-C.; Hsiao, I.-T. Decreased Cerebral Amyloid-β Depositions in Patients With a Lifetime History of Major Depression With Suspected Non-Alzheimer Pathophysiology. Front. Aging Neurosci. 2022, 14, 857940. [Google Scholar] [CrossRef]
- Mackin, R.S.; Insel, P.S.; Landau, S.; Bickford, D.; Morin, R.; Rhodes, E.; Tosun, D.; Rosen, H.J.; Butters, M.; Aisen, P.; et al. Late-Life Depression Is Associated with Reduced Cortical Amyloid Burden: Findings From the Alzheimer’s Disease Neuroimaging Initiative Depression Project. Biol. Psychiatry 2021, 89, 757–765. [Google Scholar] [CrossRef]
- Nobis, A.; Zalewski, D.; Waszkiewicz, N. Peripheral Markers of Depression. J. Clin. Med. 2020, 9, 3793. [Google Scholar] [CrossRef] [PubMed]
- Chen, J.; Bai, S.-J.; Li, W.; Zhou, C.; Zheng, P.; Fang, L.; Wang, H.; Liu, Y.; Xie, P. Urinary Biomarker Panel for Diagnosing Patients with Depression and Anxiety Disorders. Transl. Psychiatry 2018, 8, 192. [Google Scholar] [CrossRef] [PubMed] [Green Version]
- Lopresti, A.L.; Maker, G.L.; Hood, S.D.; Drummond, P.D. A Review of Peripheral Biomarkers in Major Depression: The Potential of Inflammatory and Oxidative Stress Biomarkers. Prog. Neuropsychopharmacol. Biol. Psychiatry 2014, 48, 102–111. [Google Scholar] [CrossRef] [PubMed] [Green Version]
- Carvalho, A.F.; Solmi, M.; Sanches, M.; Machado, M.O.; Stubbs, B.; Ajnakina, O.; Sherman, C.; Sun, Y.R.; Liu, C.S.; Brunoni, A.R.; et al. Evidence-Based Umbrella Review of 162 Peripheral Biomarkers for Major Mental Disorders. Transl. Psychiatry 2020, 10, 152. [Google Scholar] [CrossRef] [PubMed]
- van Buel, E.M.; Meddens, M.J.M.; Arnoldussen, E.A.; van den Heuvel, E.R.; Bohlmeijer, W.C.; den Boer, J.A.; Muller Kobold, A.; Boonman-de Winter, L.J.M.; van Rumpt, D.; Timmers, L.F.J.; et al. Major Depressive Disorder Is Associated with Changes in a Cluster of Serum and Urine Biomarkers. J. Psychosom. Res. 2019, 125, 109796. [Google Scholar] [CrossRef]
- Sheehan, D.V.; Lecrubier, Y.; Sheehan, K.H.; Amorim, P.; Janavs, J.; Weiller, E.; Hergueta, T.; Baker, R.; Dunbar, G.C. The Mini-International Neuropsychiatric Interview (M.I.N.I.): The Development and Validation of a Structured Diagnostic Psychiatric Interview for DSM-IV and ICD-10. J. Clin. Psychiatry 1998, 59 (Suppl. 20), 22–33. [Google Scholar]
- Beck, A.T.; Ward, C.H.; Mendelson, M.; Mock, J.; Erbaugh, J. An Inventory for Measuring Depression. Arch. Gen. Psychiatry 1961, 4, 561–571. [Google Scholar] [CrossRef] [Green Version]
- Hamilton, M. A Rating Scale for Depression. J. Neurol. Neurosurg. Psychiatry 1960, 23, 56–62. [Google Scholar] [CrossRef] [Green Version]
- Thompson, E. Hamilton Rating Scale for Anxiety (HAM-A). Occup. Med. 2015, 65, 601. [Google Scholar] [CrossRef] [Green Version]
- Aebi, H. Catalase in Vitro. In Methods in Enzymology; Oxygen Radicals in Biological Systems; Academic Press: Cambridge, MA, USA, 1984; Volume 105, pp. 121–126. [Google Scholar]
- Misra, H.P.; Fridovich, I. The Role of Superoxide Anion in the Autoxidation of Epinephrine and a Simple Assay for Superoxide Dismutase. J. Biol. Chem. 1972, 247, 3170–3175. [Google Scholar] [CrossRef]
- Paglia, D.E.; Valentine, W.N. Studies on the Quantitative and Qualitative Characterization of Erythrocyte Glutathione Peroxidase. J. Lab. Clin. Med. 1967, 70, 158–169. [Google Scholar]
- Moron, M.S.; Depierre, J.W.; Mannervik, B. Levels of Glutathione, Glutathione Reductase and Glutathione S-Transferase Activities in Rat Lung and Liver. Biochim. Et Biophys. Acta (BBA)—Gen. Subj. 1979, 582, 67–78. [Google Scholar] [CrossRef]
- Erel, O. A New Automated Colorimetric Method for Measuring Total Oxidant Status. Clin. Biochem. 2005, 38, 1103–1111. [Google Scholar] [CrossRef]
- Kalousová, M.; Skrha, J.; Zima, T. Advanced Glycation End-Products and Advanced Oxidation Protein Products in Patients with Diabetes Mellitus. Physiol. Res. 2002, 51, 597–604. [Google Scholar]
- Borys, J.; Maciejczyk, M.; Krȩtowski, A.J.; Antonowicz, B.; Ratajczak-Wrona, W.; Jabłońska, E.; Załęski, P.; Waszkiel, D.; Ładny, J.R.; Żukowski, P.; et al. The Redox Balance in Erythrocytes, Plasma, and Periosteum of Patients with Titanium Fixation of the Jaw. Front. Physiol. 2017, 8, 386. [Google Scholar] [CrossRef] [Green Version]
- Gęgotek, A.; Rybałtowska-Kawałko, P.; Skrzydlewska, E. Rutin as a Mediator of Lipid Metabolism and Cellular Signaling Pathways Interactions in Fibroblasts Altered by UVA and UVB Radiation. Oxidative Med. Cell. Longev. 2017, 2017, e4721352. [Google Scholar] [CrossRef] [Green Version]
- Walker, J.M. The Bicinchoninic Acid (BCA) Assay for Protein Quantitation. Methods Mol. Biol. 1994, 32, 5–8. [Google Scholar] [CrossRef]
- Pawlukianiec, C.; Gryciuk, M.E.; Mil, K.M.; Żendzian-Piotrowska, M.; Zalewska, A.; Maciejczyk, M. A New Insight into Meloxicam: Assessment of Antioxidant and Anti-Glycating Activity in In Vitro Studies. Pharmaceuticals 2020, 13, 240. [Google Scholar] [CrossRef]
- Funder, D.C.; Ozer, D.J. Evaluating Effect Size in Psychological Research: Sense and Nonsense. Adv. Methods Pract. Psychol. Sci. 2019, 2, 156–168. [Google Scholar] [CrossRef]
- Statistical Power Analysis for the Behavioral Sciences | Jacob Cohen. Available online: https://www.taylorfrancis.com/books/mono/10.4324/9780203771587/statistical-power-analysis-behavioral-sciences-jacob-cohen (accessed on 2 November 2022).
- Benjamini, Y.; Hochberg, Y. Controlling the False Discovery Rate: A Practical and Powerful Approach to Multiple Testing. J. R. Stat. Soc. Ser. B 1995, 57, 289–300. [Google Scholar] [CrossRef]
- Khamis, H. Measures of Association: How to Choose? J. Diagn. Med. Sonogr. 2008, 24, 155–162. [Google Scholar] [CrossRef] [Green Version]
- Danieluk, B. Application of Logistic Regression in Experimental Research—Back Content of Social Psychological Bulletin (Psychologia Społeczna). (2–3(14)/2010); Wydawnictwo Naukowe Scholar: Warsaw, Poland, 2010; ISSN 896-1800. [Google Scholar]
- R: The R Project for Statistical Computing. Available online: https://www.r-project.org/ (accessed on 23 November 2022).
- Ben-Shachar, M.S.; Lüdecke, D.; Makowski, D. Effectsize: Estimation of Effect Size Indices and Standardized Parameters. J. Open Source Softw. 2020, 5, 2815. [Google Scholar] [CrossRef]
- Applied Regression 3E. Available online: https://socialsciences.mcmaster.ca/jfox/Books/Companion/ (accessed on 2 November 2022).
- Harrell, F., Jr. Hmisc: Harrell Miscellaneous. R package version 4.7-0. 2022. Available online: https://CRAN.R-project.org/package=Hmisc (accessed on 24 October 2022).
- Lüdecke, D. Ggeffects: Tidy Data Frames of Marginal Effects from Regression Models. J. Open Source Softw. 2018, 3, 772. [Google Scholar] [CrossRef]
- Lüdecke, D. sjPlot: Data Visualization for Statistics in Social Science. R Package Version 2.8.10. 2021. Available online: https://CRAN.R-project.org/package=sjPlot (accessed on 29 October 2022).
- Makowski, D.; Ben-Shachar, M.; Patil, I.; Lüdecke, D. Automated Results Reporting as a Practical Tool to Improve Reproducibility and Methodological Best Practices Adoption. 2021. Available online: https://github.com/easystats/report (accessed on 22 October 2022).
- Mangiafico, S. rcompanion: Functions to Support Extension Education Program Evaluation. R package version 2.4.15. 2022. Available online: https://CRAN.R-project.org/package=rcompanion (accessed on 22 October 2022).
- Revelle, W. psych: Procedures for Psychological, Psychometric, and Personality Research. Northwestern University, Evanston, Illinois. R Package Version 2.1.6. 2021. Available online: https://CRAN.R-project.org/package=psych (accessed on 22 October 2022).
- Create Elegant Data Visualisations Using the Grammar of Graphics. Available online: https://ggplot2.tidyverse.org/ (accessed on 23 November 2022).
- Baek, D.; Park, Y. Association between Erythrocyte N-3 Polyunsaturated Fatty Acids and Biomarkers of Inflammation and Oxidative Stress in Patients with and without Depression. Prostaglandins Leukot. Essent. Fat. Acids 2013, 89, 291–296. [Google Scholar] [CrossRef] [PubMed]
- Pasquali, M.A.; Harlow, B.L.; Soares, C.N.; Otto, M.W.; Cohen, L.S.; Minuzzi, L.; Gelain, D.P.; Moreira, J.C.F.; Frey, B.N. A Longitudinal Study of Neurotrophic, Oxidative, and Inflammatory Markers in First-Onset Depression in Midlife Women. Eur. Arch. Psychiatry Clin. Neurosci. 2018, 268, 771–781. [Google Scholar] [CrossRef]
- Katrenčíková, B.; Vaváková, M.; Paduchová, Z.; Nagyová, Z.; Garaiova, I.; Muchová, J.; Ďuračková, Z.; Trebatická, J. Oxidative Stress Markers and Antioxidant Enzymes in Children and Adolescents with Depressive Disorder and Impact of Omega-3 Fatty Acids in Randomised Clinical Trial. Antioxidants 2021, 10, 1256. [Google Scholar] [CrossRef]
- Cichoń, N.; Bijak, M.; Miller, E.; Niwald, M.; Saluk, J. Poststroke Depression as a Factor Adversely Affecting the Level of Oxidative Damage to Plasma Proteins during a Brain Stroke. Oxidative Med. Cell. Longev. 2015, 2015, e408745. [Google Scholar] [CrossRef] [Green Version]
- Ivanovski, O.; Szumilak, D.; Nguyen-Khoa, T.; Ruellan, N.; Phan, O.; Lacour, B.; Descamps-Latscha, B.; Dreeke, T.B.; Massy, Z.A. The Antioxidant N-Acetylcysteine Prevents Accelerated Atherosclerosis in Uremic Apolipoprotein E Knockout Mice. Kidney Int. 2005, 67, 2288–2294. [Google Scholar] [CrossRef] [Green Version]
- Yang, C.; Bosker, F.J.; Li, J.; Schoevers, R.A. N-Acetylcysteine as Add-on to Antidepressant Medication in Therapy Refractory Major Depressive Disorder Patients with Increased Inflammatory Activity: Study Protocol of a Double-Blind Randomized Placebo-Controlled Trial. BMC Psychiatry 2018, 18, 279. [Google Scholar] [CrossRef] [Green Version]
- Kuhn, D.M.; Sakowski, S.A.; Sadidi, M.; Geddes, T.J. Nitrotyrosine as a Marker for Peroxynitrite-Induced Neurotoxicity: The Beginning or the End of the End of Dopamine Neurons? J. Neurochem. 2004, 89, 529–536. [Google Scholar] [CrossRef]
- Bandookwala, M.; Sengupta, P. 3-Nitrotyrosine: A Versatile Oxidative Stress Biomarker for Major Neurodegenerative Diseases. Int. J. Neurosci. 2020, 130, 1047–1062. [Google Scholar] [CrossRef] [PubMed]
- Andreazza, A.C.; Kapczinski, F.; Kauer-Sant’Anna, M.; Walz, J.C.; Bond, D.J.; Gonçalves, C.A.; Young, L.T.; Yatham, L.N. 3-Nitrotyrosine and Glutathione Antioxidant System in Patients in the Early and Late Stages of Bipolar Disorder. J. Psychiatry Neurosci. 2009, 34, 263–271. [Google Scholar]
- Hamilton, J.A.; Hillard, C.J.; Spector, A.A.; Watkins, P.A. Brain Uptake and Utilization of Fatty Acids, Lipids and Lipoproteins: Application to Neurological Disorders. J. Mol. Neurosci. 2007, 33, 2–11. [Google Scholar] [CrossRef] [PubMed]
- Kułak-Bejda, A.; Bejda, G.; Lech, M.; Waszkiewicz, N. Are Lipids Possible Markers of Suicide Behaviors? J. Clin. Med. 2021, 10, 333. [Google Scholar] [CrossRef] [PubMed]
- Maes, M.; Smith, R.; Christophe, A.; Vandoolaeghe, E.; Van Gastel, A.; Neels, H.; Demedts, P.; Wauters, A.; Meltzer, H.Y. Lower Serum High-Density Lipoprotein Cholesterol (HDL-C) in Major Depression and in Depressed Men with Serious Suicidal Attempts: Relationship with Immune-Inflammatory Markers. Acta Psychiatr. Scand. 1997, 95, 212–221. [Google Scholar] [CrossRef] [PubMed]
- Li, H.; Zhang, X.; Sun, Q.; Zou, R.; Li, Z.; Liu, S. Association between Serum Lipid Concentrations and Attempted Suicide in Patients with Major Depressive Disorder: A Meta-Analysis. PLoS ONE 2020, 15, e0243847. [Google Scholar] [CrossRef]
- Bharti, V.; Bhardwaj, A.; Hood, K.; Elias, D.A.; Metcalfe, A.W.S.; Kim, J.S. A Systematic Review and Meta-Analysis of Lipid Metabolomic Signatures of Major Depressive Disorder. J. Psychiatr. Res. 2021, 139, 197–205. [Google Scholar] [CrossRef]
- Wei, Y.-G.; Cai, D.-B.; Liu, J.; Liu, R.-X.; Wang, S.-B.; Tang, Y.-Q.; Zheng, W.; Wang, F. Cholesterol and Triglyceride Levels in First-Episode Patients with Major Depressive Disorder: A Meta-Analysis of Case-Control Studies. J. Affect Disord. 2020, 266, 465–472. [Google Scholar] [CrossRef]
- Moreira, F.P.; Jansen, K.; Cardoso, T.d.A.; Mondin, T.C.; Vieira, I.S.; Magalhães, P.V.d.S.; Kapczinski, F.; Souza, L.D.d.M.; da Silva, R.A.; Oses, J.P.; et al. Metabolic Syndrome, Depression and Anhedonia among Young Adults. Psychiatry Res. 2019, 271, 306–310. [Google Scholar] [CrossRef]
- Shen, H.; Tu, X.; Luan, X.; Zeng, Y.; He, J.; Tang, W. Serum Lipid Profiles and Post-Stroke Depression in Acute Ischemic Stroke Patients. Neuropsychiatr. Dis. Treat. 2019, 15, 1573–1583. [Google Scholar] [CrossRef] [Green Version]
- Wagner, C.J.; Musenbichler, C.; Böhm, L.; Färber, K.; Fischer, A.-I.; von Nippold, F.; Winkelmann, M.; Richter-Schmidinger, T.; Mühle, C.; Kornhuber, J.; et al. LDL Cholesterol Relates to Depression, Its Severity, and the Prospective Course. Prog. Neuropsychopharmacol. Biol. Psychiatry 2019, 92, 405–411. [Google Scholar] [CrossRef]
- Alshehri, T.; Mook-Kanamori, D.O.; Willems van Dijk, K.; Dinga, R.; Penninx, B.W.J.H.; Rosendaal, F.R.; le Cessie, S.; Milaneschi, Y. Metabolomics Dissection of Depression Heterogeneity and Related Cardiometabolic Risk. Psychol. Med. 2021, 1–10. [Google Scholar] [CrossRef]
- Shin, J.Y.; Suls, J.; Martin, R. Are Cholesterol and Depression Inversely Related? A Meta-Analysis of the Association between Two Cardiac Risk Factors. Ann. Behav. Med. 2008, 36, 33–43. [Google Scholar] [CrossRef]
- Black, C.N.; Bot, M.; Scheffer, P.G.; Cuijpers, P.; Penninx, B.W. Is Depression Associated with Increased Oxidative Stress? A Systematic Review and Meta-Analysis. Psychoneuroendocrinology 2015, 51, 164–175. [Google Scholar] [CrossRef]

| Variable | Study Group | Control Group | p | |||
|---|---|---|---|---|---|---|
| n | n | |||||
| Questionnaire scores | ||||||
| HAM-D score | 29 | 24.1 (7.1) | 30 | 0.33 (0.7) | <0.001 | |
| Beck score | 29 | 31.9 (11.7) | 30 | 4.3 (4.0) | <0.001 | |
| HAM-A score | 29 | 20.0 (14.0–26.0) | 30 | 0.0 (0–0) | <0.001 | |
| Material | Clinical parameters | |||||
| serum | Cholesterol, mg/dL | 22 | 175.1 (45.2) | 30 | 180.8 (36.0) | 0.630 |
| HDL, mg/dL | 22 | 50.1 (11.4) | 30 | 60.1 (13.1) | 0.005 | |
| TGA, mg/dL | 22 | 105.0 (77.0–137.0) | 30 | 71.0 (56.3–100.8) | 0.020 | |
| LDL, mg/dL | 22 | 94.5 (74.3–133.0) | 30 | 98.5 (84.0–116.0) | 0.910 | |
| CRP, mg/L | 28 | 1.6 (2.6) | 30 | 1.3 (1.6) | 0.550 | |
| urine | SOD, mU/mg protein | 26 | 2.2 (1.1) | 29 | 1.5 (0.8) | 0.007 |
| 3-NT, nmol/mg protein | 26 | 0.3 (0.2 -0.3) | 29 | 0.2 (0.2 -0.2) | 0.001 | |
| AGE, AFU/mg protein | 26 | 60.2 (45.9–74.9) | 29 | 56.6 (41.0–77.4) | 0.550 | |
| Amyloid, AFU/mg protein | 26 | 9.1 (7.9–10.5) | 29 | 7.9 (6.6–9.7) | 0.080 | |
| AOPP, nmol/mg protein | 26 | 37.8 (32.1–42.2) | 29 | 32.9 (28.3–35.9) | 0.054 | |
| CAT, nmol H2O2/min/mg protein | 26 | 1.0 (0.9–1.3) | 29 | 0.9 (0.8–1.1) | 0.010 | |
| GSH, ng/mg protein | 26 | 1.4 (1.3 –1.6) | 29 | 1.2 (1.0–1.5) | 0.040 | |
| KN, AFU/mg protein | 26 | 50.6 (34.0–62.2) | 29 | 36.5 (30.9–50.2) | 0.090 | |
| NFKN, AFU/mg protein | 26 | 25.9 (18.3–34.6) | 29 | 22.1 (17.2–29.1) | 0.260 | |
| GPx, mU/mg protein | 26 | 1.1 (1.0–1.6) | 29 | 1.0 (0.8–1.3) | 0.070 | |
| TAC, Trolox umol/mg protein | 26 | 2.2 (1.9–3.0) | 29 | 1.9 (1.6–2.5) | 0.130 | |
| TOS, nmol/mg protein | 26 | 20.9 (14.8–25.7) | 29 | 15.4 (10.7–23.4) | 0.060 | |
| TRY, AFU/mg protein | 26 | 10.7 (9.2–12.9) | 29 | 7.5 (5.9–9.3) | 0.001 | |
| Parameter | HAM-D Score | BDI Score | HAM-A Score | Persistence of Depression | ||||||||
|---|---|---|---|---|---|---|---|---|---|---|---|---|
| npairs | rp (ρ) | p | npairs | rp (ρ) | p | npairs | ρ | p | npairs | ρ | p | |
| Cholesterol, mg/dL | 52 | −0.03 | 0.840 | 52 | −0.02 | 0.891 | 52 | −0.15 | 0.285 | 52 | −0.02 | 0.901 |
| HDL, mg/dL | 52 | −0.33 | 0.017 | 52 | −0.28 | 0.042 | 52 | −0.41 | 0.002 | 52 | −0.35 | 0.011 |
| TGA, mg/dL | 52 | 0.43 | 0.002 | 52 | 0.37 | 0.007 | 52 | 0.40 | 0.004 | 52 | 0.31 | 0.023 |
| LDL, mg/dL | 52 | 0.00 | 0.982 | 52 | 0.06 | 0.682 | 52 | −0.05 | 0.734 | 52 | 0.09 | 0.544 |
| CRP, mg/L | 58 | 0.18 | 0.176 | 58 | 0.17 | 0.213 | 58 | −0.09 | 0.512 | 58 | −0.02 | 0.859 |
| SOD, mU/mg protein | 55 | 0.33 | 0.013 | 55 | 0.39 | 0.003 | 55 | 0.38 | 0.004 | 55 | 0.40 | 0.003 |
| 3-NT, nmol/mg protein | 55 | 0.37 | 0.005 | 55 | 0.33 | 0.014 | 55 | 0.39 | 0.004 | 55 | 0.40 | 0.002 |
| AGE, AFU/mg protein | 55 | 0.00 | 0.963 | 55 | 0.02 | 0.893 | 55 | 0.11 | 0.445 | 55 | 0.03 | 0.802 |
| Amyloid, AFU/mg protein | 55 | 0.22 | 0.108 | 55 | 0.22 | 0.106 | 55 | 0.21 | 0.117 | 55 | 0.26 | 0.059 |
| AOPP, nmol/mg protein | 55 | 0.22 | 0.114 | 55 | 0.13 | 0.343 | 55 | 0.20 | 0.140 | 55 | 0.21 | 0.125 |
| CAT, nmol H2O2/min/mg protein | 55 | 0.27 | 0.044 | 55 | 0.30 | 0.027 | 55 | 0.30 | 0.028 | 55 | 0.30 | 0.024 |
| GSH, ng/mg protein | 55 | 0.17 | 0.202 | 55 | 0.21 | 0.119 | 55 | 0.27 | 0.043 | 55 | 0.27 | 0.051 |
| KN, AFU/mg protein | 55 | 0.21 | 0.189 | 55 | 0.17 | 0.203 | 55 | 0.21 | 0.123 | 55 | 0.18 | 0.193 |
| NFKN, AFU/mg protein | 55 | 0.18 | 0.193 | 55 | 0.14 | 0.307 | 55 | 0.18 | 0.179 | 55 | 0.11 | 0.437 |
| PX, mU/mg protein | 55 | 0.21 | 0.133 | 55 | 0.26 | 0.056 | 55 | 0.20 | 0.139 | 55 | 0.20 | 0.134 |
| TAC, Trolox umol/mg protein | 55 | 0.17 | 0.218 | 55 | 0.20 | 0.134 | 55 | 0.20 | 0.144 | 55 | 0.20 | 0.146 |
| TOS, nmol/mg protein | 55 | 0.19 | 0.158 | 55 | 0.27 | 0.044 | 55 | 0.19 | 0.174 | 55 | 0.20 | 0.141 |
| TRY, AFU/mg protein | 55 | 0.39 | 0.003 | 55 | 0.40 | 0.002 | 55 | 0.39 | 0.003 | 55 | 0.39 | 0.002 |
| Material | Predictors | Depression | |||
|---|---|---|---|---|---|
| log(OR) | SE | z | p | ||
| (Intercept) | −2.53 | 2.63 | −0.960 | 0.337 | |
| serum | HDL | −0.07 | 0.03 | −2.03 | 0.042 |
| TGA | 0.01 | 0.01 | 0.89 | 0.374 | |
| urine | SOD | 0.75 | 0.48 | 1.57 | 0.117 |
| 3-NT | 15.52 | 7.55 | 2.06 | 0.040 | |
| GSH | 0.12 | 0.33 | 0.37 | 0.708 | |
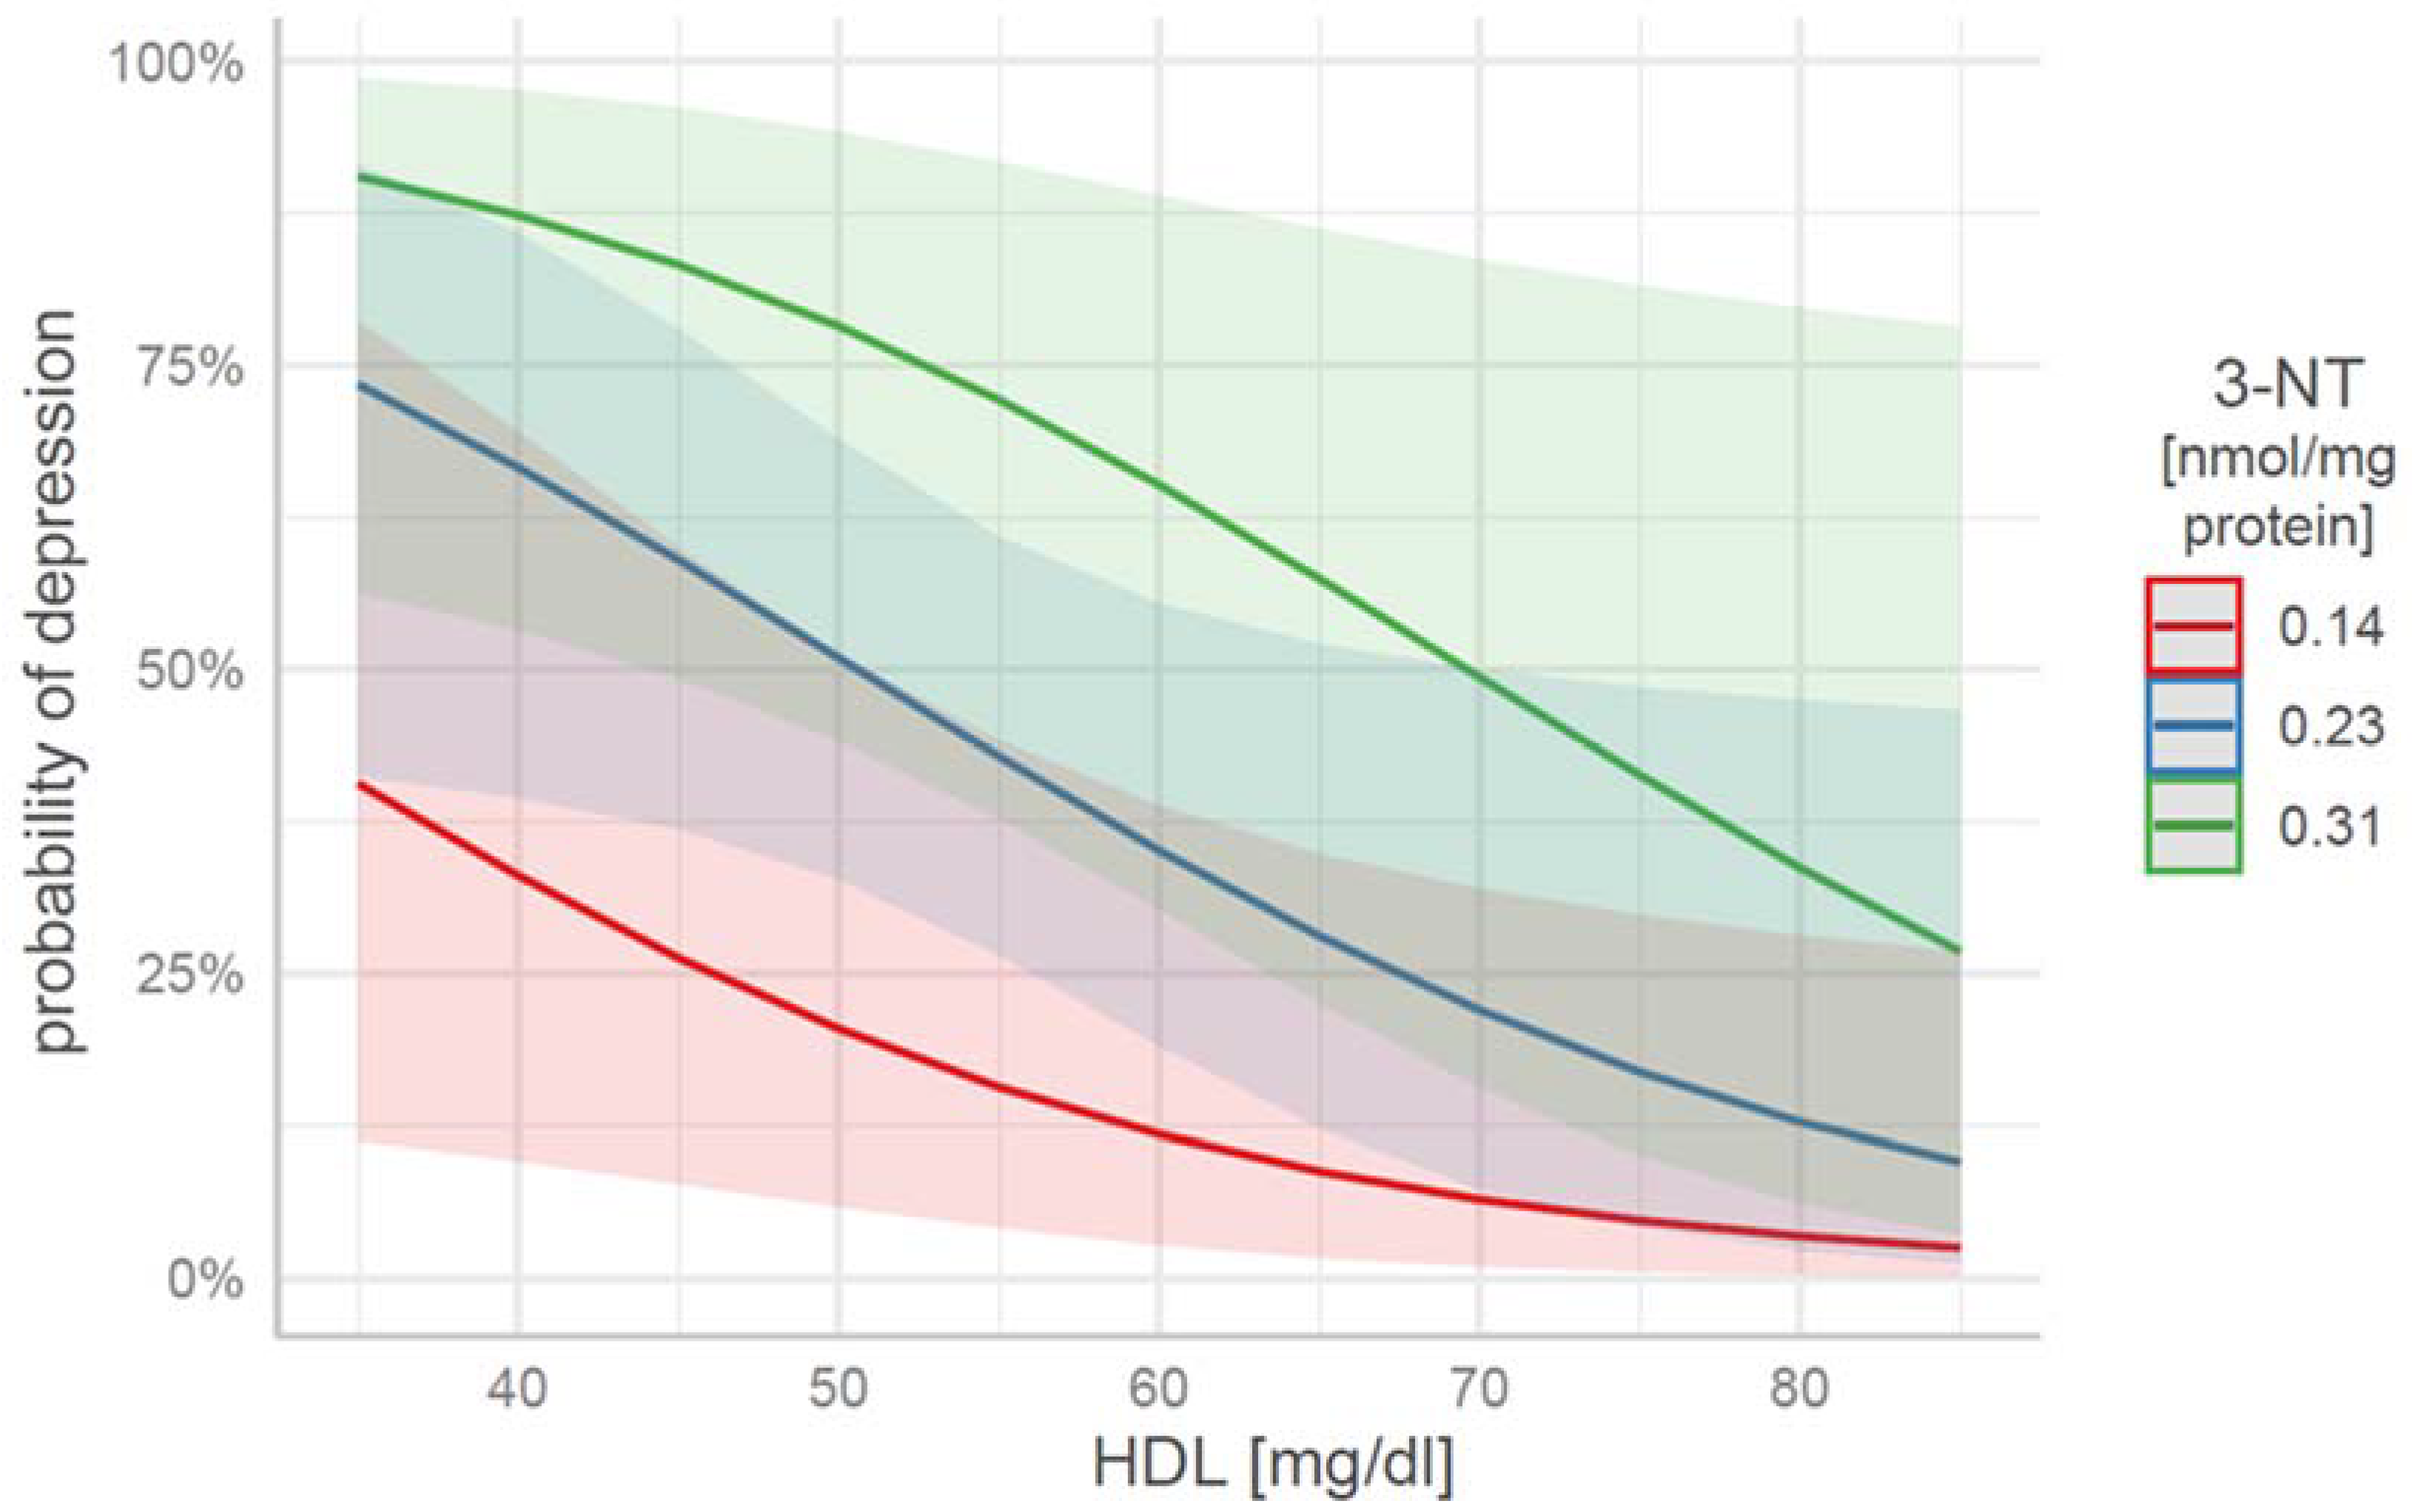
| HDL | 3-NT | Depression Probability | 95% CI ll | 95% CI ul |
|---|---|---|---|---|
| 35 | 0.14 | 0.41 | 0.11 | 0.79 |
| 35 | 0.23 | 0.73 | 0.41 | 0.92 |
| 35 | 0.31 | 0.91 | 0.56 | 0.99 |
| 60 | 0.14 | 0.11 | 0.03 | 0.39 |
| 60 | 0.23 | 0.35 | 0.19 | 0.55 |
| 60 | 0.31 | 0.65 | 0.30 | 0.89 |
| 85 | 0.14 | 0.03 | 0.00 | 0.27 |
| 85 | 0.23 | 0.10 | 0.01 | 0.47 |
| 85 | 0.31 | 0.27 | 0.04 | 0.78 |
Disclaimer/Publisher’s Note: The statements, opinions and data contained in all publications are solely those of the individual author(s) and contributor(s) and not of MDPI and/or the editor(s). MDPI and/or the editor(s) disclaim responsibility for any injury to people or property resulting from any ideas, methods, instructions or products referred to in the content. |
© 2023 by the authors. Licensee MDPI, Basel, Switzerland. This article is an open access article distributed under the terms and conditions of the Creative Commons Attribution (CC BY) license (https://creativecommons.org/licenses/by/4.0/).
Share and Cite
Nobis, A.; Zalewski, D.; Samaryn, E.; Maciejczyk, M.; Zalewska, A.; Waszkiewicz, N. Urine 3-Nitrotyrosine and Serum HDL as Potential Biomarkers of Depression. J. Clin. Med. 2023, 12, 377. https://doi.org/10.3390/jcm12010377
Nobis A, Zalewski D, Samaryn E, Maciejczyk M, Zalewska A, Waszkiewicz N. Urine 3-Nitrotyrosine and Serum HDL as Potential Biomarkers of Depression. Journal of Clinical Medicine. 2023; 12(1):377. https://doi.org/10.3390/jcm12010377
Chicago/Turabian StyleNobis, Aleksander, Daniel Zalewski, Eliza Samaryn, Mateusz Maciejczyk, Anna Zalewska, and Napoleon Waszkiewicz. 2023. "Urine 3-Nitrotyrosine and Serum HDL as Potential Biomarkers of Depression" Journal of Clinical Medicine 12, no. 1: 377. https://doi.org/10.3390/jcm12010377