
Hashimoto Thyroiditis, but Not Hypothyroidism Due to Other Causes, Is Associated with Lower Phase Angle Score in Adult Women: A Pilot Cross-Sectional Study
 , , and
Abstract
:1. Introduction
2. Materials and Methods
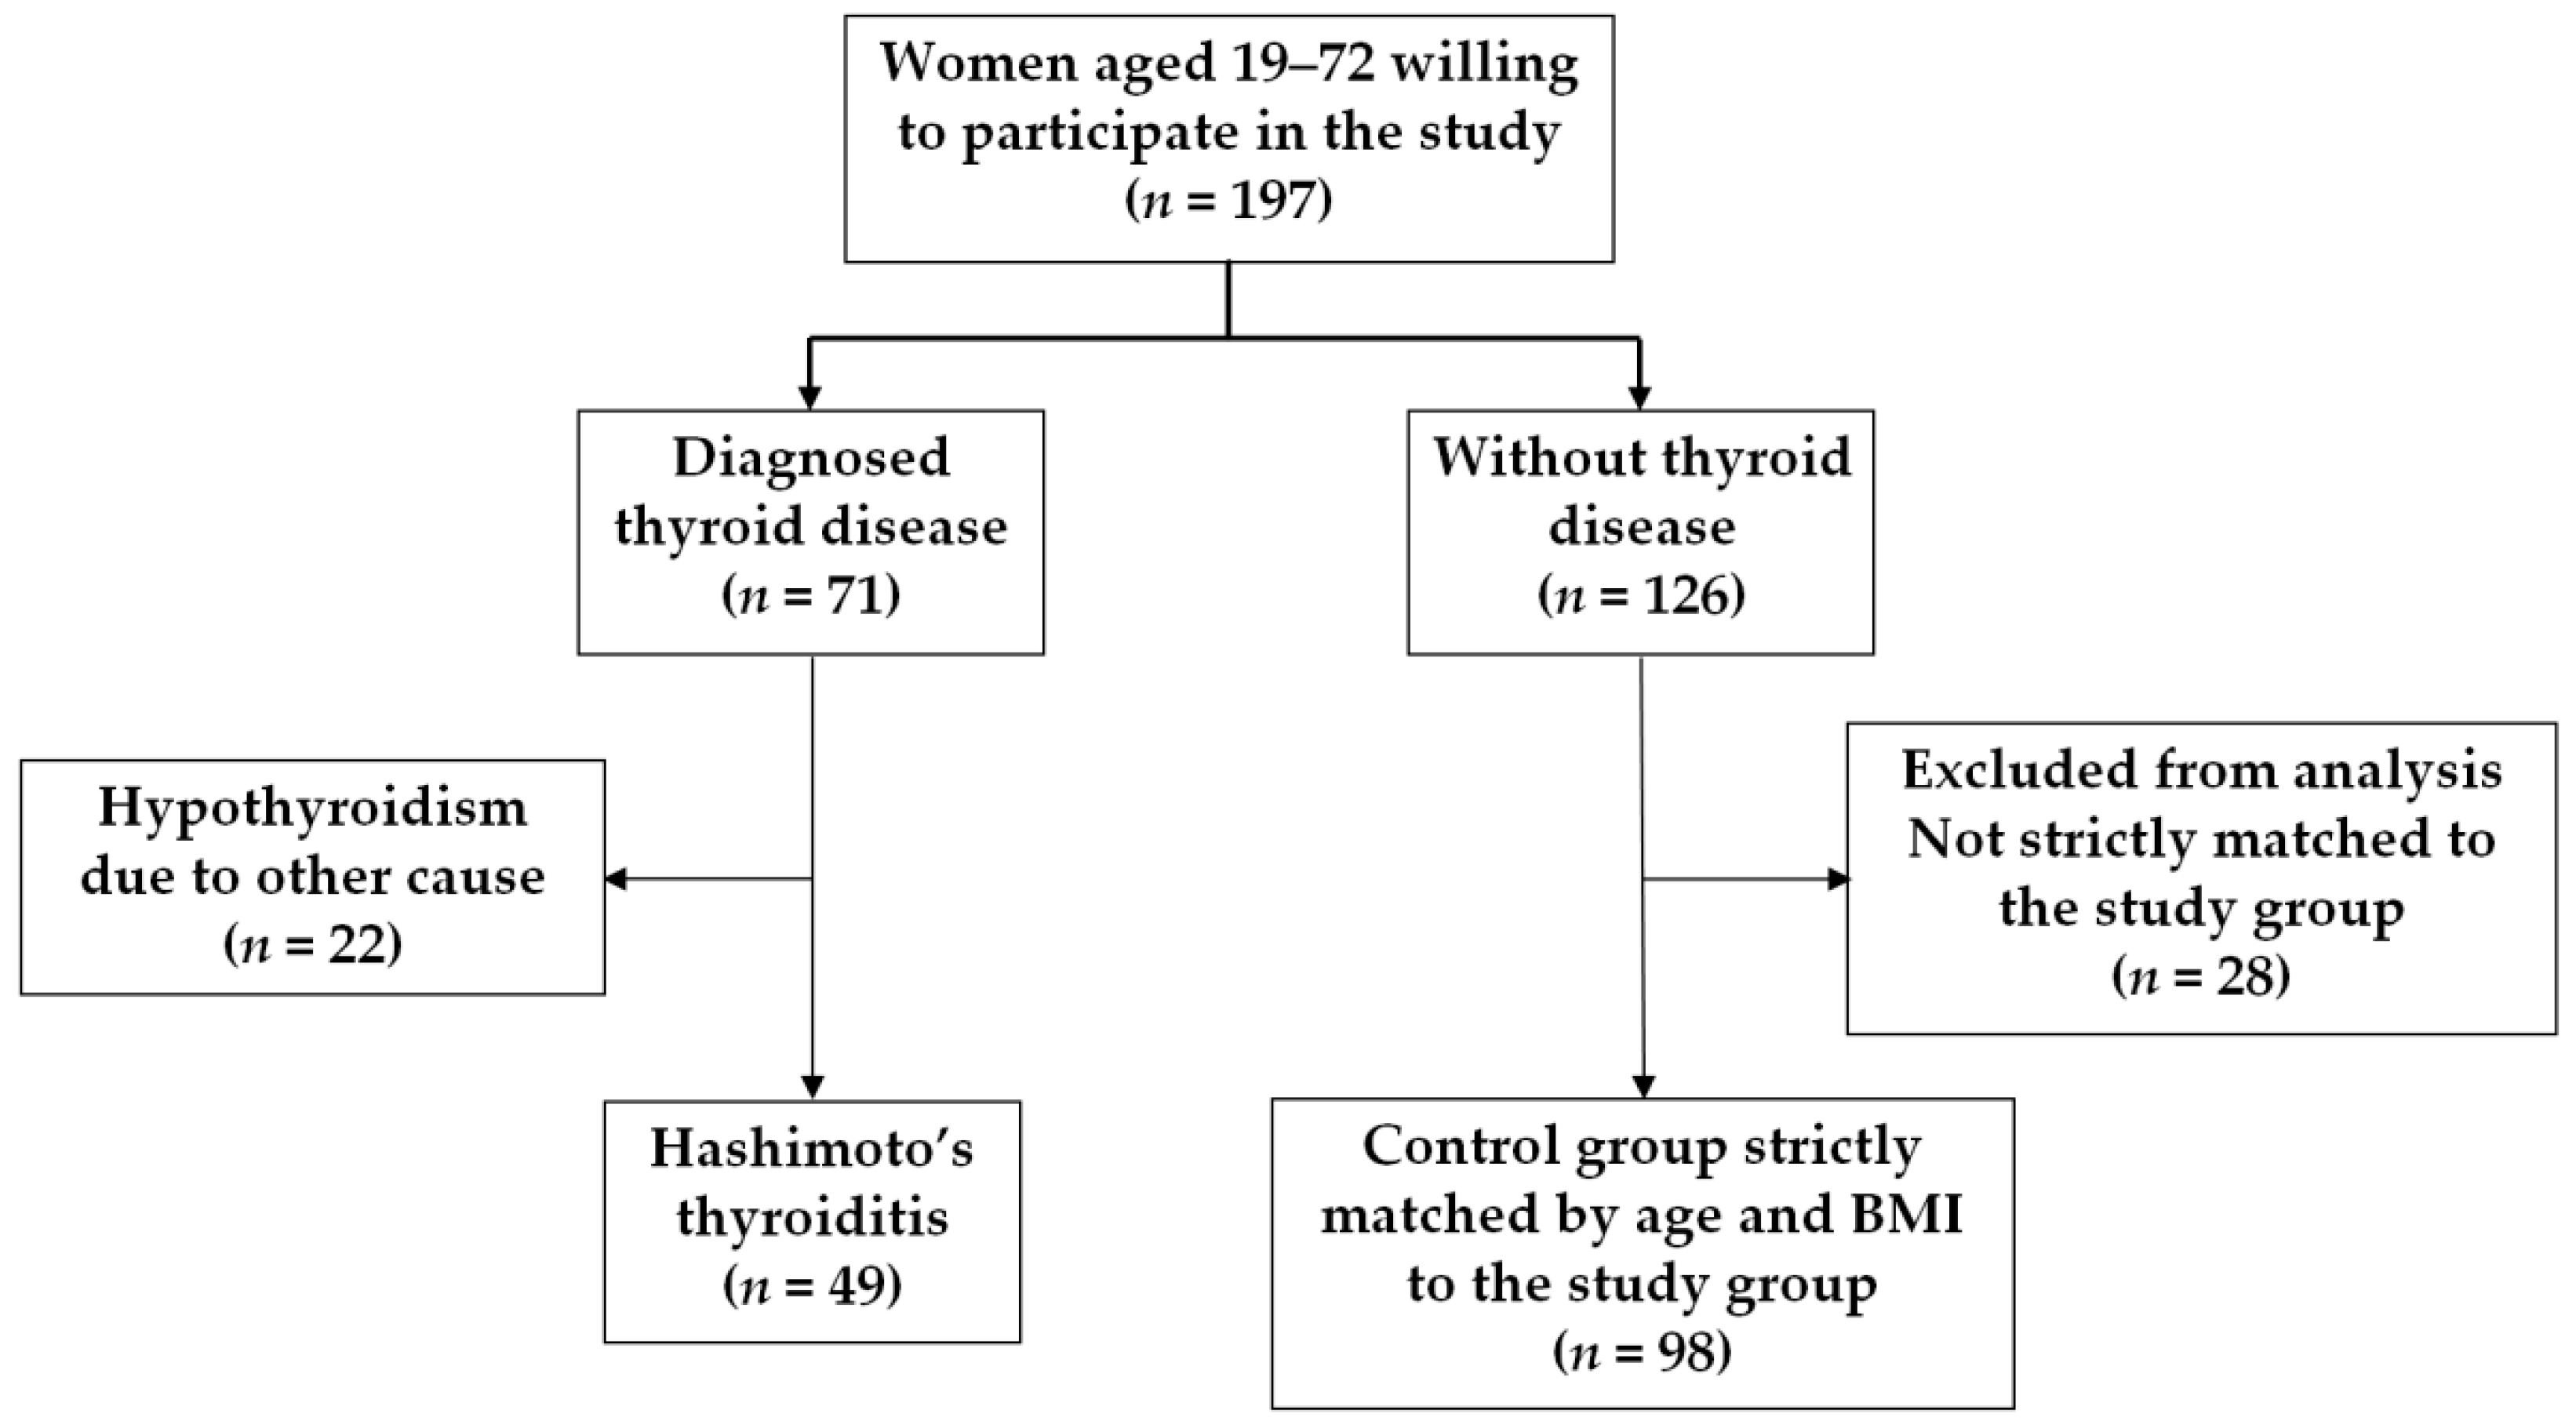
2.1. Study Subjects
2.2. Anthropometric Measurements and Bioelectrical Impedance Analysis
2.3. Laboratory Tests
2.4. Statistical Analysis
3. Results
4. Discussion
5. Conclusions
Author Contributions
Funding
Institutional Review Board Statement
Informed Consent Statement
Data Availability Statement
Conflicts of Interest
References
- Weetman, A.P. An update on the pathogenesis of Hashimoto’s thyroiditis. J. Endocrinol. Investig. 2021, 44, 883–890. [Google Scholar] [CrossRef] [PubMed]
- Ragusa, F.; Fallahi, P.; Elia, G.; Gonnella, D.; Paparo, S.R.; Giusti, C.; Churilov, L.P.; Ferrari, S.M.; Antonelli, A. Hashimotos’ thyroiditis: Epidemiology, pathogenesis, clinic and therapy. Best Pract. Res. Clin. Endocrinol. Metab. 2019, 33, 101367. [Google Scholar] [CrossRef]
- Ralli, M.; Angeletti, D.; Fiore, M.; D’Aguanno, V.; Lambiase, A.; Artico, M.; de Vincentiis, M.; Greco, A. Hashimoto’s thyroiditis: An update on pathogenic mechanisms, diagnostic protocols, therapeutic strategies, and potential malignant transformation. Autoimmun. Rev. 2020, 19, 102649. [Google Scholar] [CrossRef] [PubMed]
- Ajjan, R.A.; Weetman, A.P. The pathogenesis of Hashimoto’s thyroiditis: Further developments in our understanding. Horm. Metab. Res. 2015, 47, 702–710. [Google Scholar] [CrossRef] [Green Version]
- Hermann, L. Über Eine Wirkung Galvanischer Ströme auf Muskeln und Nerven Pflugers. Arch. Gesamte. Physiol. 1871, 5, 223–275. [Google Scholar] [CrossRef]
- Kyle, U.G.; Bosaeus, I.; De Lorenzo, A.D.; Deurenberg, P.; Elia, M.; Gómez, J.M.; Heitmanng, B.L.; Kent-Smithh, L.; Melchiori, J.C.; Pirlichj, M.; et al. Bioelectrical impedance analysis—Part I: Review of principles and methods. Clin. Nutr. 2004, 23, 1226–1243. [Google Scholar] [CrossRef]
- Norman, K.; Stobäus, N.; Pirlich, M.; Bosy-Westphal, A. Bioelectrical phase angle and impedance vector analysis—Clinical relevance and applicability of impedance parameters. Clin. Nutr. 2012, 31, 854–861. [Google Scholar] [CrossRef]
- Ribeiro Streba, A.; Hansenb, F.; Gabiattib, P.M.; Tozettoa, R.W. Phase angle associated with different indicators of health-related physical fitness in adults with obesity. Physiol. Behav. 2020, 225, 113104. [Google Scholar] [CrossRef] [PubMed]
- Kyle, U.G.; Soundar, E.P.; Genton, L.; Pichard, C. Can phase angle determined by bioelectrical impedance analysis assess nutritional risk? A comparison between healthy and hospitalized subjects. Clin. Nutr. 2012, 31, 875–881. [Google Scholar] [CrossRef]
- Skrzypek, M.; Szponar, B.; Drop, B.; Panasiuk, L.; Malm, M. Anthropometric, body composition and behavioural predictors of bioelectrical impedance phase angle in Polish young adults—Preliminary results. Ann. Agric. Environ. Med. 2020, 27, 91–98. [Google Scholar] [CrossRef]
- Mialich, S.M.; Faccioli Sicchieri, J.M.; Jordao, A.A. Analysis of body composition: Critical review of the use of bioelectrical impedance analysis. Int. J. Clin. Nutr. 2014, 2, 1–10. [Google Scholar] [CrossRef]
- Barbosa-Silva, M.C.; Barros, A.J.; Wang, J.; Heymsfield, S.B.; Pierson, R.N., Jr. Bioelectrical impedance analysis: Population reference values for phase angle by age and sex. Am. J. Clin. Nutr. 2005, 82, 49–52. [Google Scholar] [CrossRef] [PubMed]
- Khalil, S.F.; Mohktar, M.S.; Ibrahim, F. The theory and fundamentals of bioimpedance analysis in clinical status monitoring and diagnosis of diseases. Sensors 2014, 14, 10895–10928. [Google Scholar] [CrossRef] [PubMed] [Green Version]
- Kumar, S.; Dutt, A.; Hemraj, S.; Bhat, S.; Manipadybhima, B. Phase angle measurement in healthy human subjects through bio-impedance analysis. Iran. J. Basic Med. Sci. 2012, 15, 1180–1184. [Google Scholar]
- Selberg, O.; Selberg, D. Norms and correlates of bioimpedance phase angle in healthy human subjects, hospitalized patients, and patients with liver cirrhosis. Eur. J. Appl. Physiol. 2002, 86, 509–516. [Google Scholar] [CrossRef] [Green Version]
- Cederholm, T.; Barazzoni, R.; Austin, P.; Ballmer, P.; Biolo, G.; Bischoff, S.C.; Compher, C.; Correia, I.; Higashiguchi, T.; Holst, M.; et al. ESPEN guidelines on definitions and terminology of clinical nutrition. Clin. Nutr. 2017, 36, 49–64. [Google Scholar] [CrossRef]
- Rinninella, E.; Ruggiero, A.; Maurizi, P.; Triarico, S.; Cintoni, M.; Mele, M.C. Clinical tools to assess nutritional risk and malnutrition in hospitalized children and adolescents. Eur. Rev. Med. Pharmacol. Sci. 2017, 21, 2690–2701. [Google Scholar]
- Arab, A.; Karimi, E.; Vingrys, K.; Shirani, F. Is phase angle a valuable prognostic tool in cancer patients’ survival? A systematic review and meta-analysis of available literature. Clin. Nutr. 2021, 27, 3182–3190. [Google Scholar] [CrossRef]
- Cichoż-Lach, H.; Michalak, A.A. Comprehensive Review of Bioelectrical Impedance Analysis and Other. Methods in the Assessment of Nutritional Status in Patients with Liver Cirrhosis. Gastroenterol. Res. Pract. 2017, 2017, 6765856. [Google Scholar] [CrossRef]
- Han, B.G.; Lee, J.Y.; Kim, J.S.; Yang, J.W. Decreased Bioimpedance Phase Angle in Patients with Diabetic Chronic Kidney Disease Stage 5. Nutrients 2019, 11, 2874. [Google Scholar] [CrossRef] [Green Version]
- Więch, P.; Dąbrowski, M.; Bazaliński, D.; Sałacińska, I.; Korczowski, B.; Binkowska-Bury, M. Bioelectrical Impedance Phase Angle as an Indicator of Malnutrition in Hospitalized Children with Diagnosed Inflammatory Bowel Diseases—A Case Control Study. Nutrients 2018, 10, 499. [Google Scholar] [CrossRef] [PubMed] [Green Version]
- Barrea, L.; Macchia, P.E.; Di Somma, C.; Napolitano, M.; Balato, A.; Falco, A.; Savanelli, M.C.; Balato, N.; Colao, A.; Savastano, S. Bioelectrical phase angle and psoriasis: A novel association with psoriasis severity, quality of life and metabolic syndrome. J. Transl. Med. 2016, 10, 130. [Google Scholar] [CrossRef] [PubMed]
- Dittmar, M.; Reber, H.; Kahaly, G.J. Bioimpedance phase angle indicates catabolism in Type 2 diabetes. Diabet. Med. 2015, 32, 1177–1185. [Google Scholar] [CrossRef]
- Więch, P.; Bazaliński, D.; Sałacińska, I.; Binkowska-Bury, M.; Korczowski, B.; Mazur, A.; Kózka, M.; Dąbrowski, M. Decreased Bioelectrical Impedance Phase Angle in Hospitalized Children and Adolescents with Newly Diagnosed Type 1 Diabetes: A Case-Control Study. J. Clin. Med. 2018, 7, 516. [Google Scholar] [CrossRef] [Green Version]
- Colín-Ramírez, E.; Castillo-Martínez, L.; Orea-Tejeda, A.; Vázquez-Durán, M.; Rodríguez, A.E.; Keirns-Davis, C. Bioelectrical impedance phase angle as a prognostic marker in chronic heart failure. Nutrition 2012, 28, 901–905. [Google Scholar] [CrossRef]
- Matthews, D.R.; Hosker, J.P.; Rudenski, A.S.; Naylor, B.A.; Treacher, D.F.; Turner, R.C. Homeostasis model assessment: IR and beta-cell function from fasting plasma glucose and insulin concentration in man. Diabetologia 1985, 28, 412–419. [Google Scholar] [CrossRef] [PubMed] [Green Version]
- Bosy-Westphal, A.; Danielzik, S.; Dörhöfer, R.P.; Later, W.; Wiese, S.; Müller, M.J. Phase Angle from Bioelectrical Impedance Analysis: Population Reference Values by Age, Sex, and Body Mass Index. J. Parenter. Enter. Nutr. 2006, 30, 309–316. [Google Scholar] [CrossRef]
- Pyzik, A.; Grywalska, E.; Matyjaszek-Matuszek, B.; Roliński, J. Immune disorders in Hashimoto’s thyroiditis: What do we know so far? J. Immunol. Res. 2015, 2015, 979167. [Google Scholar] [CrossRef] [Green Version]
- Feldt-Rasmussen, U. Hashimoto’s thyroiditis as a risk factor for thyroid cancer. Curr. Opin. Endocrinol. Diabetes Obes. 2020, 27, 364–371. [Google Scholar] [CrossRef]
- Valderrama-Hinds, L.M.; García-Carrión, E.; Hernández, E.; Agostini, M.I.; Reyes-Morales, O.R.; Fung, L.; Al Snih, S.; Rodríguez, M.A. Prevalence of undifferentiated inflammatory arthropathy in patients with Hashimoto’s thyroiditis in an endocrinology clinic. Int. J. Rheum. Dis. 2019, 11, 1985–1989. [Google Scholar] [CrossRef]
- Giuffrida, G.; Bagnato, G.; Campennì, A.; Giovinazzo, S.; Keller, K.P.; Alibrandi, A.; Roberts, W.N.; Trimarchi, F.; Ruggeri, R.M. Non-specific rheumatic manifestations in patients with Hashimoto’s thyroiditis: A pilot cross-sectional study. J. Endocrinol. Investig. 2020, 43, 87–94. [Google Scholar] [CrossRef] [PubMed]
- Churilov, L.P.; Sobolevskaia, P.A.; Stroev, Y.I. Thyroid gland and brain: Enigma of Hashimoto’s encephalopathy. Best Pract. Res. Clin. Endocrinol. Metab. 2019, 6, 101364. [Google Scholar] [CrossRef] [PubMed]
- De Leo, S.; Pearce, E.N. Autoimmune thyroid disease during pregnancy. Lancet Diabetes Endocrinol. 2018, 7, 575–586. [Google Scholar] [CrossRef] [PubMed]
- Łukawska-Tatarczuk, M.M.; Zieliński, J.; Franek, E.; Czupryniak, L.; Mrozikiewicz-Rakowska, B. Is thyroid autoimmunity associated with subclinical atherosclerosis in young women with type 1 diabetes mellitus? Czy autoimmunizacja tarczycy jest związana z subkliniczną miażdżycą u młodych kobiet z cukrzycą typu 1? Endokrynol. Pol. 2022, 73, 301–308. [Google Scholar] [CrossRef]
- Więch, P.; Chmiel, Z.; Bazaliński, D.; Sałacińska, I.; Bartosiewicz, A.; Mazur, A.; Korczowski, B.; Binkowska-Bury, M.; Dąbrowski, M. The Relationship between Body Composition and a Gluten Free Diet in Children with Celiac Disease. Nutrients 2018, 10, 1817. [Google Scholar] [CrossRef] [Green Version]
- Werkstetter, K.J.; Ullrich, J.; Schatz, S.B.; Prell, C.; Koletzko, B.; Koletzko, S. Lean body mass, physical activity and quality of life in paediatric patients with inflammatory bowel disease and in healthy controls. J. Crohn’s Colitis 2012, 6, 665–673. [Google Scholar] [CrossRef] [Green Version]
- Wiskin, A.E.; Wootton, S.A.; Hunt, T.M.; Cornelius, V.R.; Afzal, N.A.; Jackson, A.A.; Beattie, R.M. Body composition in childhood inflammatory bowel disease. Clin. Nutr. 2011, 30, 112–115. [Google Scholar] [CrossRef]
- Back, I.R.; Marcon, S.S.; Gaino, N.M.; Vulcano, D.S.B.; Dorna, M.S.; Sassaki, L.Y. Body composition in patients with Crohn’s disease and ulcerative colitis. Arq. Gastroenterol. 2017, 54, 109–114. [Google Scholar] [CrossRef] [Green Version]
- Cioffi, I.; Marra, M.; Imperatore, N.; Pagano, M.C.; Santarpia, L.; Alfonsi, L.; Testa, A.; Sammarco, R.; Contaldo, F.; Castiglione, F.; et al. Assessment of bioelectrical phase angle as a predictor of nutritional status in patients with Crohn’s disease: A cross sectional study. Clin. Nutr. 2020, 39, 1564–1571. [Google Scholar] [CrossRef] [Green Version]
- Emerenziani, S.; Biancone, L.; Guarino, M.P.L.; Balestrieri, P.; Stasi, E.; Ribolsi, M.; Rescio, M.P.; Altomare, A.; Cocca, S.; Pallone, F.; et al. Nutritional status and bioelectrical phase angle assessment in adult Crohn disease patients receiving anti-TNFα therapy. Dig. Liver Dis. 2017, 49, 495–499. [Google Scholar] [CrossRef]
- Sammarco, R.; Marra, M.; Pagano, M.C.; Alfonsi, L.; Santarpia, L.; Cioffi, I.; Contaldo, F.; Pasanisi, F. Resting energy expenditure in adult patients with Crohn’s disease. Clin. Nutr. 2017, 36, 467–470. [Google Scholar] [CrossRef] [PubMed] [Green Version]
- Pineda-Juárez, J.A.; Lozada-Mellado, M.; Ogata-Medel, M.; Hinojosa-Azaola, A.; Santillán-Díaz, C.; Llorente, L.; Orea-Tejeda, A.; Alcocer-Varela, J.; Espinosa-Morales, R.; González-Contreras, M.; et al. Body composition evaluated by body mass index and bioelectrical impedance vector analysis in women with rheumatoid arthritis. Nutrition 2018, 53, 49–53. [Google Scholar] [CrossRef] [PubMed]
- Galluzzo, M.; D’Adamio, S.; Pastorino, R.; Andreoli, A.; Servoli, S.; Bianchi, L.; Talamonti, M. Effect of anti IL-12/23 on body composition: Results of bioelectrical impedance analysis in Caucasian psoriatic patients. Expert. Opin. Biol. Ther. 2018, 18, 229–235. [Google Scholar] [CrossRef] [PubMed]
- Maurizi, G.; Della Guardia, L.; Maurizi, A.; Poloni, A. Adipocytes properties and crosstalk with immune system in obesity-related inflammation. J. Cell. Physiol. 2018, 233, 88–97. [Google Scholar] [CrossRef] [PubMed]
- Pham-Huy, L.A.; He, H.; Pham-Huy, C. Free radicals, antioxidants in disease and health. Int. J. Biomed. Sci. 2008, 4, 89–96. [Google Scholar] [PubMed]
- Stobäus, N.; Pirlich, M.; Valentini, L.; Schulzke, J.; Norman, K. Determinants of bioelectrical phase angle in disease. Br. J. Nutr. 2012, 107, 1217–1220. [Google Scholar] [CrossRef] [Green Version]
- Chen, G.; Lv, Y.; Ni, W.; Shi, Q.; Xiang, X.; Li, S.; Song, C.; Xiao, M.; Jin, S. Associations between Phase Angle Values Obtained by Bioelectrical Impedance Analysis and Nonalcoholic Fatty Liver Disease in an Overweight Population. Can. J. Gastroenterol. Hepatol. 2020, 4, 8888405. [Google Scholar] [CrossRef]


| Parameter | Thyroiditis, n = 49 Mean ± SD * | Control, n = 98 Mean ± SD * | p Value |
|---|---|---|---|
| Age (years) | 35.12 ± 7.82 | 35.12 ± 8.32 | 0.847 |
| BMI (kg/m2) | 30.16 ± 6.15 | 31.35 ± 5.65 | 0.131 |
| Normal weight (BMI < 25.0 kg/m2), n (%) | 9 (18.4) | 11 (11.2) | 0.322 |
| Overweight (BMI 25.0–29.9 kg/m2), n (%) | 18 (36.7) | 29 (29.6) | |
| Obesity gr. I (BMI 30.0–34.9 kg/m2), n (%) | 12 (24.5) | 37 (37.8) | |
| Obesity gr. II/III (BMI ≥ 35.0 kg/m2), n (%) | 10 (20.4) | 21 (21.4) | |
| TSH (μIU/L) | 2.26 ± 1.33 | 1.79 ± 0.87 | 0.035 |
| Insulin (μIU/L) | 13.22 ± 8.65 | 12.80 ± 7.04 | 0.662 |
| Glucose (mg/dL) | 90.41 ± 7.49 | 89.18 ± 8.33 | 0.387 |
| HOMA-IR | 3.00 ± 2.07 | 2.86 ± 1.71 | 0.823 |
| Parameter | Thyroiditis, n = 49 Mean ± SD * | Control, n = 98 Mean ± SD * | p Value |
|---|---|---|---|
| Fat mass (kg) | 31.48 ± 11.47 | 29.27 ± 8.64 | 0.936 |
| Fat mass (%) | 36.56 ± 6.84 | 34.92 ± 5.57 | 0.418 |
| Fat-free mass (kg) | 52.05 ± 5.82 | 52.85 ± 6.36 | 0.155 |
| Fat-free mass (%) | 63.44 ± 6.85 | 65.09 ± 5.57 | 0.410 |
| Muscle mass (kg) | 49.42 ± 5.52 | 50.18 ± 6.05 | 0.156 |
| Muscle mass (%) | 60.24 ± 6.50 | 61.79 ± 5.28 | 0.415 |
| Total body water (kg) | 37.29 ± 4.15 | 37.85 ± 4.49 | 0.166 |
| Total body water (%) | 45.45 ± 4.90 | 46.62 ± 4.01 | 0.383 |
| Extracellular body water (kg) | 16.72 ± 2.33 | 16.70 ± 2.21 | 0.305 |
| Extracellular body water (%) | 20.25 ± 1.37 | 20.49 ± 1.12 | 0.728 |
| Intracellular body water (kg) | 20.56 ± 1.99 | 21.15 ± 2.40 | 0.109 |
| Intracellular body water (%) | 25.20 ± 3.55 | 26.13 ± 2.92 | 0.420 |
| Bone mass (kg) | 2.63 ± 0.29 | 2.67 ± 0.32 | 0.162 |
| Bone mass (%) | 3.20 ± 0.35 | 3.29 ± 0.29 | 0.410 |
| Visceral fat index | 6.80 ± 3.23 | 6.36 ± 2.75 | 0.861 |
| Impedance (ohm) | 636.20 ± 68.97 | 604.54 ± 66.29 | 0.008 |
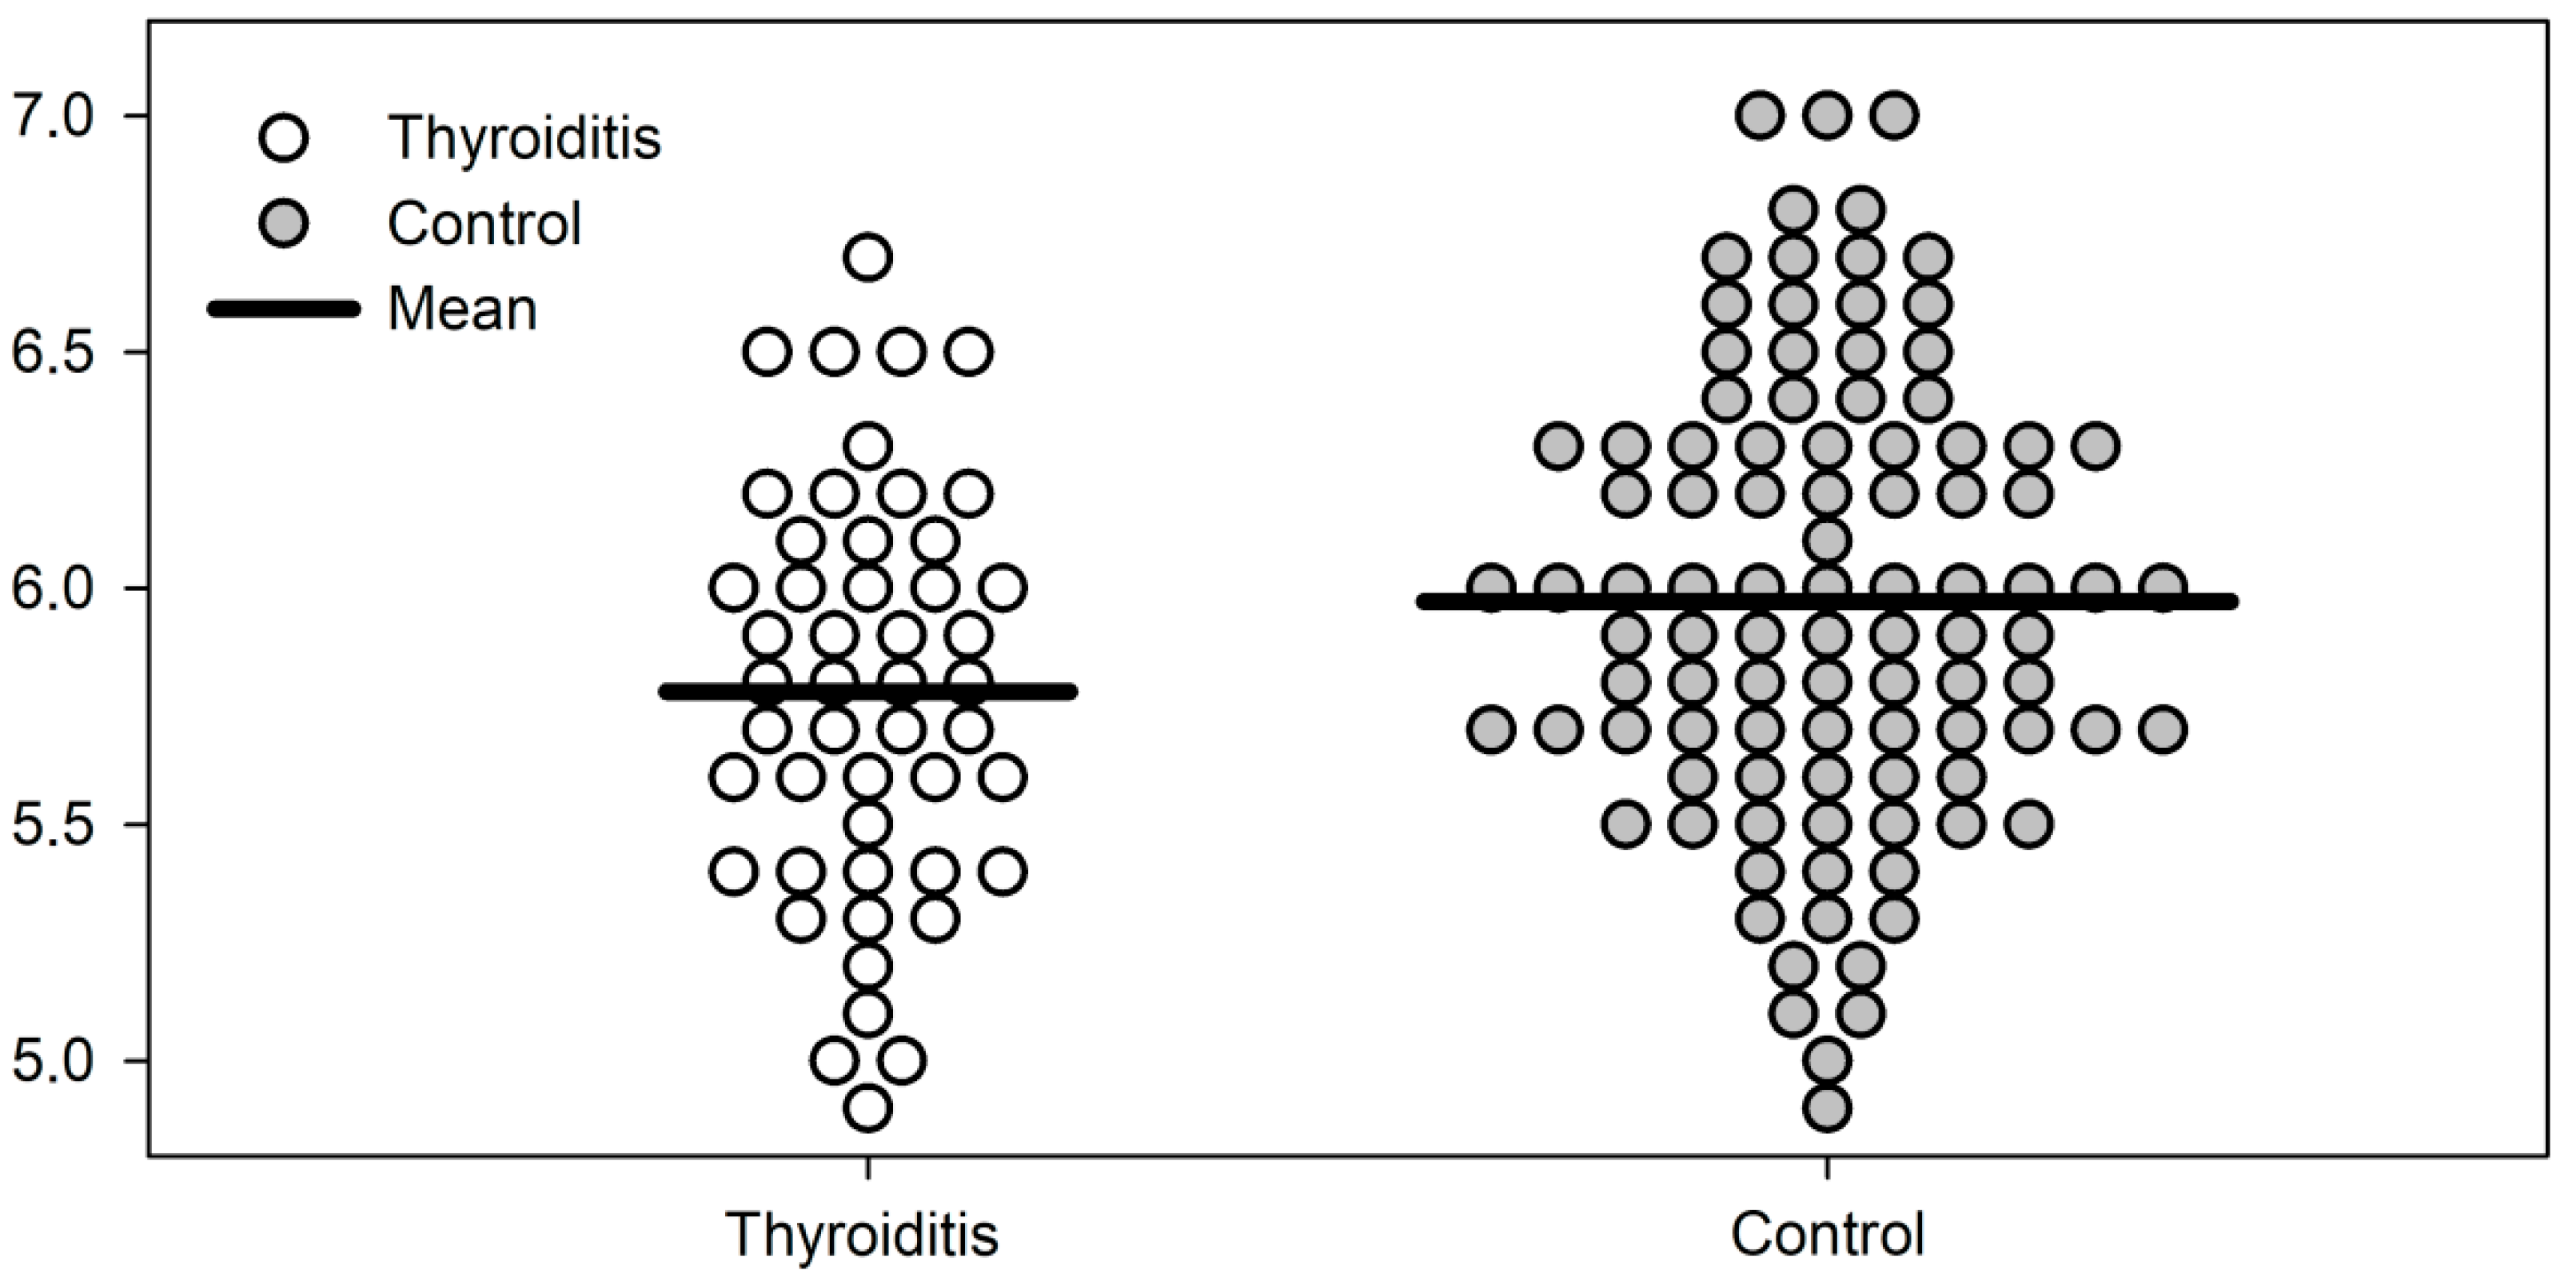
| Phase angle | 5.78 ± 0.43 | 5.98 ± 0.49 | 0.017 |
| <10th percentile, n (%) | 9 (18.4) | 7 (7.1) | 0.075 |
| Normal, n (%) | 40 (81.6) | 91 (92.9) |
| Parameter | Thyroiditis, n = 49 | Control, n = 98 | p Value | ||
|---|---|---|---|---|---|
| n | Phase Angle Mean ± SD * | n | Phase Angle Mean ± SD * | ||
| Normal weight (BMI < 25.0 kg/m2) | 9 | 5.49 ± 0.38 | 14 | 5.71 ± 0.40 | 0.191 |
| Overweight (BMI 25.0–29.9 kg/m2) | 18 | 5.91 ± 0.41 | 33 | 5.86 ± 0.57 | 0.728 |
| Obesity gr. I (BMI 30.0–34.9 kg/m2) | 12 | 5.78 ± 0.55 | 34 | 6.06 ± 0.42 | 0.080 |
| Obesity gr. II/III (BMI ≥ 35.0 kg/m2) | 10 | 5.81 ± 0.26 | 17 | 6.29 ± 0.34 | <0.001 |
| Parameter | Hypothyroidism, n = 22 Mean ± SD * | No Thyroid Disease, n = 126 Mean ± SD * | p Value |
|---|---|---|---|
| Age (years) | 37.46 ± 11.36 | 37.06 ± 10.97 | 0.989 |
| BMI (kg/m2) | 32.69 ± 9.62 | 31.20 ± 5.71 | 0.686 |
| Normal, n (%) | 5 (22.7) | 14 (11.1) | 0.222 |
| Overweight, n (%) | 4 (18.2) | 40 (31.7) | |
| Obesity gr. I, n (%) | 6 (27.3) | 45 (35.7) | |
| Obesity gr. II/III, n (%) | 7 (31.8) | 27 (21.4) | |
| TSH (μIU/L) | 1.91 ± 1.05 | 1.77 ± 0.87 | 0.436 |
| Insulin (μIU/L) | 13.63 ± 14.72 | 12.73 ± 6.69 | 0.310 |
| Glucose (mg/dL) | 94.90 ± 10.01 | 91.51 ± 14.89 | 0.017 |
| HOMA-IR | 3.16 ± 3.33 | 2.94 ± 1.74 | 0.746 |
| Parameter | Hypothyroidism, n = 22 Mean ± SD * | No Thyroid Disease, n = 126 Mean ± SD * | p Value |
|---|---|---|---|
| Impedance (Ω) | 600.05 ± 96.45 | 596.17 ± 69.39 | 0.821 |
| Phase angle | 5.99 ± 0.64 | 5.88 ± 0.51 | 0.375 |
| <10th percentile, n (%) | 0 (0) | 13 (10.3) | 0.242 |
| Normal, n (%) | 22 (100) | 113 (89.7) |
Disclaimer/Publisher’s Note: The statements, opinions and data contained in all publications are solely those of the individual author(s) and contributor(s) and not of MDPI and/or the editor(s). MDPI and/or the editor(s) disclaim responsibility for any injury to people or property resulting from any ideas, methods, instructions or products referred to in the content. |
© 2022 by the authors. Licensee MDPI, Basel, Switzerland. This article is an open access article distributed under the terms and conditions of the Creative Commons Attribution (CC BY) license (https://creativecommons.org/licenses/by/4.0/).
Share and Cite
Polak-Szczybyło, E.; Stępień, A.E.; Zielińska, M.; Dąbrowski, M. Hashimoto Thyroiditis, but Not Hypothyroidism Due to Other Causes, Is Associated with Lower Phase Angle Score in Adult Women: A Pilot Cross-Sectional Study. J. Clin. Med. 2023, 12, 56. https://doi.org/10.3390/jcm12010056
Polak-Szczybyło E, Stępień AE, Zielińska M, Dąbrowski M. Hashimoto Thyroiditis, but Not Hypothyroidism Due to Other Causes, Is Associated with Lower Phase Angle Score in Adult Women: A Pilot Cross-Sectional Study. Journal of Clinical Medicine. 2023; 12(1):56. https://doi.org/10.3390/jcm12010056
Chicago/Turabian StylePolak-Szczybyło, Ewelina, Agnieszka Ewa Stępień, Magdalena Zielińska, and Mariusz Dąbrowski. 2023. "Hashimoto Thyroiditis, but Not Hypothyroidism Due to Other Causes, Is Associated with Lower Phase Angle Score in Adult Women: A Pilot Cross-Sectional Study" Journal of Clinical Medicine 12, no. 1: 56. https://doi.org/10.3390/jcm12010056