Abstract
Objectives and Background: Gestational diabetes (GDM) is a common pregnancy complication defined as a glucose intolerance diagnosis during pregnancy. GDM is strongly associated with adverse fetal and maternal outcomes. In Germany, to screen and diagnose GDM we use a 1 h 50 g oGCT (oral glucose challenge test) followed by a 2 h 75 g oGTT if the first was pathological. This analysis examines the correlation of 75 g oGTT glucose levels and fetomaternal outcome. Methods: Data from 1664 patients from a gestational diabetes consultation clinic at the Charité University Hospital in Berlin, Germany, were analyzed retrospectively from 2015 to 2022. The 75 g oGTT blood glucose levels were categorized into isolated fasting hyperglycemia (GDM-IFH), isolated post-load hyperglycemia (GDM-IPH) and combined hyperglycemia (GDM-CH), using the levels of the fasting, 1 h and 2 h values, after glucose application. These subtypes were compared based on their baseline characteristics as well as fetal and maternal outcome. Results: GDM-IFH and GDM-CH women displayed higher pre-conceptional BMI and required insulin therapy more frequently (p < 0.001). The GDM-IFH group was at higher risk of having a primary cesarean section (p = 0.047), while GDM-IPH women were significantly more likely to have an emergent cesarean section (p = 0.013). The offspring of GDM-IFH and GDM-CH women were born with a significantly higher mean birthweight (p < 0.001) and birth weight percentiles (p < 0.001) and were at increased risk of being large for gestational age (LGA) (p = 0.004). Women from the GDM-IPH group delivered significantly more neonates who were small for gestational age (p = 0.027) or with low fetal weight <30th percentile (p = 0.003). Conclusion: This analysis shows a strong association between the glucose response pattern in the 75 g oGTT and adverse perinatal fetomaternal outcome. The differences among the subgroups, specifically concerning insulin therapy, mode of delivery and fetal growth, suggest an individualized approach to prenatal care after a GDM diagnosis.
1. Introduction
Gestational diabetes mellitus (GDM) is a common complication during pregnancy. In Germany, the incidence of GDM rose from 4.6% of all hospital deliveries in 2013 to 6.8% in 2018 [1]. GDM is defined as an impairment of glucose tolerance that has been diagnosed for the first time during pregnancy [2]. With its prevalence rising, and its well-known associations with other various pregnancy complications such as pre-eclampsia, cesarean section (CS), macrosomia, shoulder dystocia, childbirth injury, postpartum hemorrhage or premature birth, understanding GDM fully is key to improve prenatal care and minimize the risks for mother and child [3,4,5,6,7]. GDM is still, generally, treated as a homogenous disease during pregnancy, although research indicates that a more differentiated approach might be needed, as phenotypical subtypes of the condition seem to be associated with different perinatal outcomes. A possible approach that has been suggested is to focus on the extent of insulin sensitivity and insulin secretion impairment or to differentiate between the two [8,9,10,11]. Another, possibly more practicable, approach is to differentiate GDM subtypes based on the glucose levels observed in the three-point 75 g oral glucose tolerance test (oGTT), which is conducted in the late second to early third trimester of pregnancy and comprises fasting blood glucose measurements, one and two hours after the ingestion of a 75 g glucose solution (Figure 1) [2]. These measurements are widely available through the prenatal file and are, therefore, easy to access. The HAPO study demonstrated an association of maternal plasma glucose levels with large for gestational age (LGA) offspring, primary CS, shoulder dystocia or birth injury, pre-eclampsia and other adverse outcomes [12]. Therefore, the correlation of 75 g oGTT glucose values and fetomaternal outcome has been the subject of several studies [5,13,14,15]. The aim of our study is to corroborate and add evidence to the recent findings by assessing the characteristics of GDM subtypes (isolated fasting hyperglycemia = GDM-IFH, isolated post-load hyperglycemia = GDM-IPH, combined hyperglycemia = CH based on oGTT glucose values) and their respective risk of adverse maternal and fetal outcomes.
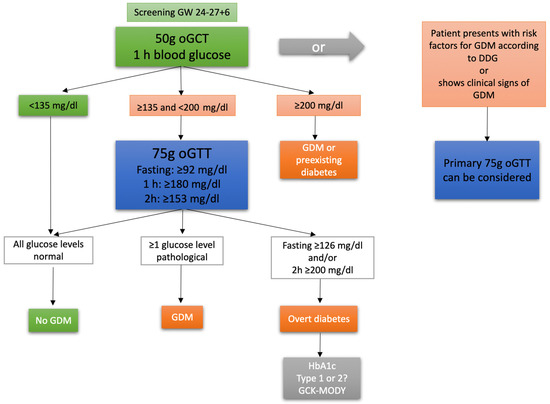
Figure 1.
Screening and diagnostic process of GDM in Germany. Initially a 50 g oral glucose challenge test (oGCT) is offered to every pregnant woman between 24 and 28 gestational weeks (GW). Depending on the blood glucose level, further testing for GDM is required. In women with risk factors for GDM according to the Deutsche Diabetes Gesellschaft (DDG) or signs of GDM, a 75 g oral glucose tolerance test (oGTT) as a first-line diagnostic test is possible.
2. Materials and Methods
Obstetric data from 3123 pregnant women visiting an expert gestational diabetes consultation clinic at Charité University Hospital, from January 2015 to September 2022, were collected and analyzed anonymously. The Charité University Hospital is a tertiary perinatal center in the metropole region of Berlin, Germany. A total of 1664 patients were eligible for the analysis (Figure 2). The patients were screened and diagnosed through the 75 g oGTT and in case of pathological results were referred to our consultation clinic. Inclusion criteria were women ≥18 years with singleton pregnancies who were screened prior with a pathological glucose response in the 75 g oGTT and were subsequently diagnosed with GDM. The gestational week (GW) at the time of the pathological 75 g oGTT did not affect inclusion. High-risk patients who received early screening (before 24 GW) were included. Only women who delivered their babies at Charité University Hospital were eligible for the analysis. Exclusion criteria were multiple pregnancies, age < 18 years, missing or incomplete oGTT data, missing perinatal data and inconclusive documentation of GDM diagnosis. The oGTT data were considered incomplete if at least one glucose measurement of the three-point 75 g oGTT was missing and subsequently the categorization into one of the subtypes was not possible. Women who were diagnosed through random elevated blood glucose levels were excluded as well. Patients were categorized into three different groups using the three blood glucose values from the 75 g oGTT. Thresholds for pathological glucose levels were ≥92 mg/dL (5.1 mmol/L) fasting, ≥180 mg/dL (10 mmol/L) one hour after glucose application and ≥153 mg/dL (8.5 mmol/L) two hours after, according to IADPSG criteria [16]. An elevation in fasting glucose only, which was measured immediately before the application of the glucose solution, was considered isolated fasting hyperglycemia (GDM-IFH). If just one or both postprandial glucose values were elevated, this was considered isolated post-load hyperglycemia (GDM-IPH) and an elevation in fasting glucose and at least one of the postprandial glucose values was categorized as combined hyperglycemia (GDM-CH). The primary aim of the analysis was to assess the likelihood of delivering via cesarean section based on the glucose values of the 75 g oGTT. The secondary objective was to analyze maternal and fetal outcome parameters, such as vaginal operative birth, shoulder dystocia, perineal tear grade 3° and the need for episiotomy, blood loss and postpartum bleeding, and pre-eclampsia. Fetal outcomes included gestational age at delivery, birth weight and percentiles, fetal growth abnormalities such as intrauterine growth retardation (IUGR), small for gestational age (SGA), LGA (defined as growth ≥ 95th percentile) and low fetal weight (defined as growth < 30th percentile), premature delivery before 37 GW, intrauterine fetal demise (IUFD) and the need for intensive neonatal care admission after delivery. Cord pH levels and base excess were evaluated.
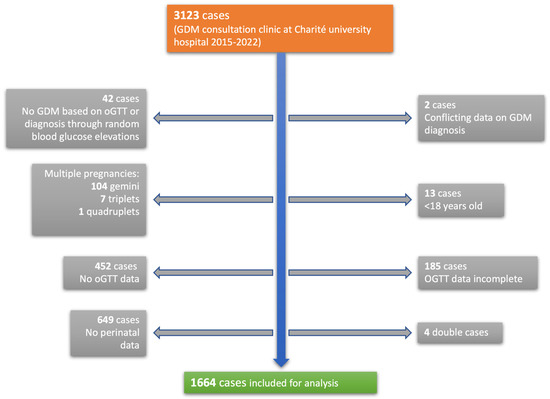
Figure 2.
Obstetric data from 3123 pregnant women were collected and analyzed anonymously. A total of 1664 cases were eligible for analysis.
An analysis of the study population’s underlying characteristics was conducted regarding maternal age, gravidity and parity, pre-conceptional BMI and the previous diagnostic process including GW at first presentation, the 50 g oGCT and the 75 g oGTT. Gravidity and parity were assessed as continuous as well as categorical variables (gravida 1, 2 and ≥3; nullipara vs. ≥primipara and para 0, 1, 2, ≥3).
This study received ethical approval from the ethics committee of Charité University Hospital on 6 February 2023 (EA2/255/22).
Data analysis was performed using SPSS Statistics by IBM (version 28.0.1.0) (Armonk, New York, United States of America). Categorical variables were compared among the subgroups using chi-square-tests and binomial logistic regression, and numbers and percentages were reported. Binomial logistic regression was conducted for outcome variables which showed significant differences among the subgroups and included subtype (categorical), pre-conceptional BMI (<18.5 = underweight, 18.5–23.9 = normal weight, 24–27.9 = overweight, 28–31.9 = obese, ≥32 = severely obese), age as a continuous variable and parity (nullipara vs. ≥primipara) as co-variates. Odds ratios and 95% confidence intervals were calculated and reported. Metric variables were compared using one-way ANOVA with subsequent post-hoc-analysis (Tukey and Games–Howell) and mean and standard deviation (SD) were reported. Results were considered statistically significant if the p-value was <0.05.
3. Results
3.1. Baseline Characteristics
Of the 1664 patients, 553 were classified as GDM-IFH (33.2%), 418 as GDM-IPH (25.1%) and 693 as GDM-CH (41.6%) (Figure 1). Mothers from the GDM-IFH group were, on average, significantly younger (IFH: 31.89, IPH: 32.62, CH: 32.70, p = 0.024). Mean gravidity (IFH: 2.88, IPH: 2.92, CH: 3.32, p < 0.001) and parity (IFH: 1.31, IPH: 1.26, CH: 1.69, p < 0.001) were significantly higher in the GDM-CH group. The analysis of gravidity and parity as categorical variables revealed that among all subtypes, multigravidity (gravida ≥ 3: IFH: 48.3%, IPH: 46.9%, CH: 59.8%, p < 0.001) was significantly more common than gravida 1 (IFH: 22.8%, IPH: 27.8%, CH: 17.8%) or 2 (IFH: 28.9%, IPH: 25.4%, CH: 22.4%). The rate of nulliparous women was significantly higher in the GDM-IPH group (IFH: 33.8%, IPH: 39.7%, CH: 25.0%, p < 0.001). GDM-CH women had the highest rate of pluriparity (para ≥ 3: IFH: 15.6%, IPH: 15.6%, CH: 26.2%). Primiparity and biparity were similarly common when comparing the subtypes (IFH: 32.2%, IPH: 26.6%, CH: 27.8% and IFH: 18.4%, IPH: 18.2%, CH: 21.0%, respectively). The pre-conceptional BMI differed significantly between all the subgroups: GDM-IPH women displayed the lowest mean BMI and GDM-CH women the highest (IFH: 28.63, IPH: 26.10, CH: 29.69, p < 0.001). The 50 g oGCT was performed on average at 26 GW, with no significant difference between the groups (IFH: 25.62 GW, IPH: 25.89 GW, CH: 25.89 GW, p = 0.362). The GDM-IFH group was less likely to receive the 50 g oGCT before the 75 g oGTT than the other subgroups (IFH: 43.9%, IPH: 60.3%, CH: 59.2%, p < 0.001) and less likely to show a pathological glucose response in the test (IFH: 85.7%, IPH: 93.4%, CH: 93.9%, p < 0.001). Mean glucose levels in the 50 g oGCT were 144.75 mg/dL (8.03 mmol/L) in the GDM-IFH, 157.69 mg/dL (8.75 mmol/L) in the GDM-IPH and 166.37 mg/dL (9.23 mmol/L) in the GDM-CH group (p < 0.001). Women with GDM-IFH received the 75 g oGTT earlier than women in the GDM-IPH or GDM-CH groups (mean: IFH: 25.78 GW, IPH: 27.23 GW, CH: 26.53 GW, p < 0.001). In the GDM-IFH and GDM-CH groups the 75 g oGTT was performed before 24 GW more often than in the GDM-IPH group (13.2%, 11.8% vs. 7.2%; p = 0.009). Mean 75 g oGTT glucose levels before glucose intake, 1 h after and 2 h after, were 99.02 mg/dL (5.50 mmol/L), 145.63 mg/dL (8.08 mmol/L) and 116.16 mg/dL (6.45 mmol/L) in women with GDM-IFH, 83.77 mg/dL (4.65 mmol/L), 188.11 mg/dL (10.44 mmol/L) and 147.28 mg/dL (8.17 mmol/L) in women with GDM-IPH and 105.84 mg/dL (5.87 mmol/L), 204.98 mg/dL (11.38 mmol/L) and 158.80 mg/dL (8.81 mmol/L) in women with GDM-CH, respectively, (Figure 3). The mean initial presentation at the GDM consultation clinic was at 31 GW (IFH: 30.22 GW, IPH: 30.72 GW, CH: 30.39 GW, p = 0.270). A complete overview of the results is provided in Table 1.
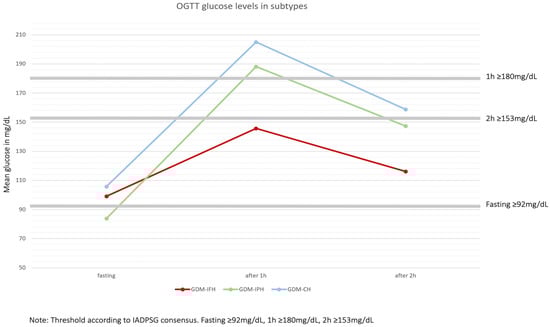
Figure 3.
Attributes of each subtype: Isolated fasting hyperglycemia (GDM-IFH), isolated postprandial hyperglycemia (GDM-IPH), combined hyperglycemia (GDM-CH). Thresholds for pathological glucose levels were ≥92 mg/dL (5.1 mmol/L) fasting, ≥180 mg/dL (10 mmol/L) one hour after glucose application and ≥153 mg/dL (8.5 mmol/L) two hours after [2].

Table 1.
Baseline characteristics. Baseline characteristics on maternal age, pregnancy history, BMI, glucose screening and screening results.
3.2. Maternal Outcome
As provided in Table 2, the GDM-IFH group displayed the highest mean weight gain (IFH: 12.17 kg, IPH: 11.24 kg, CH: 10.90 kg, p = 0.008). GDM-IFH (17.5%, OR 1.946 [1.277–2.967], p = 0.002) as well as GDM-CH women were more likely to require insulin therapy (34.2%, OR 4.317 [2.915–6.392], p < 0.001) compared to GDM-IPH women (8.9%). GDM-CH patients had a higher likelihood of receiving insulin therapy (OR 2.218 [1.674–2.937], p < 0.001) compared to GDM-IFH. The use of long-acting insulin only was significantly more common in the GDM-IFH and GDM-CH groups (IFH: 13.0%, IPH: 5.3%, CH: 19.5%, p < 0.001) and the rate of combined insulin therapy was higher in the GDM-CH group (IFH: 3.8%, IPH: 1.4%, CH: 12.8%, p < 0.001). Two patients received treatment with metformin in combination with insulin.
Table 2.
Maternal outcome. Maternal outcome regarding GDM therapy, pregnancy complications and delivery mode and birth complications.
The analysis showed no significant difference between rates of CS (primary and emergent, p = 0.811). However, there was a significant difference on primary and emergent CS specifically. GDM-IFH women were most likely to deliver via planned primary CS compared to GDM-IPH (IFH: 24.8%, IPH: 18.2%, CH: 21.5%, p = 0.047). The odds of delivering via primary CS were significantly increased only in GDM-IFH women (OR 1.376 [1.042–1.815], p = 0.024) vs. GDM-CH patients. Women categorized as GDM-IPH (23.9%, OR 1.643 [1.173–2.302], p = 0.004) or GDM-CH (21.7%, OR 1.48 [1.094–2.003], p = 0.011) were at higher risk of an emergent CS compared to GDM-IFH women (16.6%). The rate of vaginal operative delivery differed significantly with 10% in GDM-IPH patients vs. 5.5% in GDM-CH patients (IFH: 8.1%, p = 0.016). There were no significant differences concerning the rates of shoulder dystocia (IFH: 1.2%, IPH: 0.0%, CH: 2.0%, p = 0.081), episiotomy (IFH: 8.3%, IPH: 11.6%, CH: 8.9%, p = 0.389), third degree perineal tear (IFH: 1.9%, IPH: 1.2%, CH: 1.0%, p = 0.620), pre-eclampsia (IFH: 3.3%, IPH: 1.7%, CH: 3.8%, p = 0.143) and HELLP syndrome (IFH: 0.4%, IPH: 0.2%, CH: 0.1%, p = 0.739). The analysis of blood loss as a continuous variable showed no significant difference (p = 0.643), as well as the incidence of blood loss ≥ 1000 mL (p = 0.867) and ≥1500 mL (p = 0.400). The risk of postpartum bleeding was similar throughout the subgroups (p = 0.893).
3.3. Fetal Outcome
The distribution of the fetus’s sex did not differ significantly between the groups (p = 0.760). The mean gestational age at delivery was slightly higher in the GDM-IFH group than in the GDM-CH group (IFH: 39.70 GW, IPH: 39.51 GW, CH: 39.41 GW, p = 0.008). The rates of premature delivery before 37 GW were similar among the subtypes (p = 0.054). APGAR scores at 1 min (p = 0.088), 5 min (p = 0.110) and 10 min after delivery (p = 0.061), arterial cord pH values (p = 0.446) and base excess (p = 0.906) did not differ significantly among the subgroups. Neonates of GDM-IFH and GDM-CH mothers displayed a significantly higher mean birthweight (IFH: 3470.71 g, IPH: 3327.59 g, CH: 3460.21 g, p < 0.001) as well as birth weight percentiles (IFH: 54.68, IPH: 49.43, CH: 57.51, p < 0.001) compared to neonates of GDM-IPH women. GDM-IFH (12.3%, OR 1.657 [1.020–2.692], p = 0.041) and GDM-CH women (13.5%, OR 1.671 [1.046–2.668], p = 0.032) were at higher risk of delivering neonates that were LGA compared to GDM-IPH (6.5%). The SGA rate was significantly higher among GDM-IPH women (IFH: 7.6%, IPH: 11.5%, CH: 7.1%, p = 0.027). In the logistic regression analysis, SGA did not reach statistical significance. However, GDM-IPH women (30.7%, OR 1.379 [1.029–1.847], p = 0.031) displayed an association with low fetal weight (<30th percentile) in comparison to GDM-CH women (21.6%, IFH: 26.3%). There was no significant difference in neonatal intensive care admission (p = 0.086) and the rate of IUFD (p = 0.104) (Table 3).
Table 3.
Fetal outcome. Fetal outcome regarding gestational age at delivery, birthweight, Apgar and cord blood pH.
3.4. Effects of Covariates on Fetomaternal Outcome
In the logistic regression model, not only the three 75 g oGTT subtypes were associated with fetomaternal outcome. In particular, parity and pre-conceptional BMI seemed to significantly affect the perinatal outcomes. Nulliparous women displayed smaller odds of primary CS (OR 0.435 [0.320–0.593], p < 0.001), but were at higher risk of delivering via emergent CS (OR 3.534 [2.700–4.625], p < 0.001). Their likelihood of operative vaginal delivery was higher as well (OR 6.353 [4.100–9.843], p < 0.001). Nulliparity increased the odds of delivering offspring that had low fetal weight (OR 1.583 [1.238–2.025], p < 0.001) or was SGA (OR 2.155 [1.484–3.129], p < 0.001), while it reduced the odds of delivering LGA neonates (OR 0.548 [0.365–0.823], p = 0.004). Pre-conceptional BMI was associated with emergent CS (p = 0.001), vaginal operative delivery (p = 0.007) and LGA (p < 0.001). A BMI categorized as overweight, obese or severely obese increased the likelihood of emergent CS (OR 1.451 [1.011–2.083], 1.585 [1.070–2.349] and 2.019 [1.385–2.941], respectively) and delivering an LGA fetus (OR 2.020 [1.145–3.565], 2.112 [1.172–3.805] and 3.639 [2.110–6.276], respectively). Underweight mothers (OR 2.911 [1.148–7.382]) were at significantly higher risk of delivering via vaginal operative delivery. Severely obese women (OR 0.425 [0.217–0.832]) on the other hand were at lower risk compared to normal weight women. Maternal age was associated with primary (OR 1.042 [1.019–1.067], p < 0.001 for the increase of 1 year) as well as emergent CS (OR 1.031 [1.007–1.055], p = 0.010 for the increase of 1 year).
4. Discussion
Our analysis was able to corroborate the existence of three different types of metabolic phenotypes in women with GDM based on the 75 g oGTT levels. Each group revealed specific associations regarding the baseline characteristics as well as fetomaternal outcomes (Figure 4).
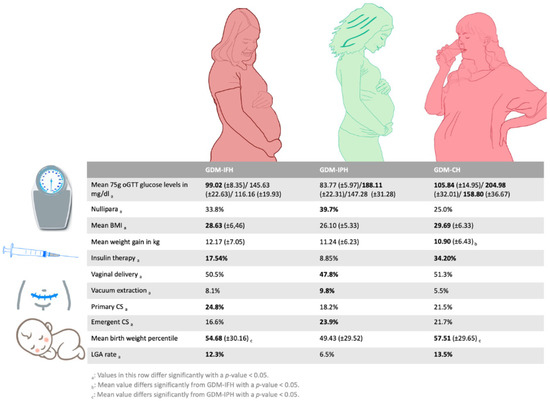
Figure 4.
An overview of significant differences between women of the three subtypes regarding parity, BMI and weight gain, insulin therapy, mode of delivery and fetal growth.
GDM-IFH women were the youngest but had the highest mean weight gain. GDM-CH women were the oldest and displayed the highest number of previous deliveries. Both groups presented with significantly higher pre-conceptional BMI than the GDM-IPH group.
GDM-IFH and GDM-CH women displayed an overall higher rate of well-established GDM risk factors, such as higher maternal age [17] or BMI [18]. This may explain, why GDM-IFH and GDM-CH women received the 75 g oGTT more frequently before 24 GW. The rate of a previous GDM was not assessable through our dataset, although it is an important contributing factor for the development of GDM and should be investigated in further studies [19].
Our results revealed a strong association of GDM-IFH and GDM-CH with the requirement of insulin therapy, which is corroborated by recent studies [14,20,21,22,23]. Kotzaeridi et al. affirmed a “worse metabolic profile”, higher BMI and an increased requirement for glucose-lowering medications in women with elevated fasting glucose, especially GDM-CH women [15]. Their study additionally revealed a significantly higher BMI in GDM-IFH and GDM-CH patients compared to women without glucose intolerance.
It is well-established that GDM in itself increases the risk of neonates being LGA [4]. We found that GDM-IFH and GDM-CH mothers delivered offspring with significantly higher birth weight as well as birth weight percentiles and increased odds of being LGA at the time of delivery compared to the GDM-IPH group. This aligns with findings of numerous studies, which previously demonstrated that maternal fasting glucose is strongly associated with LGA and higher birth weight [5,12,13]. An analysis by Black et al. revealed higher rates of LGA and increased birth weight in women with fasting hyperglycemia, not only compared to patients with post-load hyperglycemia but to non-GDM patients as well [13]. Uvena-Celebrezze et al. were able to establish a correlation of maternal fasting glucose and neonatal fat mass in a study that used the self-monitoring of glucose levels [24]. Zawiejska et al. showed that maternal fasting hyperglycemia was associated with birthweight ≥ 4000 g [14].
The higher rate of LGA in GDM-IFH and GDM-CH groups possibly contributes to an increased rate of primary CS in these groups. The rates of primary CS were highest in the GDM-IFH group, however in the binomial logistic regression only the association of GDM-IFH with primary CS in comparison to GDM-CH reached statistical significance.
The risk of emergent CS was significantly increased in the GDM-IPH and GDM-CH groups compared to GDM-IFH, whereas we found no significant difference among the subgroups regarding cesarean section in general.
GDM-IPH women presented with a lower pre-conceptional BMI, were more likely nulliparous and required insulin therapy less often.
While we found a higher rate of vaginal operative deliveries in women with GDM-IPH, there was no association of the subtypes and vaginal operative deliveries in the logistic regression analysis. However, the odds of a vaginal operative delivery were significantly increased if women were underweight and/or nulliparous. These characteristics were more frequently displayed in the GDM-IPH group; therefore, this could explain the higher rate of vaginal operative delivery. This goes along with a recent analysis, that was able to demonstrate an association of vacuum extraction and nulliparity [25]. Ramos et al. examined women requiring operative delivery assistance and found a decreased likelihood of vaginal operative delivery in women with pre-pregnancy obesity [26].
The rate of SGA was significantly higher in women of the GDM-IPH group; however, SGA did not reach statistical significance in the logistic regression. This may be explained by the strong association between nulliparity and SGA we found in our analysis, as well as the significantly higher rate of nulliparous women in the GDM-IPH group.
Previous studies found correlations of post-load hyperglycemia and gestational hypertension, hyperbilirubinemia and preterm delivery, whereas preterm delivery did not differ significantly among our subgroups and gestational hypertension and hyperbilirubinemia were not evaluated in this study [12,13,14].
Of note, IUFD and shoulder dystocia did not reach statistical significance, but all reported cases in our sample occurred either in women of the GDM-IFH or GDM-CH subgroups. Several other studies have previously shown associations of maternal fasting glucose and LGA or macrosomia with shoulder dystocia [27]. They found fetal macrosomia to be a mediating factor between maternal fasting hyperglycemia and shoulder dystocia. A meta-analysis by Farrar et al. showed associations of fasting as well as post-load glucose levels with shoulder dystocia, although an increase in fasting glucose was more strongly associated [5].
A limitation of this study was the lack of healthy controls, as we collected the data solely from the gestational diabetes consultation without a control group. The inclusion of normal glucose tolerant women in previous studies, such as Kotzaeridi et al., has provided further insight and the advantage of contextualizing different pathological glucose response patterns [15]. The study population consists of patients exclusively from one GDM consultation clinic in Berlin, Germany, which may have an impact on the generalizability of the results. Additionally, the sample sizes for the individual analyses of variables were not the same throughout the study, due to sporadically missing data. On the other hand, an important advantage is the large sample size and amount of different baseline and outcome parameters that were assessed in this study.
5. Conclusions
To conclude, we did observe significant differences between the GDM subtypes regarding their underlying characteristics and the course of their diagnostic process and were able to identify subtypes that were at higher risk of certain adverse perinatal outcomes. Women categorized as GDM-IFH or GDM-CH were more likely to need a type of insulin therapy, displayed a higher BMI, and their offspring had higher birthweight, birth weight percentiles and were more likely a LGA fetus, while neonates of women with GDM-IPH were at increased risk of low fetal weight. GDM-IFH was associated with primary CS, while GDM-IPH and GDM-CH were associated with emergent CS.
This analysis suggests that the categorization based on the 75 g oGTT glucose levels could be a practicable approach to adapt the prenatal care of women with GDM based on their risk factors. In the future, prospective studies taking the maternal risk factors into account should be conducted, possibly including interventions for women at risk.
Author Contributions
Conceptualization, J.T.K.; Methodology, J.T.K., P.R. and S.B.; Formal Analysis, S.B.; Investigation, J.T.K. and S.B.; Data curation, P.W. and S.B.; Original Draft Preparation, S.B.; Writing—Review and Editing, J.T.K. and W.H.; Visualization, S.B., J.T.K. and L.F.; Supervision, W.H. and J.T.K. All authors have read and agreed to the published version of the manuscript.
Funding
This research received no external funding.
Institutional Review Board Statement
This study was conducted according to the guidelines of the Declaration of Helsinki, and approved by the Ethics Committee of Charité University Hospital on 6 February 2023 (EA2/255/22).
Informed Consent Statement
Informed consent was waived due to the retrospective nature of this study. Data were kept anonymized.
Data Availability Statement
The data presented in this study are available on request from the corresponding author.
Conflicts of Interest
The authors declare no conflict of interest.
Abbreviations
| GDM | gestational diabetes mellitus |
| oGTT | oral glucose tolerance test |
| oGCT | oral glucose challenge test |
| CS | cesarean section |
| GDM-IFH | gestational diabetes with isolated fasting hyperglycemia |
| GDM-IPH | gestational diabetes with isolated postprandial hyperglycemia |
| GDM-CH | gestational diabetes with combined hyperglycemia |
| LGA | large for gestational age |
| IUGR | intrauterine growth retardation |
| SGA | small for gestational age |
| GW | gestational week |
| IUFD | intrauterine fetal death |
References
- Reitzle, L.; Schmidt, C.; Heidemann, C.; Icks, A.; Kaltheuner, M.; Ziese, T.; Scheidt-Nave, C. Gestational diabetes in Germany: Development of screening participation and prevalence. J. Health Monit. 2021, 6, 3–18. [Google Scholar] [CrossRef] [PubMed]
- Schäfer-Graf, U.M.; Gembruch, U.; Kainer, F.; Groten, T.; Hummel, S.; Hösli, I.; Grieshop, M.; Kaltheuner, M.; Bührer, C.; Kautzky-Willer, A.; et al. Gestational Diabetes Mellitus (GDM)—Diagnosis, Treatment and Follow-Up. Guideline of the DDG and DGGG (S3 Level, AWMF Registry Number 057/008, February 2018). Geburtshilfe Frauenheilkd 2018, 78, 1219–1231. [Google Scholar] [CrossRef] [PubMed]
- Shand, A.W.; Bell, J.C.; McElduff, A.; Morris, J.; Roberts, C.L. Outcomes of pregnancies in women with pre-gestational diabetes mellitus and gestational diabetes mellitus; a population-based study in New South Wales, Australia, 1998–2002. Diabet. Med. 2008, 25, 708–715. [Google Scholar] [CrossRef] [PubMed]
- Fadl, H.E.; Ostlund, I.K.; Magnuson, A.F.; Hanson, U.S. Maternal and neonatal outcomes and time trends of gestational diabetes mellitus in Sweden from 1991 to 2003. Diabet. Med. 2010, 27, 436–441. [Google Scholar] [CrossRef]
- Farrar, D.; Simmonds, M.; Bryant, M.; Sheldon, T.A.; Tuffnell, D.; Golder, S.; Dunne, F.; Lawlor, D.A. Hyperglycaemia and risk of adverse perinatal outcomes: Systematic review and meta-analysis. BMJ 2016, 354, i4694. [Google Scholar] [CrossRef]
- Waters, T.P.; Dyer, A.R.; Scholtens, D.M.; Dooley, S.L.; Herer, E.; Lowe, L.P.; Oats, J.J.; Persson, B.; Sacks, D.A.; Metzger, B.E.; et al. Maternal and Neonatal Morbidity for Women Who Would Be Added to the Diagnosis of GDM Using IADPSG Criteria: A Secondary Analysis of the Hyperglycemia and Adverse Pregnancy Outcome Study. Diabetes Care 2016, 39, 2204–2210. [Google Scholar] [CrossRef]
- Ye, W.; Luo, C.; Huang, J.; Li, C.; Liu, Z.; Liu, F. Gestational diabetes mellitus and adverse pregnancy outcomes: Systematic review and meta-analysis. BMJ 2022, 377, e067946. [Google Scholar] [CrossRef]
- Abdul-Ghani, M.A.; Tripathy, D.; DeFronzo, R.A. Contributions of beta-cell dysfunction and insulin resistance to the pathogenesis of impaired glucose tolerance and impaired fasting glucose. Diabetes Care 2006, 29, 1130–1139. [Google Scholar] [CrossRef]
- Powe, C.E.; Allard, C.; Battista, M.C.; Doyon, M.; Bouchard, L.; Ecker, J.L.; Perron, P.; Florez, J.C.; Thadhani, R.; Hivert, M.F. Heterogeneous Contribution of Insulin Sensitivity and Secretion Defects to Gestational Diabetes Mellitus. Diabetes Care 2016, 39, 1052–1055. [Google Scholar] [CrossRef]
- Liu, Y.; Hou, W.; Meng, X.; Zhao, W.; Pan, J.; Tang, J.; Huang, Y.; Tao, M.; Liu, F. Heterogeneity of insulin resistance and beta cell dysfunction in gestational diabetes mellitus: A prospective cohort study of perinatal outcomes. J. Transl. Med. 2018, 16, 289. [Google Scholar] [CrossRef]
- Benhalima, K.; Van Crombrugge, P.; Moyson, C.; Verhaeghe, J.; Vandeginste, S.; Verlaenen, H.; Vercammen, C.; Maes, T.; Dufraimont, E.; De Block, C.; et al. Characteristics and pregnancy outcomes across gestational diabetes mellitus subtypes based on insulin resistance. Diabetologia 2019, 62, 2118–2128. [Google Scholar] [CrossRef]
- Metzger, B.E.; Lowe, L.P.; Dyer, A.R.; Trimble, E.R.; Chaovarindr, U.; Coustan, D.R.; Hadden, D.R.; McCance, D.R.; Hod, M.; McIntyre, H.D.; et al. Hyperglycemia and adverse pregnancy outcomes. N. Engl. J. Med. 2008, 358, 1991–2002. [Google Scholar] [CrossRef] [PubMed]
- Black, M.H.; Sacks, D.A.; Xiang, A.H.; Lawrence, J.M. Clinical outcomes of pregnancies complicated by mild gestational diabetes mellitus differ by combinations of abnormal oral glucose tolerance test values. Diabetes Care 2010, 33, 2524–2530. [Google Scholar] [CrossRef] [PubMed]
- Zawiejska, A.; Wender-Ozegowska, E.; Radzicka, S.; Brazert, J. Maternal hyperglycemia according to IADPSG criteria as a predictor of perinatal complications in women with gestational diabetes: A retrospective observational study. J. Matern. Fetal Neonatal Med. 2014, 27, 1526–1530. [Google Scholar] [CrossRef]
- Kotzaeridi, G.; Blätter, J.; Eppel, D.; Rosicky, I.; Linder, T.; Geissler, F.; Huhn, E.A.; Hösli, I.; Tura, A.; Göbl, C.S. Characteristics of gestational diabetes subtypes classified by oral glucose tolerance test values. Eur. J. Clin. Investig. 2021, 51, e13628. [Google Scholar] [CrossRef] [PubMed]
- Metzger, B.E.; Gabbe, S.G.; Persson, B.; Buchanan, T.A.; Catalano, P.A.; Damm, P.; Dyer, A.R.; Leiva, A.; Hod, M.; Kitzmiler, J.L.; et al. International association of diabetes and pregnancy study groups recommendations on the diagnosis and classification of hyperglycemia in pregnancy. Diabetes Care 2010, 33, 676–682. [Google Scholar] [CrossRef] [PubMed]
- Teede, H.J.; Harrison, C.L.; Teh, W.T.; Paul, E.; Allan, C.A. Gestational diabetes: Development of an early risk prediction tool to facilitate opportunities for prevention. Aust. N. Z. J. Obstet. Gynaecol. 2011, 51, 499–504. [Google Scholar] [CrossRef]
- Torloni, M.R.; Betrán, A.P.; Horta, B.L.; Nakamura, M.U.; Atallah, A.N.; Moron, A.F.; Valente, O. Prepregnancy BMI and the risk of gestational diabetes: A systematic review of the literature with meta-analysis. Obes. Rev. 2009, 10, 194–203. [Google Scholar] [CrossRef]
- Syngelaki, A.; Pastides, A.; Kotecha, R.; Wright, A.; Akolekar, R.; Nicolaides, K.H. First-Trimester Screening for Gestational Diabetes Mellitus Based on Maternal Characteristics and History. Fetal. Diagn. Ther. 2015, 38, 14–21. [Google Scholar] [CrossRef]
- González-Quintero, V.H.; Istwan, N.B.; Rhea, D.J.; Tudela, C.M.; Flick, A.A.; de la Torre, L.; Stanziano, G.J. Antenatal factors predicting subsequent need for insulin treatment in women with gestational diabetes. J. Women’s Health 2008, 17, 1183–1187. [Google Scholar] [CrossRef]
- Pertot, T.; Molyneaux, L.; Tan, K.; Ross, G.P.; Yue, D.K.; Wong, J. Can common clinical parameters be used to identify patients who will need insulin treatment in gestational diabetes mellitus? Diabetes Care 2011, 34, 2214–2216. [Google Scholar] [CrossRef] [PubMed]
- Wong, V.W.; Jalaludin, B. Gestational diabetes mellitus: Who requires insulin therapy? Aust. N. Z. J. Obstet. Gynaecol. 2011, 51, 432–436. [Google Scholar] [CrossRef] [PubMed]
- Barnes, R.A.; Wong, T.; Ross, G.P.; Jalaludin, B.B.; Wong, V.W.; Smart, C.E.; Collins, C.E.; MacDonald-Wicks, L.; Flack, J.R. A novel validated model for the prediction of insulin therapy initiation and adverse perinatal outcomes in women with gestational diabetes mellitus. Diabetologia 2016, 59, 2331–2338. [Google Scholar] [CrossRef] [PubMed]
- Uvena-Celebrezze, J.; Fung, C.; Thomas, A.J.; Hoty, A.; Huston-Presley, L.; Amini, S.B.; Catalano, P.M. Relationship of neonatal body composition to maternal glucose control in women with gestational diabetes mellitus. J. Matern. Fetal Neonatal Med. 2002, 12, 396–401. [Google Scholar] [CrossRef] [PubMed]
- Cohen, G.; Schreiber, H.; Shalev Ram, H.; Ovadia, M.; Shechter-Maor, G.; Biron-Shental, T. Can We Predict Feto-Maternal Adverse Outcomes of Vacuum Extraction? Geburtshilfe Frauenheilkd 2022, 82, 1274–1282. [Google Scholar] [CrossRef]
- Ramos, S.Z.; Waring, M.E.; Leung, K.; Amir, N.S.; Bannon, A.L.; Moore Simas, T.A. Attempted and Successful Vacuum-Assisted Vaginal Delivery by Prepregnancy Body Mass Index. Obstet. Gynecol. 2017, 129, 311–320. [Google Scholar] [CrossRef]
- Athukorala, C.; Crowther, C.A.; Willson, K. Women with gestational diabetes mellitus in the ACHOIS trial: Risk factors for shoulder dystocia. Aust. N. Z. J. Obstet. Gynaecol. 2007, 47, 37–41. [Google Scholar] [CrossRef]


Disclaimer/Publisher’s Note: The statements, opinions and data contained in all publications are solely those of the individual author(s) and contributor(s) and not of MDPI and/or the editor(s). MDPI and/or the editor(s) disclaim responsibility for any injury to people or property resulting from any ideas, methods, instructions or products referred to in the content. |
© 2023 by the authors. Licensee MDPI, Basel, Switzerland. This article is an open access article distributed under the terms and conditions of the Creative Commons Attribution (CC BY) license (https://creativecommons.org/licenses/by/4.0/).