
The Incidence Proportion of SARS-CoV-2 Infections and the Percentage of Deaths among Infected Healthcare Workers in Poland


Abstract
:1. Introduction
2. Materials and Methods
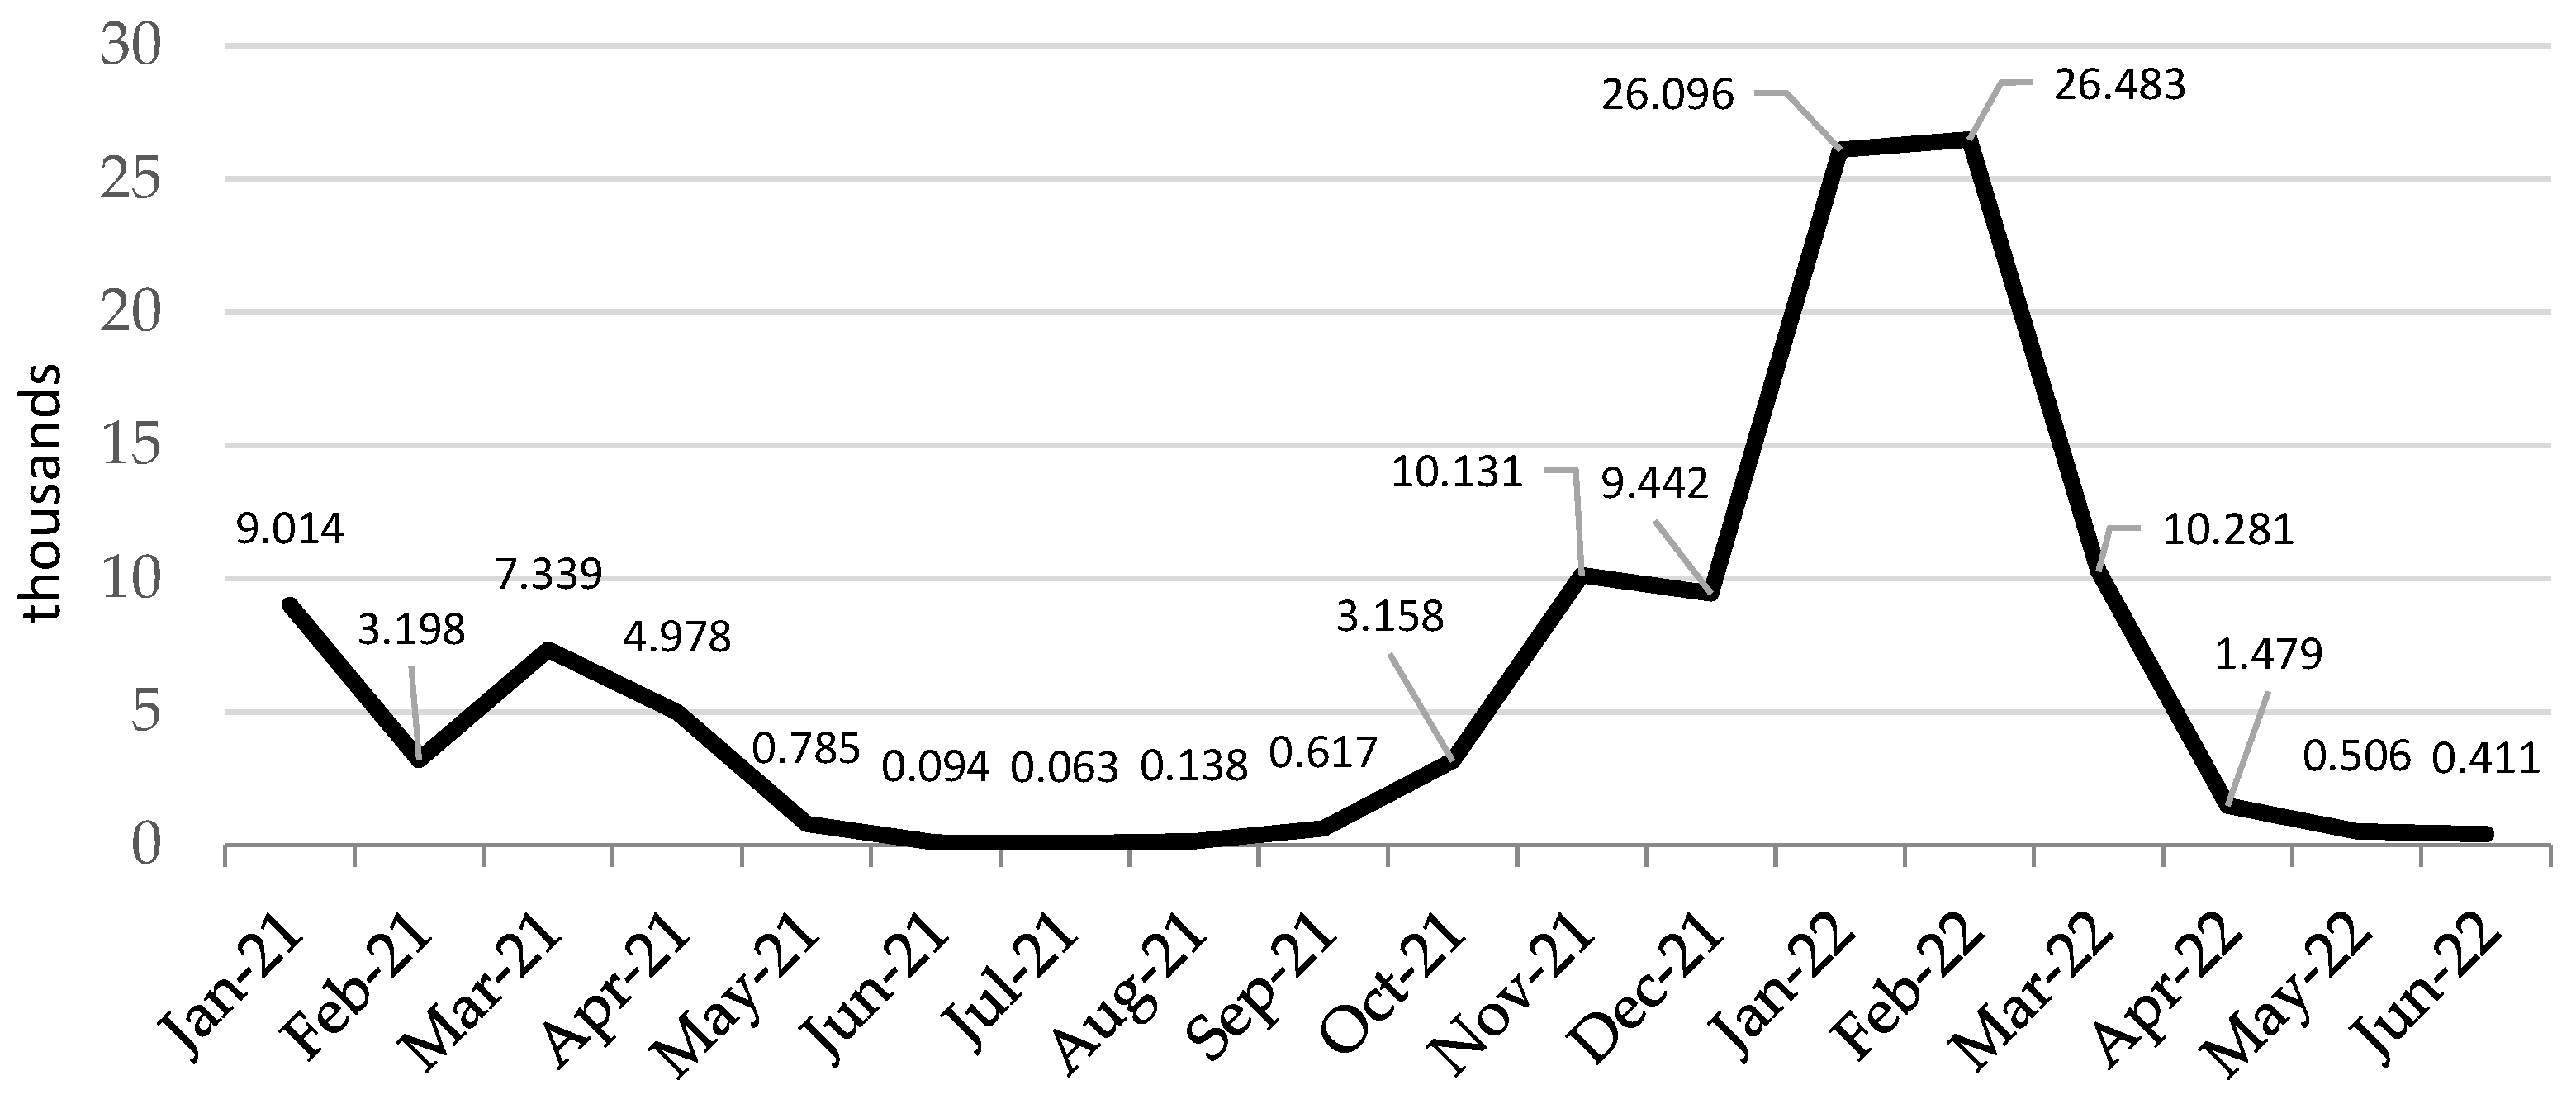
3. Results
4. Discussion
5. Conclusions
Author Contributions
Funding
Institutional Review Board Statement
Informed Consent Statement
Data Availability Statement
Acknowledgments
Conflicts of Interest
References
- Sierpiński, R.; Pinkas, J.; Jankowski, M.; Juszczyk, G.; Topór-Mądry, R.; Szumowski, Ł. Occupational risks for SARS-CoV-2 infection: The Polish experience. Int. J. Occup. Med. Environ. Health 2020, 33, 781–789. [Google Scholar] [CrossRef] [PubMed]
- Wojczyk, M.; Kowalska, M. Prevalence of SARS-CoV-2 infection and risk factors in health care workers. Przegl. Epidemiol. 2020, 74, 606–619. [Google Scholar] [CrossRef] [PubMed]
- Wojczyk, M.; Kowalska, M. The frequency of positive results of serological tests against SARS-CoV-2 in healthcare workers in Upper Silesia Metropolitan Area, Poland. Med. Pract. 2022, 73, 125–133. [Google Scholar] [CrossRef]
- Galanis, P.; Vraka, I.; Fragkou, D.; Bilali, A.; Kaitelidou, D. Seroprevalence of SARS-CoV-2 antibodies and associated factors in healthcare workers: A systematic review and meta-analysis. J. Hosp. Infect. 2021, 108, 120–134. [Google Scholar] [CrossRef]
- Rosińska, M.; Stępień, M.; Kitowska, W.; Milczarek, M.; Juszczyk, G.; Nowacka, Z.; Gardel, A.; Hermann, A.; Bardoń-Błaszkowska, A.; Cudnik, R.; et al. Healthcare workers highly affected during the COVID-19 epidemic wave in Poland prior to vaccination availability: Seroprevalence study. Med. Pract. 2022, 73, 109–123. [Google Scholar] [CrossRef]
- Puls Medycyny. Deaths of Medics Suffering from COVID-19 in Poland: 304 Doctors and 257 Nurses Died; The Media: Warsaw, Poland, 2022; Available online: https://pulsmedycyny.pl/zgony-medykow-chorych-na-covid-19-w-polsce-zmarlo-304-lekarzy-i-257-pielegniarek-1142088 (accessed on 21 December 2022).
- Medonet. How Many Polish Doctors Died of COVID-19? The Ministry of Health Has Provided the Latest Data; The Media: Warsaw, Poland, 2020; Available online: https://www.medonet.pl/koronawirus/koronawirus-w-polsce,koronawirus-w-polsce--zakazenia-wsrod-personelu-medycznego,artykul,20972022.html#:~:text=Poprzednie%20dane%20dotycz%C4%85ce%20zaka%C5%BCe%C5%84%20koronawirusem%20SARS-CoV-2%20u%20personelu,lekarzy%2C%2018%20495%20piel%C4%99gniarek%20oraz%201%20644%20po%C5%82o%C5%BCne (accessed on 21 December 2022).
- Response of the Ministry of Health to Parliamentary question No. 4302 of 20 July 2020. Available online: https://orka2.sejm.gov.pl/INT9.nsf/klucz/ATTBRXDEH/%24FILE/i04302-o1.pdf (accessed on 21 December 2022).
- Puls Medycyny. Ministry of Health: 43 Doctors and 32 Nurses—So Many Doctors Died due to SARS-CoV-2 Infection; The Media: Warsaw, Poland, 2022; Available online: https://pulsmedycyny.pl/ministerstwo-zdrowia-43-lekarzy-i-32-pielegniarek-tylu-medykow-zmarlo-z-podowu-zakazenia-sars-cov-2-1102302 (accessed on 21 December 2022).
- Information on the Results of the Audit of the Supreme Audit Office: Functioning of Hospitals in the Conditions of the COVID-19 Pandemic. KZD.430.006.2021; Reg No. 154/2021/P/21/055/KZD. Available online: https://www.nik.gov.pl/plik/id,26701,v,artykul_25465.pdf (accessed on 21 December 2022).
- Labrague, L.J.; de Los Santos, J.A.A. Resilience as a mediator between compassion fatigue, nurses’ work outcomes, and quality of care during the COVID-19 pandemic. Appl. Nurs. Res. 2021, 61, 151476. [Google Scholar] [CrossRef]
- von Vogelsang, A.C.; Göransson, K.E.; Falk, A.C.; Nymark, C. Missed nursing care during the COVID-19 pandemic: A comparative observational study. J. Nurs. Manag. 2021, 29, 2343–2352. [Google Scholar] [CrossRef]
- Polityka Zdrowotna.com. How Does the Ministry of Health Collect Data on the Epidemic? The Media: Warsaw, Poland, 2020; Available online: https://politykazdrowotna.com/artykul/jak-mz-zbiera-dane-dotyczace-epidemii/828545 (accessed on 19 December 2022).
- Ministry of Health. Statistical Bulletin of the Minister of Health 2022; The Organization: Warsaw, Poland, 2022. Available online: https://ezdrowie.gov.pl/portal/home/badania-i-dane/biuletyn-statystyczny (accessed on 30 December 2022).
- National Chamber of Physiotherapists. Number of Physiotherapists in Regions; The Organization: Warsaw, Poland, 2022; Available online: https://kif.info.pl/regiony/ (accessed on 30 December 2022).
- Zejda, J.E.; Kowalska, M.; Brożek, G.M.; Barański, K.; Kaleta-Pilarska, A. Infection fatality rate (IFR) during the course of COVID-19 pandemic in Upper Silesia Metropolitan Area (Poland) in 2020. Med. Pract. 2021, 72, 671–676. (In Polish) [Google Scholar] [CrossRef]
- Medonet. COVID-19 Vaccine Johnson&Johnson. The Most Important Information; The Media: Warsaw, Poland, 2021; Available online: https://www.medonet.pl/porozmawiajmyoszczepionce/szczepionka-na-covid-19,szczepionka-na-covid-19-johnson-johnson--najwazniejsze-informacje,artykul,27115900.html (accessed on 30 December 2022).
- Announcement No. 12 of the Minister of Health on Vaccination against COVID-19 with a Booster Dose and an Additional Dose Supplementing the Basic Scheme of 28 September 2021. Available online: https://www.gov.pl/web/zdrowie/komunikat-nr-12-ministra-zdrowia-w-sprawie-szczepien-przeciw-covid-19-dawka-przypominajaca-oraz-dawka-dodatkowa-uzupelniajaca-schemat-podstawowy (accessed on 21 December 2022).
- Bonita, R.; Beaglehole, R.; Kjellström, T.; World Health Organization. Basic Epidemiology; World Health Organization: Geneva, Switzerland, 2006. [Google Scholar]
- Our World in Data. COVID-19 Data Explorer; The Organization: Oxford, UK, 2022; Available online: https://ourworldindata.org/explorers/coronavirus-data-explorer (accessed on 8 January 2023).
- World Health Organization. Health and Care Worker Deaths during COVID-19; The Organization: Geneva, Switzerland, 2021; Available online: https://www.who.int/news/item/20-10-2021-health-and-care-worker-deaths-during-covid-19 (accessed on 30 December 2022).
- Smallwood, N.; Harrex, W.; Rees, M.; Willis, K.; Bennett, C.M. COVID-19 infection and the broader impacts of the pandemic on healthcare workers. Respirology 2022, 27, 411–426. [Google Scholar] [CrossRef]
- Ramli, N.S.; Fauzi, M.F.M.; Moktar, N.M.A.; Hajib, N.; Nawi, A.M. Prevalence, characteristics, and predictors of healthcare workers with COVID-19 infection in an urban district in Malaysia. Pan Afr. Med. J. 2022, 41, 243. [Google Scholar] [CrossRef]
- Browne, S.K.; Feemster, K.A.; Shen, A.K.; Green-McKenzie, J.; Momplaisir, F.M.; Faig, W.; Offit, P.A.; Kuter, B.J. Coronavirus disease 2019 (COVID-19) vaccine hesitancy among physicians, physician assistants, nurse practitioners, and nurses in two academic hospitals in Philadelphia. Infect. Control Hosp. Epidemiol. 2022, 43, 1424–1432. [Google Scholar] [CrossRef]
- Bandyopadhyay, S.; Baticulon, R.E.; Kadhum, M.; Alser, M.; Ojuka, D.K.; Badereddin, Y.; Kamath, A.; Parepalli, S.A.; Brown, G.; Iharchane, S.; et al. Infection and mortality of healthcare workers worldwide from COVID-19: A systematic review. BMJ Glob. Health 2020, 5, e003097. [Google Scholar] [CrossRef]
- The Government of Canada. COVID-19 Infections among Healthcare Workers and Other People Working in Healthcare Settings; The Government: Ottawa, ON, Canada, 2022. Available online: https://www.canada.ca/en/public-health/services/diseases/coronavirus-disease-covid-19/epidemiological-economic-research-data/infections-healthcare-workers-other-people-working-healthcare-settings.html (accessed on 21 December 2022).
- Huy, N.T.; Chico, R.M.; Huan, V.T.; Shaikhkhalil, H.W.; Uyen, V.N.T.; Qarawi, A.T.A.; Alhady, S.T.M.; Vuong, N.L.; Van Truong, L.; Luu, M.N.; et al. Awareness and preparedness of healthcare workers against the first wave of the COVID-19 pandemic: A cross-sectional survey across 57 countries. PLoS ONE 2021, 16, e0258348. [Google Scholar] [CrossRef] [PubMed]
- Kambhampati, A.K.; O’halloran, A.C.; Whitaker, M.; Magill, S.S.; Chea, N.; Chai, S.J.; Kirley, P.D.; Herlihy, R.K.; Kawasaki, B.; Meek, J.; et al. COVID-19–Associated Hospitalizations among Health Care Personnel—COVID-NET, 13 States, March 1–May 31, 2020. MMWR Morb. Mortal. Wkly. Rep. 2020, 69, 1576–1583. [Google Scholar] [CrossRef]
- Iaccarino, G.; Grassi, G.; Borghi, C.; Ferri, C.; Salvetti, M.; Volpe, M.; SARS-RAS Investigators. Age and Multimorbidity Predict Death among COVID-19 Patients: Results of the SARS-RAS Study of the Italian Society of Hypertension. Hypertension 2020, 76, 366–372. [Google Scholar] [CrossRef] [PubMed]
- Central Statistical Office. Human Resources in Selected Medical Professions Based on Administrative Sources in 2019–2020; The Organization: Warsaw, Poland, 2021. Available online: https://stat.gov.pl/files/gfx/portalinformacyjny/pl/defaultaktualnosci/5513/28/1/1/zasoby_kadrowe_w_wybranych_zawodach_medycznych_na_podstawie_zrodel_administracyjnych_w_latach_2019-2020.pdf (accessed on 12 May 2023).
- Kowalska, M.; Barański, K.; Brożek, G.; Kaleta-Pilarska, A.; Jan, E.Z. COVID-19 related risk of in-hospital death in Silesia, Poland. Pol. Arch. Intern. Med. 2021, 131, 339–344. [Google Scholar] [CrossRef]
- Mason, K.E.; Maudsley, G.; McHale, P.; Pennington, A.; Day, J.; Barr, B. Age-Adjusted Associations between Comorbidity and Outcomes of COVID-19: A Review of the Evidence from the Early Stages of the Pandemic. Front. Public Health 2021, 6, 584182. [Google Scholar] [CrossRef] [PubMed]
- Erdem, H.; Lucey, D.R. Healthcare worker infections and deaths due to COVID-19: A survey from 37 nations and a call for WHO to post national data on their website. Int. J. Infect. Dis. 2021, 102, 239–241. [Google Scholar] [CrossRef]
- Paczkowska, A.; Hoffmann, K.; Michalak, M.; Hans-Wytrychowska, A.; Bryl, W.; Kopciuch, D.; Zaprutko, T.; Ratajczak, P.; Nowakowska, E.; Kus, K. Safety Profile of COVID-19 Vaccines among Healthcare Workers in Poland. Vaccines 2022, 10, 434. [Google Scholar] [CrossRef]
- Lindner-Pawłowicz, K.; Mydlikowska-Śmigórska, A.; Łampika, K.; Sobieszczańska, M. COVID-19 Vaccination Acceptance among Healthcare Workers and General Population at the Very Beginning of the National Vaccination Program in Poland: A Cross-Sectional, Exploratory Study. Vaccines 2021, 10, 66. [Google Scholar] [CrossRef]
- Cooper, D.J.; Lear, S.; Sithole, N.; Shaw, A.; Stark, H.; Ferris, M.; CITIID-NIHR BioResource COVID-19 Collaboration Consortium; Bradley, J.; Maxwell, P.; Goodfellow, I.; et al. Demographic, behavioural and occupational risk factors associated with SARS-CoV-2 infection in UK healthcare workers: A retrospective observational study. BMJ Open 2022, 12, e063159. [Google Scholar] [CrossRef] [PubMed]
- Briko, N.I.; Korshunov, V.A.; Mindlina, A.Y.; Polibin, R.V.; Antipov, M.O.; Brazhnikov, A.I.; Vyazovichenko, Y.E.; Glushkova, E.V.; Lomonosov, K.S.; Lomonosova, A.V.; et al. Healthcare Workers’ Acceptance of COVID-19 Vaccination in Russia. Int. J. Environ. Res. Public Health 2022, 19, 4136. [Google Scholar] [CrossRef] [PubMed]
- Yu, W.; Guo, Y.; Zhang, S.; Kong, Y.; Shen, Z.; Zhang, J. Proportion of asymptomatic infection and nonsevere disease caused by SARS-CoV-2 Omicron variant: A systematic review and analysis. J. Med. Virol. 2022, 94, 5790–5801. [Google Scholar] [CrossRef] [PubMed]
- Shang, W.; Kang, L.; Cao, G.; Wang, Y.; Gao, P.; Liu, J.; Liu, M. Percentage of Asymptomatic Infections among SARS-CoV-2 Omicron Variant-Positive Individuals: A Systematic Review and Meta-Analysis. Vaccines 2022, 10, 1049. [Google Scholar] [CrossRef] [PubMed]
- David, N.C.E.; Juliana, H.; Chok, M.; Gan, Y.Z.; Tan, Y.C.; Adlina, M.N.N.; Tan, S.L.; Tan, M.V.; Mariana, A.M.A.; Hasri, H.; et al. Prevalence of COVID-19 among healthcare workers in the paediatric department: Estimates from a multicenter cross-sectional survey in Negeri Sembilan. Med. J. Malays. 2023, 78, 80–86. [Google Scholar]


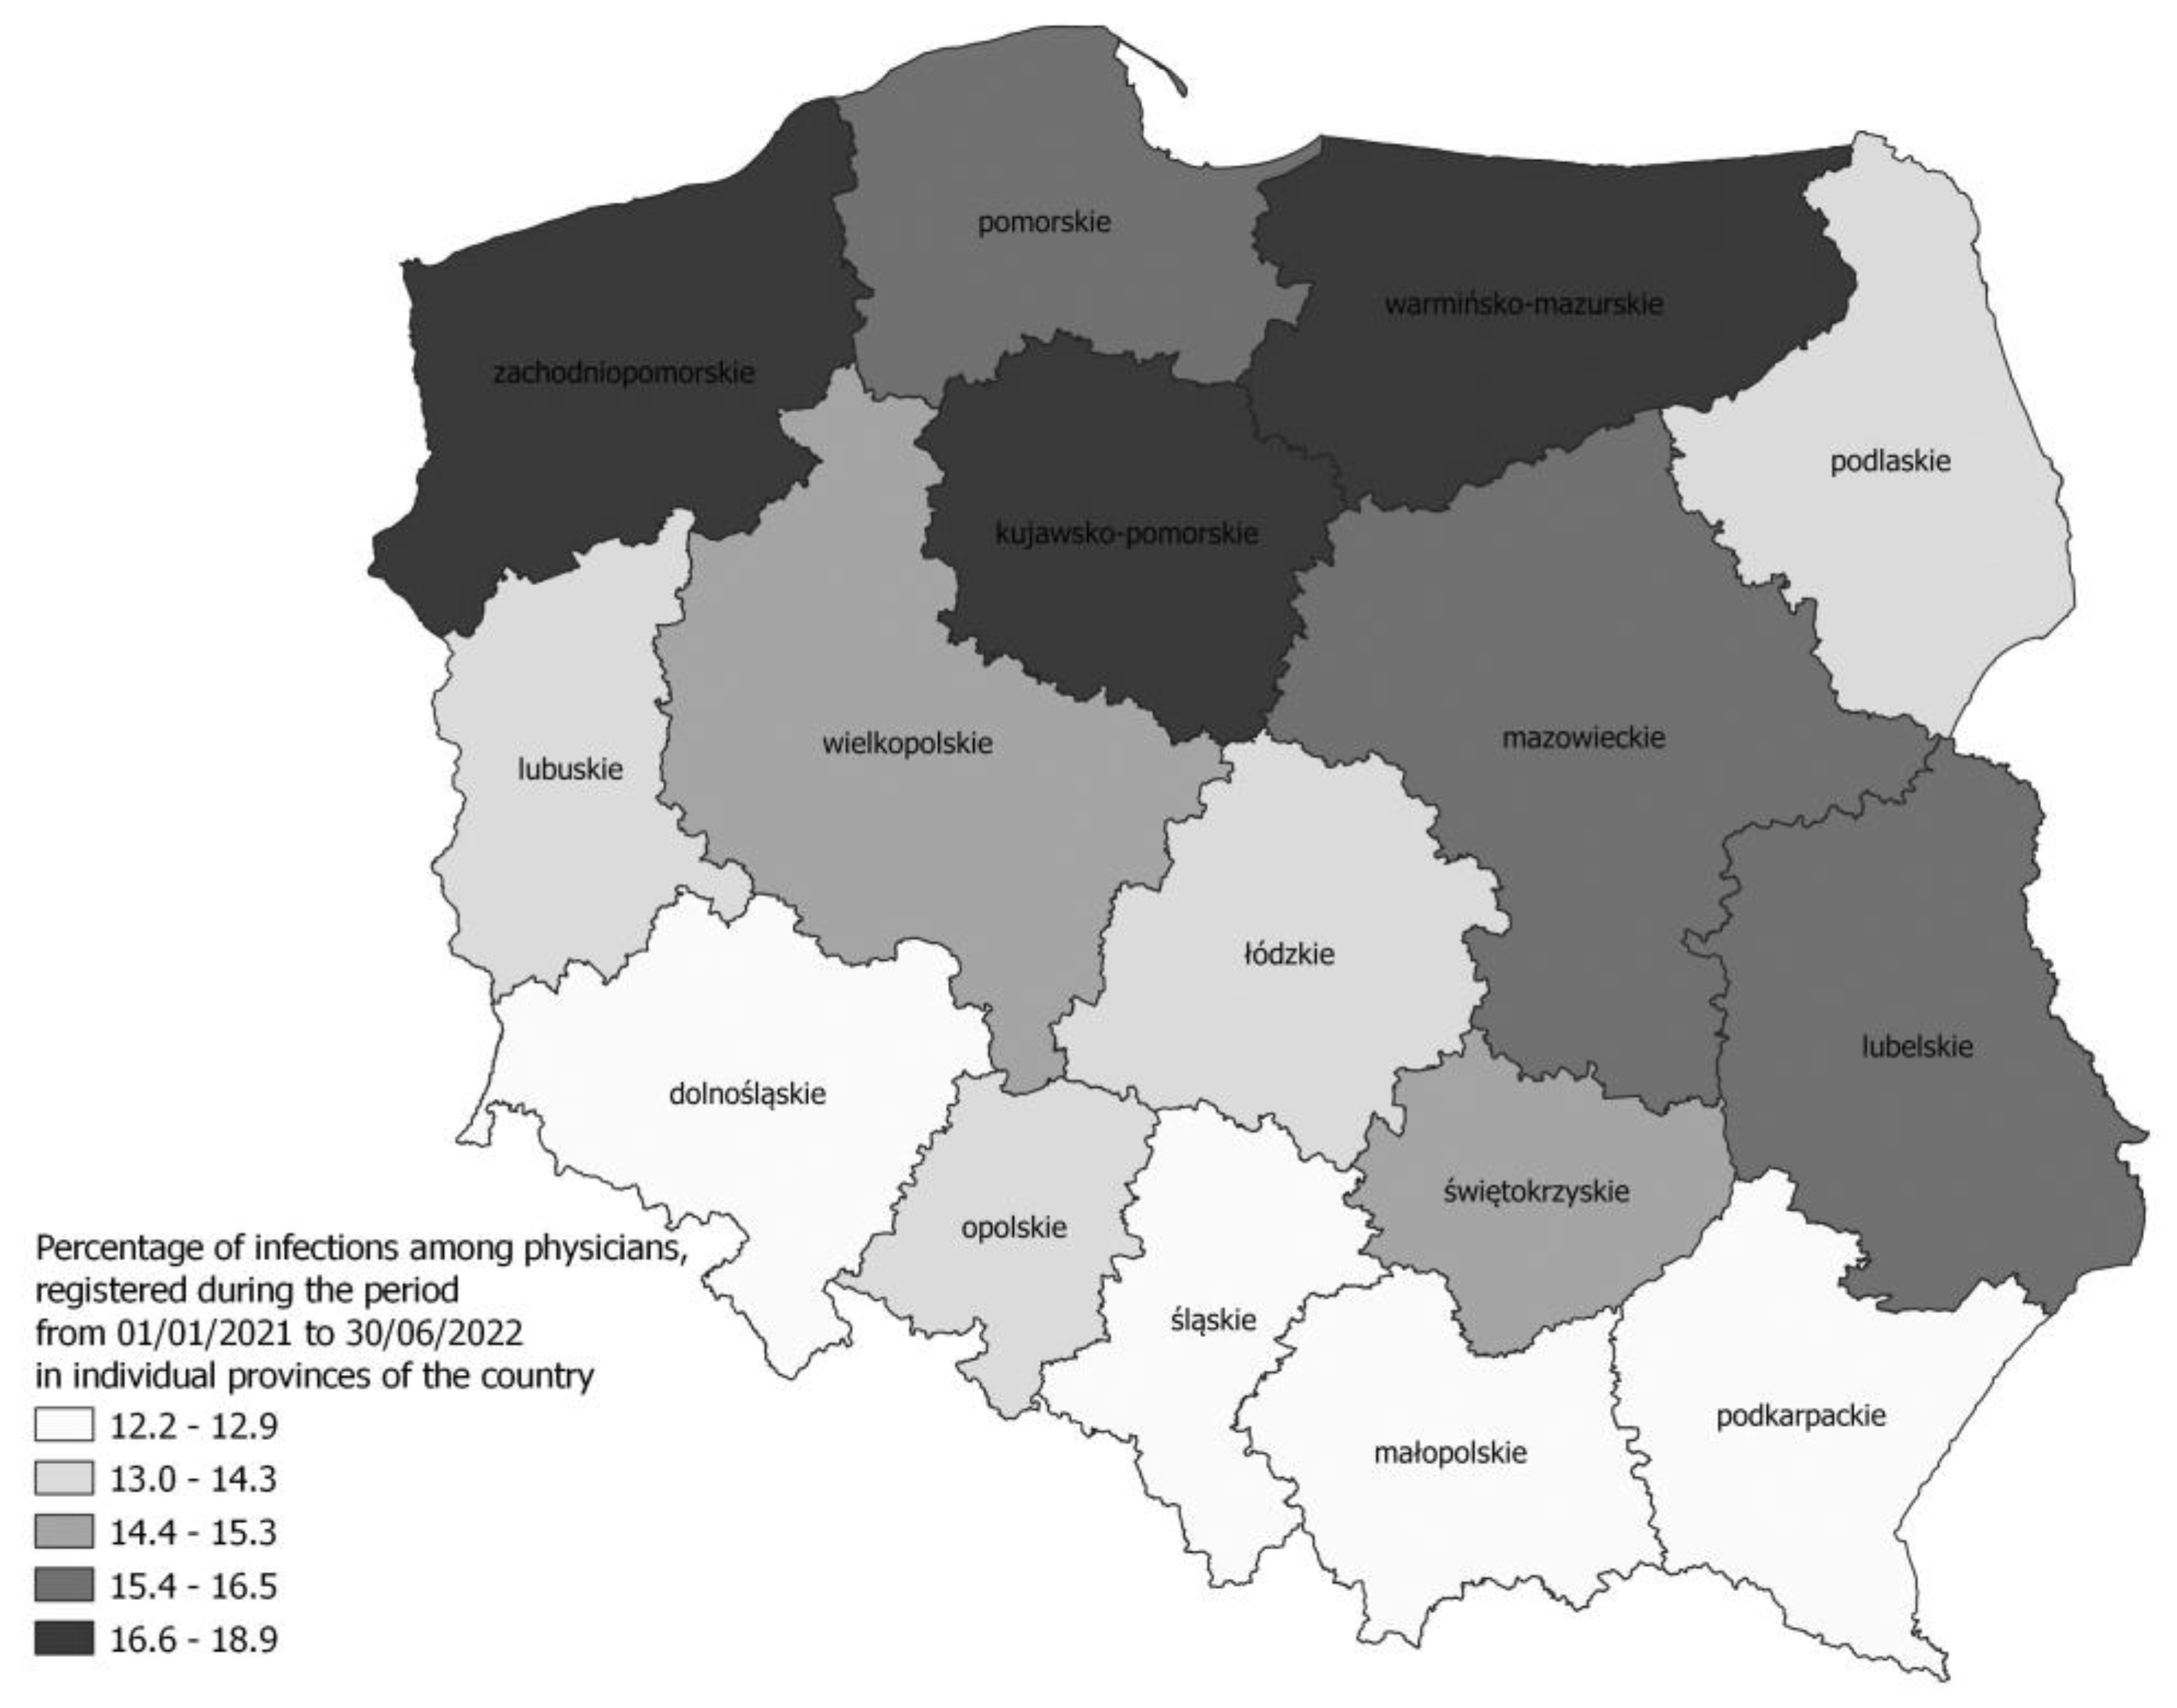
| Voivodship | Infections | %DOC | %NUR | %PM | %DEN | %LAB | %PHA | %PHY | %MID |
|---|---|---|---|---|---|---|---|---|---|
| Total in country | Generally | 14.99 | 18.07 | 18.34 | 8.62 | 21.62 | 14.44 | 16.92 | 16.84 |
| First-time | 13.12 | 15.18 | 14.91 | 8.19 | 19.40 | 13.56 | 15.11 | 15.05 | |
| Dolnośląskie | Generally | 12.92 | 17.26 | 16.20 | 6.59 | 21.27 | 13.82 | 15.98 | 16.65 |
| First-time | 11.50 | 14.79 | 12.64 | 6.13 | 19.04 | 13.10 | 14.56 | 14.97 | |
| Kujawsko-pomorskie | Generally | 18.55 | 23.25 | 16.12 | 12.47 | 26.00 | 20.41 | 19.37 | 18.74 |
| First-time | 16.19 | 18.95 | 12.00 | 12.06 | 23.07 | 18.05 | 16.70 | 15.85 | |
| Łódzkie | Generally | 13.99 | 17.14 | 24.15 | 8.90 | 19.41 | 14.14 | 15.58 | 16.42 |
| First-time | 12.05 | 14.17 | 17.53 | 8.40 | 18.07 | 13.22 | 14.10 | 14.55 | |
| Lubelskie | Generally | 16.30 | 22.13 | 19.38 | 9.78 | 23.32 | 15.53 | 16.26 | 20.49 |
| First-time | 13.58 | 18.06 | 16.83 | 9.58 | 20.85 | 14.54 | 16.26 | 17.51 | |
| Lubuskie | Generally | 14.14 | 18.55 | 20.95 | 6.65 | 18.43 | 13.98 | 22.02 | 16.93 |
| First-time | 12.69 | 15.74 | 17.06 | 6.32 | 16.08 | 13.40 | 13.68 | 15.45 | |
| Małopolskie | Generally | 12.96 | 15.51 | 13.95 | 7.88 | 17.67 | 13.85 | 14.13 | 14.16 |
| First-time | 12.04 | 13.03 | 12.50 | 7.43 | 16.34 | 13.27 | 12.81 | 13.01 | |
| Mazowieckie | Generally | 16.25 | 18.35 | 23.21 | 9.46 | 22.34 | 16.29 | 18.29 | 16.99 |
| First-time | 14.43 | 15.84 | 19.12 | 9.14 | 20.41 | 15.37 | 16.55 | 15.51 | |
| Opolskie | Generally | 13.79 | 17.96 | 16.46 | 7.76 | 22.18 | 16.72 | 14.97 | 19.22 |
| First-time | 12.23 | 15.15 | 14.71 | 7.51 | 17.41 | 14.81 | 13.35 | 16.90 | |
| Podkarpackie | Generally | 12.25 | 16.04 | 12.13 | 6.03 | 23.16 | 10.65 | 14.60 | 13.81 |
| First-time | 10.14 | 13.36 | 10.50 | 5.73 | 17.34 | 10.29 | 12.95 | 12.62 | |
| Podlaskie | Generally | 14.39 | 17.06 | 17.03 | 8.60 | 18.84 | 10.71 | 15.51 | 15.30 |
| First-time | 12.41 | 14.54 | 12.30 | 8.10 | 16.60 | 10.37 | 13.62 | 14.02 | |
| Pomorskie | Generally | 16.60 | 19.26 | 13.59 | 10.61 | 24.13 | 16.04 | 20.52 | 17.30 |
| First-time | 14.70 | 16.45 | 10.73 | 10.07 | 22.07 | 14.75 | 18.18 | 15.64 | |
| Śląskie | Generally | 13.00 | 17.00 | 17.62 | 7.28 | 20.51 | 12.91 | 17.92 | 15.85 |
| First-time | 11.40 | 14.44 | 14.76 | 6.97 | 18.34 | 12.11 | 16.10 | 14.36 | |
| Świętokrzyskie | Generally | 15.10 | 15.03 | 16.93 | 6.02 | 16.44 | 8.81 | 13.49 | 13.86 |
| First-time | 12.69 | 12.75 | 15.34 | 5.78 | 15.69 | 8.59 | 12.12 | 13.39 | |
| Warmińsko-Mazurskie | Generally | 18.23 | 21.42 | 24.16 | 9.04 | 21.47 | 16.10 | 19.82 | 20.77 |
| First-time | 14.91 | 17.16 | 19.52 | 8.22 | 18.76 | 15.53 | 16.56 | 18.30 | |
| Wielkopolskie | Generally | 15.40 | 16.83 | 23.64 | 8.97 | 23.05 | 13.54 | 16.73 | 17.52 |
| First-time | 13.46 | 14.09 | 18.47 | 8.40 | 21.27 | 12.85 | 14.99 | 15.30 | |
| Zachodnio-pomorskie | Generally | 18.86 | 21.55 | 21.25 | 10.70 | 25.33 | 14.43 | 19.67 | 20.92 |
| First-time | 16.40 | 17.53 | 17.46 | 9.88 | 23.22 | 13.36 | 17.36 | 17.86 |
| Voivodship | %DOC | %NUR | % PM | % DEN | % LAB | % PHA | % PHY | % MID |
|---|---|---|---|---|---|---|---|---|
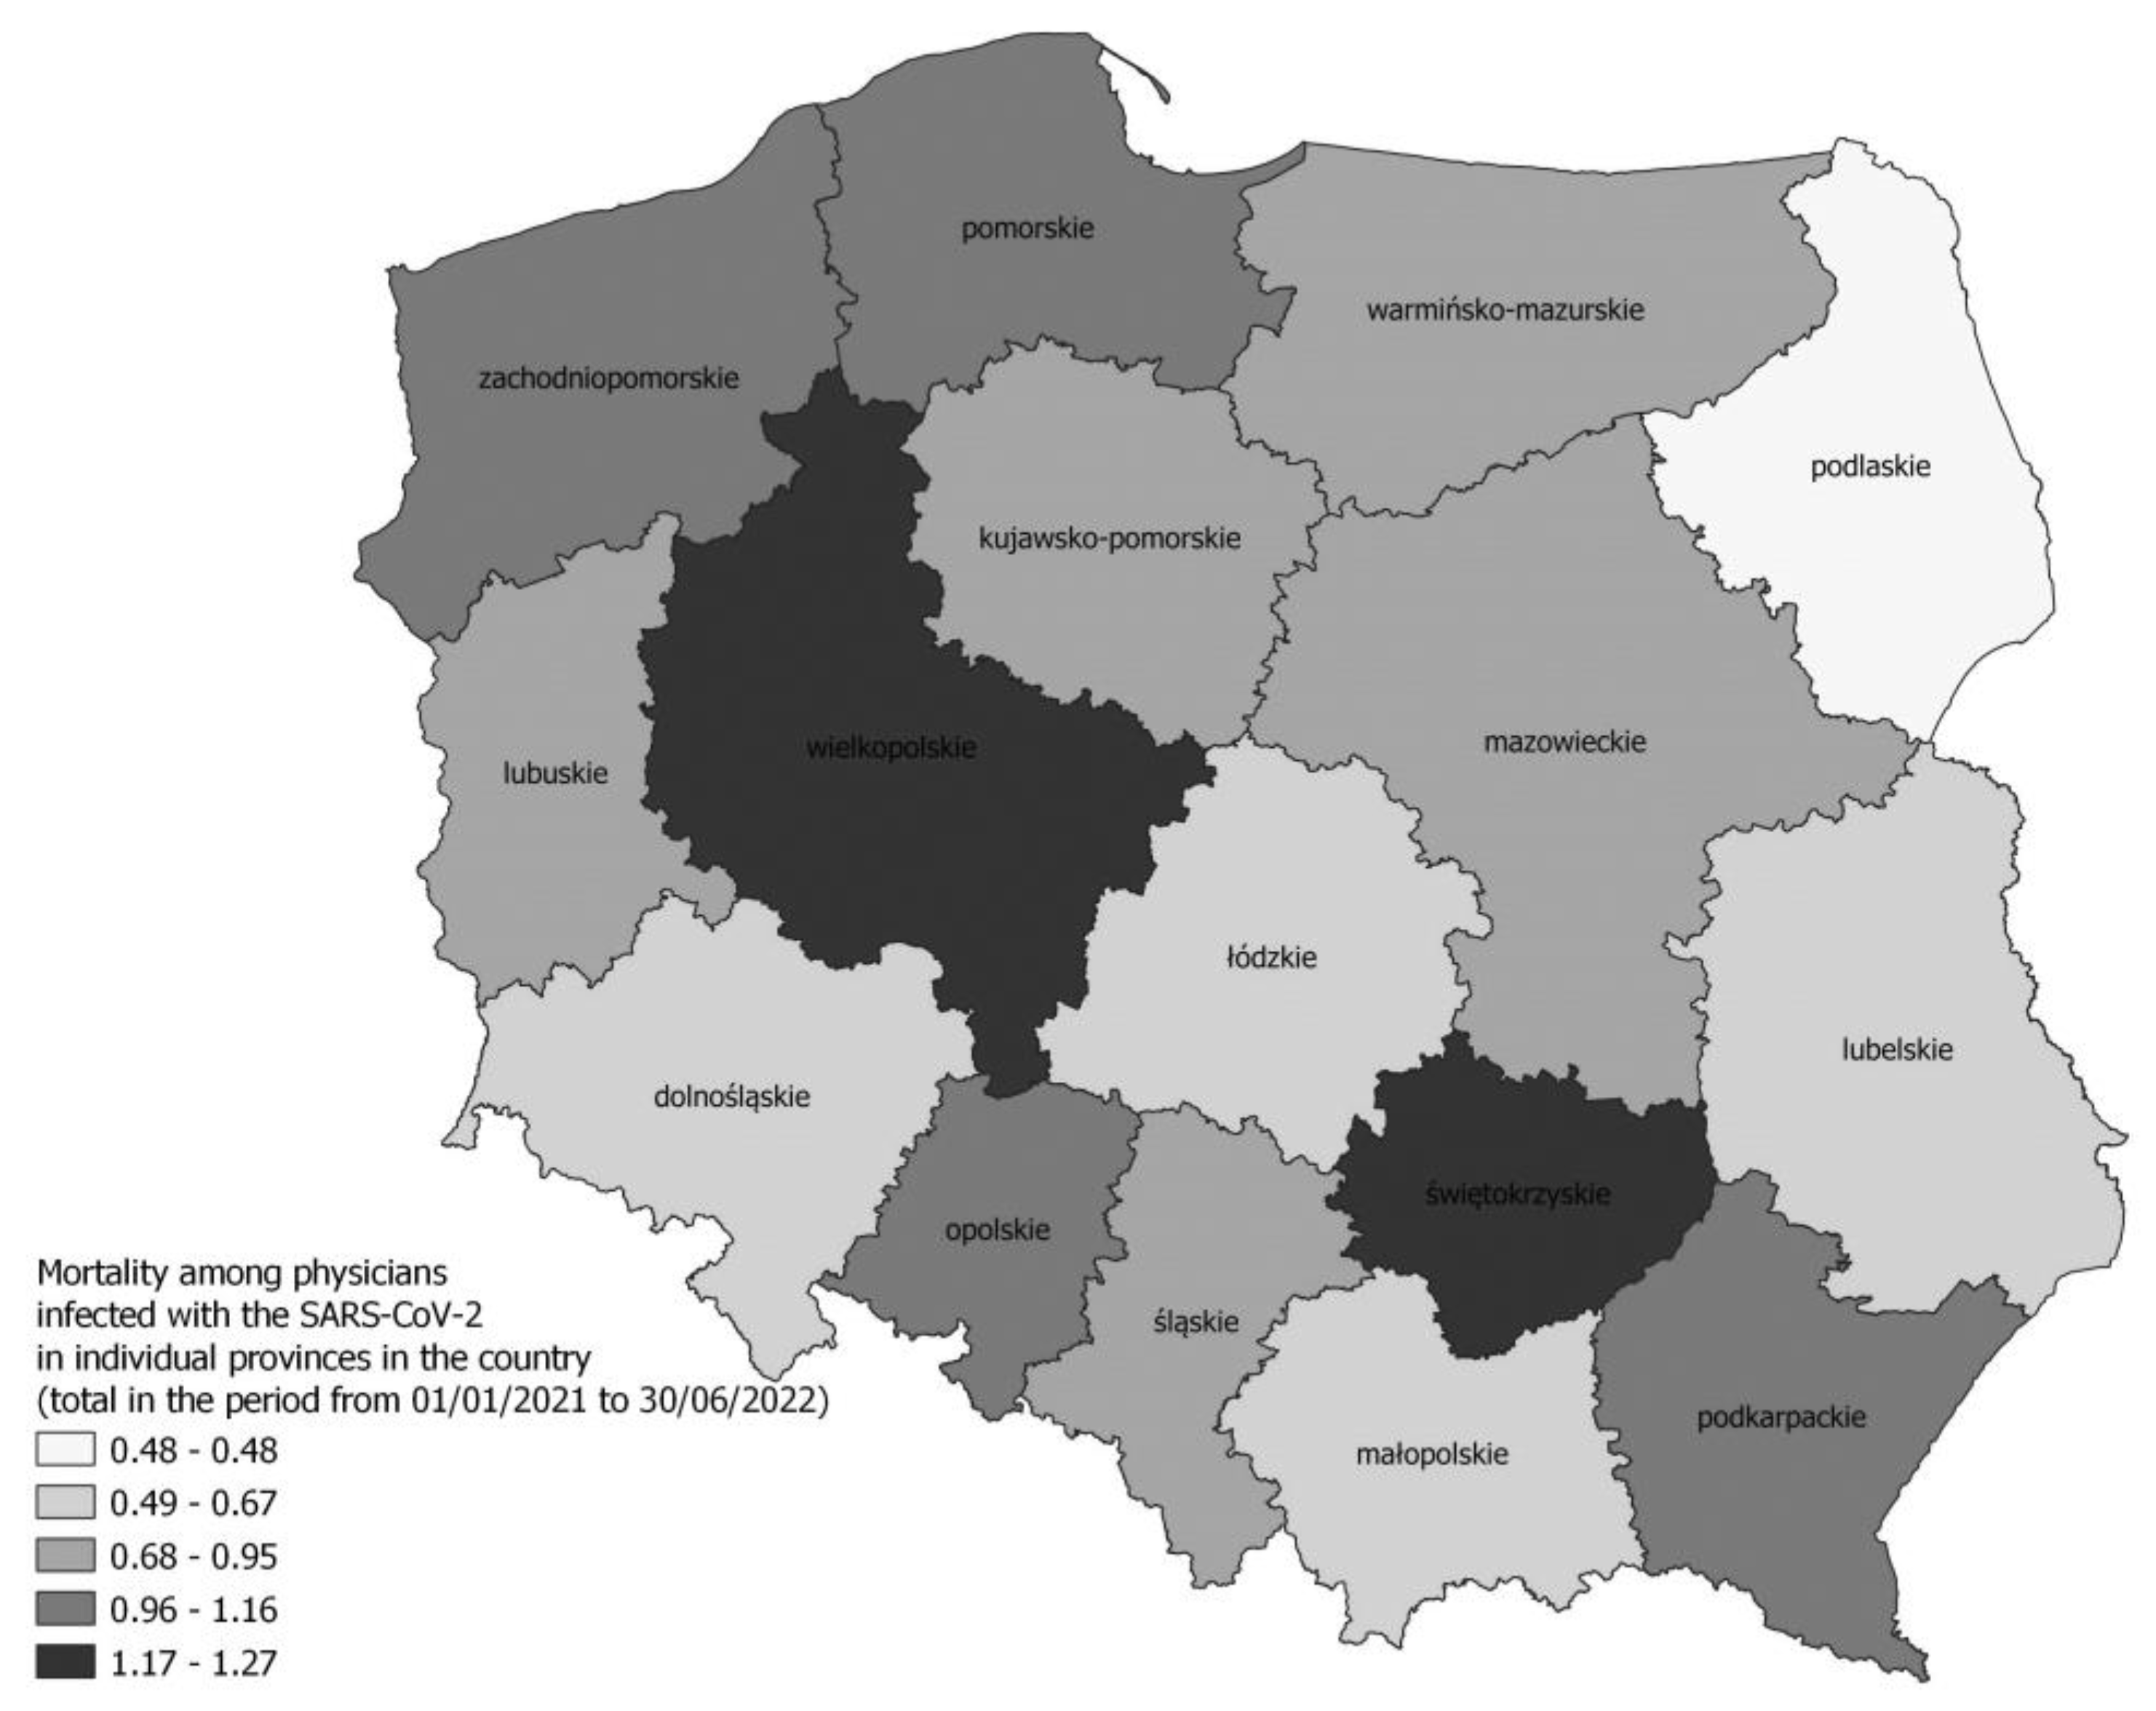
| Total in country | 0.85 | 0.42 | 0.11 | 1.45 | 0.13 | 0.43 | 0.06 | 0.42 |
| Dolnośląskie | 0.59 | 0.50 | 0.48 | 1.57 | 0.00 | 0.47 | 0.10 | 0.00 |
| Kujawsko-Pomorskie | 0.87 | 0.43 | 0.00 | 3.23 | 0.34 | 0.61 | 0.00 | 0.77 |
| Łódzkie | 0.64 | 0.62 | 0.00 | 0.98 | 0.00 | 0.24 | 0.00 | 0.43 |
| Lubelskie | 0.67 | 0.43 | 0.55 | 2.05 | 0.35 | 0.61 | 0.15 | 0.00 |
| Lubuskie | 0.79 | 0.55 | 0.00 | 0.00 | 0.00 | 0.00 | 0.00 | 0.67 |
| Małopolskie | 0.60 | 0.19 | 0.00 | 0.64 | 0.00 | 0.42 | 0.09 | 0.81 |
| Mazowieckie | 0.77 | 0.33 | 0.00 | 1.24 | 0.17 | 0.10 | 0.05 | 0.55 |
| Opolskie | 1.10 | 0.64 | 0.00 | 4.92 | 0.00 | 0.00 | 0.00 | 0.55 |
| Podkarpackie | 1.13 | 0.51 | 0.00 | 0.83 | 0.00 | 0.68 | 0.00 | 0.51 |
| Podlaskie | 0.48 | 0.45 | 0.00 | 0.73 | 0.00 | 0.00 | 0.00 | 1.32 |
| Pomorskie | 1.06 | 0.16 | 0.00 | 1.58 | 0.00 | 0.46 | 0.00 | 0.27 |
| Śląskie | 0.94 | 0.55 | 0.00 | 2.00 | 0.26 | 0.67 | 0.07 | 0.39 |
| Świętokrzyskie | 1.27 | 0.51 | 0.00 | 1.37 | 0.00 | 2.50 | 0.24 | 0.48 |
| Warmińsko-Mazurskie | 0.95 | 0.31 | 0.58 | 3.03 | 0.90 | 0.88 | 0.25 | 0.41 |
| Wielkopolskie | 1.19 | 0.52 | 0.00 | 1.22 | 0.00 | 0.41 | 0.00 | 0.28 |
| Zachodniopomorskie | 1.16 | 0.32 | 0.00 | 0.45 | 0.00 | 0.50 | 0.00 | 0.00 |
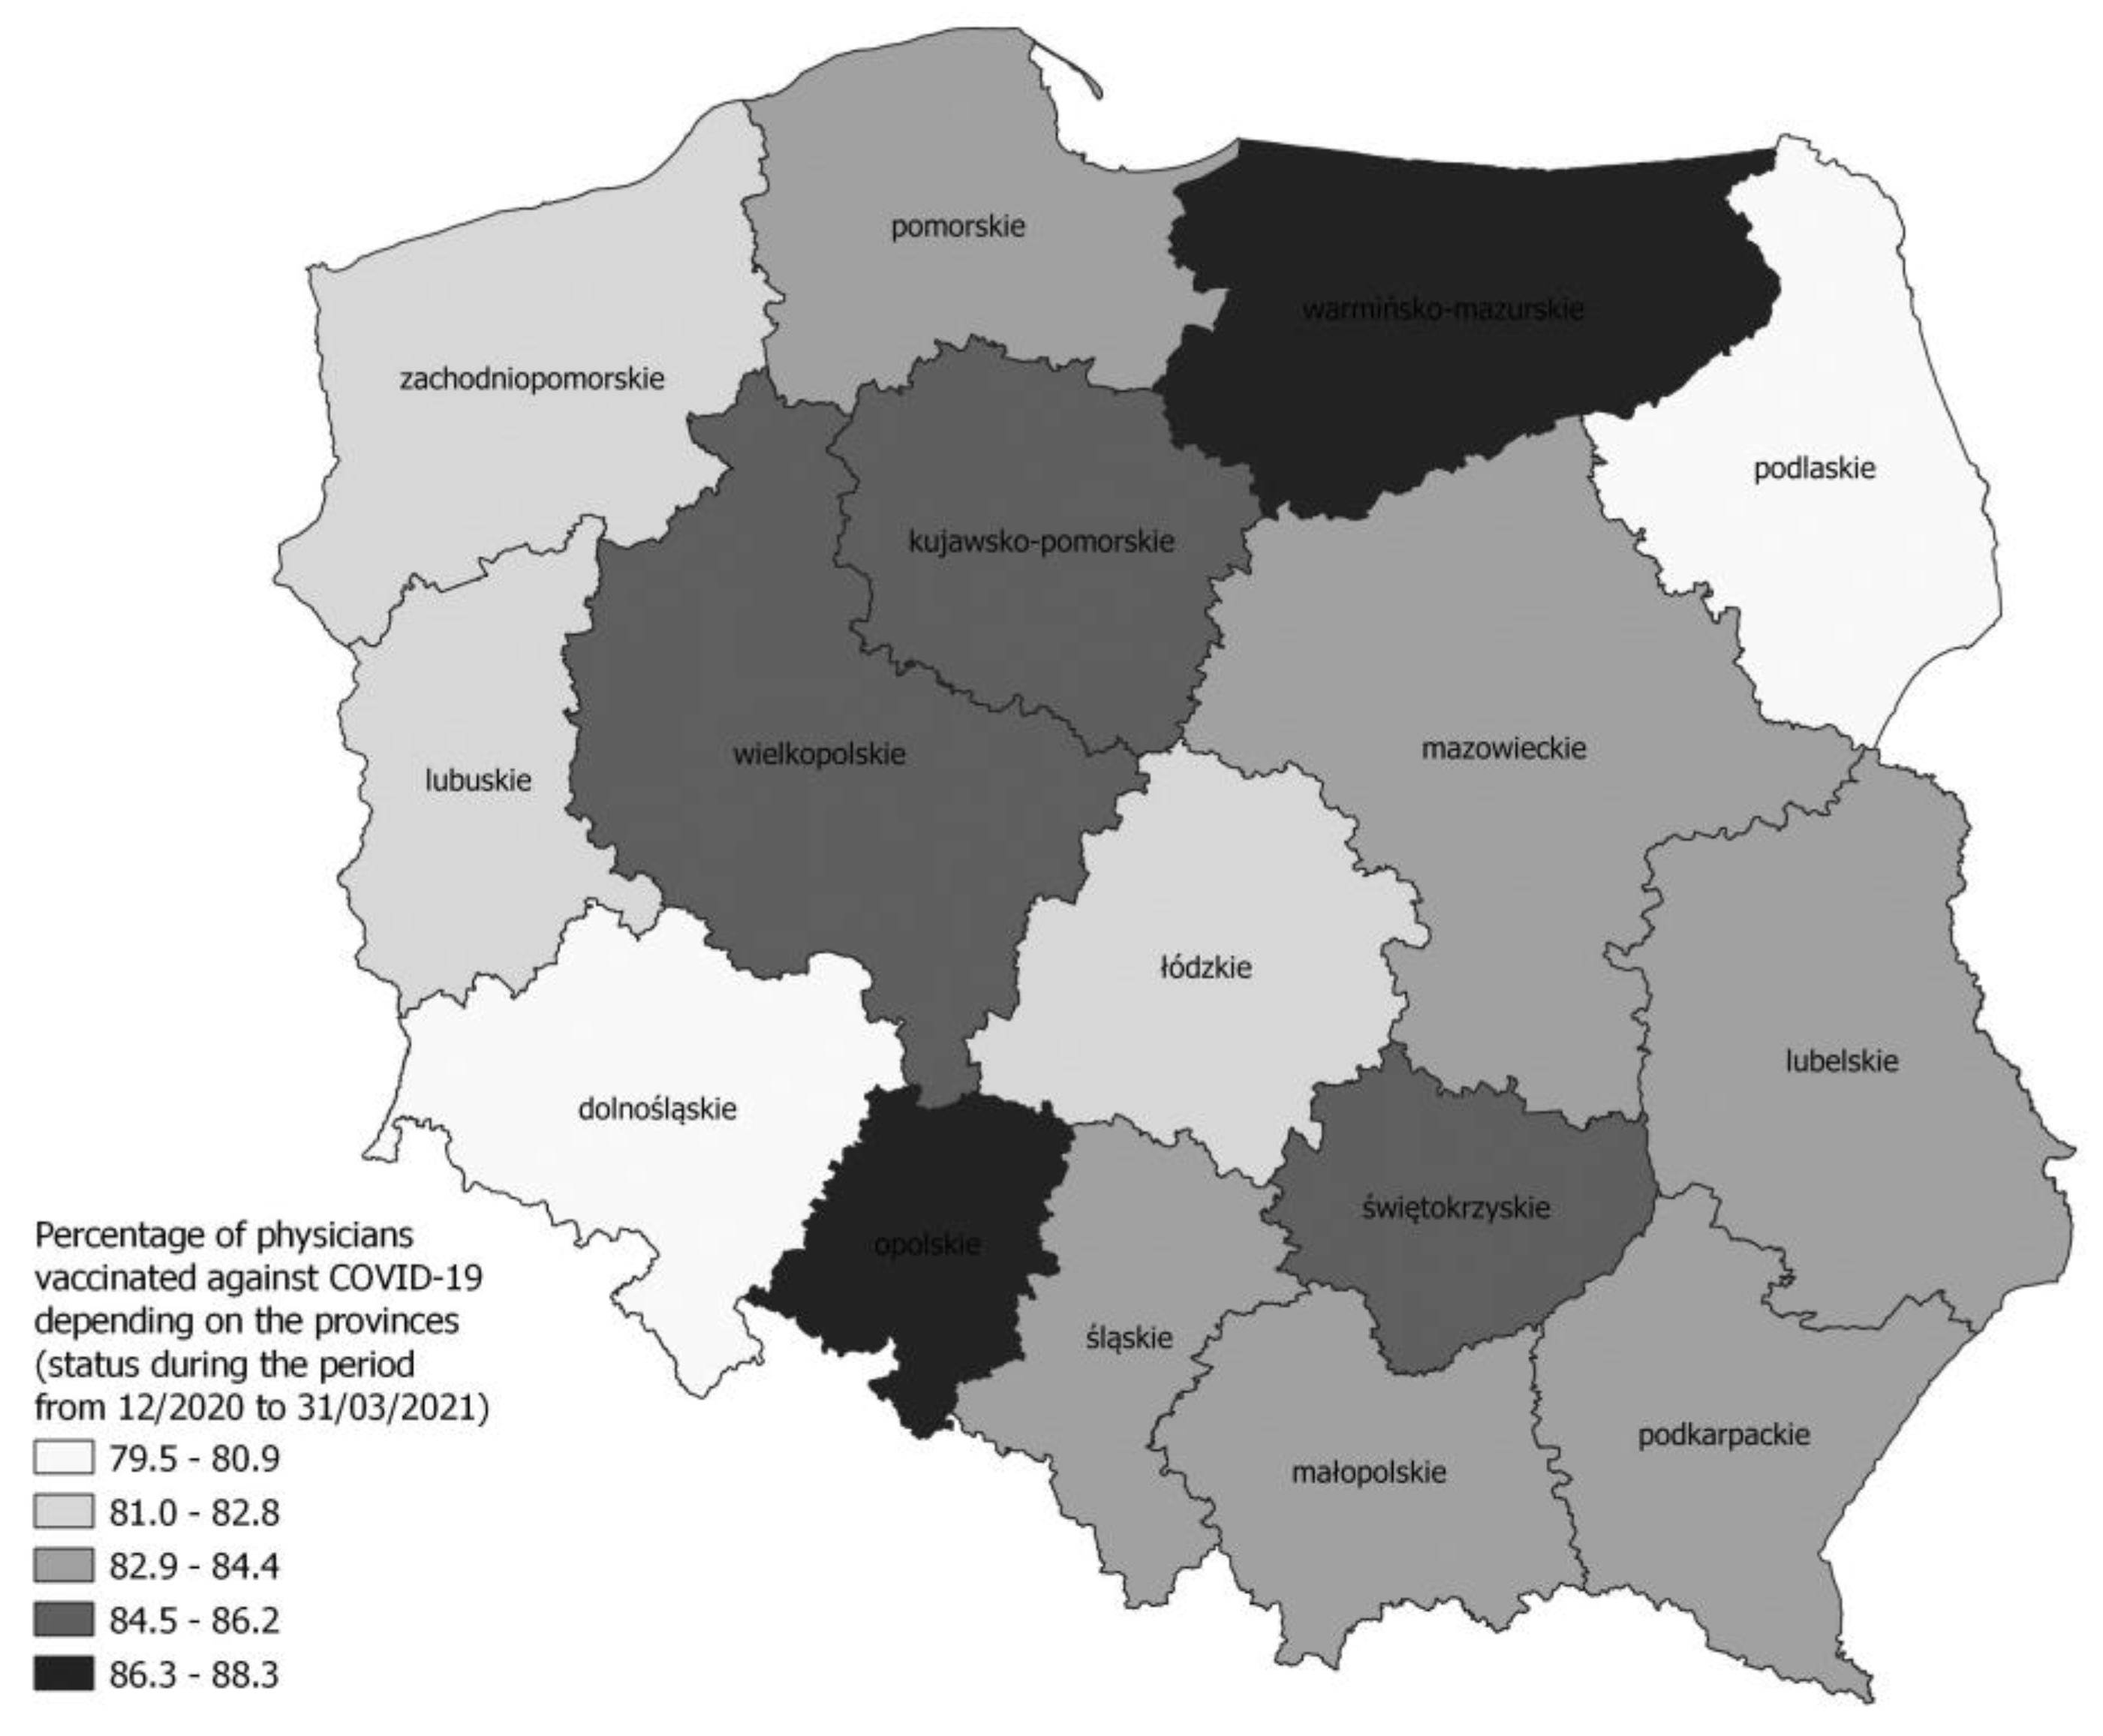
| Voivodship | % DOC | % NUR | % PM | % DEN | % LAB | % PHA | % PHY | % MID |
|---|---|---|---|---|---|---|---|---|
| Total | 83.63 | 54.53 | 63.14 | 70.85 | 65.70 | 61.35 | 38.20 | 54.43 |
| Dolnośląskie | 80.92 | 54.63 | 61.28 | 69.87 | 71.07 | 60.68 | 38.97 | 55.49 |
| Kujawsko-Pomorskie | 86.16 | 62.85 | 51.55 | 76.51 | 66.59 | 74.42 | 48.78 | 61.08 |
| Łódzkie | 82.11 | 56.84 | 67.59 | 67.87 | 61.68 | 57.07 | 39.81 | 53.41 |
| Lubelskie | 83.48 | 52.98 | 60.12 | 71.53 | 59.77 | 73.20 | 32.47 | 51.70 |
| Lubuskie | 82.81 | 58.84 | 71.60 | 71.54 | 67.25 | 72.98 | 39.81 | 56.25 |
| Małopolskie | 83.65 | 53.11 | 63.72 | 71.55 | 65.08 | 57.25 | 35.18 | 51.99 |
| Mazowieckie | 83.53 | 54.74 | 83.27 | 68.23 | 68.10 | 59.15 | 42.08 | 58.43 |
| Opolskie | 87.39 | 55.46 | 60.72 | 77.16 | 62.80 | 77.61 | 36.40 | 50.00 |
| Podkarpackie | 83.49 | 43.68 | 42.26 | 68.60 | 53.09 | 66.45 | 28.63 | 46.72 |
| Podlaskie | 79.47 | 47.35 | 45.74 | 65.60 | 54.61 | 58.58 | 28.79 | 50.17 |
| Pomorskie | 83.48 | 60.38 | 51.83 | 70.31 | 72.35 | 58.51 | 47.64 | 60.78 |
| Śląskie | 84.38 | 49.52 | 62.67 | 72.41 | 65.10 | 56.81 | 36.90 | 48.81 |
| Świętokrzyskie | 85.95 | 55.29 | 71.31 | 71.37 | 59.43 | 67.79 | 35.84 | 51.40 |
| Warmińsko-Mazurskie | 88.26 | 62.78 | 72.96 | 76.89 | 72.15 | 80.13 | 41.11 | 65.19 |
| Wielkopolskie | 85.62 | 59.08 | 77.94 | 74.79 | 72.36 | 61.85 | 38.42 | 57.32 |
| Zachodniopomorskie | 82.45 | 57.95 | 68.32 | 71.14 | 70.05 | 49.54 | 38.99 | 57.84 |
Disclaimer/Publisher’s Note: The statements, opinions and data contained in all publications are solely those of the individual author(s) and contributor(s) and not of MDPI and/or the editor(s). MDPI and/or the editor(s) disclaim responsibility for any injury to people or property resulting from any ideas, methods, instructions or products referred to in the content. |
© 2023 by the authors. Licensee MDPI, Basel, Switzerland. This article is an open access article distributed under the terms and conditions of the Creative Commons Attribution (CC BY) license (https://creativecommons.org/licenses/by/4.0/).
Share and Cite
Wojczyk, M.; Niewiadomska, E.; Kowalska, M. The Incidence Proportion of SARS-CoV-2 Infections and the Percentage of Deaths among Infected Healthcare Workers in Poland. J. Clin. Med. 2023, 12, 3714. https://doi.org/10.3390/jcm12113714
Wojczyk M, Niewiadomska E, Kowalska M. The Incidence Proportion of SARS-CoV-2 Infections and the Percentage of Deaths among Infected Healthcare Workers in Poland. Journal of Clinical Medicine. 2023; 12(11):3714. https://doi.org/10.3390/jcm12113714
Chicago/Turabian StyleWojczyk, Marek, Ewa Niewiadomska, and Małgorzata Kowalska. 2023. "The Incidence Proportion of SARS-CoV-2 Infections and the Percentage of Deaths among Infected Healthcare Workers in Poland" Journal of Clinical Medicine 12, no. 11: 3714. https://doi.org/10.3390/jcm12113714
APA StyleWojczyk, M., Niewiadomska, E., & Kowalska, M. (2023). The Incidence Proportion of SARS-CoV-2 Infections and the Percentage of Deaths among Infected Healthcare Workers in Poland. Journal of Clinical Medicine, 12(11), 3714. https://doi.org/10.3390/jcm12113714