
Management of Adrenal Cortical Adenomas: Assessment of Bone Status in Patients with (Non-Functioning) Adrenal Incidentalomas

 ,
,
Abstract
:1. Introduction
1.1. AI and Potential Cortisol Excess
1.2. Cortisol Overproduction Targeting Bone Status
1.3. ACS-Associated Spectrum
1.4. Aim
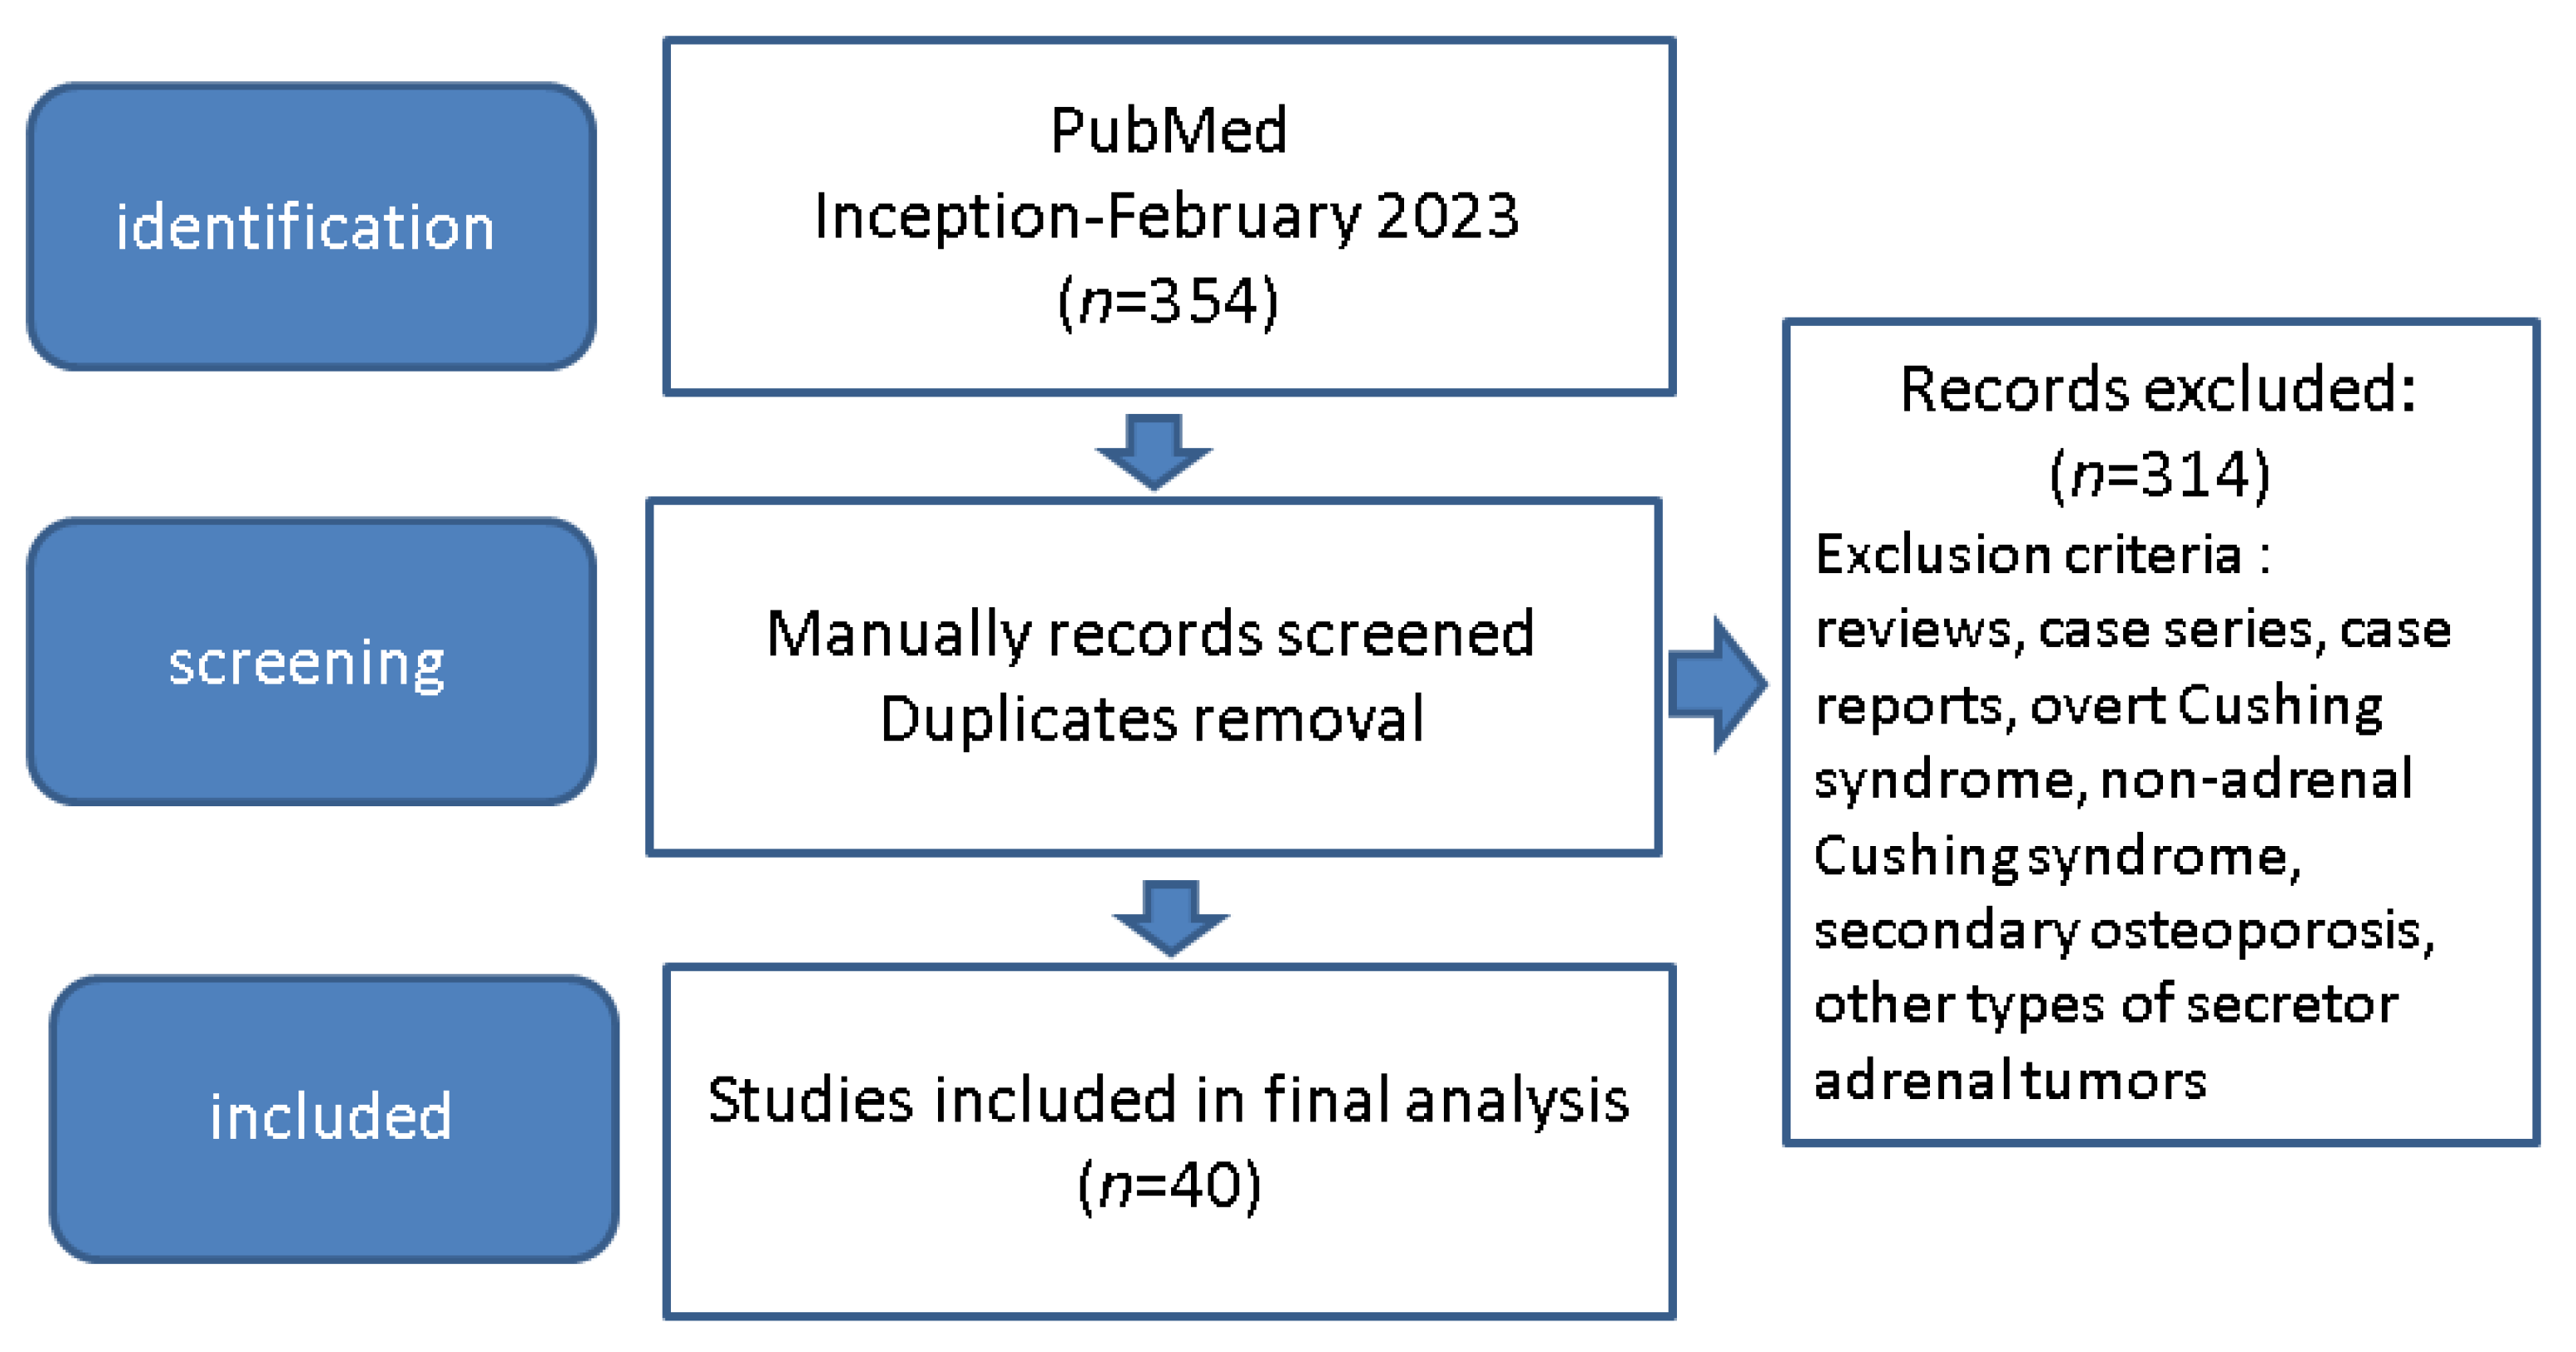
2. Materials and Methods
3. Results
3.1. Assessing ACS (or SCS) in Patients with Adrenal Tumours
3.2. BMD Analysis in Patients with ACS
3.3. TBS Anomalies Due to ACS-AIs
3.4. BTMs with Regard to AI-ACS
3.5. Bone Assessment in Patients with Unilateral Versus Bilateral AIs
3.6. Prevalent Fractures in Individuals with AI and ACS
3.7. Longitudinal Studies following Bone Status with Regard to ACS and AIs
4. Discussions
4.1. Prevalence of ACS in Patients with Osteoporosis and Fracture
4.2. Controversies in Defining Subtle (Non-Overt) Cortisol Excess Due to Adrenal Cortex Adenomas
4.3. Bone Status and ACS
4.4. Interventional Considerations
4.5. Further Considerations
5. Conclusions
Author Contributions
Funding
Institutional Review Board Statement
Informed Consent Statement
Data Availability Statement
Acknowledgments
Conflicts of Interest
Abbreviations
| aBMD | areal bone mineral density |
| ACS | autonomous cortisol secretion |
| Ad-SoS | amplitude dependent speed of sound |
| AI | adrenal incidentaloma |
| ACTH | adrenocorticotropic hormone |
| baPWV | brachial-ankle pulse wave velocity |
| BMD | bone mineral density |
| BTM | bone turnover markers |
| BV/TV | bone volume fraction |
| Ca | serum calcium |
| CI | confidence interval |
| CS | Cushing’s syndrome |
| CRH | corticotropin-releasing hormone |
| DHEA-S | dehydroepiandrosterone sulphate |
| DST | dexamethasone suppression test |
| DXA | dual energy X-ray absorptiometry |
| F | female |
| FN | femoral neck |
| FRAX | fracture risk assessment |
| HPA | hypothalamic–pituitary–adrenal |
| HR-pQCT | high-resolution peripheral quantitative computed tomography |
| ICTP | carboxy-terminal cross-linked telopeptide of type I collagen |
| iPTH | intact parathyroid hormone |
| IQR | interquartile range |
| LDDST | low dose dexamethasone suppression test |
| LS | lumbar spine |
| M | male |
| MAC S | mild autonomous cortisol secretion |
| N | number of patients |
| OR | odds ratio |
| PICP | carboxy-terminal propeptide of type I procollagen |
| PIIINP | amino-terminal propeptide of type III procollagen |
| PINP | N-terminal propeptide of type I collagen |
| QCT | quantitative computed tomography |
| RANKL | receptor activator of nuclear factor kappa-Β ligand |
| SCS | subclinical Cushing’s syndrome |
| SD | standard deviation |
| SDI | spinal deformity index |
| SH | subclinical hypercortisolism |
| TBS | trabecular bone score |
| UFC | urinary free cortisol |
| vBMD | volumetric bone mineral density |
| VFx | vertebral fractures |
| y | year |
References
- Mete, O.; Erickson, L.A.; Juhlin, C.C.; de Krijger, R.R.; Sasano, H.; Volante, M.; Papotti, M.G. Overview of the 2022 WHO Classification of Adrenal Cortical Tumors. Endocr. Pathol. 2022, 33, 155–196. [Google Scholar] [CrossRef] [PubMed]
- Patrova, J.; Jarocka, I.; Wahrenberg, H.; Falhammar, H. Clinical Outcomes in Adrenal Incidentaloma: Experience from one Center. Endocr. Pract. 2015, 21, 870–877. [Google Scholar] [CrossRef] [PubMed]
- Mantero, F.; Terzolo, M.; Arnaldi, G.; Osella, G.; Masini, A.M.; Alì, A.; Giovagnetti, M.; Opocher, G.; Angeli, A. A Survey on Adrenal Incidentaloma in Italy. J. Clin. Endocrinol. Metab. 2000, 85, 637–644. [Google Scholar] [CrossRef] [PubMed]
- Bovio, S.; Cataldi, A.; Reimondo, G.M.; Sperone, P.; Novello, S.; Berruti, A.; Borasio, P.; Fava, C.; Dogliotti, L.; Scagliotti, G.V.; et al. Prevalence of adrenal incidentaloma in a contemporary computerized tomography series. J. Endocrinol. Investig. 2006, 29, 298–302. [Google Scholar] [CrossRef]
- Barzon, L.; Sonino, N.; Fallo, F.; Palu, G.; Boscaro, M. Prevalence and natural history of adrenal incidentalomas. Eur. J. Endocrinol. 2003, 149, 273–285. [Google Scholar] [CrossRef] [Green Version]
- Song, J.H.; Chaudhry, F.S.; Mayo-Smith, W.W. The Incidental Adrenal Mass on CT: Prevalence of Adrenal Disease in 1049 Consecutive Adrenal Masses in Patients with No Known Malignancy. Am. J. Roentgenol. 2008, 190, 1163–1168. [Google Scholar] [CrossRef] [Green Version]
- Hammarstedt, L.; Muth, A.; Wängberg, B.; Björneld, L.; Sigurjónsdóttir, H.A.; Götherström, G.; Almqvist, E.; Widell, H.; Carlsson, S.; Ander, S.; et al. Adrenal lesion frequency: A prospective, cross-sectional CT study in a defined region, including systematic re-evaluation. Acta Radiol. 2010, 51, 1149–1156. [Google Scholar] [CrossRef]
- Terzolo, M.; Stigliano, A.; Chiodini, I.; Loli, P.; Furlani, L.; Arnaldi, G.; Reimondo, G.; Pia, A.; Toscano, V.; Zini, M.; et al. AME Position Statement on adrenal incidentaloma. Eur. J. Endocrinol. 2011, 164, 851–870. [Google Scholar] [CrossRef] [Green Version]
- Ichijo, T.; Ueshiba, H.; Nawata, H.; Yanase, T. A nationwide survey of adrenal incidentalomas in Japan: The first report of clinical and epidemiological features. Endocr. J. 2020, 67, 141–152. [Google Scholar] [CrossRef] [Green Version]
- Kasperlik-Załuska, A.; Otto, M.; Cichocki, A.; Rosłonowska, E.; Słowińska-Srzednicka, J.; Jeske, W.; Papierska, L.; Zgliczyński, W. Incidentally Discovered Adrenal Tumors: A Lesson from Observation of 1444 Patients. Horm. Metab. Res. 2008, 40, 338–341. [Google Scholar] [CrossRef]
- Kloos, R.T.; Gross, M.D.; Francis, I.R.; Korobkin, M.; Shapiro, B. Incidentally Discovered Adrenal Masses. Endocr. Rev. 1995, 16, 460–484. [Google Scholar] [CrossRef]
- Reincke, M. Subclinical Cushing’s Syndrome. Endocrinol. Metab. Clin. N. Am. 2000, 29, 43–56. [Google Scholar] [CrossRef]
- Beierwaltes, W.H.; Sturman, M.F.; Ryo, U.; Ice, R.D. Imaging functional nodules of the adrenal glands with 131-I-19-iodocholesterol. J. Nucl. Med. 1974, 15, 246–251. [Google Scholar]
- Fassnacht, M.; Arlt, W.; Bancos, I.; Dralle, H.; Newell-Price, J.; Sahdev, A.; Tabarin, A.; Terzolo, M.; Tsagarakis, S.; Dekkers, O.M. Management of adrenal incidentalomas: European Society of Endocrinology Clinical Practice Guideline in collaboration with the European Network for the Study of Adrenal Tumors. Eur. J. Endocrinol. 2016, 175, G1–G34. [Google Scholar] [CrossRef] [Green Version]
- NIH Consensus Development Program. NIH State-of-the-Science Statement on Management of the Clinically Inapparent Adrenal Mass (“Incidentaloma”); National Institutes of Health: Bethesda, MD, USA, 2002; Volume 19, pp. 1–25.
- Nieman, L.K.; Biller, B.M.K.; Findling, J.W.; Newell-Price, J.; Savage, M.O.; Stewart, P.M.; Montori, V.M. The Diagnosis of Cushing’s Syndrome: An Endocrine Society Clinical Practice Guideline. J. Clin. Endocrinol. Metab. 2008, 93, 1526–1540. [Google Scholar] [CrossRef]
- Tabarin, A.; Bardet, S.; Bertherat, J.; Dupas, B.; Chabre, O.; Hamoir, E.; Laurent, F.; Tenenbaum, F.; Cazalda, M.; Lefebvre, H.; et al. Exploration and management of adrenal incidentalomas. Ann. D’endocrinologie 2008, 69, 487–500. [Google Scholar] [CrossRef]
- Zeiger, M.A.; Thompson, G.B.; Duh, Q.-Y.; Hamrahian, A.H.; Angelos, P.; Elaraj, D.; Fishman, E.; Kharlip, J.; Garber, J.R.; Mechanick, J.I.; et al. American Association of Clinical Endocrinologists and American Association of Endocrine Surgeons Medical Guidelines for the Management of Adrenal Incidentalomas: Executive Summary of Recommendations. Endocr. Pract. 2009, 15, 450–453. [Google Scholar] [CrossRef]
- Lee, J.-M.; Kim, M.K.; Ko, S.-H.; Koh, J.-M.; Kim, B.-Y.; Kim, S.W.; Kim, S.-K.; Kim, H.J.; Ryu, O.-H.; Park, J.; et al. Clinical Guidelines for the Management of Adrenal Incidentaloma. Endocrinol. Metab. 2017, 32, 200–218. [Google Scholar] [CrossRef]
- Elhassan, Y.S.; Alahdab, F.; Prete, A.; Delivanis, D.A.; Khanna, A.; Prokop, L.; Murad, M.H.; O’Reilly, M.W.; Arlt, W.; Bancos, I. Natural History of Adrenal Incidentalomas With and Without Mild Autonomous Cortisol Excess. Ann. Intern. Med. 2019, 171, 107–116. [Google Scholar] [CrossRef]
- Briot, K. Bone and glucocorticoids. Ann. D’endocrinologie 2018, 79, 115–118. [Google Scholar] [CrossRef]
- Hardy, R.; Zhou, H.; Seibel, M.J.; Cooper, M.S. Glucocorticoids and Bone: Consequences of Endogenous and Exogenous Excess and Replacement Therapy. Endocr. Rev. 2018, 39, 519–548. [Google Scholar] [CrossRef] [PubMed] [Green Version]
- Patschan, D.; Loddenkemper, K.; Buttgereit, F. Molecular mechanisms of glucocorticoid-induced osteoporosis. Bone 2001, 29, 498–505. [Google Scholar] [CrossRef] [PubMed]
- Maeda, K.; Kobayashi, Y.; Koide, M.; Uehara, S.; Okamoto, M.; Ishihara, A.; Kayama, T.; Saito, M.; Marumo, K. The Regulation of Bone Metabolism and Disorders by Wnt Signaling. Int. J. Mol. Sci. 2019, 20, 5525. [Google Scholar] [CrossRef] [PubMed] [Green Version]
- Van Bezooijen, R.L.; Roelen, B.A.; Visser, A.; Van Der Wee-Pals, L.; De Wilt, E.; Karperien, M.; Hamersma, H.; Papapoulos, S.E.; Dijke, P.T.; Löwik, C.W. Sclerostin Is an Osteocyte-expressed Negative Regulator of Bone Formation, But Not a Classical BMP Antagonist. J. Exp. Med. 2004, 199, 805–814. [Google Scholar] [CrossRef]
- Van Lierop, A.H.; van der Eerden, A.; Hamdy, N.A.T.; Hermus, A.R.; Heijer, M.D.; Papapoulos, S.E. Circulating Sclerostin Levels Are Decreased in Patients with Endogenous Hypercortisolism and Increase after Treatment. J. Clin. Endocrinol. Metab. 2012, 97, E1953–E1957. [Google Scholar] [CrossRef] [Green Version]
- O’brien, C.A.; Jia, D.; Plotkin, L.I.; Bellido, T.; Powers, C.C.; Stewart, S.A.; Manolagas, S.C.; Weinstein, R.S. Glucocorticoids Act Directly on Osteoblasts and Osteocytes to Induce Their Apoptosis and Reduce Bone Formation and Strength. Endocrinology 2004, 145, 1835–1841. [Google Scholar] [CrossRef] [Green Version]
- Canalis, E. Mechanisms of glucocorticoid action in bone. Curr. Osteoporos. Rep. 2005, 3, 98–102. [Google Scholar] [CrossRef]
- Pereira, R.M.R.; Delany, A.; Canalis, E. Cortisol inhibits the differentiation and apoptosis of osteoblasts in culture. Bone 2001, 28, 484–490. [Google Scholar] [CrossRef]
- Hildebrandt, S.; Baschant, U.; Thiele, S.; Tuckermann, J.; Hofbauer, L.C.; Rauner, M. Glucocorticoids suppress Wnt16 expression in osteoblasts in vitro and in vivo. Sci. Rep. 2018, 8, 8711. [Google Scholar] [CrossRef] [Green Version]
- Yao, W.; Dai, W.; Jiang, L.; Lay, E.Y.-A.; Zhong, Z.; Ritchie, R.O.; Li, X.; Ke, H.; Lane, N.E. Sclerostin-antibody treatment of glucocorticoid-induced osteoporosis maintained bone mass and strength. Osteoporos. Int. 2015, 27, 283–294. [Google Scholar] [CrossRef] [Green Version]
- Favero, V.; Cremaschi, A.; Parazzoli, C.; Falchetti, A.; Gaudio, A.; Gennari, L.; Scillitani, A.; Vescini, F.; Morelli, V.; Aresta, C.; et al. Pathophysiology of Mild Hypercortisolism: From the Bench to the Bedside. Int. J. Mol. Sci. 2022, 23, 673. [Google Scholar] [CrossRef]
- Huizenga, N.A.T.M.; Koper, J.W.; de Lange, P.; Pols, H.A.P.; Stolk, R.P.; Burger, H.; Grobbee, D.E.; Brinkmann, A.O.; de Jong, F.H.; Lamberts, S.W.J. A Polymorphism in the Glucocorticoid Receptor Gene May Be Associated with an Increased Sensitivity to Glucocorticoids in vivo. J. Clin. Endocrinol. Metab. 1998, 83, 144–151. [Google Scholar] [CrossRef]
- Tzanela, M.; Mantzou, E.; Saltiki, K.; Tampourlou, M.; Kalogeris, N.; Hadjidakis, D.; Tsagarakis, S.; Alevizaki, M. Clinical and biochemical impact of BCL1 polymorphic genotype of the glucocorticoid receptor gene in patients with adrenal incidentalomas. J. Endocrinol. Investig. 2011, 35, 395–400. [Google Scholar] [CrossRef]
- Van Rossum, E.F.C.; Voorhoeve, P.G.; Velde, S.J.T.; Koper, J.W.; De Waal, H.A.D.-V.; Kemper, H.C.G.; Lamberts, S.W.J. The ER22/23EK Polymorphism in the Glucocorticoid Receptor Gene Is Associated with a Beneficial Body Composition and Muscle Strength in Young Adults. J. Clin. Endocrinol. Metab. 2004, 89, 4004–4009. [Google Scholar] [CrossRef] [Green Version]
- Lupsa, B.C.; Insogna, K. Bone Health and Osteoporosis. Endocrinol. Metab. Clin. N. Am. 2015, 44, 517–530. [Google Scholar] [CrossRef]
- McCloskey, E.V.; Oden, A.; Harvey, N.C.; Leslie, W.D.; Hans, D.; Johansson, H.; Barkmann, R.; Boutroy, S.; Brown, J.; Chapurlat, R.; et al. A meta-analysis oftrabecular bone score in fracture risk prediction and its relationship to FRAX. J. Bone Miner. Res. 2016, 31, 940–948. [Google Scholar] [CrossRef] [Green Version]
- Delmas, P.; Malaval, L.; Arlot, M.; Meunier, P. Serum bone Gla-protein compared to bone histomorphometry in endocrine diseases. Bone 1985, 6, 339–341. [Google Scholar] [CrossRef]
- Lekamwasam, S.; Adachi, J.D.; Agnusdei, D.; Bilezikian, J.; Boonen, S.; Borgström, F.; Cooper, C.; Perez, A.D.; Eastell, R.; Joint IOF-ECTS GIO Guidelines Working Group; et al. A framework for the development of guidelines for the management of glucocorticoid-induced osteoporosis. Osteoporos. Int. 2012, 23, 2257–2276. [Google Scholar] [CrossRef]
- Grossman, J.M.; Gordon, R.; Ranganath, V.K.; Deal, C.; Caplan, L.; Chen, W.; Curtis, J.R.; Furst, D.E.; McMahon, M.; Patkar, N.M.; et al. American College of Rheumatology 2010 recommendations for the prevention and treatment of glucocorticoid-induced osteoporosis. Arthritis Care Res. 2010, 62, 1515–1526. [Google Scholar] [CrossRef]
- Dore, R.K.; Cohen, S.B.; Lane, N.E.; Palmer, W.; Shergy, W.; Zhou, L.; Wang, H.; Tsuji, W.; Newmark, R.; on behalf of the Denosumab RA Study Group. Effects of denosumab on bone mineral density and bone turnover in patients with rheumatoid arthritis receiving concurrent glucocorticoids or bisphosphonates. Ann. Rheum. Dis. 2009, 69, 872–875. [Google Scholar] [CrossRef]
- Di Somma, C.; Colao, A.; Pivonello, R.; Klain, M.; Faggiano, A.; Tripodi, F.S.; Merola, B.; Salvatore, M.; Lombardi, G. Effectiveness of chronic treatment with alendronate in the osteoporosis of Cushing’s disease. Clin. Endocrinol. 1998, 48, 655–662. [Google Scholar] [CrossRef] [PubMed]
- Reincke, M.; Nieke, J.; Krestin, G.P.; Saeger, W.; Allolio, B.; Winkelmann, W. Preclinical Cushing’s syndrome in adrenal “incidentalomas”: Comparison with adrenal Cushing’s syndrome. J. Clin. Endocrinol. Metab. 1992, 75, 826–832. [Google Scholar] [CrossRef] [PubMed]
- Ambrosi, B.; Peverelli, S.; Passini, E.; Re, T.; Ferrario, R.; Colombo, P.; Sartorio, A.; Faglia, G. Abnormalities of endocrine function in patients with clinically “silent” adrenal masses. Eur. J. Endocrinol. 1995, 132, 422–428. [Google Scholar] [CrossRef] [PubMed] [Green Version]
- Osella, G.; Terzolo, M.; Reimondo, G.; Piovesan, A.; Pia, A.; Termine, A.; Paccotti, P.; Angeli, A. Serum Markers of Bone and Collagen Turnover in Patients with Cushing’s Syndrome and in Subjects with Adrenal Incidentalomas. J. Clin. Endocrinol. Metab. 1997, 82, 3303–3307. [Google Scholar] [CrossRef]
- Sartorio, A.; Conti, A.; Ferrero, S.; Giambona, S.; Re, T.; Passini, E.; Ambrosi, B. Evaluation of markers of bone and collagen turnover in patients with active and preclinical Cushing’s syndrome and in patients with adrenal incidentaloma. Eur. J. Endocrinol. 1998, 138, 146–152. [Google Scholar] [CrossRef] [Green Version]
- Rossi, R.; Tauchmanova, L.; Luciano, A.; Di Martino, M.; Battista, C.; Del Viscovo, L.; Nuzzo, V.; Lombardi, G. Subclinical Cushing’s Syndrome in Patients with Adrenal Incidentaloma: Clinical and Biochemical Features. J. Clin. Endocrinol. Metab. 2000, 85, 1440–1448. [Google Scholar] [CrossRef] [Green Version]
- Torlontano, M.; Chiodini, I.; Pileri, M.; Guglielmi, G.; Cammisa, M.; Modoni, S.; Carnevale, V.; Trischitta, V.; Scillitani, A. Altered Bone Mass and Turnover in Female Patients with Adrenal Incidentaloma: The Effect of Subclinical Hypercortisolism. J. Clin. Endocrinol. Metab. 1999, 84, 2381–2385. [Google Scholar] [CrossRef]
- Osella, G.; Reimondo, G.; Peretti, P.; Ali, A.; Paccotti, P.; Angeli, A.; Terzolo, M. The Patients with Incidentally Discovered Adrenal Adenoma (Incidentaloma) Are Not at Increased Risk of Osteoporosis. J. Clin. Endocrinol. Metab. 2001, 86, 604–607. [Google Scholar] [CrossRef]
- Chiodini, I.; Torlontano, M.; Carnevale, V.; Guglielmi, G.; Cammisa, M.; Trischitta, V.; Scillitani, A. Bone Loss Rate in Adrenal Incidentalomas: A Longitudinal Study. J. Clin. Endocrinol. Metab. 2001, 86, 5337–5341. [Google Scholar] [CrossRef]
- Tauchmanova, L.; Rossi, R.; Nuzzo, V.; del Puente, A.; Puente, A.E.-D.; Pizzi, C.; Fonderico, F.; Lupoli, G.; Lombardi, G. Bone loss determined by quantitative ultrasonometry correlates inversely with disease activity in patients with endogenous glucocorticoid excess due to adrenal mass. Eur. J. Endocrinol. 2001, 145, 241–247. [Google Scholar] [CrossRef] [Green Version]
- Chiodini, I.; Tauchmanovà, L.; Torlontano, M.; Battista, C.; Guglielmi, G.; Cammisa, M.; Colao, A.; Carnevale, V.; Rossi, R.; Di Lembo, S.; et al. Bone Involvement in Eugonadal Male Patients with Adrenal Incidentaloma and Subclinical Hypercortisolism. J. Clin. Endocrinol. Metab. 2002, 87, 5491–5494. [Google Scholar] [CrossRef] [Green Version]
- Francucci, C.M.; Pantanetti, P.; Garrapa, G.G.; Massi, F.; Arnaldi, G.; Mantero, F. Bone metabolism and mass in women with Cushing’s syndrome and adrenal incidentaloma. Clin. Endocrinol. 2002, 57, 587–593. [Google Scholar] [CrossRef]
- Hadjidakis, D.; Tsagarakis, S.; Roboti, C.; Sfakianakis, M.; Iconomidou, V.; Raptis, S.A.; Thalassinos, N. Does subclinical hypercortisolism adversely affect the bone mineral density of patients with adrenal incidentalomas? Clin. Endocrinol. 2003, 58, 72–77. [Google Scholar] [CrossRef]
- Chiodini, I.; Guglielmi, G.; Battista, C.; Carnevale, V.; Torlontano, M.; Cammisa, M.; Trischitta, V.; Scillitani, A. Spinal Volumetric Bone Mineral Density and Vertebral Fractures in Female Patients with Adrenal Incidentalomas: The Effects of Subclinical Hypercortisolism and Gonadal Status. J. Clin. Endocrinol. Metab. 2004, 89, 2237–2241. [Google Scholar] [CrossRef] [Green Version]
- Tauchmanovà, L.; Pivonello, R.; De Martino, M.C.; Rusciano, A.; De Leo, M.; Ruosi, C.; Mainolfi, C.; Lombardi, G.; Salvatore, M.; Colao, A. Effects of sex steroids on bone in women with subclinical or overt endogenous hypercortisolism. Eur. J. Endocrinol. 2007, 157, 359–366. [Google Scholar] [CrossRef] [Green Version]
- Tauchmanovà, L.; Guerra, E.; Pivonello, R.; De Martino, M.C.; De Leo, M.; Caggiano, F.; Lombardi, G.; Colao, A. Weekly clodronate treatment prevents bone loss and vertebral fractures in women with subclinical Cushing’s syndrome. J. Endocrinol. Investig. 2009, 32, 390–394. [Google Scholar] [CrossRef]
- Chiodini, I.; Morelli, V.; Masserini, B.; Salcuni, A.S.; Eller-Vainicher, C.; Viti, R.; Coletti, F.; Guglielmi, G.; Battista, C.; Carnevale, V.; et al. Bone Mineral Density, Prevalence of Vertebral Fractures, and Bone Quality in Patients with Adrenal Incidentalomas with and without Subclinical Hypercortisolism: An Italian Multicenter Study. J. Clin. Endocrinol. Metab. 2009, 94, 3207–3214. [Google Scholar] [CrossRef] [Green Version]
- Chiodini, I.; Viti, R.; Coletti, F.; Guglielmi, G.; Battista, C.; Ermetici, F.; Morelli, V.; Salcuni, A.; Carnevale, V.; Urbano, F.; et al. Eugonadal male patients with adrenal incidentalomas and subclinical hypercortisolism have increased rate of vertebral fractures. Clin. Endocrinol. 2009, 70, 208–213. [Google Scholar] [CrossRef] [Green Version]
- Toniato, A.; Boschin, I.M.; Opocher, G.; Pelizzo, M.R.; Schiavi, F.; Ballotta, E. Surgical Versus Conservative Management for Subclinical Cushing Syndrome in Adrenal Incidentalomas: A Prospective Randomized Study. Ann. Surg. 2009, 249, 388–391. [Google Scholar] [CrossRef]
- Morelli, V.; Masserini, B.; Salcuni, A.S.; Eller-Vainicher, C.; Savoca, C.; Viti, R.; Coletti, F.; Guglielmi, G.; Battista, C.; Iorio, L.; et al. Subclinical Hypercortisolism: Correlation between biochemical diagnostic criteria and clinical aspects. Clin. Endocrinol. 2010, 73, 161–166. [Google Scholar] [CrossRef]
- Morelli, V.; Eller-Vainicher, C.; Salcuni, A.S.; Coletti, F.; Iorio, L.; Muscogiuri, G.; Della Casa, S.; Arosio, M.; Ambrosi, B.; Beck-Peccoz, P.; et al. Risk of new vertebral fractures in patients with adrenal incidentaloma with and without subclinical hypercortisolism: A multicenter longitudinal study. J. Bone Miner. Res. 2011, 26, 1816–1821. [Google Scholar] [CrossRef] [PubMed]
- Eller-Vainicher, C.; Morelli, V.; Ulivieri, F.M.; Palmieri, S.; Zhukouskaya, V.V.; Cairoli, E.; Pino, R.; Naccarato, A.; Scillitani, A.; Beck-Peccoz, P.; et al. Bone quality, as measured by trabecular bone score in patients with adrenal incidentalomas with and without subclinical hypercortisolism. J. Bone Miner. Res. 2012, 27, 2223–2230. [Google Scholar] [CrossRef] [PubMed] [Green Version]
- Iacobone, M.; Citton, M.; Viel, G.; Boetto, R.; Bonadio, I.; Mondi, I.; Tropea, S.; Nitti, D.; Favia, G. Adrenalectomy may improve cardiovascular and metabolic impairment and ameliorate quality of life in patients with adrenal incidentalomas and subclinical Cushing’s syndrome. Surgery 2012, 152, 991–997. [Google Scholar] [CrossRef] [PubMed]
- Morelli, V.; Palmieri, S.; Salcuni, A.S.; Eller-Vainicher, C.; Cairoli, E.; Zhukouskaya, V.; Scillitani, A.; Beck-Peccoz, P.; Chiodini, I. Bilateral and unilateral adrenal incidentalomas: Biochemical and clinical characteristics. Eur. J. Endocrinol. 2013, 168, 235–241. [Google Scholar] [CrossRef] [Green Version]
- Palmieri, S.; Morelli, V.; Polledri, E.; Fustinoni, S.; Mercadante, R.; Olgiati, L.; Vainicher, C.E.; Cairoli, E.; Zhukouskaya, V.V.; Beck-Peccoz, P.; et al. The role of salivary cortisol measured by liquid chromatography–tandem mass spectrometry in the diagnosis of subclinical hypercortisolism. Eur. J. Endocrinol. 2013, 168, 289–296. [Google Scholar] [CrossRef] [Green Version]
- Lasco, A.; Catalano, A.; Pilato, A.; Basile, G.; Mallamace, A.; Atteritano, M. Subclinical hypercortisol-assessment of bone fragility: Experience of single osteoporosis center in Sicily. Eur. Rev. Med. Pharmacol. Sci. 2014, 18, 352–358. [Google Scholar]
- Perogamvros, I.; Vassiliadi, D.; Karapanou, O.; Botoula, E.; Tzanela, M.; Tsagarakis, S. Biochemical and clinical benefits of unilateral adrenalectomy in patients with subclinical hypercortisolism and bilateral adrenal incidentalomas. Eur. J. Endocrinol. 2015, 173, 719–725. [Google Scholar] [CrossRef] [Green Version]
- Morelli, V.; Eller-Vainicher, C.; Palmieri, S.; Cairoli, E.; Salcuni, A.S.; Scillitani, A.; Carnevale, V.; Corbetta, S.; Arosio, M.; Della Casa, S.; et al. Prediction of Vertebral Fractures in Patients With Monolateral Adrenal Incidentalomas. J. Clin. Endocrinol. Metab. 2016, 101, 2768–2775. [Google Scholar] [CrossRef] [Green Version]
- Salcuni, A.S.; Morelli, V.; Vainicher, C.E.; Palmieri, S.; Cairoli, E.; Spada, A.; Scillitani, A.; Chiodini, I. Adrenalectomy reduces the risk of vertebral fractures in patients with monolateral adrenal incidentalomas and subclinical hypercortisolism. Eur. J. Endocrinol. 2016, 174, 261–269. [Google Scholar] [CrossRef] [Green Version]
- Ognjanović, S.; Macut, D.; Petakov, M.; Kovačević, V.E.; Isailović, T.; Antić, I.B.; Ilić, D.; Popović, B.; Bogavac, T.; Pekmezović, T.; et al. The Occurrence of Subclinical Hypercortisolism and Osteoporosis in Patients with Incidentally Discovered Unilateral and Bilateral Adrenal Tumors. J. Med. Biochem. 2016, 35, 401–409. [Google Scholar] [CrossRef] [Green Version]
- Vinolas, H.; Grouthier, V.; Mehsen-Cetre, N.; Boisson, A.; Winzenrieth, R.; Schaeverbeke, T.; Mesguich, C.; Bordenave, L.; Tabarin, A. Assessment of vertebral microarchitecture in overt and mild Cushing’s syndrome using trabecular bone score. Clin. Endocrinol. 2018, 89, 148–154. [Google Scholar] [CrossRef]
- Kim, B.-J.; Kwak, M.; Ahn, S.; Kim, J.; Lee, S.; Koh, J.-M. The association of cortisol and adrenal androgen with trabecular bone score in patients with adrenal incidentaloma with and without autonomous cortisol secretion. Osteoporos. Int. 2018, 29, 2299–2307. [Google Scholar] [CrossRef]
- Ahn, S.; Kim, J.H.; Cho, Y.Y.; Suh, S.; Kim, B.-J.; Hong, S.; Lee, S.; Koh, J.-M.; Song, K.-H. The effects of cortisol and adrenal androgen on bone mass in Asians with and without subclinical hypercortisolism. Osteoporos. Int. 2019, 30, 1059–1069. [Google Scholar] [CrossRef]
- Moraes, A.B.; De Paula, M.P.; Paranhos-Neto, F.D.P.; Cavalari, E.M.R.; De Morais, F.F.C.; Curi, D.S.C.; Lima, L.F.C.; De Mendonça, L.M.C.; Farias, M.L.F.; Madeira, M.; et al. Bone Evaluation by High-Resolution Peripheral Quantitative Computed Tomography in Patients With Adrenal Incidentaloma. J. Clin. Endocrinol. Metab. 2020, 105, e2726–e2737. [Google Scholar] [CrossRef]
- Athimulam, S.; Delivanis, D.; Thomas, M.; Young, W.F.; Khosla, S.; Drake, M.T.; Bancos, I. The Impact of Mild Autonomous Cortisol Secretion on Bone Turnover Markers. J. Clin. Endocrinol. Metab. 2020, 105, 1469–1477. [Google Scholar] [CrossRef]
- Ueland, G.; Grinde, T.; Methlie, P.; Kelp, O.; Løvås, K.; Husebye, E.S. Diagnostic testing of autonomous cortisol secretion in adrenal incidentalomas. Endocr. Connect. 2020, 9, 963–970. [Google Scholar] [CrossRef]
- Ishida, A.; Igarashi, K.; Ruike, Y.; Ishiwata, K.; Naito, K.; Kono, S.; Deguchi, H.; Fujimoto, M.; Shiga, A.; Suzuki, S.; et al. Association of urinary free cortisol with bone formation in patients with mild autonomous cortisol secretion. Clin. Endocrinol. 2020, 94, 544–550. [Google Scholar] [CrossRef]
- Podbregar, A.; Kocjan, T.; Rakuša, M.; Popović, P.; Garbajs, M.; Goricar, K.; Janez, A.; Jensterle, M. Natural history of nonfunctioning adrenal incidentalomas: A 10-year longitudinal follow-up study. Endocr. Connect. 2021, 10, 637–645. [Google Scholar] [CrossRef]
- Li, D.; Kaur, R.J.; Zhang, C.D.; Ebbehoj, A.; Singh, S.; Atkinson, E.J.; Achenbach, S.J.; Rocca, W.; Khosla, S.; Bancos, I. Risk of bone fractures after the diagnosis of adrenal adenomas: A population-based cohort study. Eur. J. Endocrinol. 2021, 184, 597–606. [Google Scholar] [CrossRef]
- Yano, C.; Yokomoto-Umakoshi, M.; Fujita, M.; Umakoshi, H.; Yano, S.; Iwahashi, N.; Katsuhara, S.; Kaneko, H.; Ogata, M.; Fukumoto, T.; et al. Coexistence of bone and vascular disturbances in patients with endogenous glucocorticoid excess. Bone Rep. 2022, 17, 101610. [Google Scholar] [CrossRef]
- Izawa, S.; Matsumoto, K.; Matsuzawa, K.; Katabami, T.; Yoshimoto, T.; Otsuki, M.; Sone, M.; Takeda, Y.; Okamura, S.; Ichijo, T.; et al. Sex Difference in the Association of Osteoporosis and Osteopenia Prevalence in Patients with Adrenal Adenoma and Different Degrees of Cortisol Excess. Int. J. Endocrinol. 2022, 2022, 5009395. [Google Scholar] [CrossRef]
- Chiodini, I.; Mascia, M.L.; Muscarella, S.; Battista, C.; Minisola, S.; Arosio, M.; Santini, S.A.; Guglielmi, G.; Carnevale, V.; Scillitani, A. Subclinical hypercortisolism among outpatients referred for osteoporosis. Ann. Intern. Med. 2007, 147, 541–548. [Google Scholar] [CrossRef] [PubMed]
- Pugliese, F.; Salcuni, A.S.; Battista, C.; Carnevale, V.; Guglielmi, G.; Columbu, C.; Velluzzi, F.; Giovanelli, L.; Eller-Vainicher, C.; Scillitani, A.; et al. Prevalence of less severe hypercortisolism in fractured patients admitted in an outpatient clinic for metabolic bone diseases. Endocrine 2021, 73, 203–208. [Google Scholar] [CrossRef] [PubMed]
- Charbonnel, B.; Chatal, J.F.; Ozanne, P. Does the corticoadrenal adenoma with “pre-Cushing’s syndrome” exist? J. Nucl. Med. 1981, 22, 1059–1061. [Google Scholar] [PubMed]
- Ross, N.S. Epidemiology of Cushing’s Syndrome and Subclinical Disease. Endocrinol. Metab. Clin. N. Am. 1994, 23, 539–546. [Google Scholar] [CrossRef]
- Sasaki, Y.; Katabami, T.; Asai, S.; Fukuda, H.; Tanaka, Y. In the overnight dexamethasone suppression test, 1.0 mg loading is superior to 0.5 mg loading for diagnosing subclinical adrenal Cushing’s syndrome based on plasma dexamethasone levels determined using liquid chromatography-tandem mass spectrometry. Endocr. J. 2017, 64, 833–842. [Google Scholar] [CrossRef] [Green Version]
- Grumbach, M.M.; Biller, B.M.K.; Braunstein, G.D.; Campbell, K.K.; Carney, J.A.; Godley, P.A.; Harris, E.L.; Lee, J.K.T.; Oertel, Y.C.; Posner, M.C.; et al. Management of the Clinically Inapparent Adrenal Mass (“Incidentaloma”). Ann. Intern. Med. 2003, 138, 424–429. [Google Scholar] [CrossRef]
- Eller-Vainicher, C.; Morelli, V.; Salcuni, A.S.; Battista, C.; Torlontano, M.; Coletti, F.; Iorio, L.; Cairoli, E.; Beck-Peccoz, P.; Arosio, M.; et al. Accuracy of several parameters of hypothalamic–pituitary–adrenal axis activity in predicting before surgery the metabolic effects of the removal of an adrenal incidentaloma. Eur. J. Endocrinol. 2010, 163, 925–935. [Google Scholar] [CrossRef] [Green Version]
- Vassiliadi, D.A.; Ntali, G.; Stratigou, T.; Adali, M.; Tsagarakis, S. Aberrant cortisol responses to physiological stimuli in patients presenting with bilateral adrenal incidentalomas. Endocrine 2011, 40, 437–444. [Google Scholar] [CrossRef]
- Vassilatou, E.; Vryonidou, A.; Ioannidis, D.; Paschou, S.A.; Panagou, M.; Tzavara, I. Bilateral adrenal incidentalomas differ from unilateral adrenal incidentalomas in subclinical cortisol hypersecretion but not in potential clinical implications. Eur. J. Endocrinol. 2014, 171, 37–45. [Google Scholar] [CrossRef] [Green Version]
- Pasternak, J.D.; Seib, C.D.; Seiser, N.; Tyrell, J.B.; Liu, C.; Cisco, R.M.; Gosnell, J.E.; Shen, W.T.; Suh, I.; Duh, Q.-Y. Differences Between Bilateral Adrenal Incidentalomas and Unilateral Lesions. JAMA Surg. 2015, 150, 974–978. [Google Scholar] [CrossRef] [Green Version]
- Ulivieri, F.M.; Silva, B.C.; Sardanelli, F.; Hans, D.; Bilezikian, J.P.; Caudarella, R. Utility of the trabecular bone score (TBS) in secondary osteoporosis. Endocrine 2014, 47, 435–448. [Google Scholar] [CrossRef]
- Crans, G.G.; Genant, H.K.; Krege, J.H. Prognostic utility of a semiquantitative spinal deformity index. Bone 2005, 37, 175–179. [Google Scholar] [CrossRef]
- Kerkeni, S.; Kolta, S.; Fechtenbaum, J.; Roux, C. Spinal deformity index (SDI) is a good predictor of incident vertebral fractures. Osteoporos. Int. 2009, 20, 1547–1552. [Google Scholar] [CrossRef]
- Vimalraj, S. Alkaline phosphatase: Structure, expression and its function in bone mineralization. Gene 2020, 754, 144855. [Google Scholar] [CrossRef]
- Rosen, H.N.; Moses, A.C.; Garber, J.; Iloputaife, I.D.; Ross, D.S.; Lee, S.L.; Greenspan, S.L. Serum CTX: A New Marker of Bone Resorption That Shows Treatment Effect More Often Than Other Markers Because of Low Coefficient of Variability and Large Changes with Bisphosphonate Therapy. Calcif. Tissue Int. 2000, 66, 100–103. [Google Scholar] [CrossRef]
- Garnero, P.; Ferreras, M.; Karsdal, M.; Nicamhlaoibh, R.; Risteli, J.; Borel, O.; Qvist, P.; Delmas, P.; Foged, N.; Delaissé, J. The Type I Collagen Fragments ICTP and CTX Reveal Distinct Enzymatic Pathways of Bone Collagen Degradation. J. Bone Miner. Res. 2003, 18, 859–867. [Google Scholar] [CrossRef]
- Lukert, B.P.; Adams, J.S. Calcium and phosphorus homeostasis in man. Effect of corticosteroids. Arch. Intern. Med. 1976, 136, 1249–1253. [Google Scholar] [CrossRef]
- Rubin, M.R.; Bilezikian, J.P. The Role of Parathyroid Hormone in the Pathogenesis of Glucocorticoid-Induced Osteoporosis: A Re-Examination of the Evidence. J. Clin. Endocrinol. Metab. 2002, 87, 4033–4041. [Google Scholar] [CrossRef] [Green Version]
- Kaneko, K.; Kawai, S. Mechanisms and therapeutics of glucocorticoid-induced osteoporosis. Jpn. J. Clin. Immunol. 2011, 34, 138–148. [Google Scholar] [CrossRef] [Green Version]
- Wang, Y.D.; Wang, L.; Li, D.J.; Wang, W.J. Dehydroepiandrosterone inhibited the bone resorption through the upregulation of OPG/RANKL. Cell. Mol. Immunol. 2006, 3, 41–45. [Google Scholar] [PubMed]
- Dennedy, M.C.; Annamalai, A.K.; Prankerd-Smith, O.; Freeman, N.; Vengopal, K.; Graggaber, J.; Koulouri, O.; Powlson, A.S.; Shaw, A.; Halsall, D.J.; et al. Low DHEAS: A Sensitive and Specific Test for Detection of Subclinical Hypercortisolism in Adrenal Incidentalomas. J. Clin. Endocrinol. Metab. 2016, 102, 786–792. [Google Scholar] [CrossRef] [PubMed]
- Eller-Vainicher, C.; Morelli, V.; Salcuni, A.S.; Torlontano, M.; Coletti, F.; Iorio, L.; Cuttitta, A.; Ambrosio, A.; Vicentini, L.; Carnevale, V.; et al. Post-surgical hypocortisolism after removal of an adrenal incidentaloma: Is it predictable by an accurate endocrinological work-up before surgery? Eur. J. Endocrinol. 2010, 162, 91–99. [Google Scholar] [CrossRef] [PubMed] [Green Version]
- Bernini, G.; Moretti, A.; Iacconi, P.; Miccoli, P.; Nami, R.; Lucani, B.; Salvetti, A. Anthropometric, haemodynamic, humoral and hormonal evaluation in patients with incidental adrenocortical adenomas before and after surgery. Eur. J. Endocrinol. 2003, 148, 213–219. [Google Scholar] [CrossRef] [PubMed] [Green Version]
- Paschou, S.A.; Vryonidou, A.; Goulis, D.G. Adrenal incidentalomas: A guide to assessment, treatment and follow-up. Maturitas 2016, 92, 79–85. [Google Scholar] [CrossRef]
- Morelli, V.; Scillitani, A.; Arosio, M.; Chiodini, I. Follow-up of patients with adrenal incidentaloma, in accordance with the European society of endocrinology guidelines: Could we be safe? J. Endocrinol. Investig. 2016, 40, 331–333. [Google Scholar] [CrossRef]
- Higgs, J.A.; Quinn, A.P.; Seely, K.D.; Richards, Z.; Mortensen, S.P.; Crandall, C.S.; Brooks, A.E. Pathophysiological Link between Insulin Resistance and Adrenal Incidentalomas. Int. J. Mol. Sci. 2022, 23, 4340. [Google Scholar] [CrossRef]
- Terzolo, M.; Pia, A.; Alì, A.; Osella, G.; Reimondo, G.; Bovio, S.; Daffara, F.; Procopio, M.; Paccotti, P.; Borretta, G.; et al. Adrenal Incidentaloma: A New Cause of the Metabolic Syndrome? J. Clin. Endocrinol. Metab. 2002, 87, 998–1003. [Google Scholar] [CrossRef]
- Raffaelli, M.; De Crea, C.; D’Amato, G.; Gallucci, P.; Lombardi, C.P.; Bellantone, R. Outcome of adrenalectomy for subclinical hypercortisolism and Cushing syndrome. Surgery 2017, 161, 264–271. [Google Scholar] [CrossRef]
- Tsagarakis, S.; Vassiliadi, D.; Thalassinos, N. Endogenous subclinical hypercortisolism: Diagnostic uncertainties and clinical implications. J. Endocrinol. Investig. 2006, 29, 471–482. [Google Scholar] [CrossRef]
- Kim, B.-Y.; Chun, A.-R.; Kim, K.-J.; Jung, C.-H.; Kang, S.K.; Mok, J.-O.; Kim, C.-H. Clinical Characteristics and Metabolic Features of Patients with Adrenal Incidentalomas with or without Subclinical Cushing’s Syndrome. Endocrinol. Metab. 2014, 29, 457–463. [Google Scholar] [CrossRef] [Green Version]
- Tauchmanovà, L.; Rossi, R.; Biondi, B.; Pulcrano, M.; Nuzzo, V.; Palmieri, E.-A.; Fazio, S.; Lombardi, G. Patients with Subclinical Cushing’s Syndrome due to Adrenal Adenoma Have Increased Cardiovascular Risk. J. Clin. Endocrinol. Metab. 2002, 87, 4872–4878. [Google Scholar] [CrossRef] [Green Version]
- Emral, R.; Uysal, A.R.; Asik, M.; Gullu, S.; Corapcioglu, D.; Tonyukuk, V.; Erdogan, G. Prevalence of Subclinical Cushing’s Syndrome in 70 Patients with Adrenal Incidentaloma: Clinical, Biochemical and Surgical Outcomes. Endocr. J. 2003, 50, 399–408. [Google Scholar] [CrossRef] [Green Version]
- Di Dalmazi, G.; Vicennati, V.; Rinaldi, E.; Morselli-Labate, A.M.; Giampalma, E.; Mosconi, C.; Pagotto, U.; Pasquali, R. Progressively increased patterns of subclinical cortisol hypersecretion in adrenal incidentalomas differently predict major metabolic and cardiovascular outcomes: A large cross-sectional study. Eur. J. Endocrinol. 2012, 166, 669–677. [Google Scholar] [CrossRef] [Green Version]
- Tsuiki, M.; Tanabe, A.; Takagi, S.; Naruse, M.; Takano, K. Cardiovascular Risks and Their Long-Term Clinical Outcome in Patients with Subclinical Cushing’s Syndrome. Endocr. J. 2008, 55, 737–745. [Google Scholar] [CrossRef] [Green Version]
- Oki, K.; Yamane, K.; Nakanishi, S.; Shiwa, T.; Kohno, N. Influence of Adrenal Subclinical Hypercortisolism on Hypertension in Patients with Adrenal Incidentaloma. Exp. Clin. Endocrinol. Diabetes 2012, 120, 244–247. [Google Scholar] [CrossRef]
- Cavalari, E.M.R.; de Paula, M.P.; Arruda, M.; Carraro, N.; Martins, A.; de Souza, K.; Coelho, M.C.; de Morais, N.A.d.O.E.S.; Moraes, A.B.; Neto, L.V. Nonfunctioning adrenal incidentaloma: A novel predictive factor for metabolic syndrome. Clin. Endocrinol. 2018, 89, 586–595. [Google Scholar] [CrossRef]
- Yener, S.; Ertilav, S.; Secil, M.; Akinci, B.; Demir, T.; Kebapcilar, L.; Yesil, S. Increased Risk of Unfavorable Metabolic Outcome during Short-Term Follow-Up in Subjects with Nonfunctioning Adrenal Adenomas. Med. Princ. Pract. 2012, 21, 429–434. [Google Scholar] [CrossRef]
- Papanastasiou, L.; Alexandraki, K.; Androulakis, I.I.; Fountoulakis, S.; Kounadi, T.; Markou, A.; Tsiavos, V.; Samara, C.; Papaioannou, T.G.; Piaditis, G.; et al. Concomitant alterations of metabolic parameters, cardiovascular risk factors and altered cortisol secretion in patients with adrenal incidentalomas during prolonged follow-up. Clin. Endocrinol. 2017, 86, 488–498. [Google Scholar] [CrossRef]
- Lopez, D.; Luque-Fernandez, M.A.; Steele, B.A.; Adler, G.K.; Turchin, A.; Vaidya, A. “Nonfunctional” Adrenal Tumors and the Risk for Incident Diabetes and Cardiovascular Outcomes. Ann. Intern. Med. 2016, 165, 533–542. [Google Scholar] [CrossRef] [Green Version]
- Arruda, M.; Cavalari, E.M.R.; de Paula, M.P.; de Morais, F.F.C.; Bilro, G.F.; Coelho, M.C.A.; Morais, N.A.D.O.E.S.D.; Choeri, D.; Moraes, A.; Neto, L.V. The presence of nonfunctioning adrenal incidentalomas increases arterial hypertension frequency and severity, and is associated with cortisol levels after dexamethasone suppression test. J. Hum. Hypertens. 2017, 32, 3–11. [Google Scholar] [CrossRef] [PubMed]
- Comlekci, A.; Yener, S.; Ertilav, S.; Secil, M.; Akinci, B.; Demir, T.; Kebapcilar, L.; Bayraktar, F.; Yesil, S.; Eraslan, S. Adrenal incidentaloma, clinical, metabolic, follow-up aspects: Single centre experience. Endocrine 2009, 37, 40–46. [Google Scholar] [CrossRef] [PubMed]
- Androulakis, I.I.; Kaltsas, G.A.; Kollias, G.E.; Markou, A.C.; Gouli, A.K.; Thomas, D.A.; Alexandraki, K.; Papamichael, C.M.; Hadjidakis, D.J.; Piaditis, G.P. Patients With Apparently Nonfunctioning Adrenal Incidentalomas May Be at Increased Cardiovascular Risk Due to Excessive Cortisol Secretion. J. Clin. Endocrinol. Metab. 2014, 99, 2754–2762. [Google Scholar] [CrossRef] [PubMed] [Green Version]
- Yener, S.; Genc, S.; Akinci, B.; Secil, M.; Demir, T.; Comlekci, A.; Ertilav, S.; Yesil, S. Carotid intima media thickness is increased and associated with morning cortisol in subjects with non-functioning adrenal incidentaloma. Endocrine 2009, 35, 365–370. [Google Scholar] [CrossRef]
- Yener, S.; Baris, M.; Seçil, M.; Akinci, B.; Comlekci, A.; Yesil, S. Is there an association between non-functioning adrenal adenoma and endothelial dysfunction? J. Endocrinol. Investig. 2010, 34, 265–270. [Google Scholar] [CrossRef]
- Yener, S.; Comlekci, A.; Akinci, B.; Seçil, M.; Demir, T.; Ertilav, S.; Yesil, S. Non-functioning adrenal incidentalomas are associated with elevated D-dimer levels. J. Endocrinol. Investig. 2009, 32, 338–343. [Google Scholar] [CrossRef]
- Swiatkowska-Stodulska, R.; Skibowska-Bielinska, A.; Wisniewski, P.; Sworczak, K. Activity of selected coagulation factors in overt and subclinical hypercortisolism. Endocr. J. 2015, 62, 687–694. [Google Scholar] [CrossRef] [Green Version]
- Świątkowska-Stodulska, R.; Kaniuka-Jakubowska, S.; Wiśniewski, P.; Skibowska-Bielińska, A.; Babińska, A.; Sowińska-Przepiera, E.; Sworczak, K. Homocysteine and alpha-1 antitrypsin concentration in patients with subclinical hypercortisolemia. Adv. Med. Sci. 2012, 57, 302–307. [Google Scholar] [CrossRef]
- Di Dalmazi, G.; Vicennati, V.; Garelli, S.; Casadio, E.; Rinaldi, E.; Giampalma, E.; Mosconi, C.; Golfieri, R.; Paccapelo, A.; Pagotto, U.; et al. Cardiovascular events and mortality in patients with adrenal incidentalomas that are either non-secreting or associated with intermediate phenotype or subclinical Cushing’s syndrome: A 15-year retrospective study. Lancet Diabetes Endocrinol. 2014, 2, 396–405. [Google Scholar] [CrossRef]
- Chen, M.; Fu, W.; Xu, H.; Liu, C.-J. Pathogenic mechanisms of glucocorticoid-induced osteoporosis. Cytokine Growth Factor Rev. 2023, 70, 54–66. [Google Scholar] [CrossRef]
- Na Liang, N.; Zhang, S.; Wang, S.; Ma, J. An effect comparison of alendronate and teriparatide in patients with glucocorticoid-induced osteoporosis: A protocol for systematic review and meta-analysis. Medicine 2022, 101, e32090. [Google Scholar] [CrossRef]
- Chen, K.L.; Gannon, N.P.; Tofte, J.N.; Shields, B.E. Glucocorticoid-Induced Bone Loss: Dietary Supplementation Recommendations to Reduce the Risk for Osteoporosis and Osteoporotic Fractures. Cutis 2022, 110, 201–206. [Google Scholar] [CrossRef]
- Messina, O.D.; Vidal, M.; Torres, J.A.M.; Vidal, L.F.; Arguissain, C.; Pereira, R.M.; Clark, P.; Perez, S.C.; Campusano, C.; Lazaretti-Castro, M.; et al. Evidence based Latin American Guidelines of clinical practice on prevention, diagnosis, management and treatment of glucocorticoid induced osteoporosis. A 2022 update. Aging Clin. Exp. Res. 2022, 34, 2591–2602. [Google Scholar] [CrossRef]
- Chu, H.; Jang, B.-H.; Kim, G.; Bae, S.; Lee, H.; Nam, S.; Ahn, J. Comparative effectiveness of bisphosphonate treatments for the prevention of re-fracture in glucocorticoid-induced osteoporosis: Protocol for a systematic review and meta-analysis. BMJ Open 2022, 12, e062537. [Google Scholar] [CrossRef]


| First Author Year of Publication Reference Number Study Design | Studied Population (and Included Subgroups According to Each Study) Gender (F/M) Age (Years) | |||
|---|---|---|---|---|
| Reincke 1992 [43] Prospective study | N = 68 N1 = 8 with overt CS F/M = 8/0 Mean age: 39 ± 8 y (26–50 y) | N2 = 8 with preclinical CS F/M = 5/3 Mean age: 50 ± 15 y (25–71 y) | N3 = 58 with NFAI F/M = 37/21 Mean age: 59 ± 12 y (25–90 y) | |
| Ambrosi 1995 [44] Case-control study | N = 32 N1 = 32 with AI F/M = 23/9 Median age (women):49 y/median age (men): 67 y | N2 = 4 with preclinical CS F/M = 1/3 (42–72 y) | N3 = 14 controls F/M = 8/6 (25–50 y) | |
| Osella 1997 [45] Case-control study | N = 22 N1 = 18 with CS F/M = 15/3 Median age: 36 y (15–64 y) | N2 = 22 with AI F/M = 13/9 Median age: 54.5 y (25–73 y) | N3 = 22 controls Median age: 55 y (25–73 y) | |
| Sartorio 1998 [46] Case-control study | N = 53 N1 = 12 with CS F/M = 10/2 (21–46 y) | N2 = 6 with preclinical CS F/M = 2/4 (42–74 y ) | N3 = 35 with AI F/M = 25/10 (34–73 y) | N4 = 28 controls (25–69 y) |
| Rossi 1999 [47] Prospective study | N = 50 N1 = 50 with AI F/M = 29/21 mean age: 56.3 y (32–73 y) of these 12 with SCS = N2: F/M = 9/3 Mean age: 60.7 y (47–72 y) | N3 = 107 controls F/M = 65/42 Mean age: 52.2 y | ||
| Torlontano 1999 [48] Case-control study | N = 32 women N1 = 8 with SH F/M = 8/0 Mean age: 54.0 ± 18.4 y (26–75 y) | N2 = 24 without SH F/M = 24/0 Mean age: 57.3 ± 10.0 y (38–76 y) | N3 = 64 controls F/M = 64/0 Mean age: 56.4 ± 12.3 y (22–76 y) | |
| Osella 2001 [49] Case-control study | N = 27 N1 = 27 with AI F/M = 18/9 Median age: 57 y (42–73 y) of these N2 = 8 with SCS F/M = 5/3 Median age: 55.87 y | N3 = 54 controls F/M = 36/18 Median age: 56.5 y (41–73 y) | ||
| Chiodini 2001 [50] Longitudinal study | N = 24 N1 = 7 with SH F/M = 7/0 Mean age: 42.4 ± 16.7 y (26–72 y) | N2 = 17 without SH F/M = 17/0 Mean age: 56.0 ± 11.8 y (38–77 y) | ||
| Tauchmanova 2001 [51] Case-control study | N = 34 N1 =15 with overt CS F/M = 9/6 Mean age: 41.73 ± 10.2 y (21–50 y) | N2 = 19 with SCS F/M = 11/8 Mean age: 44.5 ± 9.8 y (25–59 y) | N3 = 76 controls F/M = 46/30 Mean age: 46.5 ± 13.7 y | |
| Chiodini 2002 [52] Cross-sectional study | N = 38 N1 = 13 with SH F/M = 0/13 Mean age: 61.4 ± 11.3 y (40–75 y) | N2 = 25 without SH F/M = 0/25 Mean age: 55.2 ± 12.6 y (21–78 y) | N3 = 38 controls Mean age: 56.9 ± 11.8 y (26–74 y) | |
| Francucci 2002 [53] Case-control study | N = 38 women N1 = 15 with CS F/M = 15/0 Mean age: 46.5 ± 14.8 y | N2 = 23 with AI F/M = 23/0 Mean age: 57.6 ± 10.9 y | N3 = 20 controls F/M = 20/0 Mean age: 51.5 ± 9 y | |
| Hadjidakis 2003 [54] Cross-sectional study | N = 42 N1 = 18 with SH F/M = 24/0 Mean age: 59.1 ± 6.3 y (48–74 y) | N2 = 24 without SH F/M = 18/0 Mean age: 63.6 ± 5.1 y (53–72 y) | ||
| Chiodini 2004 [55] Case-control study | N = 70 women Premenopausal women: N1 = 7 with SH F/M = 7/0 Mean age: 42.9 ± 3.5 y (26–50 y) N2 = 14 without SH F/M = 14/0 Mean age: 39.3 ± 2.2 y (24–52 y) | N3 = 23 controls F/M = 23/0 Mean age: 41.7 ± 2.0 y (21–54 y) N3 = 61 controls F/M = 61/0 Mean age: 60.8 ± 0.9 y (44–75 y) | Postmenopausal women: N1 = 14 with SH F/M = 14/0 Mean age: 63.9 ± 2.2 y (46–79 y) | N2 = 35 without SH F/M = 35/0 Mean age: 61.5 ± 1.4 y (48–80 y) |
| Tauchmanova 2007 [56] Case-control study | N = 71 women N1 = 36 with overt CS F/M = 36/0 Median age: 42 y (28–66 y) | N2 = 35 with SCS F/M = 35/0 Median age: 46 y (30–68 y) | N3 = 71 controls Median age: 44 y (28–68 y) | |
| Tauchmanova 2009 [57] Case-control study | N = 46 N1 = 23 with SCS treated with clodronate F/M = 23/0 Mean age: 42.4 ± 6.4 y | N2 = 23 with SCS (untreated) F/M = 23/0 Mean age: 43.5 ± 6.1 y | ||
| Chiodini 2009 [58] Retrospective study | N = 287 N1 = 85 with SH F/M = 53/32 Mean age: 62.9 ± 9.9 y (34–79 y) | N2 = 202 without SH F/M = 123/79 Mean age: 61.2 ± 11.4 y (21–81 y) | N3 = 194 controls F/M = 104/90 Mean age: 61.1 ± 13.7 y (21–79 y) | |
| Chiodini 2009 [59] Case-control study | N = 88 men N1 = 22 with SH F/M = 0/22 Mean age: 65.8 ± 10.7 y (42–86 y) | N2 = 66 without SH F/M = 0/66 Mean age: 60.9 ± 12.9 y (21–83 y) | N3 = 90 controls F/M = 0/90 Mean age: 61.8 ± 14.2 (23–90 y) | |
| Toniato 2009 [60] Prospective study | N = 45 N1 = 23 with adrenalectomy: F/M = 11/12 Mean age: 63 ± 4.1 y | N2 = 22 with conservative management: F/M = 12/10 Mean age: 64 ± 1.8 y | ||
| Morelli 2010 [61] Retrospective study | N = 231 with AI F/M = 120/111 Mean age: 62.9 ± 10.1 y | |||
| Morelli 2011 [62] Cross-sectional study | N = 103 female At baseline: N1 = 27 with SH F/M = 27/0 Mean age: 65.0 ± 8.7 y (41–83 y) N2 = 76 without SH F/M = 76/0 Mean age: 62.7 ± 10.3 y (28–80 y) | After 24 months of follow-up: N1 = 27 with SH F/M = 27/0 Mean age: 67.0 ± 8.5 y (43–85 y) N2 = 76 without SH F/M = 76/0 Mean age: 64.9 ± 10.2 y (30–82 y) | ||
| Eller-Vainicher 2012 [63] Case-control study | N = 102 N1 = 34 with SH F/M = 19/15 Mean age: 66.3 ± 8.3 y (45–79 y) | N2 = 68 without SH F/M = 44/24 Mean age: 67.5 ± 8.7 y (47–83 y) | N3 = 70 controls F/M = 48/22 Mean age: 67.7 ± 14.4 y (37–85 y) | |
| Iacobone 2012 [64] Prospective study | N = 35 N1 = 22 with adrenalectomy: F/M = 8/12 Median: 55 y (36–78 y) | N2 = 15 with conservative management: F/M = 7/8 Median: 58 y (39–75 y) | ||
| Morelli 2013 [65] Prospective study | N = 213 BAI: N1 = 10 with SH F/M = 4/6 Mean age: 65.6 ± 5.3 y (57–74 y) | N2 = 28 without SH F/M = 20/8 Mean age: 63.7 ± 9.9 y (41–82 y) | UAI: N1 = 41 with SH F/M = 28/13 Mean age: 62.1 ± 11.6 y (39–83 y) | N2 = 134 without SH F/M = 88/46 Mean age: 63.7 ± 11.0 y (31–85 y) |
| Palmieri 2013 [66] Cross-sectional, prospective study | N = 70 N1 = 16 with SH F/M = 7/9 Mean age: 62.5 ± 10.6 y (34–77 y) | N2 = 54 without SH F/M = 34/20 Mean age: 61.5 ± 10.3 y (39–77 y) | ||
| Lasco 2014 [67] Cross-sectional study | N = 50 women N1 = 3 with SH Median age: 57 ± 3 y | N2 = 47 without SH Median age: 58 ± 4 y | ||
| Perogamvros 2015 [68] Retrospective study | N = 33 N1 = 14 with adrenalectomy: F/M = 14/0 Mean age: 54.9 ± 6.7 y | N2 = 19 with conservative management: F/M = 14/5 Mean age: 59 ± 8.7 y | ||
| Morelli 2016 [69] Retrospective (cross-sectional arm) and prospective (longitudinal arm) | N = 444, of these 126 with AI N1 = 96 patients without incident VFx F/M = 64/32 Mean age: 62.9 ± 9.5 y (27–80 y) | N2 = 30 patients with incident VFx F/M = 16/14 Mean age: 65.5 ± 9.2 y (41–83 y) | ||
| Salcuni 2016 [70] Cross-sectional and prospective interventional study | N = 55 Surgical intervention: N1 = 32 Baseline: F/M = 22/10 Mean age: 61.3 ± 8.1 y (38–75 y) End of follow-up Mean age: 64.7 ± 8.7 y (40–79 y) | Conservative management: N2 = 23 Baseline: F/M = 10/13 Mean age: 65.4 ± 7.05 y (51–75 y) End of follow-up: Mean age: 67.7 ± 6.9 y (53–78 y) | ||
| Ognjanovic 2016 [71] Cross-sectional study | N = 152 UAI: N1 = 105 F/M = 68/37 Mean age: 58.0 ± 11.1 y | BAI: N2 = 47 F/M = 38/9 Mean age: 59.2 ± 10.2 y | ||
| Vinolas 2018 [72] Cross-sectional study | N = 110 N1 = 53 with CS F/M = 42/11 Mean age: 49.9 ± 12.8 y | N2 = 39 with MACS F/M = 34/5 Mean age: 57.8 ± 9.3 y | N3 = 18 with NFAI F/M = 13/5 Mean age: 59.2 ± 9.1 y | |
| Kim 2018 [73] Cross-sectional study | N = 435 Men (N = 247): N1 = 4 adrenal CS Mean age: 47.5 ± 6.6 y N2 = 30 with SH Mean age: 59.5 ± 8.4 y N3 = 213 with NFAI Mean age: 54.5 ± 9.8 y | Women (N = 188): N1 = 15 adrenal CS Mean age: 41.9 ± 9.7 y N2 = 31 with SH Mean age: 51.2 ± 13.3 y N3 = 142 with NFAI Mean age: 55.4 ± 10.8 y | ||
| Ahn 2019 [74] Cross-sectional study | N = 795 Premenopausal women (N = 77): N1 = 18 with SH Mean age: 38.6 ± 6.1 y N2 = 59 NFAI Mean age: 42.5 ± 6.2 y | Postmenopausal women (N = 237): N1 = 38 with SH Mean age: 59.7 ± 7.4 y N2 = 199 NFAI Mean age: 59.4 ± 7.4 y | Men (N = 481): N1 = 53 with SH Mean age: 56.9 ± 9.7 y N2 = 428 NFAI Mean age: 55.3 ± 9.6 y | |
| Moraes 2020 [75] Cross-sectional study | N = 75 N1 = 30 ACS F/M = 26/4 Median age: 60 y (42–77 y) | N2 = 45 NFAI F/M = 32/13 Median age: 59 y (32–76 y) | ||
| Athimulam 2020 [76] Cross-sectional study | N = 213 N1 = 22 with CS F/M = 18/4 Mean age: 41.5 y (18–61 y) | N2 = 92 with MACS F/M = 57/35 Mean age: 59.5 y (28–82 y) | N3 = 99 with NFAI F/M = 67/32 Mean age: 59 y (28–93 y) | |
| Ueland 2020 [77] Retrospective study | N = 165 N1 = 83 with ACS F/M = 58/25 Median age: 65 y (29–86 y) | N2 = 82 with NFAI F/M = 48/34 Median age: 68.5 y (33–82 y) | ||
| Ishida 2021 [78] Retrospective study | N = 67 N1 = 55 with ACS F/M = 33/23 Mean age: 61.5 ± 10.1 y | N2 = 12 with NFAI F/M = 5/7 Mean age: 66.0 ± 8.9 y | ||
| Podbregar 2021 [79] Prospective study | N = 67 with NFAI F/M = 47/20 Mean age: 57.9 y | |||
| Li 2021 [80] Cohort study | N1 = 1004 with AI F/M = 582/422 Mean age: 62.8 y (20.5–96.4 y) | N2 = 1004 controls F/M = 582/422 Mean age: 62.7 y (20.5–95.5 y) | ||
| Yano 2022 [81] Cross-sectional study | N = 194 N1= 97 with ACS F/M = 60/37 Median age: 62.0 y | N2 = 97 with NFAI F/M = 52/45 Median age: 58.0 y | ||
| Izawa 2022 [82] Cross-sectional observational study | N = 237 with adrenal adenoma associated with cortisol excess N1 = 112 with osteoporosis/osteopenia F/M = 99/13 Median age: 57 y (42–64 y) | N2= 125 without osteoporosis/osteopenia F/M = 83/42 Median age: 55 y (46–63 y) | ||
| First Author Year of Publication Reference Number Study Design | Criteria for ACS Diagnosis |
|---|---|
| Reincke 1992 [43] Prospective study | Serum cortisol after 1 mg and 8 mg DST > 90 nmol/L(3 µg/dL) |
| Ambrosi 1995 [44] Case-control study | Serum cortisol after 1 mg DST and loperamide test (16 mg) or LDDST or 8 mg overnight > 140 nmol/L |
| Osella 1997 [45] Case-control study | Serum cortisol after 1 mg DST < 2.5 µg/dL (vs. CS) |
| Sartorio 1998 [46] Case-control study | Serum cortisol after 1 mg DST and loperamide test (16 mg) > 5 µg/dL (140 nmol/L) Low ACTH High UFC Impaired response to CRH test |
| Rossi 1999 [47] Prospective study | ≥2 out of: Serum cortisol after 2 mg DST or LDDST > 3 µg/dL Low ACTH High UFC High F rhythm |
| Torlontano 1999 [48] Case-control study | UFC > 70 μg/24 h |
| Osella 2001 [49] Case-control study | ≥2 out of: Serum cortisol after 1 mg DST > 5 µg/dL Low ACTH High UFC > 216 µg/24 h High F rhythm |
| Chiodini 2001 [50] Longitudinal study | ≥2 out of: Serum cortisol after 1 mg DST > 82.8 nmol/L Low ACTH < 2.2 pmol/L High UFC > 193.1 nmol/24 h |
| Tauchmanova 2001 [51] Case-control study | Serum cortisol after LDDST > 3 µg/dL(83 nmol/L) |
| Chiodini 2002 [52] Cross-sectional study | ≥2 out of: Serum cortisol after 1 mg DST > 82.8 nmol/L (3 µg/dL) Low ACTH < 2.2 pmol/L High UFC > 193.1 nmol/24 h |
| Francucci 2002 [53] Case-control study | N2 included 2 patients with SCS (inclusion criteria: two altered parameters of HPA function without evident clinical signs of hypercortisolism) |
| Hadjidakis 2003 [54] Cross-sectional study | Serum cortisol after LDDST > 70 nmol/L |
| Chiodini 2004 [55] Case-control study | ≥2 out of: Serum cortisol after 1 mg DST > 3 µg/dL (82.8 nmol/L) Low ACTH < 10 pg/mL (2.2 pmol/L) High UFC > 70.0 µg/24 h (193.1 nmol/24 h) |
| Tauchmanova 2007 [56] Case-control study | Serum cortisol after 1 mg DST > 30 ng/mL |
| Tauchmanova 2009 [57] Case-control study | ≥2 out of: Serum cortisol after 1mg DST > 30 ng/mL Abnormalities of ACTH Anomalies of UFC Anomalies of F rhythm |
| Chiodini 2009 [58] Retrospective study | ≥2 out of: Serum cortisol after 1 mg DST > 82.8 nmol/L (>3 µg/dL) Low ACTH 1 pg/mL (<2.2 pmol/L) High UFC > 70 µg/24 h (193.1 nmol/L) |
| Chiodini 2009 [59] Case-control study | ≥2 out of: Serum cortisol after 1 mg DST >82.8 nmol/L (>3 µg/dL) Low ACTH < 2.2 pmol/L High UFC > 193.1 nmol/L |
| Toniato 2009 [60] Prospective study | Serum cortisol after 1 mg DST > 2.5 µg/dL |
| Morelli 2010 [61] Retrospective study | ≥2 out of: Serum cortisol after 1 mg DST > 82.8 nmol/L high UFC Low ACTH < 2.2 pmol/L |
| Morelli 2011 [62] Cross-sectional study | ≥2 out of: Serum cortisol 1mg DST > 3 µg/dL(>83 nmol/L) Low ACTH < 10 pg/mL (<2.2 pmol/L) High UFC > 70 µg/24 h (>193 nmol/L) |
| Eller-Vainicher 2012 [63] Case-control study | ≥2 out of: Serum cortisol after 1 mg DST > 3.0 mg/dL (82.8 nmol/L) Low ACTH < 10 pg/ mL (2.2 pmol/L) High UFC > 70 µg/24 h (193.1 nmol/L) |
| Iacobone 2012 [64] Prospective study | Serum cortisol after 1 mg DST > 5 µg/dL Low ACTH < 10 pg/mL High UFC > 76 µg/24 h |
| Morelli 2013 [65] Prospective study | ≥2 out of: Serum cortisol after 1 mg DST > 83 nmol/L High UFC > 193 nmol/24 h Low ACTH < 2.2 pmol/L |
| Palmieri 2013 [66] Cross-sectional, prospective study | ≥2 out of: Serum cortisol after 1 mg DST > 83 nmol/L High UFC > 193 nmol/24 h Low ACTH < 2.2 pmol/L |
| Lasco 2014 [67] Cross-sectional study | Serum cortisol after 1 mg DST > 1.8 µg/dL (50 nmol/L), in case of no suppression preform LDDST > 1.8 µg/dL (50 nmol/L) High UFC > 193 nmol/24 h |
| Perogamvros 2015 [68] Retrospective study | Serum cortisol after LDDST > 1.8 µg/dL+ at least one of: Low ACTH < 10 pg/mL Midnight serum cortisol > 7 µg/dL High UFC > 120 µg/24 h |
| Morelli 2016 [69] Retrospective (cross-sectional arm) and prospective (longitudinal arm) | Serum cortisol after 1 mg DST ≥ 2 µg/dL (55 nmol/L) |
| Salcuni 2016 [70] Cross-sectional and prospective interventional study | Serum cortisol after 1 mg DST > 5.0 µg/dL (138 nmol/L) or ≥2 out of: Serum cortisol after 1 mg DST > 3.0 µg/dL (83 nmol/L) Low ACTH < 10 pg/mL (2.2 pmol/L) High UFC > 70 µg/24 h(193 nmol/24 h) |
| Ognjanovic 2016 [71] Cross-sectional study | ≥2 out of: Serum cortisol after 1 mg DST > 50 nmol/L Serum cortisol after LDDST 50 > nmol/L Midnight serum cortisol > 208 nmol/L Low ACTH < 10 pg/mL (2.2 pmol/L) High UFC > 245 nmol/24 h |
| Vinolas 2018 [72] Cross-sectional study | Serum cortisol after 1 mg DST > 50 nmol/L |
| Kim 2018 [73] Cross-sectional study | Serum cortisol after 1 mg DST > 5.0 μg/dL (138 nmol/L) or Serum cortisol after 1 mg DST > 2.2 μg/dL (61nmol/L) plus one of: Low ACTH < 10 pg/mL (2.2 pmol/L) or DHEA-S < 80 μg/dL (2.17 μmol/L) in men/<35 μg/dL (0.95 μmol/L) in women |
| Ahn 2019 [74] Cross-sectional study | Serum cortisol after 1 mg DST > 138.0 nmol/L or Cortisol after 1 mg DST > 61.0 nmol/L plus: ACTH < 2.2 pmol/L or DHEA-S < 2.17 μmol/L in men or <0.95 μmol/L in women |
| Moraes 2020 [75] Cross-sectional study | Serum cortisol after 1 mg DST 1.9–5 µg/dL |
| Athimulam 2020 [76] Cross-sectional study | Serum cortisol after 1 mg DST cortisol > 1.8 µg/dL (>50 nmol/L) |
| Ueland 2020 [77] Retrospective study | Serum cortisol after 1 mg DST cortisol > 50 nmol/L A proposed cut-off for DHEAS in the diagnostics of ACS is 1.04 µmol/L (40 µg/dL) |
| Ishida 2021 [78] Retrospective study | Serum cortisol after 1 mg DST > 1.8 µg/dL or 8 mg DST ≥ 1.0 μg/dL |
| Podbregar 2021 [79] Prospective study | Serum cortisol after 1 mg DST > 50 nmol/L |
| Li 2021 [80] Cohort study | Serum cortisol after 1 mg DST > 1.8 µg/dL During the follow-up period, 15 (22.4%) of 67 patients with NFAI progressed to MACS (p < 0.001) |
| Yano 2022 [81] Cross-sectional study | Serum cortisol after 1 mg DST ≥ 1.8 μg/dL (50 nmol/L) |
| Izawa 2022 [82] Cross-sectional observational study | Serum cortisol after 1 mg DST cortisol levels > 1.8 µg/dL |
| Reference Number | DXA Results Osteoporosis/VFs Prevalence |
|---|---|
| [43] | Osteoporosis prevalence: N1 = 37.5%; N2 = 0%; N3 = 0% |
| [47] | BMD Z-score similar between N1 and N3 (−0.41 SD, 95% CI: 21.127–0.3115) |
| [48] | N1:QCT (L1–L4) = −1.02 ±1.29; DXA (L2–L4) = −1.37 ± 1.26; FN = −1.34 ± 1.08 N2: QCT (L1–L4) = 0.15 ± 1.04; DXA (L2–L4) = 0.41 ± 1.24; FN = 0.20 ± 1.12 N3: QCT (L1–L4) = −0.20 ± 0.86; DXA (L2–L4) = −0.03 ± 1.07; FN = 0.07 ± 1.05 BMD at each site was lower in group N1 than in group N2 and N3 (p < 0.05) |
| [49] | N1: LS (L1–L4) BMD = 0.926 g/cm2 (range: 0.604–1.144); LS BMD values were similar between N1 and N3 (p = NS) T-score = −1.10 SD (range: −4.17–0.88); Z-score = −0.33 SD (range: −3.86–1.79) N2: LS (L1–L4) BMD = 0.929 g/cm2 (range: 0.707–1.144); Z-score = −0.55 SD (range: −1.82–1.79) N3: LS (L1–L4) BMD = 0.936 g/cm2 (range: 0.645–1.268) T-score = −1.10 SD (range: −3.65–2.01); Z-score = −0.34 SD (range: −2.96–2.67) |
| [50] | (Z-score) N1:DXA (L2–L4) = −0.67 ± 0.32 SD; QCT (L1–L4) = −0.71 ± 0.63; FN = −0.37 ± 0.6 SD N2: DXA (L2–L4) = 0.64 ± 1.3 SD; QCT (L1–L4) = 0.26 ± 0.98; FN = 0.35 ± 1.0 SD BMD measured by both QCT (L1–L4) and DXA (L2–L4) was significantly lower in N1 vs. N2 (p < 0.05) |
| [51] | N1: Proximal finger Ad-SoS = 1941 ± 126 m/s LS BMD = 0.87 ± 0.15 g/cm2; LS (Z-score) = −1.4 ± 1.4 SD FN BMD = 0.75 ± 0.12 g/cm2 2 patients with VFx N2: Proximal finger Ad-SoS = 1968 ± 139 m/s LS BMD = 0.93 ± 0.16 g/cm2; LS (Z-score)= −0.86 ± 1.3 SD FN BMD = 0.83 ± 0.09 g/cm2 3 patients with VFx N3: Proximal finger Ad-SoS = 2103 ± 43 m/s LS BMD = 1.05 ± 0.1 g/cm2; LS (Z-score)= −0.14 ± 0.05 SD FN BMD = 0.93 ± 0.105 g/cm2 Significant bone loss was detected by finger Ad-SoS in N1 and N2 vs. N3 (p < 0.001) |
| [52] | N1: DXA L2–L4 (Z-score) = −0.42 ± 1.62 SD (LS BMD Z-score lower in N1 vs. N2 vs. N3, p < 0.05) FN BMD (Z-score) = 0.02 ± 1.19 SD N2: DXA L2–L4 (Z-score) = 0.60 ± 1.13 SD FN BMD (Z-score) = 0.70 ± 0.95 SD N3: DXA L2–L4 (Z-score) = 0.47 ± 1.06 SD FN BMD (Z-score) = 0.49 ± 1.11 SD Prevalence of osteoporosis/osteopenia: higher in N1 vs. N2 (84.6% vs. 36.0%, p = 0.01) |
| [53] | LS and FN BMD Z-score: lower in N1 vs. N2 and N3 (p < 0.05) |
| [54] | N1: L2–L4 BMD = 0.89 ± 0.14 g/cm2: No difference in L2–L4 (BMD and Z-score) between N1 and N2 (p = 0.78, p = 0.36) L2–L4 (Z-score)= 0.51 ± 1.2 SD FN BMD = 0.72 ± 0.09 g/cm2; FN (Z-score) = −0.2 ± 0.08 SD (FN BMD was significantly lower in N1 vs. N2; p < 0.05) N2: L2–L4 BMD = 0.9 ± 0.16 g/cm2 L2–L4 (Z-score) = 0.11 ± 1.5 SD FN BMD = 0.78 ± 0.1 g/cm2; FN (Z-score) = 0.43 ± 0.94 SD |
| [55] | QCT (L1–L4) (Z-score) Premenopause: N1:−0.11 ± 0.48 (−1.91–1.77); N2: 0.57 ± 0.34 (−1.64–2.57); N3: 0.13 ± 0.26 (−1.95–2.33) Postmenopause: N1: −0.78 ± 0.29 (−2.49–1.24); N2: −0.02 ± 0.19 (−2.49–1.24); N3: 0.06 ± 0.14 (−1.96–2.20) VFs prevalence: Premenopause: N1 = 42.9%; N2 = 7.1%; N3 = 0% Postmenopause: N1 = 78.6%; N2 = 42.9%; N3 = 37.7% The prevalence of fractures was higher in SH from both groups: premenopause (N1 vs. N3, p = 0.001; N2 p = 0.049) and postmenopause (N1 vs. N2, p = 0.006; N2 p = 0.024); in the postmenopausal group, Z-score was lower in N1 than N3 (p = 0.011) and N2 (p = 0.034) |
| [56] | N: Lumbar Z-score = −1.8 SD (−5.1 to −0.37); Femoral Z-score= −0.9 SD (−2.35 to −0.29) N2: Lumbar Z-score = −1.1 SD (−4.2 to −0.35); Femoral Z-score = −0.6 SD (−1.8 to −0.25) N3: Lumbar Z-score = −0.02 SD(−0.7 to −1.1); Femoral Z-score SD = 0.05 (−0.3 to −0.4) VFx prevalence: N1 = 69% (multiple in 36% of them); N2 = 57% (multiple in 31%); N3 = 0 VFx (between N1 and N2: p = 0.56) LS BMD values and cortisol-to-DHEAS ratio were the best predictors of VFx (p < 0.01) |
| [57] | N1: LS BMD = 0.97 ± 0.12 g/cm2; FN BMD = 0.816 ± 0.14 g/cm2 LS BMD:N1 < N2 (p = 0.04) N2: LS BMD = 0.98 ± 0.13 g/cm2; FN BMD = 0.817 ± 0.11 g/cm2 Incidental fractures appeared only in the untreated group |
| [58] | N1: LS BMD (Z-score) = −0.73 ± 1.43 SD (−4.5–3.08); FN BMD (Z-score) = −0.37 ± 1.06 SD (−2.5–2.19); SDI = 1.35 ± 1.27(0–7) N3: LS BMD (Z-score) = 0.12 ± 1.21 SD (−2.34–3.04); FN BMD (Z-score) = 0.17 ± 1.02 SD(−2.28–3.65); SDI = 0.31 ± 0.68 (0–4) VFx prevalence:N1 = 70.6%;N2 = 21.8%; N3 = 22.2% (prevalence of VFx and SDI was higher in N1 than in N2 and N3, p < 0.0001) VFx and SDI were associated with SH (OR = 7.27, 95% CI 3.94–13.41, p = 0.0001) |
| [59] | N1: LS BMD (Z-score) = −1.04 ± 1.84 SD (−4.50–4.10); FN BMD (Z-score) = −0.63 ± 1.01 SD (−2.5–1.5) N2: LS BMD (Z-score) = 0.19 ± 1.34 SD (−2.80–3.60); FN BMD (Z-score) = 0.01 ± 1.01 SD (−2.8–2.1) N3: LS BMD (Z-score) = 0.20 ± 1.28 SD (−2.30–2.90); FN BMD (Z-score) = 0.26 ± 1.06 SD (−2.30–2.90) Prevalence of osteoporosis: N1 = 40.9%; N2 = 18.2%; N3 = 16.7% (LS BMD: lower in N1 vs. N2 vs. N3 (p = 0.001) and FN (p = 0.002) Prevalence of VFx: N1 = 72.7%; N2 = 21.2%; N3 = 20% (N1> vs. N2 vs. N3, p = 0.0001) SH was associated with LS BMD (β = −0.378, p = 0.0001) and VFx (OR = 7.81, 95% CI 1.96–31.17, p = 0.004) |
| [60] | N1: DXA (T-score) = −1.81 ± 2.07 SD vs. N2: DXA (T-score) = −1.86 ± 1.93 SD\ Prevalence of osteoporosis: N1 = 21.7% vs. N2 = 27.3% |
| [61] | VFx: 35.1% |
| [62] | Baseline: N1: LS BMD (Z-score) = 0.01 ± 1.17 SD (−1.8–2.5); FN BMD (Z-score) = −0.04 ± 0.99 SD (−2.4–2.7); SDI = 1.11 ± 1.50 (0–6) N2: LS BMD (Z-score) = 0.03 ± 1.38 SD (−2.8–4.1); FN BMD (Z-score) = 0.07 ± 0.78 SD (−1.6–2.1); SDI = 0.58 ± 1.10 (0–4) After 24 months of follow-up: N1: LS BMD (Z-score) = 0.27 ± 1.37 SD (−2.0–3.6); FN BMD (Z-score) = 0.00 ± 1.07 SD (−2.4–2.6); SDI = 2.11 ± 1.85(0–8) N2: LS BMD (Z-score) = 0.16 ± 1.45 SD (−2.6–4.6); FN BMD (Z-score) = 0.11 ± 0.83 SD (−1.7–2.9); SDI = 0.79 ± 1.40 (0–6) Baseline prevalence of VFx: N1 = 55.6% vs. N2 = 28.9% After follow-up: prevalence of VFx: N1 = 81.5% (New VFx = 48.1%) vs. N2 = 35.5% (New VFx = 13.2%) The risk of developing new VFx was independently associated with the presence of SH (OR = 12.3; 95% CI 4.1–36.5, p = 0.001) |
| [63] | N1: LS BMD (Z-score) = −0.31 ± 1.17 SD (−2.6–1.81); FN BMD (Z-score) = 0.37 ± 0.78 SD (−1.62–1.74) N2: LS BMD (Z-score) = 0.31 ± 1.42 SD (−3.71–3.61); FN BMD (Z-score) = −0.04 ± 0.99 SD (−2.61–2.71) N3: LS BMD (Z-score) = 0.42 ± 1.52(−2.0–3.72); FN BMD (Z-score) = −0.03 ± 0.72 SD (−1.4–1.6) VFx prevalence: N1 = 82.4% vs.N2 = 45.6% vs. N3 = NA LS BMD: N1 < N2 (p = 0.03) and vs. N3 (p = 0.02) |
| [64] | N1: Before adrenalectomy LS (T-score) = −1.23 ± 0.74 SD; after adrenalectomy LS(T-score) = −1.29 ± 0.77 SD N2: At baseline LS (T-score) = −1.19 ± 0.74 SD; after follow-up: LS(T-score) = −1.27 ± 0.82 SD Prevalence of osteoporosis/osteopenia: N1: Before adrenalectomy = 30%; after adrenalectomy: 1 osteopenic patient became osteoporotic N2: At baseline: = 26.7%; after follow-up: 1 osteopenic patient became osteoporotic There were no changes in T-score in either group (p = NS) |
| [65] | BAI: N1: LS BMD (Z-score) = −0.66 ± 0.45 SD (−2.4–1.3); FN BMD (Z-score) = −0.6 ± 0.3 SD (−2–1) N2: LS BMD (Z-score) = −0.09 ± 0.26 SD (−2.8–3.5); FN BMD (Z-score) = −0.28 ± 0.2 SD (−2–1.2) UAI: N1: LS BMD (Z-score) = −0.25 ± 0.22 SD (−3.6–2.9); FN BMD (Z-score) = −0.17 ± 0.2 SD (−2.8–2.5) N2: LS BMD (Z-score) = 0.23 ± 0.12 SD (−2.8–5.7; FN BMD (Z-score) = 0.14 ± 0.1 SD (−2.6–4.3) Prevalence of VFX: BAI (N1 = 70% vs.N2 = 46.4%); UAI (N1 = 46.3% vs.N2 = 24.6%) Presence of VFx was associated with BAI after adjusting for SH (OR = 1.77, 95% CI 0.85–3.7, p = 0.12) and LS BMD (OR = 1.31, 95% CI 1.03–1.67, p = 0.03) |
| [66] | N1: LS BMD (Z-score) = −0.66 ± 1.4 SD (−3–3); FN BMD (Z-score) = −1.03 ± 1.1 SD (−2.1–2.2) N2: LS BMD (Z-score) = 0.81 ± 1.5 SD (−3–4); FN BMD (Z-score) = 0.6 ± 0.9 SD (−1.6–2.4) Prevalence of osteoporosis: N1 = 87.5% vs. N2 = 27.8% (p < 0.0001) Prevalence of VFx: N1 = 68.8% vs. N2 = 18.5% (p < 0.0001) |
| [67] | N1: LS BMD = 0.92 ± 0.04 g/cm2; LS BMD (T-score) = −0.76 ± 0.15 SD; FN BMD = 0.70 ± 0.04 g/cm2; FN BMD (T-score) = −1.33 ± 0.30 SD N2: LS BMD = 0.76 ± 0.10 g/cm2: LS BMD (T-score) = −2.90 ± 0.95 SD; FN BMD = 0.67 ± 0.08 g/cm2: FN BMD (T-score) = −1.60 ± 0.60 SD Prevalence of VFx: N1 = 100% vs. N2 = 10.6% VFx (SH was associated with a high prevalence of VFx independent of BMD) |
| [68] | N1 = 3 patients with osteoporosis vs. N2 = 5 patients with osteoporosis |
| [69] | N1: LS BMD (Z-score) = −0.02 ± 1.29 SD (−2.8–4.1) FN BMD (Z-score) = 0.06 ± 0.75 SD (−1.6–2.1) N2: LS BMD (Z-score) = 0.37 ± 1.29 SD (2–2.7) FN BMD (Z-score) = −0.13 ± 1.16 SD (−2.4–2.7) VFx rate: 33% (N1) vs. 53.3% (N2) Risk of new VFx at diagnosis and during follow-up (OR = 10.27, 95% CI 3.39–31.12, p = 0.0001) |
| [70] | N1: Baseline: LS BMD (Z-score) = −0.86 ± 1.27 SD (−2.9–1.9); FN BMD (Z-score) = −0.54 ± 0.9 SD (−1.9–1.7) Follow-up: LS BMD (Z-score) = −0.49 ± 1.17 SD (−2.7–2.1); LS ΔZ-score/year = 0.10 ± 0.2 SD (0.0–1.0) FN BMD (Z-score) = −0.41 ± 0.9 SD (−1.7–1.8); FN ΔZ-score/year = −0.09 ± 2.0 SD (−4.26–4.76) N2: Baseline: LS BMD (Z-score) = 0.23 ± 1.4 SD (−1.8–2.7); FN BMD (Z-score) = 0.14 ± 1.2 SD (−2.4–2.7) Follow-up: LS BMD (Z-score) = 0.25 ± 1.5 SD (−2.1–2.8); LS ΔZ-score/year = −0.01 ± 0.3 SD (0.03–0.17) FN BMD (Z-score) = 0.12 ± 1.2 SD (−2.4–2.6); FN ΔZ-score/year = −0.58 ± 2.3 SD (−0.83–0.64) Prevalence of VFX: N1: baseline = 46.9%; follow-up = 46.9% (new VFx = 9.4%) N2: baseline = 65.2%; follow-up = 91.3% (new VFx = 52.2%) LS Z-score (ΔZ-score/year) tended to increase in N1 (0.10 ± 0.20 SD) compared with N2 (−0.01 ± 0.27 SD, p = 0.08) Surgery in AI patients with SH was associated with a 30% VFx risk reduction (OR = 0.7, 95% CI 0.01–0.05, p = 0.008) |
| [71] | N1: LS BMD = 0.96 ± 0.14 g/cm2 LS BMD was lower in BAI than in UAI patients (0.96 ± 0.14 vs. 0.87 ± 0.15 g/cm2, p = 0.002) FN BMD = 0.74 ± 0.11 g/cm2 hip BMD = 0.89 ± 0.13 g/cm2 N2: LS BMD = 0.87 ± 0.15 g/cm2 FN BMD = 0.70 ± 0.12 g/cm2 hip BMD = 0.85 ± 0.13 g/cm2 Prevalence of osteoporosis: N1 = 15.9% vs. N2 = 37.1% (p = 0.011) |
| [72] | N2: LS BMD (T-score) = 1.06 ± 0.20 SD N3: LS BMD (T-score) = 1.11 ± 0.18 SD |
| [73] | VFx prevalence: men—N1 = 25.0%; N2 = 0%; N3 = 1.2%; women—N1 = 0.5%; N2 = 0%; N3 = 3.2% |
| [74] | Premenopausal women: N1: LS BMD = 0.993 ± 0.131 g/cm2; FN BMD = 0.812 ± 0.107 g/cm2; FT BMD = 0.865 ± 0.096 g/cm2 N2: LS BMD = 1.108 ± 0.160 g/cm2; FN BMD = 0.900 ± 0.153 g/cm2; FT BMD = 0.972 ± 0.137 0.865 g/cm2 Postmenopausal women: N1: LS BMD = 0.920 ± 0.146 g/cm2; FN BMD = 0.775 ± 0.127 g/cm2; FT BMD = 0.863 ± 0.104 g/cm2 N2: LS BMD = 0.993 ± 0.172 g/cm2; FN BMD = 0.797 ± 0.130 g/cm2; FT BMD = 0.887 ± 0.148 g/cm2 Men: N1: LS BMD = 1.088 ± 0.188 g/cm2; FN BMD = 0.87± 0.135 g/cm2; FT BMD = 0.964 ± 0.127 g/cm2 N2: LS BMD = 1.107 ± 0.186 g/cm2; FN BMD = 0.898 ± 0.144 g/cm2; FT BMD = 1.01± 0.150 g/cm2 Premenopausal women with SH < NFAI: lower LS BMD (p = 0.008), FN (p = 0.012), FT (p = 0.009) Postmenopausal women with SH > NFAI: lower LS BMD (p = 0.016) Prevalence of VFx: (premenopause) N1 = 0% vs.N2 = 1.7%; (postmenopause) N1 = 0% vs.N2 = 4%; (men) N1 = 0% vs. N2 = 0.7% Similar VFx rates in premenopausal women with SH and NFAI (p = 0.578), postmenopausal women with SH and NFAI (p = 0.209), or men with SH and NFAI (p > 0.999) |
| [75] | N1: LS BMD = 1.007 g/cm2 (0.861–1.314); FN aBMD = 0.917 g/cm2 (0.766–1.170); 33% Radius aBMD = 0.626 g/cm2 (0.496–0.935) N2:LS BMD = 1.125 g/cm2 (0.793–1.681); FN aBMD = 1.002 g/cm2 (0.710–1.384); 33% Radius aBMD = 0.706 g/cm2 (0.528–0.890) Prevalence of osteoporosis: N1 = 75% vs. N2 = 64.9% Prevalence of VFx: N1 = 73.7% vs. N2 = 55.6% (N1 vs. N2, p = 0.24) |
| [76] | Prevalence of osteopenia and osteoporosis: N1: 62%; 38%; N2: 56%; 21%; N3: 52%;19% |
| [77] | Prevalence of osteoporosis: N1 = 18.1% vs.N2 = 8.5% |
| [78] | N1: LS BMD (Z-score) = 0.33 ± 1.2 SD; FN BMD (Z-score) = −0.38 ± 1.0 SD N2: LS BMD (Z-score) = 0.90 ± 1.17 SD; FN BMD (Z-score) = 0.23 ± 1.20 SD Prevalence of VFx: N1 = 63.6% vs. N2 = 70.0% (UFC was higher in mild N1 with VFx than in those without VFx, p = 0.037) |
| [79] | Baseline: 17.9% had osteoporosis → Follow-up (10.5 y): 26.9% had osteoporosis (p = 0.031) |
| [80] | N1: LS BMD = 1.1 g/cm2 (0.5–1.5); FN BMD = 0.8 g/cm2 (0.6–1.3); hip BMD = 0.9 g/cm2 (0.59–1.4) N2: LS BMD = 1.0 g/cm2 (0.7–1.6); FN BMD = 0.8 g/cm2 (0.5–1.2); hip BMD = 0.9 g/cm2(0.5–1.3) Prevalence of any osteoporotic fracture: 16.6% vs.13.3% (p = 0.04) Prevalence of VFx: 6.4% vs. 3.6% (p = 0.004) Cumulative incidence of any new VFx: 10 y = 3.5% vs.10 y = 3.6% (p = 0.33) Risk of developing new fractures during follow-up in N1 vs. N2 OR = 1.27 (95% CI: 1.07–1.52) |
| [81] | N1: LS BMD = 0.87 g/cm2 (0.74–1.00); LS BMD (Z-score) = −0.2 SD (−0.9–0.7) FN BMD = 0.62 g/cm2 (0.53–0.72); FN BMD (Z-score) = −0.6 SD (−1.2–0.3) N2: LS BMD = 0.88 g/cm2 (0.80–1.06); LS BMD (Z-score) = 0.1 SD (−0.6–0.9) FN BMD = 0.65 g/cm2 (0.60–0.76); FN BMD (Z-score) = −0.3 SD (−0.8–0.4) Prevalence of VFx: N1 = 49% vs. N2 = 8% (N1 > N2 had higher rates of coexistence of VFx and arterial stiffness: 23% vs. 2%, p < 0.001) and of VFx and abdominal aortic calcification: 22% vs. 1%, p < 0.001) |
| [82] | N1: LS BMD% (IQR) = 74 (68–81); FN BMD% (IQR) = 75 (68–79); distal radius BMD %(IQR) = 93 (77–104) N2: LS BMD% (IQR) = 96 (91–105); FN BMD% (IQR) = 94 (86–100); distal radius BMD%(IQR) = 97 (89–106) Prevalence of fragility fractures: N1 = 31.3% vs.N2 = 0% MACS and 1-mg DST cortisol were positively associated with osteoporosis/osteopenia (OR = 1.156, 95% CI: 1.046–1.278, p = 0.005) |
| Reference Number | TBS Results |
|---|---|
| [63] | N1: TBS (Z-score) = −3.184 ± 1.211; N2: TBS (Z-score) = −1.704 ± 1.541; N3: TBS (Z-score) = −1.189 ± 0.991 The presence of fracture was associated with low TBS (OR = 4.8; 95% CI: 1.85–12.42, p = 0.001) and with the cluster of low TBS plus low LS-BMD (OR = 4.37; 95% CI, 1.71–11.4, p = 0.002) |
| [72] | N2: TBS = 1.30 ± 0.09; N3: TBS = 1.37 ± 0.12 TBS was significantly decreased in N3 vs. N2 (p < 0.04), but not BMD (p = 0.34) After remission of CS, TBS has improved more markedly and rapidly than BMD (10% vs. 3%, p < 0.02) |
| [73] | 1 mg DST—cortisol was inversely correlated with TBS in men (β = −0.133, p = 0.045) and women (β = −0.140, p = 0.048). Compared with women with NFAI, women with SH had 2.2% lower TBS (p = 0.040). |
| [81] | N1: TBS = 1.34(1.28–1.39); N2: TBS = 1.37(1.31–1.42) baPWV was negatively correlated with TBS (r = −0.33, p = 0.002) |
| Reference Number | BTMs and Calcium and Mineral Metabolism Assays |
|---|---|
| [44] | Osteocalcin, ICTP, PIIINP: significantly lower in N1 and N2 vs. N3 (p < 0.01) |
| [45] | N1: Osteocalcin = 3.0 ng/mL (1.1–8.6) PICP = 111.5 µg/L (68–307) ICTP = 4.0 µg/L (1.8–7.9) PIIINP = 2.2 µg/L (1.3–3.7) bone ALP = 4.4 µg/L (1–22.5) N2: Osteocalcin = 6.6 ng/mL (1.8–12.9): Lower osteocalcin in N2 vs. N3 (p < 0.05) PICP = 119 µg/L (78–223) ICTP = 4.2 µg/L (1.1–6.3): Higher ICTP in N2 vs. N3 (p < 0.01) PIIINP = 3.1 µg/L (2.3–6.2) bone ALP = 12.1 µg/L (7–24) N3: Osteocalcin = 7.8 ng/mL (3.8–17) PICP = 108 µg/L (63–163) ICTP = 3.1 µg/L (1–6.1) PIIINP = 3.5 µg/L (2.1–7.8) bone ALP = 11.5 µg/L (3.1–18.5) |
| [46] | N1: Osteocalcin = 0.9 ± 0.2 ng/mL ICTP = 2.7 ± 0.2 ng/mL PIIINP = 1.9 ± 0.2 ng/mL N2: Osteocalcin = 2.5 ± 0.8 ng/mL: Osteocalcin, ICTP, PIIINP N2 < N4 (p < 0.0001, p < 0.0001, p < 0.02) ICTP = 2.2 ± 0.1 ng/mL PIIINP = 2.2 ± 0.2 ng/mL N3: Osteocalcin = 4.2 ± 0.5 ng/mL: Osteocalcin, ICTP N3 < N4 (p < 0.05 and p < 0.001) ICTP = 2.9 ± 0.2 ng/mL PIIINP = 3.6 ± 0.2 ng/mL N4: Osteocalcin = 5.5 ± 0.2 ng/mL ICTP = 3.9 ± 0.2 ng/mL PIIINP = 3.2 ± 0.2 ng/mL |
| [47] | N1:Osteocalcin = 3.8 ± 2.3 ng/mL: Osteocalcin was lower in N1 vs. N2 vs. N3, (p < 0.05) ICTP = 4.08 ± 1.29 µg/L D-Pyr/Cr = 28.6 ± 12.8 pmol/pmoL PTH = 57.1 ± 13.6 pg/mL ALP = 207 ± 104 U/L N2: Osteocalcin = 7.5 ± 3.1 ng/mL ICTP = 3.90 ± 2.39 µg/L D-Pyr/Cr = 24.6 ± 7.9 pmol/pmoL PTH = 46.0 ± 14.8 pg/mL ALP = 190 ± 70 U/L N3: Osteocalcin = 8.8 ± 3.2 ng/mL ICTP = 4.01 ± 1.57 µg/L D-Pyr/Cr = 24.6 ± 6.8 pmol/pmoL PTH = 37.2 ± 10.9 pg/mL ALP = 167 ± 43 U/L PTH was higher in N1 vs. N2 (p < 0.05); PTH positively was correlated with D-Pyr/Cr (r = 0.72, p < 0.05) and inversely correlated with BMD measured at FN (r = −0.92, p < 0.002) |
| [49] | PTH: Inversely correlated with either LS or FN BMD values (r = −0.5; r2 = 0.25; p = 0.015, and r = 0.42; r2 = 0.18; p = 0.03). |
| [50] | N1: Osteocalcin = 1.22 ± 0.41 pmol/L D-Pyr/Cr = 18.6 ± 6.31 pmol/pmoL PTH = 56.2 ± 10.2 ng/L (10–70) N2: Osteocalcin = 1.41 ± 0.45 pmol/L D-Pyr/Cr = 22.1 ± 8.22 pmol/pmoL (BGP, D-Pyr and D-Pyr/Cr were similar in N1 and N2, p = NS) PTH = 45.6 ± 12.5 ng/L (10–70) (PTH tended to be higher in N1 vs. N2 but not statistically significantly, p = 0.06) |
| [51] | N1: Ca = 9.26 ± 0.51 mg/dL Phosphorus = 3.86 ± 0.73 mg/dL ALP = 176 ± 83.7 U/L N2:Ca = 9.23 ± 0.42 mg/dL Phosphorus = 3.46 ± 0.4 mg/dL ALP = 164 ± 39 U/L N3: Ca = 9.10 ± 0.6 mg/dL Phosphorus = 3.7 ± 0.7 mg/dL ALP = 169 ± 48 U/L |
| [52] | N1: Osteocalcin = 3.2 ± 1.0 pmol/L D-Pyr/Cr = 23.2 ± 21.5 pmol/pmoL PTH = 38.5 ± 10.6 ng/L N2: Osteocalcin = 2.8 ± 0.7 pmol/L D-Pyr/Cr = 13.5 ± 5.9 pmol/pmoL PTH = 40.3 ± 12.3 ng/L N3: Osteocalcin = 3.9 ± 1.2 pmol/L (Osteocalcin and D-Pyr/Cr were similar between groups) D-Pyr/Cr = 12.7 ± 4.7 pmol/pmoL PTH = 40.9 ±13.8 ng/L (PTH levels were similar between groups) |
| [53] | N1:Phosphorus = 1.063 ± 0.146mmol/L vs. N2: Phosphorus = 1.115 ± 0.126 mmol/L vs. N3: Phosphorus = 1.235 ± 0.214 mmol/L Significant reduction in osteocalcin in N1 vs. N3 (p < 0.05) Significant reductions in osteocalcin and serum phosphorus in N1 and N2 vs. N3 (p < 0.05) |
| [54] | N1: Osteocalcin = 18.6 ± 8.6 ng/mL (Osteocalcin: N1 < N2, p < 0.01). PTH = 43 ± 15.6 pg/mL N2: Osteocalcin = 26.2 ± 8.1 ng/mL PTH = 41.2 ± 14.8 pg/mL (Similar PTH N1 = N2, p = 0.72), PTH correlated with FN BMD, r = −0.46, p < 0.05). |
| [56] | N1: Osteocalcin = 1.9 ± 0.5 ng/mL CTX = 0.69 ± 0.24 ng/mL Ca = 2.36 ± 0.13 mmol/L PTH = 43 ± 12 ng/L ALP = 164 ± 52 U/L N2: Osteocalcin = 3.4 ± 0.9 ng/mL CTX = 0.56 ± 0.22 ng/mL Ca = 2.34 ± 0.14 mmol/L PTH = 38 ± 15 ng/L ALP = 175 ± 61 U/L N3: Osteocalcin = 8.9 ± 2.4 ng/mL CTX = 0.34 ± 0.18 ng/mL Ca = 2.33 ± 0.11 mmol/L PTH = 40 ± 16 ng/L ALP = 180 ± 58 U/L |
| [57] | N1: Osteocalcin = 15 ± 3 ng/mL CTX = 1520 ± 923 pmol/L bone ALP = 14.2 ± 4 μg/L Ca = 2.35 ± 0.1 mmol/L iPTH = 43 ± 12 ng/L N2:Osteocalcin = 14.6 ± 3.2 ng/mL (osteocalcin, CTX, and bone ALP decreased in N1 vs. N2, p < 0.05) CTX = 1590 ± 1065 pmol/L Bone ALP = 15 ± 3.5 μg/L Ca = 2.34 ± 0.1 mmol/L iPTH = 38 ± 15 ng/L |
| [63] | N: ALP = 69.1 ± 20.0 U/L; 25OHD = 27.1 ± 14.4 ng/mL vs. N2: ALP = 70.7 ± 19.5U/L; 25OHD = 25.9 ± 13.6 ng/mL |
| [65] | BAI: N1: 25OHD = 46.3 ± 16.3 nmol/L Ca = 2.3 ± 0.1 mmol/L PTH = 58.3 ± 11 pg/mL ALP = 74.8 ± 22.9 U/L N2: 25OHD = 55 ± 29 nmol/L Ca = 2.3 ± 0.2 mmol/L PTH = 56.8 ± 21.2 pg/mL ALP = 74.1 ± 24.3 U/L UAI: N1: 25OHD = 41.8 ± 26.8 nmol/L Ca = 2.3 ± 0.1 mmol/L PTH = 53.9 ± 19.9p g/mL ALP = 72.8 ± 19.8 U/L N2: 25OHD = 48.3 ± 28.5 nmol/L Ca = 2.3 ± 0.1 mmol/L PTH = 53.4 ± 21.4 pg/mL ALP = 73.1 ± 19.4 U/L |
| [70] | N1: Baseline: 25OHD = 21.9 ±8.7 ng/mL vs. Follow-up: 25OHD = 39.4 ± 8.1 ng/mL N2: Baseline: 25OHD = 22.4 ±7.3 ng/mL vs. Follow-up: 25OHD = 38.7 ± 7.5 ng/mL |
| [75] | N1: 25OHD = 24 ng/mL vs. N2: 25OHD = 25 ng/mL |
| [76] | N1: Osteocalcin = 14.8 ng/mL P1NP = 34.8 µg/L CTX = 0.3 ng/mL Sclerostin = 419 pg/mL N2: Osteocalcin = 20.1 ng/mL P1NP = 48.7 µg/L CTX = 0.4 ng/mL Sclerostin = 538 pg/mL N3: Osteocalcin = 33 ng/mL (Osteocalcin, P1NP N1 < N2 vs. N3, p < 0.001), and P1NP, p = 0.003). P1NP = 48.5 µg/L CTX = 0.4 ng/mL (similar CTX N1, N2, N3) Sclerostin = 624 pg/mL (sclerostin N1 vs. N2 vs. N3, p < 0.0001) |
| [78] | N1: Osteocalcin = 14.9 ± 7.4 ng/mL U-NTX = 50.6 ± 25.6 nmol BCE/mmol Cr bone ALP = 15.7 ± 6.0 µg/L 25OHD = 16.9 ± 6.8 ng/mL PTH = 45.6 ± 15.3 pg/mL Ca = 9.2 ± 0.40 pg/mL N2: Osteocalcin = 10.3 ± 5.6 ng/mL U-NTX = 26.9 ± 16.6 nmol BCE/mmol Cr (U-NTX: N1 > N2, p = 0.017) and bone ALP, p = 0.016) bone ALP = 11.1 ± 4.3 µg/L 25-OHD = 18.0 ± 8.2 ng/mL PTH = 48.8 ± 14.4 pg/mL Ca = 9.2 ± 0.41 pg/mL |
| [81] | N1: Ca = 9.3 mg/dL (9.1–9.5) 25OHD = 13.7 ng/mL (9.7–17.5) PTH = 53.8 pg/mL (38.3–69.2) bone ALP = 12.3 μg/L (9.8–15.4) N2: Ca = 9.3 mg/dL (9.1–9.5) 25OHD = 14.3 ng/mL (10.5–18.5) PTH = 43.8 pg/mL (34.5-54.7) (iPTH levels were positively correlated with baPWV, r = 0.27, p = 0.011) bone ALP = 12.5 μg/L (9.9–15.9) |
| [82] | N1: Ca = 9.1 mg/dL (8.7–9.4) vs. N2: Ca = 9.2 mg/dL (8.9–9.5) |
| First Author Publication Year Reference Number Study Design Follow-Up Period | Baseline Status | Follow-Up | ||
|---|---|---|---|---|
| Tauchmanova 2009 [57] Case-control study N = 46 N1 = 23 with SCS treated with clodronate N2 = 23 with SCS untreated Follow-up: 1 y | Treated-N1 LS BMD = 0.97 ± 0.12 g/cm2 FN BMD = 0.816 ± 0.14 g/cm2 Osteocalcin = 15 ± 3 ng/mL CTX = 1520 ± 923 pmol/L bone ALP = 14.2 ± 4 μg/L Ca = 2.35 ± 0.1 mmol/L iPTH = 43 ± 12 ng/L VFx = 65% | Untreated-N2 LS BMD = 0.98 ± 0.13 g/cm2 FN BMD = 0.817 ± 0.11 g/cm2 Osteocalcin = 14.6 ± 3.2 ng/mL CTX = 1590 ± 1065 pmol/L bone ALP = 15 ± 3.5 μg/L Ca = 2.34 ± 0.1 mmol/L iPTH = 38 ± 15 ng/L VFx = 61% | Treated-N1 LS BMD = 1.03 ± 0.11 g/cm2 FN BMD = 0.825 ± 0.1 g/cm2 Osteocalcin = 11.2 ± 2.8 ng/mL CTX = 1005 ± 670 pmol/L bone ALP = 11.1 ± 4.3 μg/L VFx = 65% | Untreated-N2 LS BMD = 0.96 ± 0.11 g/cm2 FN BMD = 0.8 ± 0.12 g/cm2 Osteocalcin = 13.8 ± 3.1 ng/mL CTX = 1533 ± 923 pmol/L bone ALP = 14.2 ± 4.2 μg/L VFx = 65% |
| Morelli 2011 [62] Cross-sectional study N = 103 women N1 = 27 with SH N2 = 76 without SH Follow-up: 2 y | With SH LS BMD (Z-score) = 0.01 ± 1.17 SD (−1.8–2.5) FN BMD (Z-score) = −0.04 ± 0.99 SD (−2.4–2.7) SDI = 1.11 ± 1.50(0–6) VFx = 55.6% | Without SH LS BMD (Z-score) = 0.03 ± 1.38 SD (−2.8–4.1) FN BMD (Z-score) = 0.07 ± 0.78 SD (−1.6–2.1) SDI = 0.58 ± 1.10 (0–4) VFx = 28.9% | With SH LS BMD (Z-score) = 0.27 ± 1.37 SD (−2.0–3.6) FN BMD (Z-score) = 0.00 ± 1.07 SD (−2.4–2.6) SDI = 2.11 ± 1.85 (0–8) VFx = 81.5% new VFx = 48.1% | Without SH LS BMD (Z-score) = 0.16 ± 1.45 SD (−2.6–4.6) FN BMD (Z-score) = 0.11 ± 0.83 SD (−1.7–2.9) SDI = 0.79 ± 1.40 (0–6) VFx = 35.5% new VFx = 13.2% |
| Podbregar 2021 [79] Prospective study N = 67 with NFAI Follow-up: 10.5 y | Osteoporosis prevalence = 17.9% | Osteoporosis prevalence = 26.9% (p = 0.031) | ||
| Li 2021 [80] Cohort study N1 = 1004 with AI N2 = 1004 controls Follow-up: 10 y | N1 Any osteoporotic site = 16.6% VFx = 6.4% Hip fracture = 2.9% Distal forearm fracture = 9.4% N2 Any osteoporotic site = 13.3% (p = 0.04) VFx = 3.6% (p = 0.004) Hip fracture = 2% (p = 0.19) Distal forearm fracture = 9% (p = 0.76) | N1 Cumulative incidence of new VFx = 3.5% Cumulative incidence of new hip fracture = 2.6% Cumulative incidence of new distal forearm fracture = 3.2% N2 Cumulative incidence of new VFx = 3.6% (p = 0.33) Cumulative incidence of new hip fracture = 2.7% (p = 0.84) Cumulative incidence of new distal forearm fracture = 3% (p = 0.63) | ||
| First Author, Publication Year Reference Number Study Design Studied Population | N1 (Patients with Adrenalectomy) | N2 (Conservative or Non-Surgical Group) | ||
|---|---|---|---|---|
| Before Adrenalectomy | After Adrenalectomy | At Baseline | At the End of Follow-Up | |
| Toniato 2009 [60] Prospective study N = 45 N1 = 23 with adrenalectomy N2 = 22 with conservative | DXA (T-score) = −1.81 ± 2.07 SD 21.7% with osteoporosis | Any changes in bone parameters were detected after surgery | DXA(T-score) = −1.86 ± 1.93 SD 27.3% with osteoporosis | Median period of follow-up: 7.7 (2–17) years |
| Iacobone 2012 [64] Prospective study N = 35 N1 = 22 with adrenalectomy N2 = 15 with conservative | LS (T-score) = −1.23 ± 0.74 SD 30% with osteoporosis or osteopenia | Mean period of follow-up: 54 ± 34 months LS(T-score) = −1.29 ± 0.77 SD One “osteopenic” patient became “osteoporotic” (p = NS) | LS (T-score) = −1.19 ± 0.74 SD 26.7% with osteoporosis or osteopenia | Mean period of follow-up: 56 ± 37 months LS(T-score) = 1.27 ± 0.82 SD One “osteopenic” patient became “osteoporotic” (p = NS) |
| Perogamvros 2015 [68] Retrospective study N = 33 N1 = 14 with adrenalectomy N2 = 19 with conservative | 3 patients with osteoporosis | Mean period of follow-up: 53.9 ± 21.3 months 2 patients with improvement of osteoporosis features | 5 patients with osteoporosis | Mean period of follow-up: 51.8 ± 20.1 months no patient with improvement of osteoporosis features |
| Salcuni 2016 [70] Cross-sectional Prospective intervention N = 55 N1 = 32 with adrenalectomy N2 = 23 conservative | LS BMD (Z-score) = −0.86 ± 1.27 SD (−2.9–1.9) FN BMD (Z-score) = −0.54 ± 0.9 SD (−1.9–1.7) 25OHD = 21.9 ± 8.7 ng/mL Patients with VFx = 46.9% | LS BMD (Z-score) = −0.49 ± 1.17 SD (−2.7–2.1) LS ΔZ-score/year = 0.10 ± 0.2 SD (0.0–1.0) FN BMD (Z-score) = −0.41 ± 0.9 SD (−1.7–1.8) FN ΔZ-score/year = −0.09 ± 2.0 SD (−4.26–4.76) 25OHD = 39.4 ± 8.1 ng/mL Patients with VFx = 46.9% Patients with new VFx = 9.4% | LS BMD (Z-score) = 0.23 ± 1.4 SD (−1.8–2.7) FN BMD (Z-score) = 0.14 ± 1.2 SD (−2.4–2.7) 25OHD = 22.4 ± 7.3 ng/mL Patients with VFx = 65.2% | LS BMD (Z-score) = 0.25 ± 1.5 SD (−2.1–2.8) LS ΔZ-score/year = −0.01 ± 0.3 SD (0.03–0.17) FN BMD (Z-score) = 0.12 ± 1.2 SD (−2.4–2.6) FN ΔZ-score/year = −0.58 ± 2.3 SD (−83–0.64) 25OHD = 38.7 ± 7.5 ng/mL Patients with VFx = 91.3% Patients with new VFx = 52.2% |
| First Author Publication Year Reference Number Study Design | Studied Population Gender (F/M) Age (Years) | Criteria for ACS Diagnosis | Prevalence of ACS | DXA–BMD, T-Score or Z-Score | Fracture Prevalence |
|---|---|---|---|---|---|
| Chiodini 2007 [83] Cross-sectional study | N = 219 N1 = 147 with osteoporosis F/M = 131/16 Mean age: 63.7 y N2 = 72 without osteoporosis F/M = 69/3 Mean age: 57.4 y | Serum cortisol after LDDST > 50.0 nmol/L UFC > 165.6 nmol/L and/or midnight cortisol > 207 nmol/L | Prevalence of SH: N1–4.8% (1.32%−8.20%) N2:0% (p = 0.099) | N1: Mean T-score (SD) LS = −2.88 (1.08) FT = −1.96 (0.88) FN = −2.03 (0.88) N2: Mean T-score (SD) LS = −1.37 (1.09) FT = −0.99 (0.97) FN = −1.13 (0.90) | N1: Grade of fracture (I/II/III), N = 54/14/8 N2: Grade of fracture (I/II/III), N = 0 |
| Pugliese 2021 [84] Cross-sectional study | N = 101 patients with fractures N1 = 5 with less severe hypercortisolism (LSH) F/M = 3/2 Mean age: 62.6 ± 13.3 y N2 = 96 with non-LSH patients F/M = 72/24 Mean age: 65 ± 10.3 y | Serum cortisol after 1 mg DST > 1.8 μg/dL for confirmation Serum cortisol after LDDST > 1.8 μg/dL | Prevalence of LSH: 5.0% | N1: LS BMD (Z-score) = −1.5 ± 1.1 SD FN BMD (Z-score)= −1.2 ± 0.6 SD N2: LS BMD (Z-score) = −1.5 ± 1.3 SD FN BMD (Z-score) = −0.9 ± 0.9 SD p = NS | All |
Disclaimer/Publisher’s Note: The statements, opinions and data contained in all publications are solely those of the individual author(s) and contributor(s) and not of MDPI and/or the editor(s). MDPI and/or the editor(s) disclaim responsibility for any injury to people or property resulting from any ideas, methods, instructions or products referred to in the content. |
© 2023 by the authors. Licensee MDPI, Basel, Switzerland. This article is an open access article distributed under the terms and conditions of the Creative Commons Attribution (CC BY) license (https://creativecommons.org/licenses/by/4.0/).
Share and Cite
Trandafir, A.-I.; Stanciu, M.; Albu, S.E.; Stoian, V.R.; Ciofu, I.; Persu, C.; Nistor, C.; Carsote, M. Management of Adrenal Cortical Adenomas: Assessment of Bone Status in Patients with (Non-Functioning) Adrenal Incidentalomas. J. Clin. Med. 2023, 12, 4244. https://doi.org/10.3390/jcm12134244
Trandafir A-I, Stanciu M, Albu SE, Stoian VR, Ciofu I, Persu C, Nistor C, Carsote M. Management of Adrenal Cortical Adenomas: Assessment of Bone Status in Patients with (Non-Functioning) Adrenal Incidentalomas. Journal of Clinical Medicine. 2023; 12(13):4244. https://doi.org/10.3390/jcm12134244
Chicago/Turabian StyleTrandafir, Alexandra-Ioana, Mihaela Stanciu, Simona Elena Albu, Vasile Razvan Stoian, Irina Ciofu, Cristian Persu, Claudiu Nistor, and Mara Carsote. 2023. "Management of Adrenal Cortical Adenomas: Assessment of Bone Status in Patients with (Non-Functioning) Adrenal Incidentalomas" Journal of Clinical Medicine 12, no. 13: 4244. https://doi.org/10.3390/jcm12134244