
Anesthesia Depresses Cerebrovascular Reactivity to Acetazolamide in Pediatric Moyamoya Vasculopathy
 , , , , and
Abstract
:1. Introduction
2. Materials and Methods
2.1. Anesthesia
2.2. Scanning Protocol and Parameters
Regions of Interest, Data Processing, and Statistics
3. Results
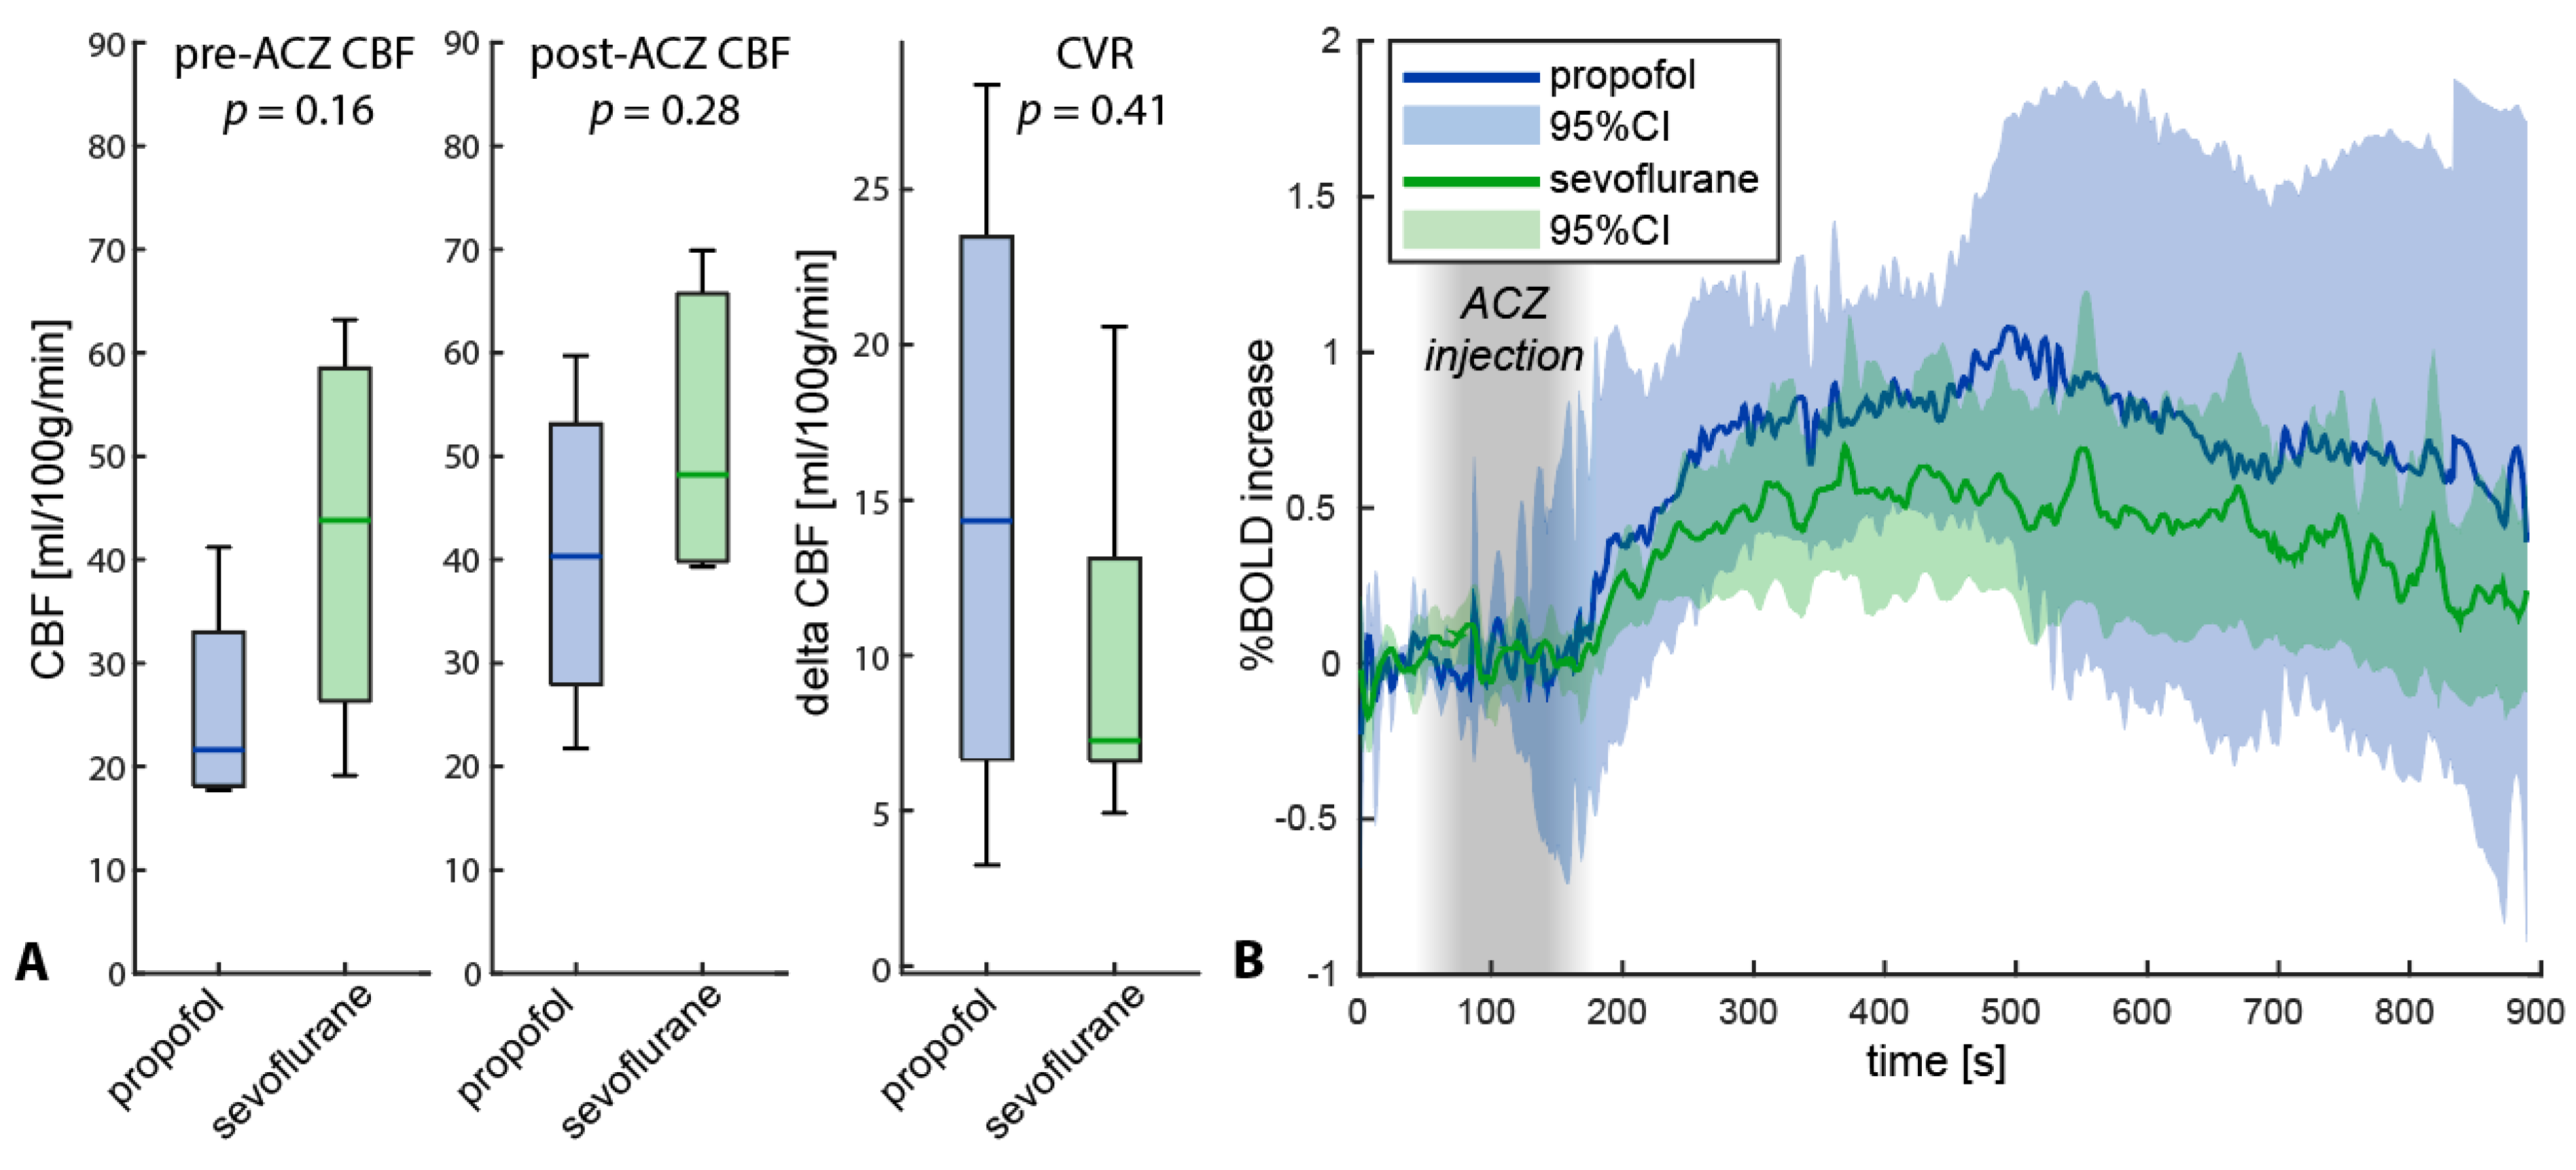
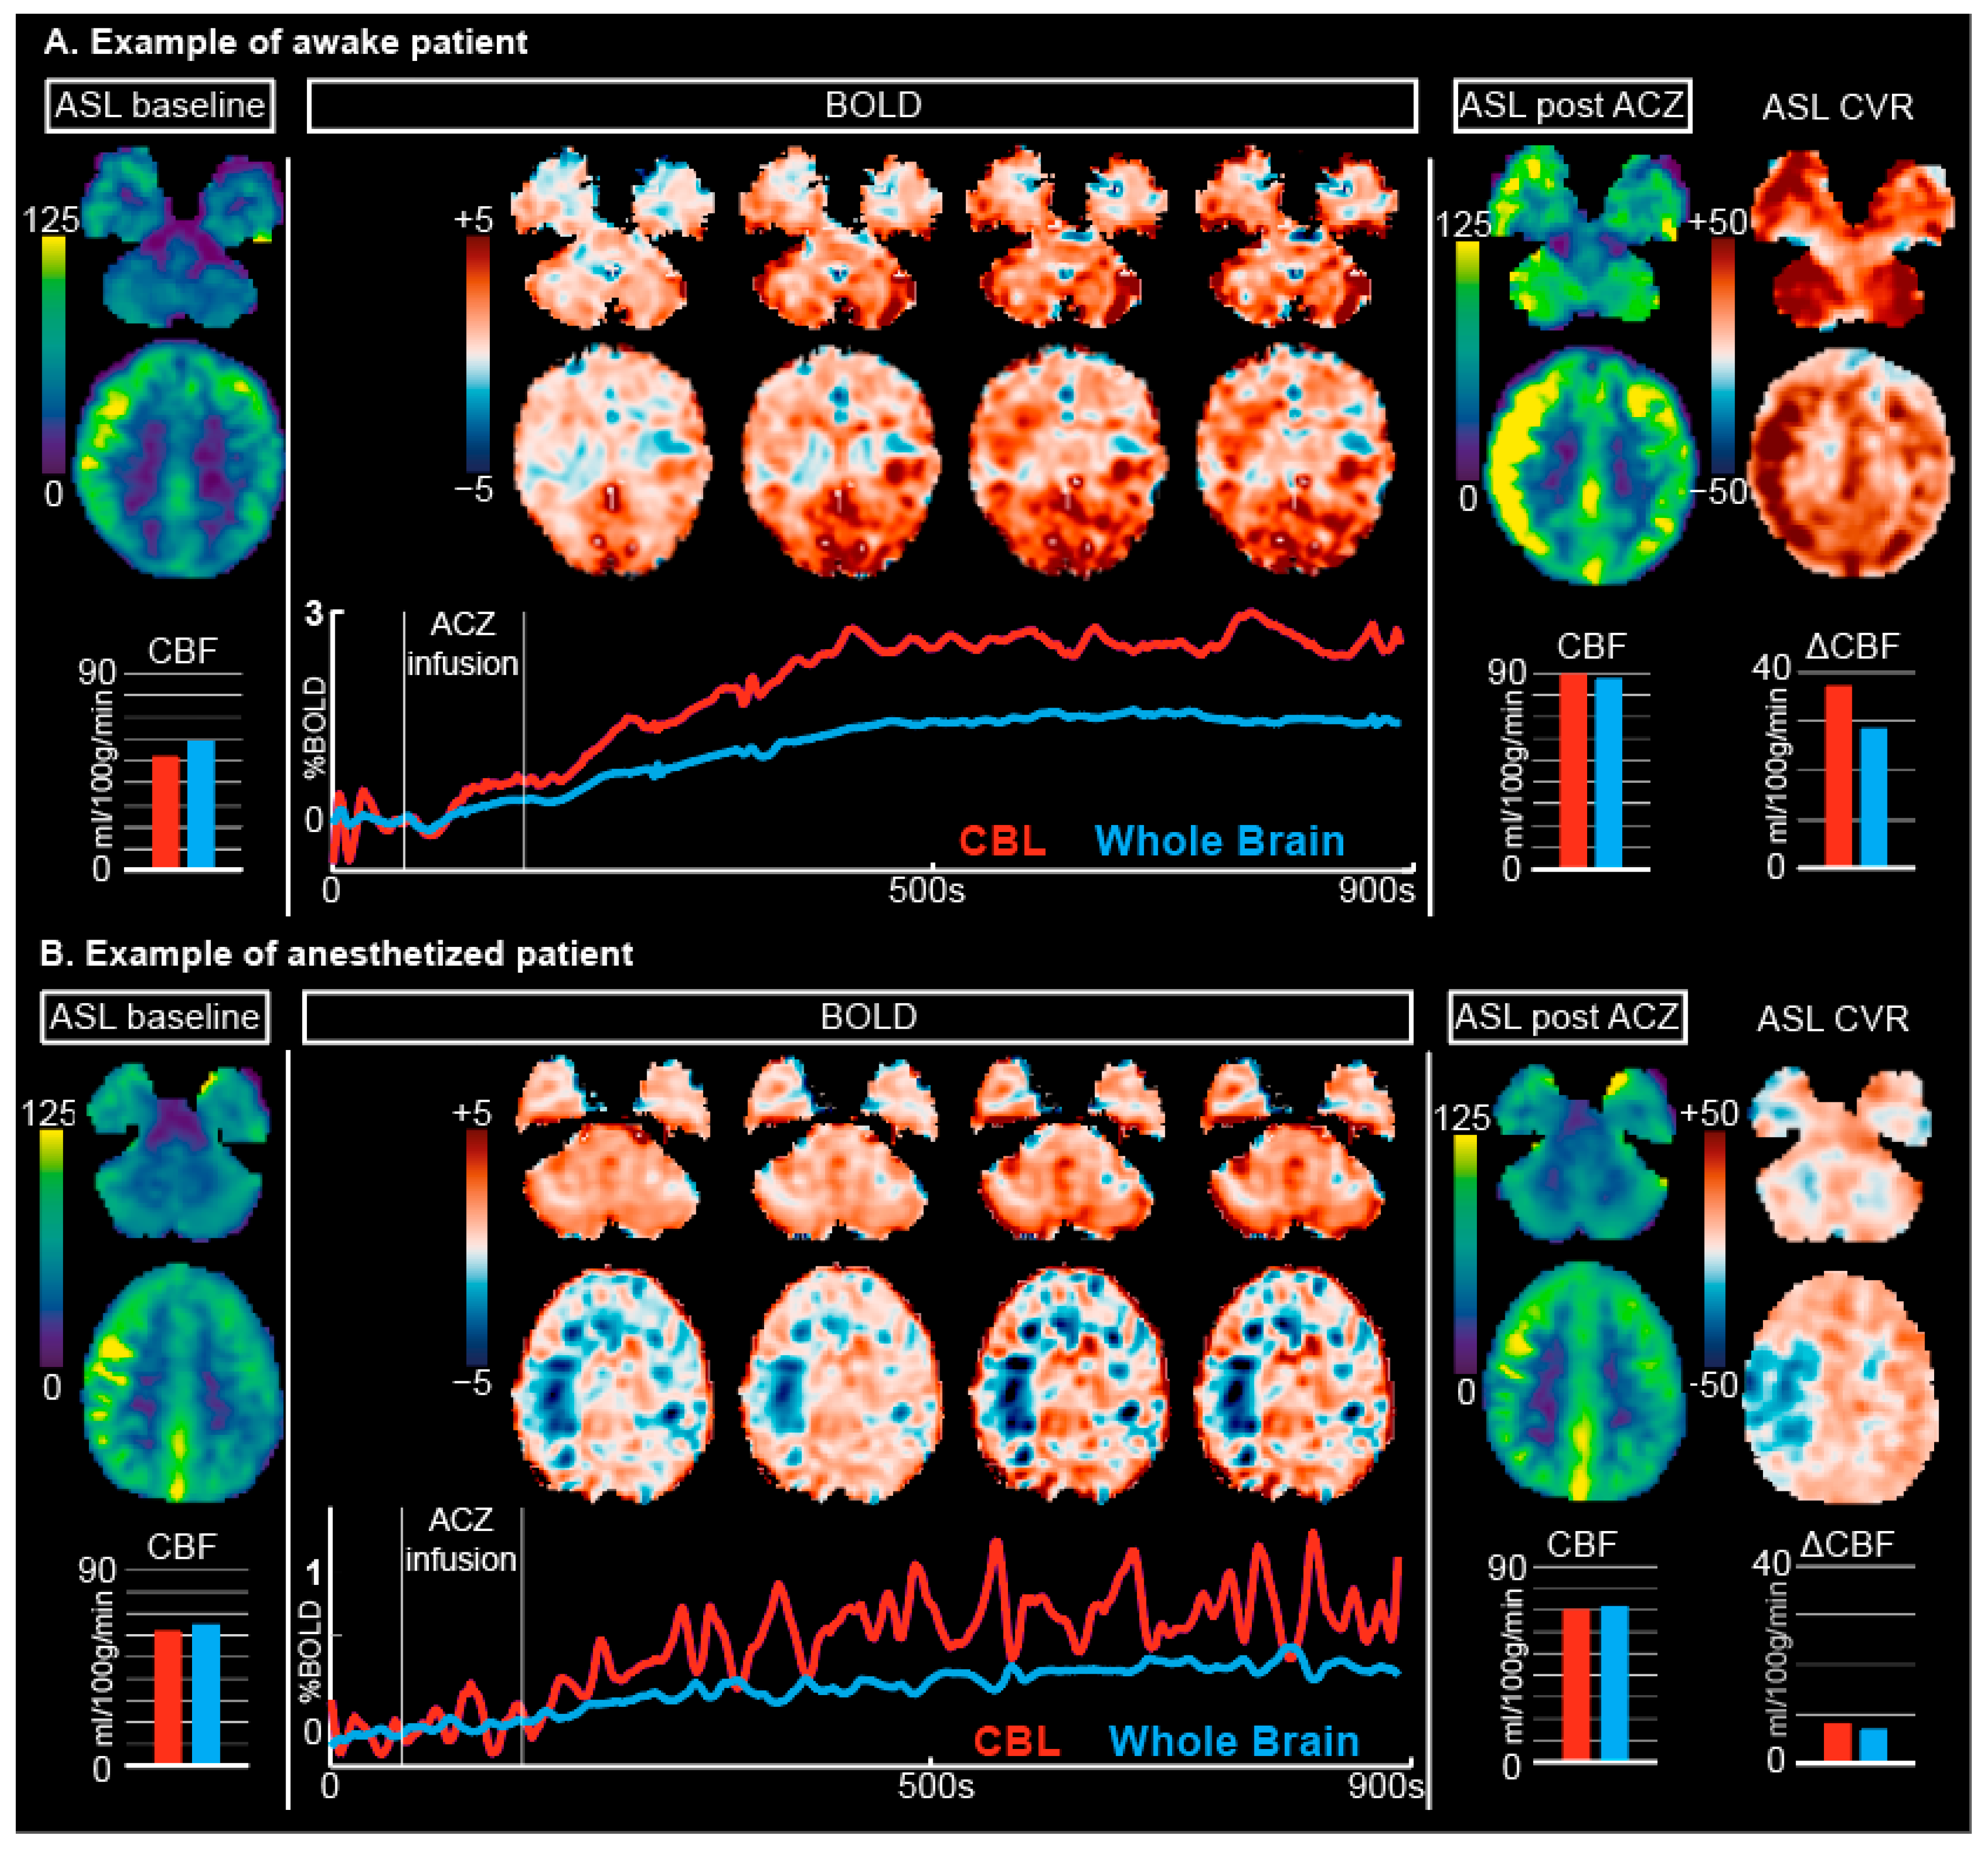
3.1. ASL
3.2. BOLD
3.3. Difference in Anesthesia Type
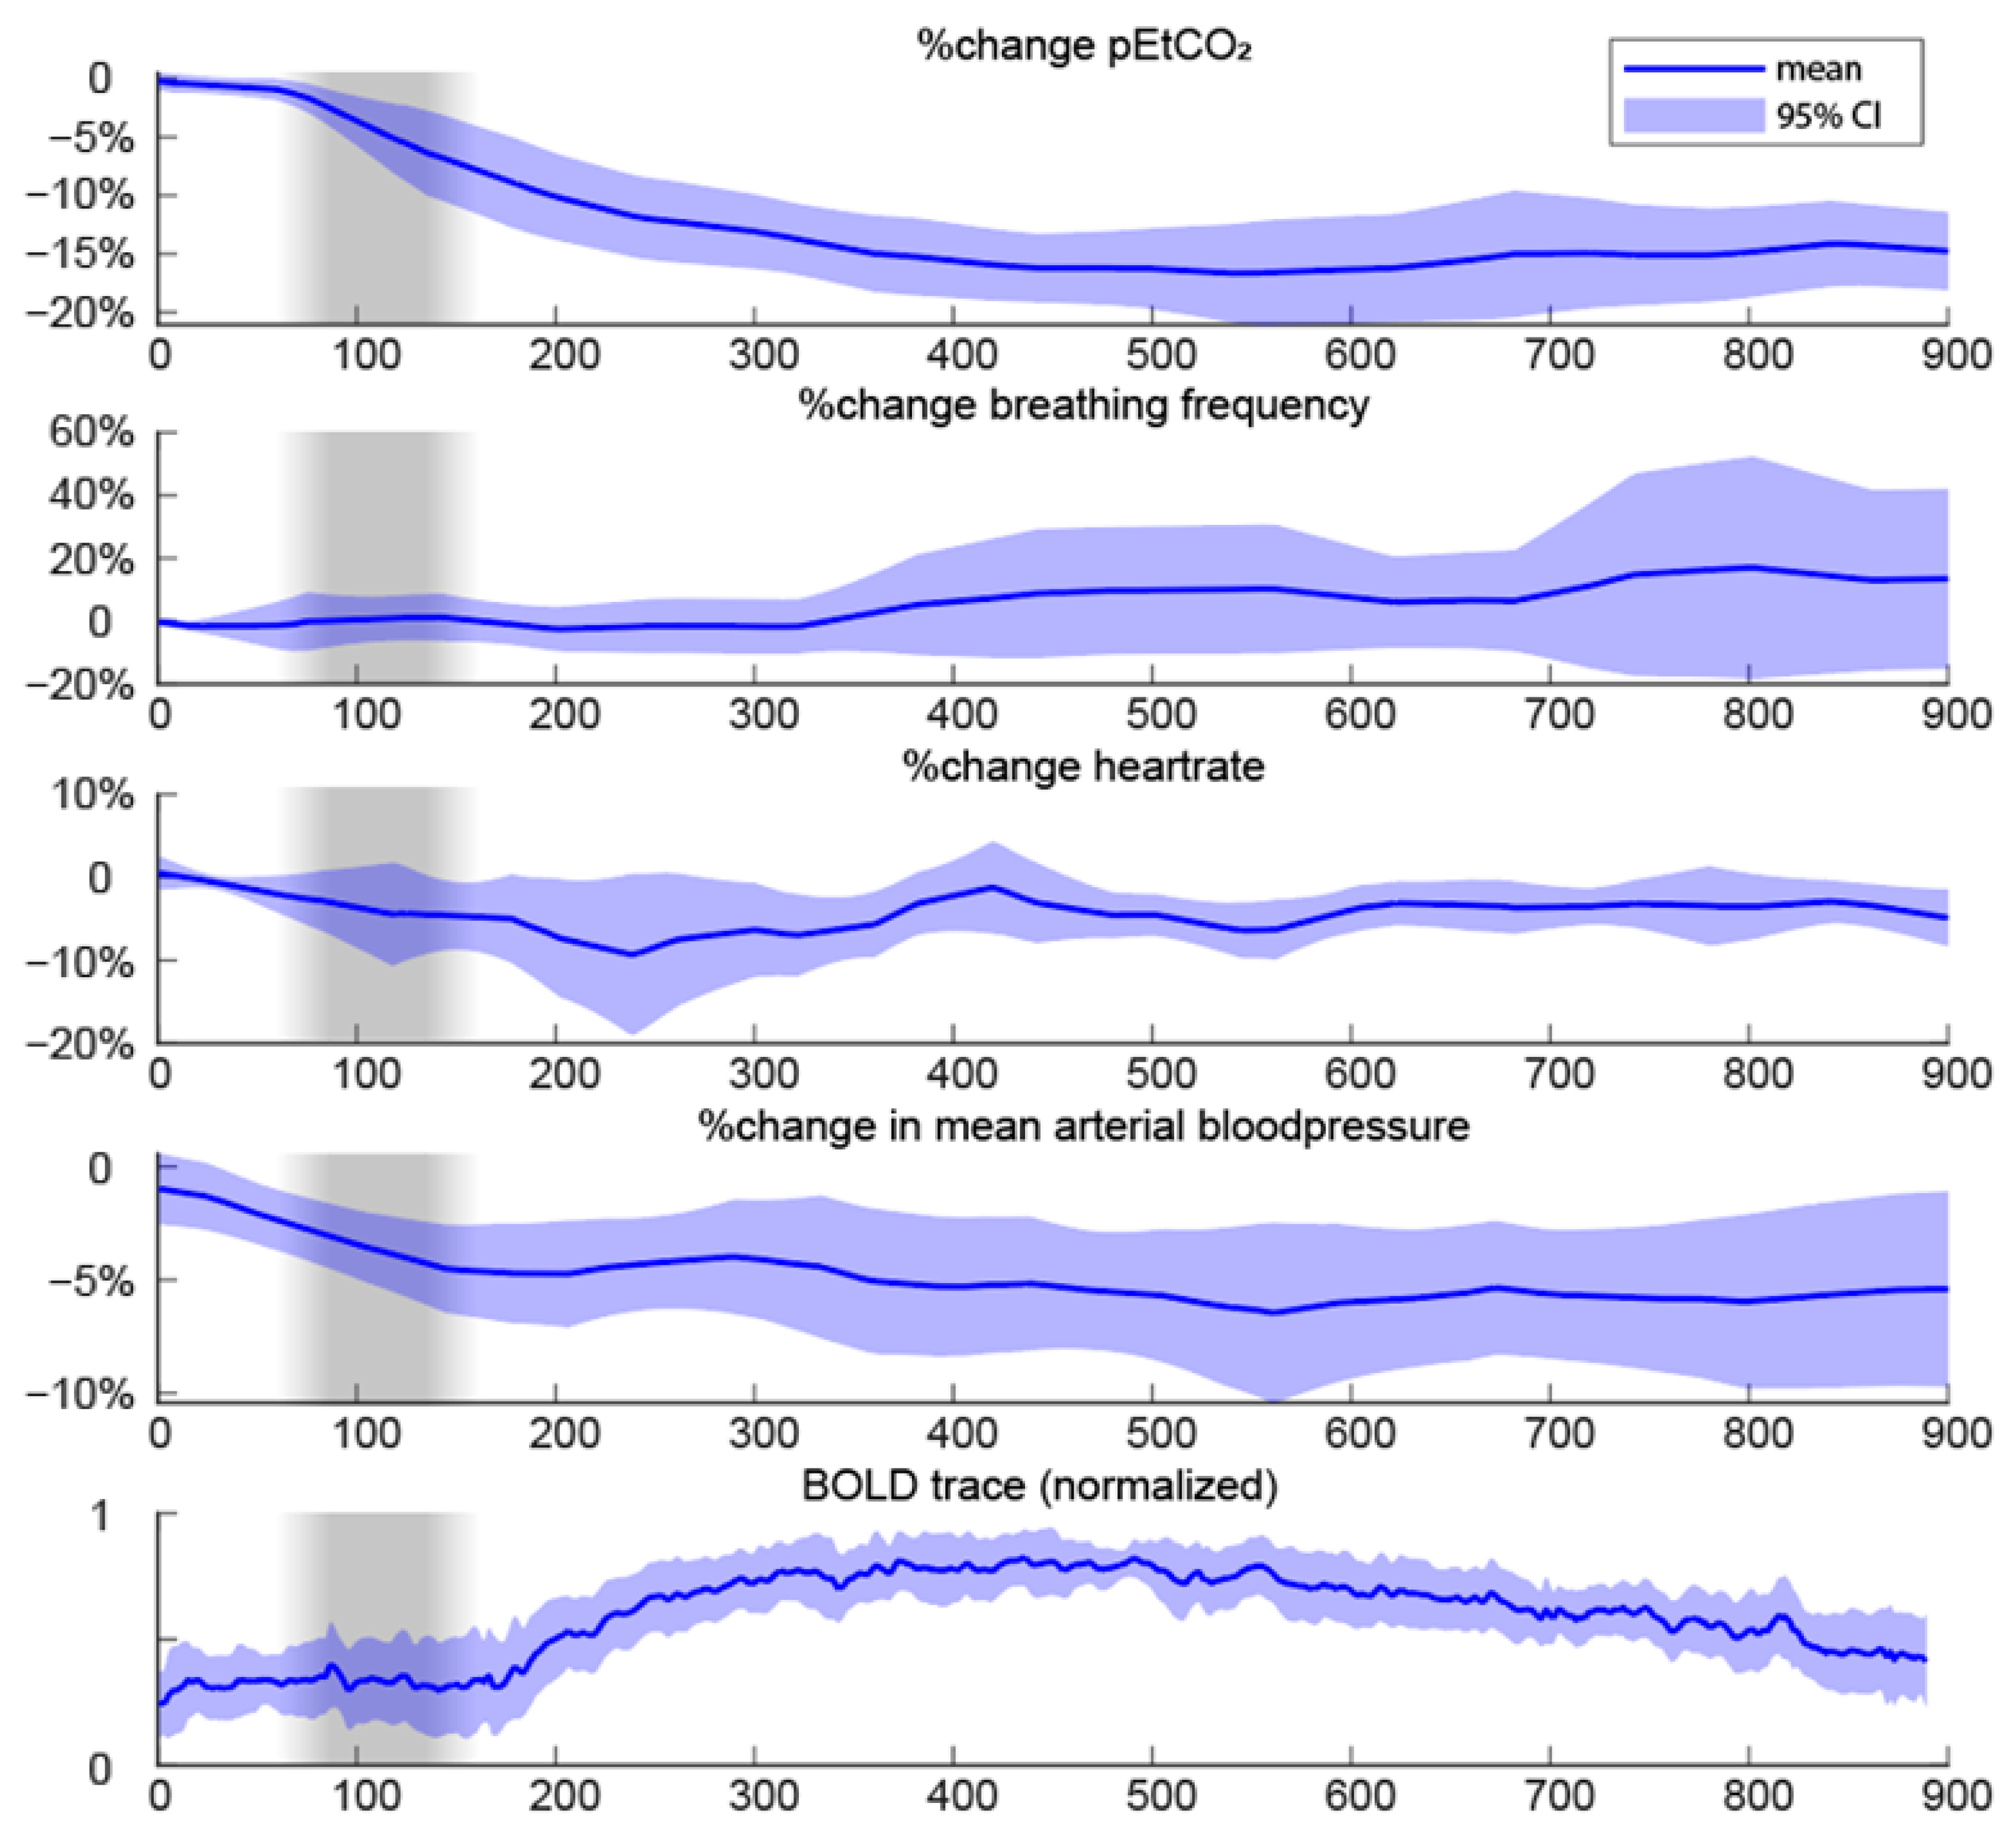
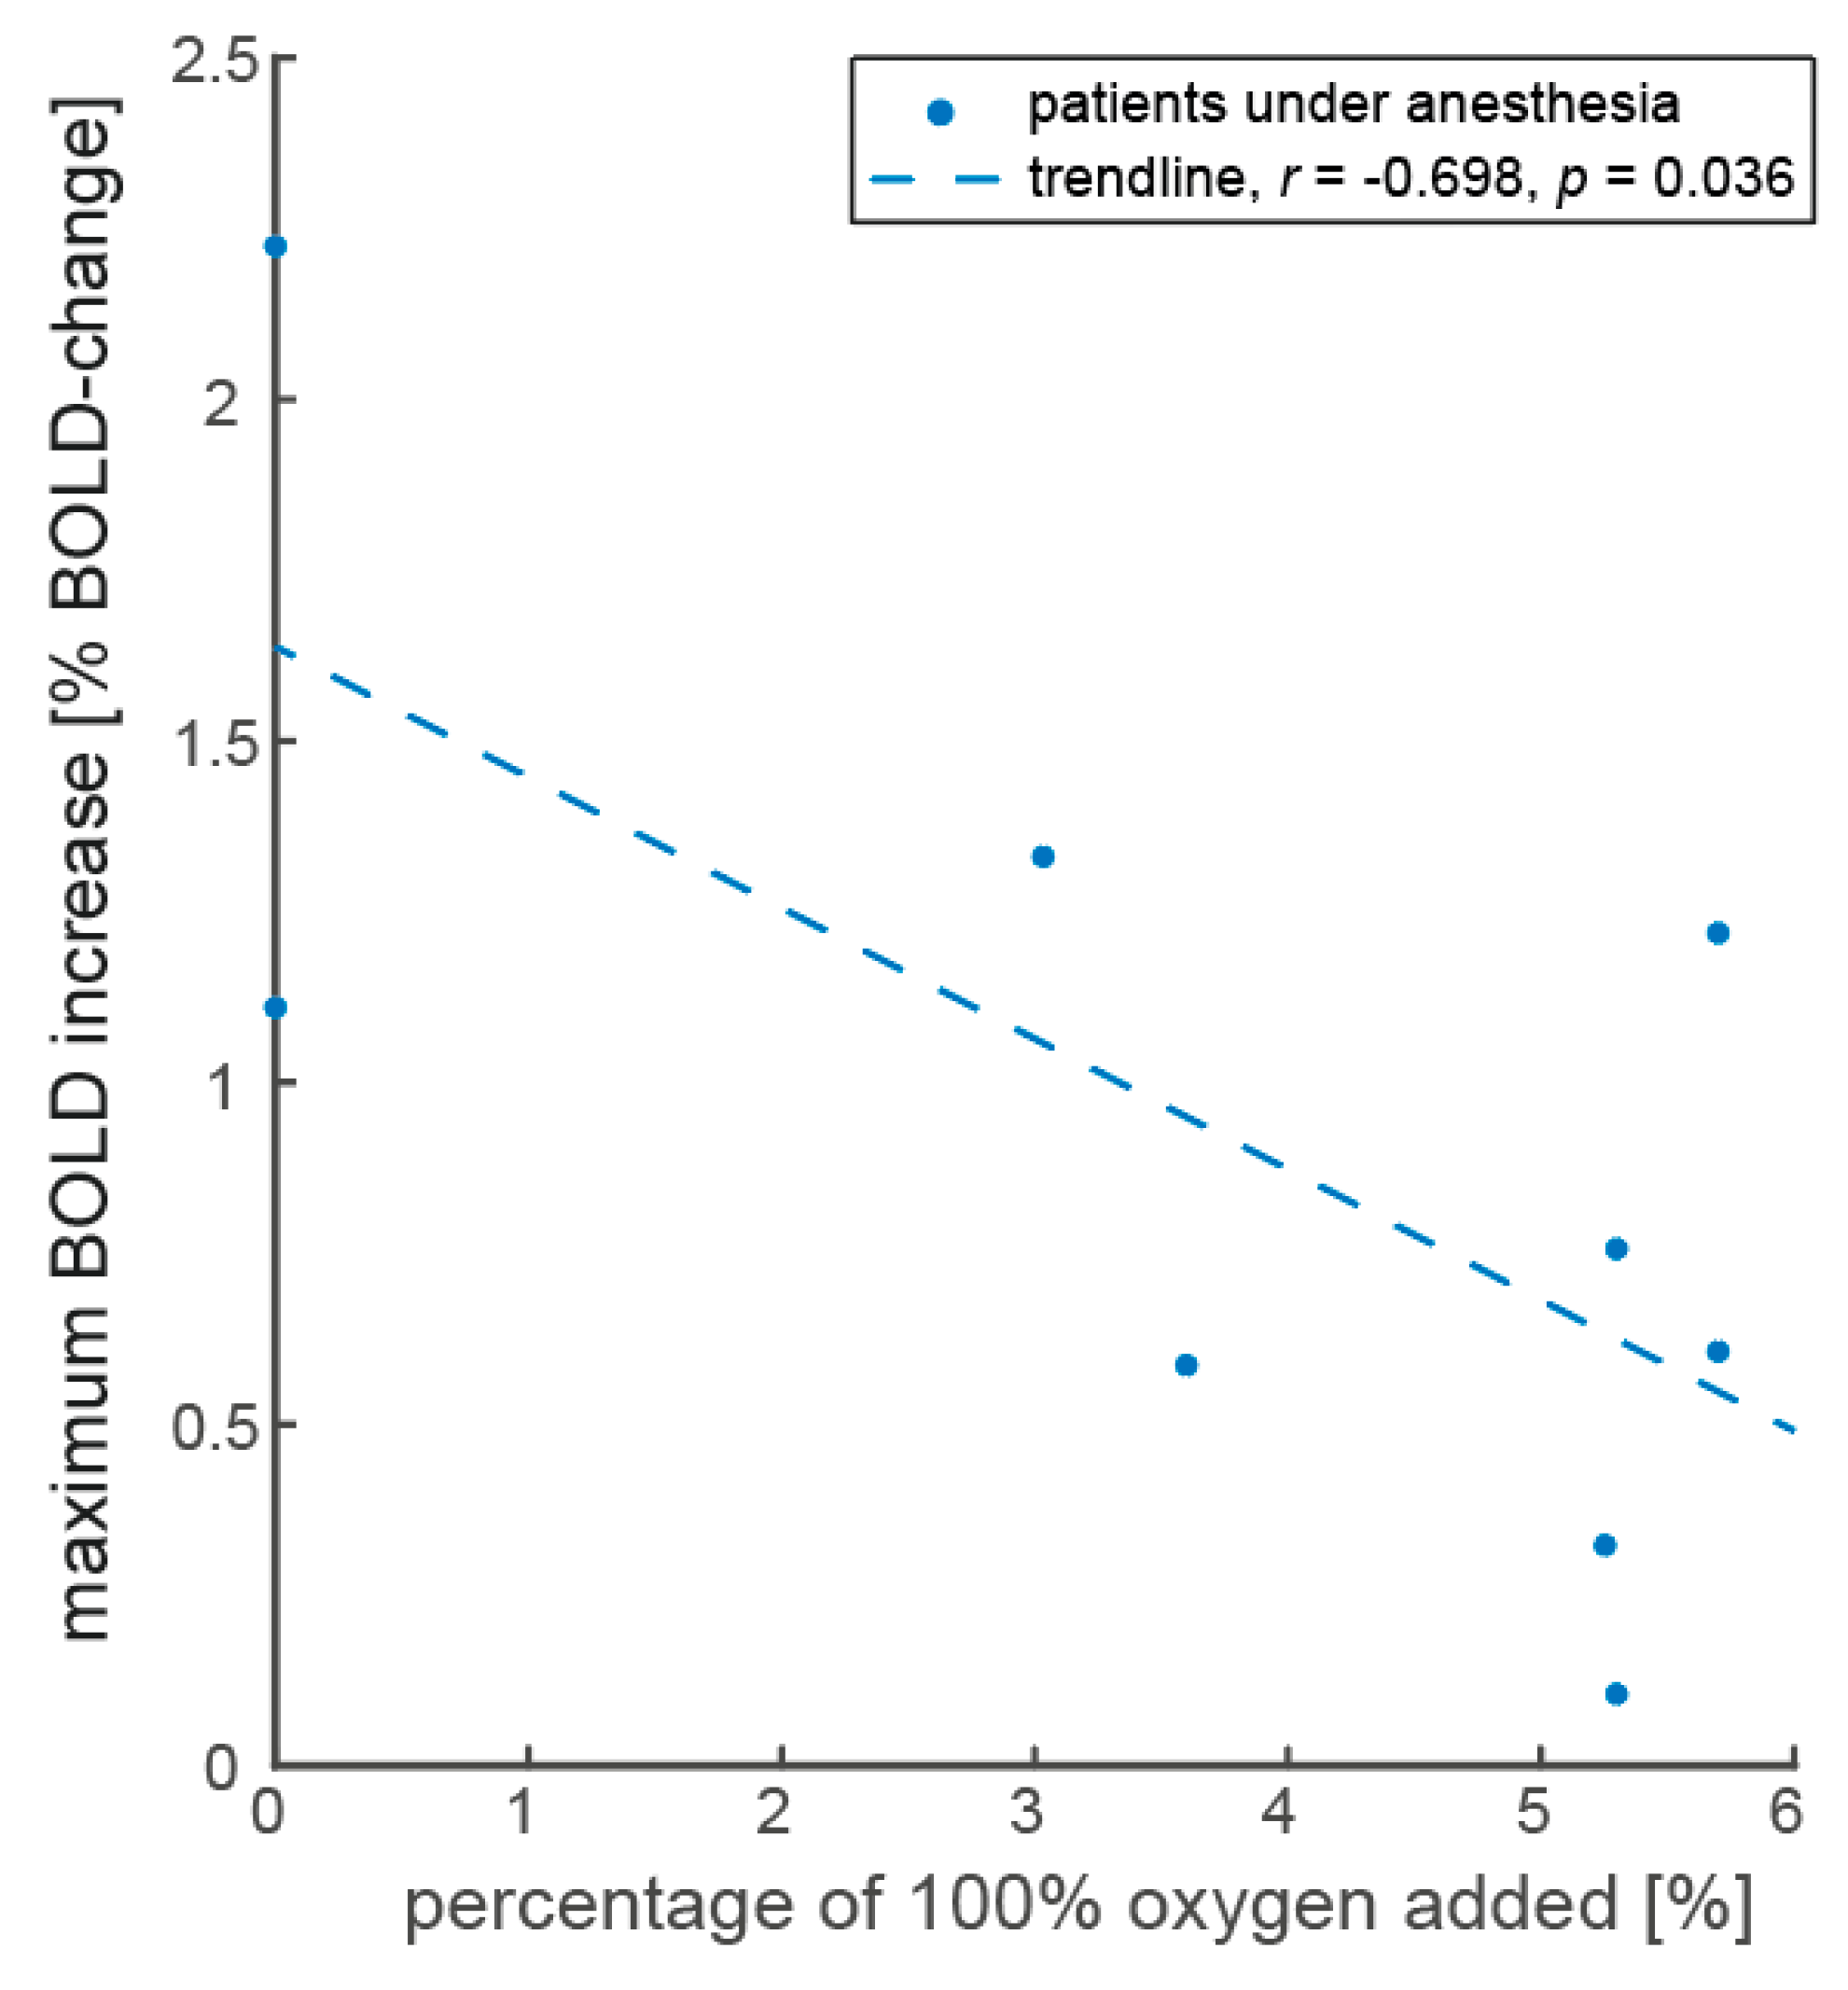
3.4. Vital Parameters of Anesthesia Patients
4. Discussion
4.1. Differences in Baseline Conditions between Anesthetized and Awake Patients
4.2. Differences in Response to ACZ
Limitations
5. Conclusions
Author Contributions
Funding
Institutional Review Board Statement
Informed Consent Statement
Data Availability Statement
Conflicts of Interest
Appendix A
Appendix B

Appendix C
Appendix D
Appendix E
Appendix E.1. Differences in Baseline CBF between Anesthetized and Awake Condition
Appendix E.2. Differences in Response to ACZ and Autoregulation
References
- Yonas, H.; Smith, H.A.; Durham, S.R.; Pentheny, S.L.; Johnson, D.W. Increased Stroke Risk Predicted by Compromised Cerebral Blood Flow Reactivity. J. Neurosurg. 1993, 79, 483–489. [Google Scholar] [CrossRef] [PubMed]
- Silvestrini, M.; Pasqualetti, P.; Baruffaldi, R.; Bartolini, M.; Handouk, Y.; Matteis, M.; Moffa, F.; Provinciali, L.; Vernieri, F. Cerebrovascular Reactivity and Cognitive Decline in Patients with Alzheimer Disease. Stroke 2006, 37, 1010–1015. [Google Scholar] [CrossRef] [PubMed] [Green Version]
- Bacigaluppi, S.; Dehdashti, A.R.; Agid, R.; Krings, T.; Tymianski, M.; Mikulis, D.J. The Contribution of Imaging in Diagnosis, Preoperative Assessment, and Follow-up of Moyamoya Disease. Neurosurg. Focus 2009, 26, E3. [Google Scholar] [CrossRef] [PubMed] [Green Version]
- Fierstra, J.; van Niftrik, C.; Warnock, G.; Wegener, S.; Piccirelli, M.; Pangalu, A.; Esposito, G.; Valavanis, A.; Buck, A.; Luft, A.; et al. Staging Hemodynamic Failure with Blood Oxygen-Level-Dependent Functional Magnetic Resonance Imaging Cerebrovascular Reactivity: A Comparison Versus Gold Standard ((15)O-)H2O-Positron Emission Tomography. Stroke 2018, 49, 621–629. [Google Scholar] [CrossRef]
- Fan, A.P.; Guo, J.; Khalighi, M.M.; Gulaka, P.K.; Shen, B.; Park, J.H.; Gandhi, H.; Holley, D.; Rutledge, O.; Singh, P.; et al. Long-Delay Arterial Spin Labeling Provides More Accurate Cerebral Blood Flow Measurements in Moyamoya Patients: A Simultaneous Positron Emission Tomography/MRI Study. Stroke 2017, 48, 2441–2449. [Google Scholar] [CrossRef]
- Hauser, T.-K.; Seeger, A.; Bender, B.; Klose, U.; Thurow, J.; Ernemann, U.; Tatagiba, M.; Meyer, P.T.; Khan, N.; Roder, C. Hypercapnic BOLD MRI Compared to H215O PET/CT for the Hemodynamic Evaluation of Patients with Moyamoya Disease. Neuroimage 2019, 22, 101713. [Google Scholar] [CrossRef]
- Fan, A.P.; Khalighi, M.M.; Guo, J.; Ishii, Y.; Rosenberg, J.; Wardak, M.; Park, J.H.; Shen, B.; Holley, D.; Gandhi, H.; et al. Identifying Hypoperfusion in Moyamoya Disease with Arterial Spin Labeling and an [(15)O]-Water Positron Emission Tomography/Magnetic Resonance Imaging Normative Database. Stroke 2019, 50, 373–380. [Google Scholar] [CrossRef] [Green Version]
- Ringelstein, E.B.; Van Eyck, S.; Mertens, I. Evaluation of Cerebral Vasomotor Reactivity by Various Vasodilating Stimuli: Comparison of CO2 to Acetazolamide. J. Cereb. Blood Flow Metab. 1992, 12, 162–168. [Google Scholar] [CrossRef] [Green Version]
- Fierstra, J.; Sobczyk, O.; Battisti-Charbonney, A.; Mandell, D.M.; Poublanc, J.; Crawley, A.P.; Mikulis, D.J.; Duffin, J.; Fisher, J.A. Measuring Cerebrovascular Reactivity: What Stimulus to Use? J. Physiol. 2013, 591, 5809–5821. [Google Scholar] [CrossRef] [Green Version]
- Kronenburg, A.; Braun, K.P.J.; Van Der Zwan, A.; Klijn, C.J.M. Recent Advances in Moyamoya Disease: Pathophysiology and Treatment. Curr. Neurol. Neurosci. Rep. 2014, 14, 423. [Google Scholar] [CrossRef]
- Gupta, A.; Chazen, J.L.; Hartman, M.; Delgado, D.; Anumula, N.; Shao, H.; Mazumdar, M.; Segal, A.Z.; Kamel, H.; Leifer, D.; et al. Cerebrovascular Reserve and Stroke Risk in Patients with Carotid Stenosis or Occlusion: A Systematic Review and Meta-Analysis. Stroke 2012, 43, 2884–2891. [Google Scholar] [CrossRef] [PubMed]
- Deckers, P.T.; Bhogal, A.A.; Dijsselhof, M.B.; Faraco, C.C.; Liu, P.; Lu, H.; Donahue, M.J.; Siero, J.C. Hemodynamic and Metabolic Changes during Hypercapnia with Normoxia and Hyperoxia Using PCASL and TRUST MRI in Healthy Adults. J. Cereb. Blood Flow Metab. 2021, 42, 861–875. [Google Scholar] [CrossRef] [PubMed]
- Hoge, R.D.; Atkinson, J.; Gill, B.; Crelier, G.R.; Marrett, S.; Pike, G.B. Investigation of BOLD Signal Dependence on CBF and CMRO2: The Deoxyhemoglobin Dilution Model. Neuroimage 1999, 9, 849–863. [Google Scholar]
- Merola, A.; Murphy, K.; Stone, A.J.; Germuska, M.A.; Griffeth, V.E.M.; Blockley, N.P.; Buxton, R.B.; Wise, R.G. Measurement of Oxygen Extraction Fraction (OEF): An Optimized BOLD Signal Model for Use with Hypercapnic and Hyperoxic Calibration. Neuroimage 2016, 129, 159–174. [Google Scholar] [CrossRef] [Green Version]
- Hyder, F.; Kida, I.; Behar, K.L.; Kennan, R.P.; Maciejewski, P.K.; Rothman, D.L. Quantitative Functional Imaging of the Brain: Towards Mapping Neuronal Activity by BOLD FMRI. NMR Biomed. 2001, 14, 413–431. [Google Scholar] [CrossRef]
- Hillman, E.M.C. Coupling Mechanism and Significance of the BOLD Signal: A Status Report. Annu. Rev. Neurosci. 2014, 37, 161–181. [Google Scholar] [CrossRef] [Green Version]
- Xu, M.; Bo, B.; Pei, M.; Chen, Y.; Shu, C.Y.; Qin, Q.; Hirschler, L.; Warnking, J.M.; Barbier, E.L.; Wei, Z.; et al. High-Resolution Relaxometry-Based Calibrated FMRI in Murine Brain: Metabolic Differences between Awake and Anesthetized States. J. Cereb. Blood Flow Metab. 2021, 42, 811–825. [Google Scholar] [CrossRef]
- Fahlström, M.; Wikström, J.; Borota, L.; Enblad, P.; Lewén, A. Variable Temporal Cerebral Blood Flow Response to Acetazolamide in Moyamoya Patients Measured Using Arterial Spin Labeling. Front. Neurol. 2021, 12, 615017. [Google Scholar] [CrossRef]
- Inoue, Y.; Tanaka, Y.; Hata, H.; Hara, T. Arterial Spin-Labeling Evaluation of Cerebrovascular Reactivity to Acetazolamide in Healthy Subjects. Am. J. Neuroradiol. 2014, 35, 1111–1116. [Google Scholar] [CrossRef] [Green Version]
- Siero, J.C.W.; Hartkamp, N.S.; Donahue, M.J.; Harteveld, A.A.; Compter, A.; Petersen, E.T.; Hendrikse, J. Neuronal Activation Induced BOLD and CBF Responses upon Acetazolamide Administration in Patients with Steno-Occlusive Artery Disease. NeuroImage Clin. 2015, 105, 276–285. [Google Scholar] [CrossRef] [PubMed] [Green Version]
- Kronenburg, A.; van den Berg, E.; van Schooneveld, M.M.; Braun, K.P.J.; Calviere, L.; van der Zwan, A.; Klijn, C.J.M. Cognitive Functions in Children and Adults with Moyamoya Vasculopathy: A Systematic Review and Meta-Analysis. J. Stroke 2018, 20, 332–341. [Google Scholar] [CrossRef] [PubMed] [Green Version]
- Scott, R.M.; Smith, E.R. Moyamoya Disease and Moyamoya Syndrome. N. Engl. J. Med. 2009, 360, 1226–1237. [Google Scholar] [CrossRef] [PubMed] [Green Version]
- Arlachov, Y.; Ganatra, R.H. Sedation/Anaesthesia in Paediatric Radiology. Br. J. Radiol. 2012, 85, 1435-e1165. [Google Scholar] [CrossRef] [PubMed] [Green Version]
- Venkatraghavan, L.; Poublanc, J.; Bharadwaj, S.; Sobczyk, O.; Crawley, A.P.; Mandell, D.M.; Mikulis, D.J.; Fisher, J.A. Noninvasive Measurement of Cerebral Blood Flow under Anesthesia Using Arterial Spin Labeling MRI: A Pilot Study. J. Neurosurg. Anesthesiol. 2016, 28, 331–336. [Google Scholar] [CrossRef]
- Kuhn, F.P.; Warnock, G.; Schweingruber, T.; Sommerauer, M.; Buck, A.; Khan, N. Quantitative H2[15O]-PET in Pediatric Moyamoya Disease: Evaluating Perfusion before and after Cerebral Revascularization. J. Stroke Cerebrovasc. Dis. 2015, 24, 965–971. [Google Scholar] [CrossRef]
- So, Y.; Lee, H.Y.; Kim, S.K.; Lee, J.S.; Wang, K.C.; Cho, B.K.; Kang, E.; Lee, D.S. Prediction of the Clinical Outcome of Pediatric Moyamoya Disease with Postoperative Basal/Acetazolamide Stress Brain Perfusion SPECT after Revascularization Surgery. Stroke 2005, 36, 1485–1489. [Google Scholar] [CrossRef] [Green Version]
- Kashyap, R.; Mittal, B.R.; Sunil, H.V.; Bhattacharya, A.; Singh, B.; Mukherjee, K.K.; Gupta, S.K. Tc99m-ECD Brain SPECT in Patients with Moyamoya Disease: A Reflection of Cerebral Perfusion Status at Tissue Level in the Disease Process. Indian J. Nucl. Med. 2011, 26, 82–85. [Google Scholar] [CrossRef] [Green Version]
- Yu, J.; Shi, L.; Guo, Y.; Xu, B.; Xu, K. Progress on Complications of Direct Bypass for Moyamoya Disease. Int. J. Med. Sci. 2016, 13, 578–587. [Google Scholar] [CrossRef] [Green Version]
- Fukui, M. Guidelines for the Diagnosis and Treatment of Spontaneous Occlusion of the Circle of Willis (“Moyamoya” Disease). Clin. Neurol. Neurosurg. 1997, 99, 238–240. [Google Scholar] [CrossRef]
- Dolui, S.; Wang, Z.; Shinohara, R.T.; Wolk, D.A.; Detre, J.A. Structural Correlation-Based Outlier Rejection (SCORE) Algorithm for Arterial Spin Labeling Time Series. J. Magn. Reson. Imaging 2017, 45, 1786–1797. [Google Scholar] [CrossRef]
- Jenkinson, M.; Bannister, P.; Brady, M.; Smith, S. Improved Optimization for the Robust and Accurate Linear Registration and Motion Correction of Brain Images. Neuroimage 2002, 17, 825–841. [Google Scholar] [CrossRef] [PubMed]
- Jenkinson, M.; Beckmann, C.F.; Behrens, T.E.J.; Woolrich, M.W.; Smith, S.M. FSL. Neuroimage 2012, 62, 782–790. [Google Scholar] [CrossRef] [PubMed] [Green Version]
- Bhogal, A.A. Abhogal-Lab/SeeVR: V1.01 (v1.01). Zenodo. 2021. Available online: https://zenodo.org/record/5283595/export/hx (accessed on 9 January 2023).
- Collins, D.L.; Holmes, C.J.; Peters, T.M.; Evans, A.C. Automatic 3-D Model-Based Neuroanatomical Segmentation. Hum. Brain Mapp. 1995, 3, 190–208. [Google Scholar] [CrossRef]
- Mazziotta, J.; Toga, A.; Evans, A.; Fox, P.; Lancaster, J.; Zilles, K.; Woods, R.; Paus, T.; Simpson, G.; Pike, B.; et al. A Probabilistic Atlas and Reference System for the Human Brain: International Consortium for Brain Mapping (ICBM). Philos. Trans. R Soc. B Biol. Sci. 2001, 356, 1293–1322. [Google Scholar] [CrossRef]
- Venkatraghavan, L.; Poublanc, J.; Han, J.S.; Sobczyk, O.; Rozen, C.; Sam, K.; Duffin, J.; Mikulis, D.J.; Fisher, J.A. Measurement of Cerebrovascular Reactivity as Blood Oxygen Level-Dependent Magnetic Resonance Imaging Signal Response to a Hypercapnic Stimulus in Mechanically Ventilated Patients. J. Stroke Cerebrovasc. Dis. 2018, 27, 301–308. [Google Scholar] [CrossRef]
- Thomas, B.; Logan, W.; Donner, E.J.; Shroff, M. Assessment of Cerebrovascular Reactivity Using Real-Time BOLD FMRI in Children with Moyamoya Disease: A Pilot Study. Child’s Nerv. Syst. 2013, 29, 457–463. [Google Scholar] [CrossRef]
- Mariappan, R.; Mehta, J.; Chui, J.; Manninen, P.; Venkatraghavan, L. Cerebrovascular Reactivity to Carbon Dioxide under Anesthesia: A Qualitative Systematic Review. J. Neurosurg. Anesthesiol. 2015, 27, 123–135. [Google Scholar] [CrossRef]
- Davis, T.L.; Kwong, K.K.; Weisskoff, R.M.; Rosen, B.R. Calibrated Functional MRI: Mapping the Dynamics of Oxidative Metabolism. Proc. Natl. Acad. Sci. USA 1998, 95, 1834–1839. [Google Scholar] [CrossRef] [Green Version]
- Deckers, P.T.; van Hoek, W.; Kronenburg, A.; Yaqub, M.; Siero, J.C.W.; Bhogal, A.A.; van Berckel, B.N.M.; van der Zwan, A.; Braun, K.P.J. Contralateral Improvement of Cerebrovascular Reactivity and TIA Frequency after Unilateral Revascularization Surgery in Moyamoya Vasculopathy. NeuroImage Clin. 2021, 30, 102684. [Google Scholar] [CrossRef]
- Halani, S.; Kwinta, J.B.; Golestani, A.M.; Khatamian, Y.B.; Chen, J.J. Comparing Cerebrovascular Reactivity Measured Using BOLD and Cerebral Blood Flow MRI: The Effect of Basal Vascular Tension on Vasodilatory and Vasoconstrictive Reactivity. Neuroimage 2015, 110, 110–123. [Google Scholar] [CrossRef] [Green Version]
- Gauthier, C.J.; Madjar, C.; Tancredi, F.B.; Stefanovic, B.; Hoge, R.D. Elimination of Visually Evoked BOLD Responses during Carbogen Inhalation: Implications for Calibrated MRI. Neuroimage 2011, 54, 1001–1011. [Google Scholar] [CrossRef] [PubMed] [Green Version]
- Masamoto, K.; Kanno, I. Anesthesia and the Quantitative Evaluation of Neurovascular Coupling. J. Cereb. Blood Flow Metab. 2012, 32, 1233–1247. [Google Scholar] [CrossRef] [PubMed] [Green Version]
- Okazawa, H.; Yamauchi, H.; Sugimoto, K.; Toyoda, H.; Kishibe, Y.; Takahashi, M. Effects of Acetazolamide on Cerebral Blood Flow, Blood Volume, and Oxygen Metabolism: A Positron Emission Tomography Study with Healthy Volunteers. J. Cereb. Blood Flow Metab. 2001, 21, 1472–1479. [Google Scholar] [CrossRef] [Green Version]
- Vandesteene, A.; Trempont, V.; Engelman, E.; Deloof, T.; Focroul, M.; Schoutens, A.; de Rood, M. Effect of Propofol on Cerebral Blood Flow and Metabolism in Man. Anaesthesia 1988, 43, 42–43. [Google Scholar] [CrossRef]
- Schlünzen, L.; Juul, N.; Hansen, K.V.; Cold, G.E. Regional Cerebral Blood Flow and Glucose Metabolism during Propofol Anaesthesia in Healthy Subjects Studied with Positron Emission Tomography. Acta Anaesthesiol. Scand. 2012, 56, 248–255. [Google Scholar] [CrossRef]
- Szabó, E.Z.; Luginbuehl, I.; Bissonnette, B. Impact of Anesthetic Agents on Cerebrovascular Physiology in Children. Paediatr. Anaesth. 2009, 19, 108–118. [Google Scholar] [CrossRef]
- Slupe, A.M.; Kirsch, J.R. Effects of Anesthesia on Cerebral Blood Flow, Metabolism, and Neuroprotection. J. Cereb. Blood Flow Metab. 2018, 38, 2192–2208. [Google Scholar] [CrossRef]
- Nakamura, K.; Hatano, Y.; Hirakata, H.; Nishiwada, M.; Toda, H.; Mori, K. Direct Vasoconstrictor and Vasodilator Effects of Propofol in Isolated Dog Arteries. Br. J. Anaesth. 1992, 68, 193–197. [Google Scholar] [CrossRef]
- Park, W.K.; Lynch, C., 3rd; Johns, R.A. Effects of Propofol and Thiopental in Isolated Rat Aorta and Pulmonary Artery. Anesthesiology 1992, 77, 956–963. [Google Scholar] [CrossRef] [PubMed]
- Karsli, C.; Luginbuehl, I.; Bissonnette, B. Propofol Decreases Cerebral Blood Flow Velocity in Anesthetized Children. Can. J. Anesth. 2002, 49, 830–834. [Google Scholar] [CrossRef] [PubMed] [Green Version]
- Settakis, G.; Molnár, C.; Kerényi, L.; Kollár, J.; Legemate, D.; Csiba, L.; Fülesdi, B. Acetazolamide as a Vasodilatory Stimulus in Cerebrovascular Diseases and in Conditions Affecting the Cerebral Vasculature. Eur. J. Neurol. 2003, 10, 609–620. [Google Scholar] [CrossRef] [PubMed]
- Severinghaus, J.W.; Cotev, S. Carbonic Acidosis and Cerebral Vasodilation after Diamox. Scand. J. Clin. Lab. Investig. 1968, 21, 8–10. [Google Scholar] [CrossRef] [PubMed]
- Teppema, L.J.; Dahan, A. Acetazolamide and Breathing: Does a Clinical Dose Alter Peripheral and Central CO2 Sensitivity? Am. J. Respir. Crit. Care Med. 1999, 160, 1592–1597. [Google Scholar] [CrossRef] [PubMed]
- Lee, T.S. End-Tidal Partial Pressure of Carbon Dioxide Does Not Accurately Reflect PAco2 in Rabbits Treated with Acetazolamide during Anaesthesia. Br. J. Anaesth. 1994, 73, 225–226. [Google Scholar] [CrossRef] [PubMed]
- Torring, M.S.; Holmgaard, K.; Hessellund, A.; Aalkjaer, C.; Bek, T. The Vasodilating Effect of Acetazolamide and Dorzolamide Involves Mechanisms Other than Carbonic Anhydrase Inhibition. Investig. Ophthalmol. Vis. Sci. 2009, 50, 345–351. [Google Scholar] [CrossRef]
- Wu, J.; Dehkharghani, S.; Nahab, F.; Qiu, D. Acetazolamide-Augmented Dynamic BOLD (AczBOLD) Imaging for Assessing Cerebrovascular Reactivity in Chronic Steno-Occlusive Disease of the Anterior Circulation: An Initial Experience. NeuroImage Clin. 2017, 13, 116–122. [Google Scholar] [CrossRef]
- Wagenaar, M.; Teppema, L.; Berkenbosch, A.; Olievier, C.; Folgering, H. Effect of Low-Dose Acetazolamide on the Ventilatory CO2 Response during Hypoxia in the Anaesthetized Cat. Eur. Respir. J. 1998, 12, 1271–1277. [Google Scholar] [CrossRef] [Green Version]
- Vorstrup, S.; Henriksen, L.; Paulson, O.B. Effect of Acetazolamide on Cerebral Blood Flow and Cerebral Metabolic Rate for Oxygen. J. Clin. Investig. 1984, 74, 1634–1639. [Google Scholar] [CrossRef] [Green Version]


| Anesthesia (n = 9) | Awake (n = 10) | ||
|---|---|---|---|
| age (median, range) | 11.5 (5.9–16.4) | 13.4 (6.8–17.2) | |
| female | 7 (78%) | 6 (60%) | |
| MMV type | MMD | 4 (44%) | 8 (80%) |
| MMS | 5 (55%) | 2 (20%) | |
| side | bilateral | 7 (78%) | 6 (60%) |
| unilateral | 2 (22%) | 4 (40%) | |
| treatment | preoperative | 4 (44%) | 7 (70%) |
| unilateral operated | 1 (11%) | 1 (10%) | |
| bilaterally operated | 4 (44%) | 2 (20%) | |
Disclaimer/Publisher’s Note: The statements, opinions and data contained in all publications are solely those of the individual author(s) and contributor(s) and not of MDPI and/or the editor(s). MDPI and/or the editor(s) disclaim responsibility for any injury to people or property resulting from any ideas, methods, instructions or products referred to in the content. |
© 2023 by the authors. Licensee MDPI, Basel, Switzerland. This article is an open access article distributed under the terms and conditions of the Creative Commons Attribution (CC BY) license (https://creativecommons.org/licenses/by/4.0/).
Share and Cite
Deckers, P.T.; Siero, J.C.W.; Mensink, M.O.; Kronenburg, A.; Braun, K.P.J.; van der Zwan, A.; Bhogal, A.A. Anesthesia Depresses Cerebrovascular Reactivity to Acetazolamide in Pediatric Moyamoya Vasculopathy. J. Clin. Med. 2023, 12, 4393. https://doi.org/10.3390/jcm12134393
Deckers PT, Siero JCW, Mensink MO, Kronenburg A, Braun KPJ, van der Zwan A, Bhogal AA. Anesthesia Depresses Cerebrovascular Reactivity to Acetazolamide in Pediatric Moyamoya Vasculopathy. Journal of Clinical Medicine. 2023; 12(13):4393. https://doi.org/10.3390/jcm12134393
Chicago/Turabian StyleDeckers, Pieter T., Jeroen C. W. Siero, Maarten O. Mensink, Annick Kronenburg, Kees P. J. Braun, Albert van der Zwan, and Alex A. Bhogal. 2023. "Anesthesia Depresses Cerebrovascular Reactivity to Acetazolamide in Pediatric Moyamoya Vasculopathy" Journal of Clinical Medicine 12, no. 13: 4393. https://doi.org/10.3390/jcm12134393