
Predicting Intraoperative Hypothermia Burden during Non-Cardiac Surgery: A Retrospective Study Comparing Regression to Six Machine Learning Algorithms

 , , and
Abstract
:1. Introduction
2. Materials and Methods
2.1. Data Collection
2.2. Outcome Variables
2.3. Predictor Variables
2.4. Imputation of Missing Values and Feature Scaling
2.5. Prediction Models and Machine Learning Algorithms
- XGBoost, a gradient tree-boosting algorithm comprising a multitude of decision trees.
- RF, another decision-tree-based ensemble learning technique where a combined prediction of a forest of multiple random decision trees is used to obtain a more accurate and stable prediction. The key difference to XGBoost is that an RF algorithm is trained using the “bagging” technique as opposed to gradient boosting.
- LDA, which discriminates between classes by learning the joint probability distribution of the input and target variables.
- GNB, a modification of LDA where the covariance matrix is a diagonal matrix, thus drastically simplifying the computation.
- k-nearest neighbor (KNN), a non-parametric algorithm that classifies a new data point based on the similarity to the training set.
- Multi-layer perceptron (MLP) neural network, with a standard feed-forward architecture with hidden layers consisting of neurons.
2.6. Model Tuning, Selection, and Evaluation
2.7. Software
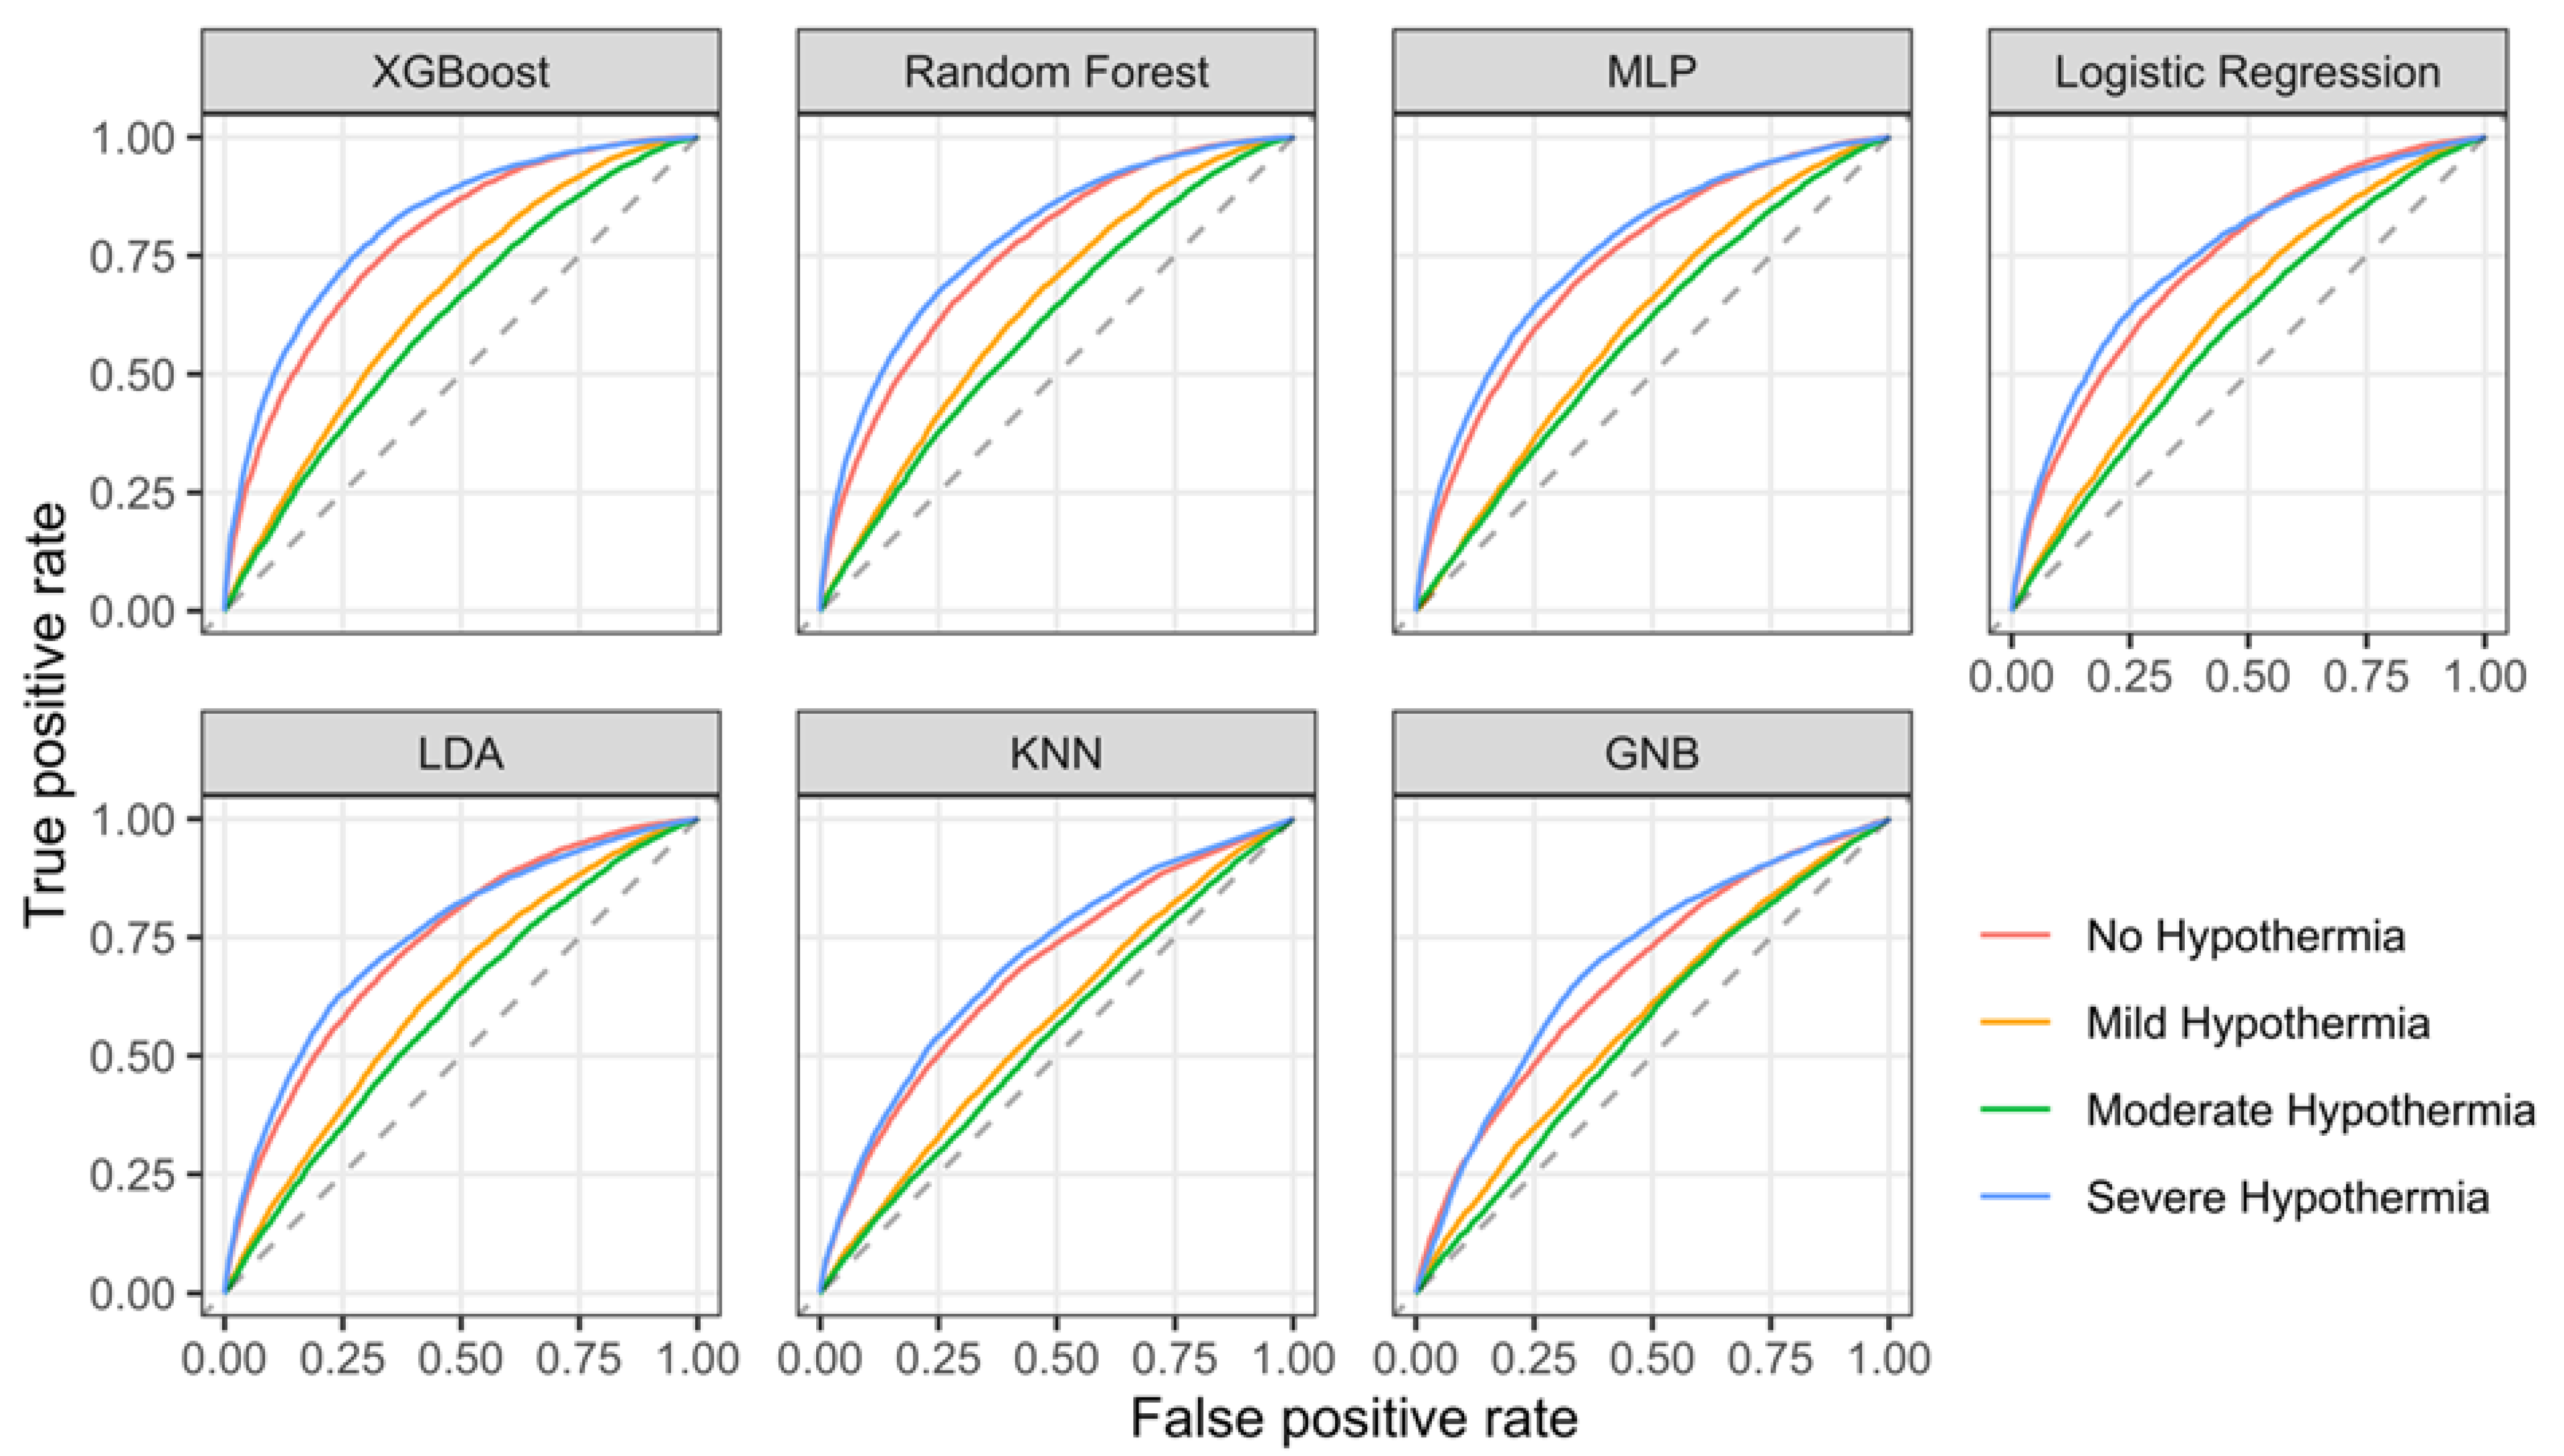
3. Results
4. Discussion
Limitations
Supplementary Materials
Author Contributions
Funding
Institutional Review Board Statement
Informed Consent Statement
Data Availability Statement
Conflicts of Interest
References
- Forbes, S.S.; Eskicioglu, C.; Nathens, A.B.; Fenech, D.S.; Laflamme, C.; McLean, R.F.; McLeod, R.S. Evidence-Based Guidelines for Prevention of Perioperative Hypothermia. J. Am. Coll. Surg. 2009, 209, 492–503.e1. [Google Scholar] [CrossRef]
- Sessler, D.I. Perioperative Thermoregulation and Heat Balance. Lancet 2016, 387, 2655–2664. [Google Scholar] [CrossRef]
- Xu, H.; Wang, Z.; Guan, X.; Lu, Y.; Malone, D.C.; Salmon, J.W.; Ma, A.; Tang, W. Safety of Intraoperative Hypothermia for Patients: Meta-Analyses of Randomized Controlled Trials and Observational Studies. BMC Anesth. 2020, 20, 202. [Google Scholar] [CrossRef]
- Ralph, N.; Gow, J.; Conway, A.; Duff, J.; Edward, K.-L.; Alexander, K.; Bräuer, A. Costs of Inadvertent Perioperative Hypothermia in Australia: A Cost-of-Illness Study. Collegian 2020, 27, 345–351. [Google Scholar] [CrossRef]
- Allegranzi, B.; Zayed, B.; Bischoff, P.; Kubilay, N.Z.; de Jonge, S.; de Vries, F.; Gomes, S.M.; Gans, S.; Wallert, E.D.; Wu, X.; et al. New WHO Recommendations on Intraoperative and Postoperative Measures for Surgical Site Infection Prevention: An Evidence-Based Global Perspective. Lancet Infect. Dis. 2016, 16, e288–e303. [Google Scholar] [CrossRef] [PubMed]
- Rajagopalan, S.; Mascha, E.; Na, J.; Sessler, D.I. The Effects of Mild Perioperative Hypothermia on Blood Loss and Transfusion Requirement. Anesthesiology 2008, 108, 71–77. [Google Scholar] [CrossRef] [PubMed] [Green Version]
- Andrzejowski, J.; Hoyle, J.; Eapen, G.; Turnbull, D. Effect of Prewarming on Post-Induction Core Temperature and the Incidence of Inadvertent Perioperative Hypothermia in Patients Undergoing General Anaesthesia. Br. J. Anaesth. 2008, 101, 627–631. [Google Scholar] [CrossRef] [PubMed] [Green Version]
- Warttig, S.; Alderson, P.; Campbell, G.; Smith, A.F. Interventions for Treating Inadvertent Postoperative Hypothermia. Cochrane Database Syst. Rev. 2014, CD009892. [Google Scholar] [CrossRef] [PubMed] [Green Version]
- Campbell, G.; Alderson, P.; Smith, A.F.; Warttig, S. Warming of Intravenous and Irrigation Fluids for Preventing Inadvertent Perioperative Hypothermia. Cochrane Database Syst. Rev. 2015, CD009891. [Google Scholar] [CrossRef] [PubMed]
- Balki, I.; Khan, J.S.; Staibano, P.; Duceppe, E.; Bessissow, A.; Sloan, E.N.; Morley, E.E.; Thompson, A.N.; Devereaux, B.; Rojas, C.; et al. Effect of Perioperative Active Body Surface Warming Systems on Analgesic and Clinical Outcomes: A Systematic Review and Meta-Analysis of Randomized Controlled Trials. Anesth. Analg. 2020, 131, 1430–1443. [Google Scholar] [CrossRef]
- National Institute for Health and Clinical Excellence. Hypothermia: Prevention and Management in Adults Having Surgery; National Institute for Health and Care Excellence: London, UK, 2016; 18p. [Google Scholar]
- Alfonsi, P.; Bekka, S.; Aegerter, P.; SFAR Research Network investigators. Prevalence of Hypothermia on Admission to Recovery Room Remains High despite a Large Use of Forced-Air Warming Devices: Findings of a Non-Randomized Observational Multicenter and Pragmatic Study on Perioperative Hypothermia Prevalence in France. PLoS ONE 2019, 14, e0226038. [Google Scholar] [CrossRef] [PubMed] [Green Version]
- Sessler, D.I.; Pei, L.; Li, K.; Cui, S.; Chan, M.T.V.; Huang, Y.; Wu, J.; He, X.; Bajracharya, G.R.; Rivas, E.; et al. Aggressive Intraoperative Warming versus Routine Thermal Management during Non-Cardiac Surgery (PROTECT): A Multicentre, Parallel Group, Superiority Trial. Lancet 2022, 399, 1799–1808. [Google Scholar] [CrossRef]
- Wallisch, C.; Zeiner, S.; Scholten, P.; Dibiasi, C.; Kimberger, O. Development and Internal Validation of an Algorithm to Predict Intraoperative Risk of Hypothermia Based on Preoperative Data. Sci. Rep. 2021, 11, 22296. [Google Scholar] [CrossRef] [PubMed]
- Yan, X.; Goldsmith, J.; Mohan, S.; Turnbull, Z.A.; Freundlich, R.E.; Billings, F.T.; Kiran, R.P.; Li, G.; Kim, M. Impact of Intraoperative Data on Risk Prediction for Mortality After Intra-Abdominal Surgery. Anesth. Analg. 2022, 134, 102–113. [Google Scholar] [CrossRef]
- Hill, B.L.; Brown, R.; Gabel, E.; Rakocz, N.; Lee, C.; Cannesson, M.; Baldi, P.; Olde Loohuis, L.; Johnson, R.; Jew, B.; et al. An Automated Machine Learning-Based Model Predicts Postoperative Mortality Using Readily-Extractable Preoperative Electronic Health Record Data. Br. J. Anaesth. 2019, 123, 877–886. [Google Scholar] [CrossRef] [PubMed]
- Kendale, S.; Kulkarni, P.; Rosenberg, A.D.; Wang, J. Supervised Machine-Learning Predictive Analytics for Prediction of Postinduction Hypotension. Anesthesiology 2018, 129, 675–688. [Google Scholar] [CrossRef] [PubMed]
- Goldstein, B.A.; Navar, A.M.; Carter, R.E. Moving beyond Regression Techniques in Cardiovascular Risk Prediction: Applying Machine Learning to Address Analytic Challenges. Eur. Heart J. 2017, 38, 1805–1814. [Google Scholar] [CrossRef] [Green Version]
- De Bruyne, S.; Speeckaert, M.M.; Van Biesen, W.; Delanghe, J.R. Recent Evolutions of Machine Learning Applications in Clinical Laboratory Medicine. Crit. Rev. Clin. Lab. Sci. 2020, 58, 131–152. [Google Scholar] [CrossRef]
- Alloghani, M.; Aljaaf, A.; Hussain, A.; Baker, T.; Mustafina, J.; Al-Jumeily, D.; Khalaf, M. Implementation of Machine Learning Algorithms to Create Diabetic Patient Re-Admission Profiles. BMC Med. Inf. Decis. Mak. 2019, 19, 253. [Google Scholar] [CrossRef] [Green Version]
- Sun, Z.; Honar, H.; Sessler, D.I.; Dalton, J.E.; Yang, D.; Panjasawatwong, K.; Deroee, A.F.; Salmasi, V.; Saager, L.; Kurz, A. Intraoperative Core Temperature Patterns, Transfusion Requirement, and Hospital Duration in Patients Warmed with Forced Air. Anesthesiology 2015, 122, 276–285. [Google Scholar] [CrossRef] [Green Version]
- Van Walraven, C.; Austin, P.C.; Jennings, A.; Quan, H.; Forster, A.J. A Modification of the Elixhauser Comorbidity Measures into a Point System for Hospital Death Using Administrative Data. Med. Care 2009, 47, 626–633. [Google Scholar] [CrossRef]
- Huang, Y.; Li, W.; Macheret, F.; Gabriel, R.A.; Ohno-Machado, L. A Tutorial on Calibration Measurements and Calibration Models for Clinical Prediction Models. J. Am. Med. Inf. Assoc. 2020, 27, 621–633. [Google Scholar] [CrossRef] [PubMed]
- R Core Team. R: A Language and Environment for Statistical Computing; R Foundation for Statistical Computing: Vienna, Austria, 2022. [Google Scholar]
- Chen, T.; Guestrin, C. XGBoost: A Scalable Tree Boosting System. In Proceedings of the 22nd ACM SIGKDD International Conference on Knowledge Discovery and Data Mining, San Francisco, CA, USA, 13 August 2016; ACM: New York, NY, USA, 2016; pp. 785–794. [Google Scholar]
- Pedregosa, F.; Varoquaux, G.; Gramfort, A.; Michel, V.; Thirion, B.; Grisel, O.; Blondel, M.; Prettenhofer, P.; Weiss, R.; Dubourg, V.; et al. Scikit-Learn: Machine Learning in Python. J. Mach. Learn. Res. 2011, 12, 2825–2830. [Google Scholar]
- Head, T.; Kumar, M.; Nahrstaedt, H.; Louppe, G.; Shcherbatyi, I. Scikit-Optimize/Scikit-Optimize 2020, v0. 8.1. Available online: https://scikit-optimize.github.io/stable/ (accessed on 14 May 2023).
- Harper, C.M.; Andrzejowski, J.C.; Alexander, R. NICE and Warm. Br. J. Anaesth. 2008, 101, 293–295. [Google Scholar] [CrossRef] [Green Version]
- Collins, S.; Budds, M.; Raines, C.; Hooper, V. Risk Factors for Perioperative Hypothermia: A Literature Review. J. Perianesthesia Nurs. 2019, 34, 338–346. [Google Scholar] [CrossRef] [PubMed]
- Hastie, T.; Tibshirani, R.; Friedman, J.H. The Elements of Statistical Learning: Data Mining, Inference, and Prediction, 2nd ed.; Springer Series in Statistics; Springer: New York, NY, USA, 2009; ISBN 978-0-387-84857-0. [Google Scholar]
- Christodoulou, E.; Ma, J.; Collins, G.S.; Steyerberg, E.W.; Verbakel, J.Y.; Van Calster, B. A Systematic Review Shows No Performance Benefit of Machine Learning over Logistic Regression for Clinical Prediction Models. J. Clin. Epidemiol. 2019, 110, 12–22. [Google Scholar] [CrossRef]
- Collins, G.S.; Reitsma, J.B.; Altman, D.G.; Moons, K.G.M.; TRIPOD Group. Transparent Reporting of a Multivariable Prediction Model for Individual Prognosis or Diagnosis (TRIPOD): The TRIPOD Statement. Circulation 2015, 131, 211–219. [Google Scholar] [CrossRef] [Green Version]
- Van Calster, B.; Nieboer, D.; Vergouwe, Y.; De Cock, B.; Pencina, M.J.; Steyerberg, E.W. A Calibration Hierarchy for Risk Models Was Defined: From Utopia to Empirical Data. J. Clin. Epidemiol. 2016, 74, 167–176. [Google Scholar] [CrossRef]


| No Hypothermia n = 19,484 | Mild Hypothermia n = 22,220 | Moderate Hypothermia n = 22,800 | Severe Hypothermia n = 22,612 | |
|---|---|---|---|---|
| Age (years) | 52 (37–66) | 53 (39–67) | 55 (41–68) | 58 (45–70) |
| Male sex | 9076 (47%) | 10,547 (47%) | 11,520 (51%) | 11,785 (52%) |
| Weight (kg) | 77 (65–90) | 75 (64–88) | 75 (65–87) | 74 (63–85) |
| Unknown | 2372 | 2484 | 2063 | 1342 |
| Height (cm) | 170 (164–178) | 170 (164–178) | 170 (164–178) | 170 (164–178) |
| Unknown | 9961 | 10,791 | 10,646 | 9838 |
| ASA score | ||||
| I | 4702 (24%) | 5885 (26%) | 5509 (24%) | 3947 (17%) |
| II | 7788 (40%) | 10,110 (45%) | 10,396 (46%) | 9688 (43%) |
| III | 5856 (30%) | 5528 (25%) | 6045 (27%) | 7709 (34%) |
| IV | 883 (4.5%) | 541 (2.4%) | 615 (2.7%) | 839 (3.7%) |
| V | 255 (1.3%) | 156 (0.7%) | 235 (1.0%) | 429 (1.9%) |
| Surgical urgency | ||||
| Elective | 11,285 (68%) | 14,689 (81%) | 15,296 (83%) | 14,962 (81%) |
| Urgent | 4071 (25%) | 2741 (15%) | 2439 (13%) | 2335 (13%) |
| Emergency | 1121 (6.8%) | 691 (3.8%) | 745 (4.0%) | 1076 (5.9%) |
| Unknown | 3007 | 4099 | 4320 | 4239 |
| van Walraven comorbidity score | 0.0 (0.0–4.0) | 0.0 (0.0–4.0) | 0.0 (0.0–4.0) | 0.0 (0.0–4.0) |
| Unknown | 296 | 377 | 380 | 399 |
| Surgical discipline | ||||
| Oral and maxillofacial surgery | 1002 (5.1%) | 1131 (5.1%) | 1303 (5.7%) | 997 (4.4%) |
| Plastic surgery | 903 (4.6%) | 937 (4.2%) | 1052 (4.6%) | 1172 (5.2%) |
| Head and neck surgery | 2320 (12%) | 1945 (8.8%) | 1465 (6.4%) | 661 (2.9%) |
| Dermatology | 136 (0.7%) | 269 (1.2%) | 239 (1.0%) | 100 (0.4%) |
| Orthopedic and/or trauma surgery | 2870 (15%) | 4503 (20%) | 5789 (25%) | 5697 (25%) |
| Ophthalmology | 1266 (6.5%) | 1667 (7.5%) | 941 (4.1%) | 230 (1.0%) |
| Urology | 1504 (7.7%) | 1747 (7.9%) | 1551 (6.8%) | 1610 (7.1%) |
| General surgery | 5822 (30%) | 5519 (25%) | 5220 (23%) | 5235 (23%) |
| Gynecology | 1888 (9.7%) | 2369 (11%) | 1915 (8.4%) | 1440 (6.4%) |
| Obstetrics | 72 (0.4%) | 61 (0.3%) | 39 (0.2%) | 33 (0.1%) |
| Vascular surgery | 613 (3.1%) | 512 (2.3%) | 706 (3.1%) | 1377 (6.1%) |
| Thoracic surgery | 409 (2.1%) | 595 (2.7%) | 942 (4.1%) | 1548 (6.8%) |
| Neurosurgery | 834 (4.3%) | 1143 (5.1%) | 1888 (8.3%) | 2930 (13%) |
| Ambient room temperature (°C) | 19.99 (19.02–20.95) | 19.98 (19.00–20.87) | 19.90 (18.99–20.44) | 19.18 (18.99–20.05) |
| Unknown | 3008 | 3560 | 4546 | 5793 |
| Operating room time (min) | 83 (61–121) | 98 (76–136) | 135 (106–182) | 222 (166–310) |
| Weighted F1 Score | AUROC | ||||
|---|---|---|---|---|---|
| No Hypothermia | Mild Hypothermia | Moderate Hypothermia | Severe Hypothermia | ||
| XGBoost | 0.44 (10.74%) | 0.781 (6.22%) | 0.655 (4.49%) | 0.617 (3.75%) | 0.812 (8.44%) |
| Random Forest | 0.418 (5.15%) | 0.756 (2.85%) | 0.641 (2.36%) | 0.604 (1.55%) | 0.784 (4.59%) |
| LDA | 0.406 (2.16%) | 0.735 (−0.05%) | 0.626 (−0.06%) | 0.592 (−0.39%) | 0.748 (−0.2%) |
| MLP | 0.4 (0.58%) | 0.738 (0.45%) | 0.607 (−3.11%) | 0.582 (−2.06%) | 0.761 (1.6%) |
| Logistic Regression | 0.397 (0.00%) | 0.735 (0%) | 0.627 (0%) | 0.594 (0%) | 0.749 (0%) |
| KNN | 0.362 (−8.97%) | 0.676 (−7.98%) | 0.568 (−9.38%) | 0.542 (−8.8%) | 0.699 (−6.7%) |
| GNB | 0.32 (−19.50%) | 0.673 (−8.48%) | 0.58 (−7.45%) | 0.558 (−6.19%) | 0.694 (−7.34%) |
| No Hypothermia | Mild Hypothermia | Moderate Hypothermia | Severe Hypothermia | |||||||||
|---|---|---|---|---|---|---|---|---|---|---|---|---|
| Mean | Intercept | Slope | Mean | Intercept | Slope | Mean | Intercept | Slope | Mean | Intercept | Slope | |
| XGBoost | 0.044 | 0.118 | 1.064 | −0.033 | −0.093 | 0.939 | −0.012 | −0.184 | 0.824 | 0.005 | 0.090 | 1.102 |
| Random Forest | 0.044 | 0.521 | 1.423 | −0.037 | 0.269 | 1.307 | −0.017 | 0.242 | 1.260 | 0.014 | 0.483 | 1.510 |
| MLP | 0.024 | −0.331 | 0.640 | −0.093 | −0.621 | 0.429 | 0.058 | −0.591 | 0.379 | 0.013 | −0.276 | 0.656 |
| LDA | 0.061 | −0.021 | 0.920 | −0.041 | −0.148 | 0.894 | −0.021 | −0.250 | 0.768 | 0.006 | −0.051 | 0.937 |
| Logistic Regression | −0.094 | −0.094 | 1.015 | 0.011 | 0.017 | 1.006 | 0.049 | −0.094 | 0.864 | 0.030 | 0.015 | 0.978 |
| KNN | 0.058 | −0.846 | 0.131 | −0.124 | −0.964 | 0.071 | −0.058 | −0.971 | 0.038 | 0.135 | −0.644 | 0.152 |
| GNB | −0.366 | −1.135 | 0.020 | −0.946 | −1.059 | 0.006 | 1.395 | −0.974 | 0.010 | 0.635 | −0.627 | 0.062 |
Disclaimer/Publisher’s Note: The statements, opinions and data contained in all publications are solely those of the individual author(s) and contributor(s) and not of MDPI and/or the editor(s). MDPI and/or the editor(s) disclaim responsibility for any injury to people or property resulting from any ideas, methods, instructions or products referred to in the content. |
© 2023 by the authors. Licensee MDPI, Basel, Switzerland. This article is an open access article distributed under the terms and conditions of the Creative Commons Attribution (CC BY) license (https://creativecommons.org/licenses/by/4.0/).
Share and Cite
Dibiasi, C.; Agibetov, A.; Kapral, L.; Zeiner, S.; Kimberger, O. Predicting Intraoperative Hypothermia Burden during Non-Cardiac Surgery: A Retrospective Study Comparing Regression to Six Machine Learning Algorithms. J. Clin. Med. 2023, 12, 4434. https://doi.org/10.3390/jcm12134434
Dibiasi C, Agibetov A, Kapral L, Zeiner S, Kimberger O. Predicting Intraoperative Hypothermia Burden during Non-Cardiac Surgery: A Retrospective Study Comparing Regression to Six Machine Learning Algorithms. Journal of Clinical Medicine. 2023; 12(13):4434. https://doi.org/10.3390/jcm12134434
Chicago/Turabian StyleDibiasi, Christoph, Asan Agibetov, Lorenz Kapral, Sebastian Zeiner, and Oliver Kimberger. 2023. "Predicting Intraoperative Hypothermia Burden during Non-Cardiac Surgery: A Retrospective Study Comparing Regression to Six Machine Learning Algorithms" Journal of Clinical Medicine 12, no. 13: 4434. https://doi.org/10.3390/jcm12134434