
Depression Earlier on in Life Predicts Frailty at 50 Years: Evidence from the 1958 British Birth Cohort Study


Abstract
:1. Introduction
- (a)
- Is depression measured at ages earlier in adulthood associated with frailty measured at age 50?;
- (b)
- Do these associations remain after adjusting for socio-demographic covariates measured at age 50, early life circumstances, and health risk behaviours?
2. Materials and Methods
2.1. National Child Development Study Data
2.2. Outcome Measure: Frailty at Age 50
2.3. Main Exposure: Depression at Ages 23, 33 and 42
2.4. Covariates
2.5. Data Analysis
3. Results
3.1. Descriptive Statistics
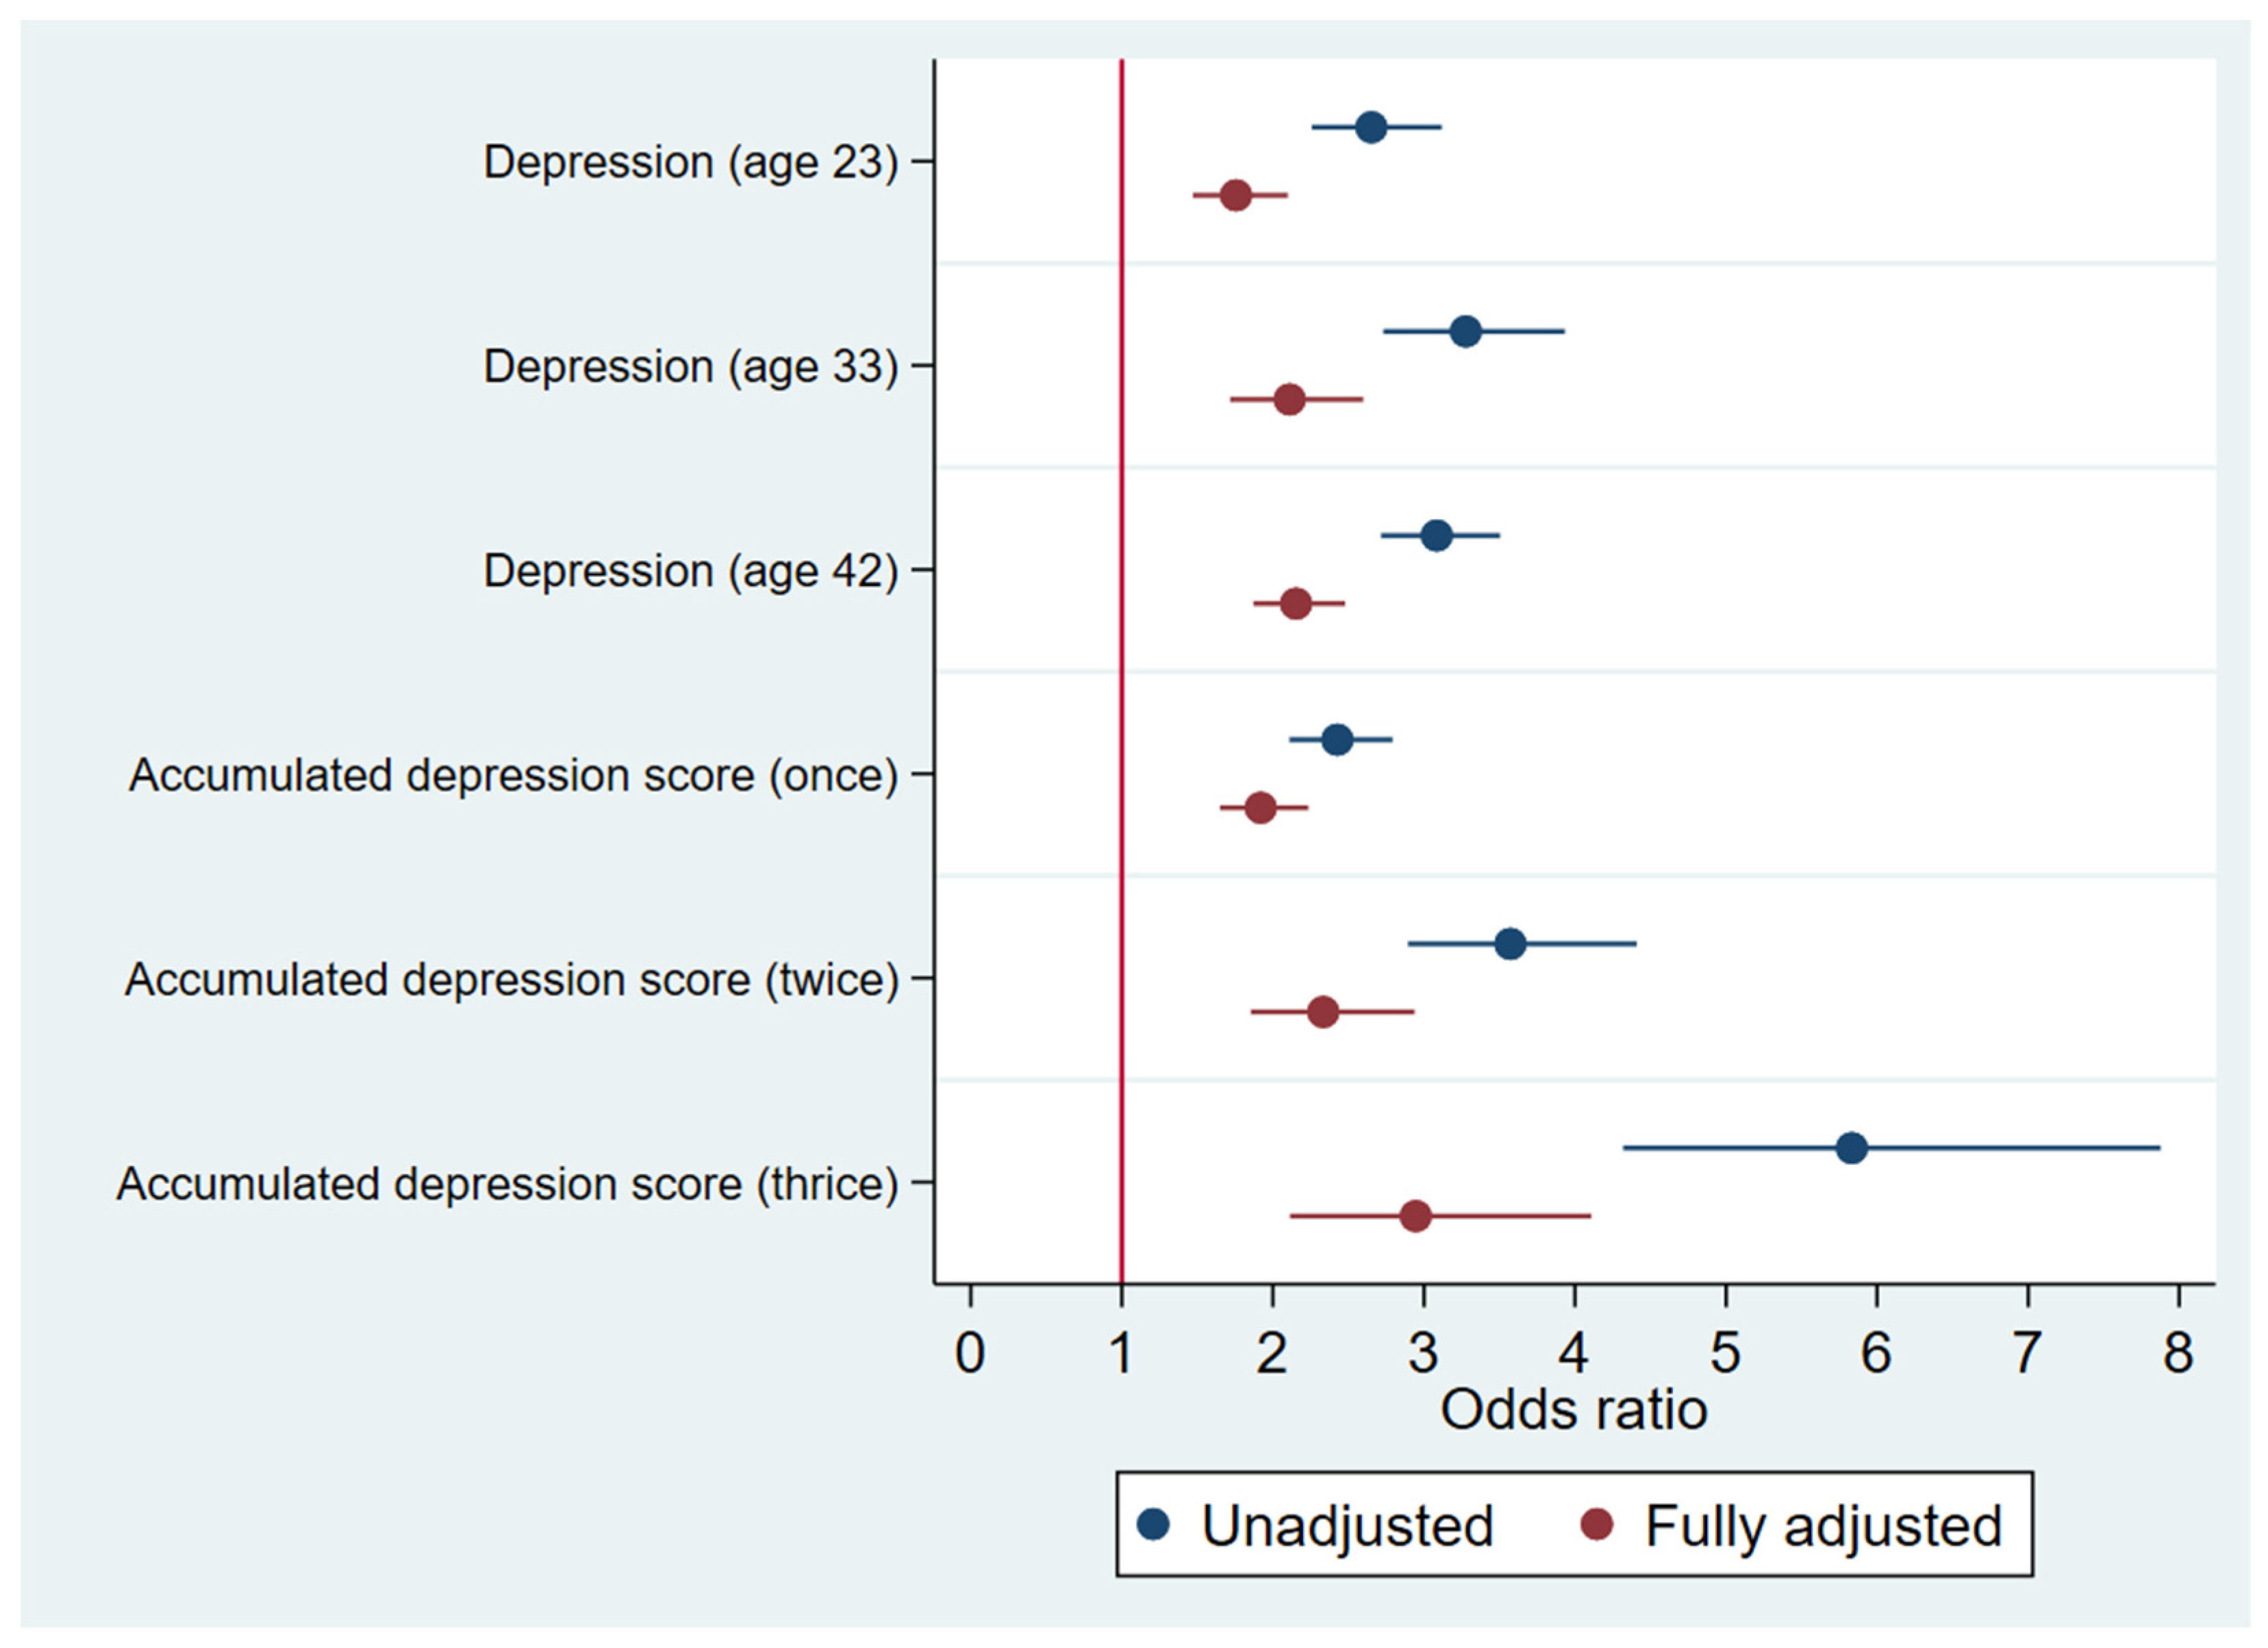
3.2. Associations between Depression in Adulthood and Frailty at Age 50
3.3. Covariates
4. Discussion
5. Conclusions
Supplementary Materials
Author Contributions
Funding
Institutional Review Board Statement
Informed Consent Statement
Data Availability Statement
Conflicts of Interest
References
- Xue, Q.-L. The Frailty Syndrome: Definition and Natural History. Clin. Geriatr. Med. 2011, 27, 1–15. [Google Scholar] [CrossRef] [PubMed]
- Monroe, S.M.; Harkness, K.L. Major Depression and Its Recurrences: Life Course Matters. Annu. Rev. Clin. Psychol. 2022, 18, 329–357. [Google Scholar] [CrossRef] [PubMed]
- Dent, E.; Chapman, I.; Howell, S.; Piantadosi, C.; Visvanathan, R. Frailty and functional decline indices predict poor outcomes in hospitalised older people. Age Ageing 2013, 43, 477–484. [Google Scholar] [CrossRef]
- Guzman-Castillo, M.; Ahmadi-Abhari, S.; Bandosz, P.; Capewell, S.; Steptoe, A.; Singh-Manoux, A.; Kivimaki, M.; Shipley, M.J.; Brunner, E.J.; O’Flaherty, M. Forecasted trends in disability and life expectancy in England and Wales up to 2025: A modelling study. Lancet Public Health 2017, 2, e307–e313. [Google Scholar] [CrossRef] [PubMed]
- Johnston, K.M.; Powell, L.C.; Anderson, I.M.; Szabo, S.; Cline, S. The burden of treatment-resistant depression: A systematic review of the economic and quality of life literature. J. Affect. Disord. 2018, 242, 195–210. [Google Scholar] [CrossRef]
- König, H.-H.; Konnopka, A. The excess costs of depression: A systematic review and meta-analysis. Epidemiol. Psychiatr. Sci. 2019, 29, e30. [Google Scholar] [CrossRef]
- Soysal, P.; Veronese, N.; Thompson, T.; Kahl, K.G.; Fernandes, B.S.; Prina, A.M.; Solmi, M.; Schofield, P.; Koyanagi, A.; Tseng, P.-T.; et al. Relationship between depression and frailty in older adults: A systematic review and meta-analysis. Ageing Res. Rev. 2017, 36, 78–87. [Google Scholar] [CrossRef]
- Mezuk, B.; Edwards, L.; Lohman, M.; Choi, M.; Lapane, K. Depression and frailty in later life: A synthetic review: Depression and frailty in later life. Int. J. Geriatr. Psychiatry 2012, 27, 879–892. [Google Scholar] [CrossRef]
- Adam, E.K.; Quinn, M.E.; Tavernier, R.; McQuillan, M.T.; Dahlke, K.A.; Gilbert, K.E. Diurnal cortisol slopes and mental and physical health outcomes: A systematic review and meta-analysis. Psychoneuroendocrinology 2017, 83, 25–41. [Google Scholar] [CrossRef]
- Fried, L.P.; Tangen, C.M.; Walston, J.; Newman, A.B.; Hirsch, C.; Gottdiener, J.; Seeman, T.; Tracy, R.; Kop, W.J.; Burke, G. Frailty in Older Adults Evidence for a Phenotype. J. Gerontol. Ser. A Biol. Sci. Med. Sci. 2001, 56, M146–M157. [Google Scholar] [CrossRef]
- Rockwood, K.; Mitnitski, A. Frailty in Relation to the Accumulation of Deficits. J. Gerontol. Ser. A Biol. Sci. Med. Sci. 2007, 62, 722–727. [Google Scholar] [CrossRef]
- Michela, B.; Cataldi, F.; Carlucci, L.; Padulo, C.; Fairfield, B. Assessment of late-life depression via self-report measures: A review. Clin. Interv. Aging 2018, 13, 2021–2044. [Google Scholar] [CrossRef]
- Siu, A.L.; US Preventive Services Task Force (USPSTF); Bibbins-Domingo, K.; Grossman, D.C.; Baumann, L.C.; Davidson, K.W.; Ebell, M.; García, F.A.R.; Gillman, M.; Herzstein, J.; et al. Screening for Depression in Adults: US Preventive Services Task Force Recommendation Statement. J. Am. Med. Assoc. 2016, 315, 380–387. [Google Scholar] [CrossRef]
- Manea, L.; Gilbody, S.; McMillan, D. A diagnostic meta-analysis of the Patient Health Questionnaire-9 (PHQ-9) algorithm scoring method as a screen for depression. Gen. Hosp. Psychiatry 2015, 37, 67–75. [Google Scholar] [CrossRef]
- Buigues, C.; Padilla-Sánchez, C.; Fernandez-Garrido, J.F.; Navarro-Martínez, R.; Ruiz-Ros, V.; Cauli, O. The relationship between depression and frailty syndrome: A systematic review. Aging Ment. Health 2015, 19, 762–772. [Google Scholar] [CrossRef]
- Chu, W.; Chang, S.; Ho, H.; Lin, H. The Relationship Between Depression and Frailty in Community-Dwelling Older People: A Systematic Review and Meta-Analysis of 84,351 Older Adults. J. Nurs. Scholarsh. 2019, 51, 547–559. [Google Scholar] [CrossRef] [PubMed]
- Vaughan, L.; Goveas, J.S.; Corbin, A.L. Depression and frailty in later life: A systematic review. Clin. Interv. Aging 2015, 10, 1947–1958. [Google Scholar] [CrossRef]
- Blane, D.; Netuveli, G.; Stone, J. The development of life course epidemiology. Rev. D’épidémiologie St. Publique 2007, 55, 31–38. [Google Scholar] [CrossRef]
- Kuh, D.; Ben-Shlomo, Y.; Lynch, J.; Hallqvist, J.; Power, C. Life Course Epidemiology. J. Epidemiol. Community Health 2003, 57, 778. [Google Scholar] [CrossRef] [PubMed]
- Brandt, M.; Deindl, C.; Hank, K. Tracing the origins of successful aging: The role of childhood conditions and social inequality in explaining later life health. Soc. Sci. Med. 2012, 74, 1418–1425. [Google Scholar] [CrossRef] [PubMed]
- Dimitriadis, M.M.; Jeuring, H.W.; Marijnissen, R.M.; Wieringa, T.H.; O. Hoogendijk, E.; Voshaar, R.C.O. Adverse Childhood Experiences and frailty in later life: A prospective population-based cohort study. Age Ageing 2023, 52, afad010. [Google Scholar] [CrossRef]
- Eachus, H.; Cunliffe, V.T. Chapter 12—Biological Embedding of Psychosocial Stress Over the Life Course. In Epigenetics of Aging and Longevity; Translational Epigenetics; Moskalev, A., Vaiserman, A.M., Eds.; Academic Press: Boston, MA, USA, 2018; Volume 4, pp. 251–270. [Google Scholar]
- Angelini, V.; Howdon, D.D.H.; O. Mierau, J. Childhood Socioeconomic Status and Late-Adulthood Mental Health: Results From the Survey on Health, Ageing and Retirement in Europe. J. Gerontol. Ser. B 2018, 74, 95–104. [Google Scholar] [CrossRef]
- Li, Y.; Xue, Q.-L.; Odden, M.C.; Chen, X.; Wu, C. Linking early life risk factors to frailty in old age: Evidence from the China Health and Retirement Longitudinal Study. Age Ageing 2020, 49, 208–217. [Google Scholar] [CrossRef] [PubMed]
- Power, C.; Elliott, J. Cohort profile: 1958 British birth cohort (National Child Development Study). Int. J. Epidemiol. 2005, 35, 34–41. [Google Scholar] [CrossRef]
- Din, F. (TSMLP) Technical Report for the 1958 National Child Development Study: Age 55 Survey; TNS BMRB: London, UK, 2014; p. 56. [Google Scholar]
- Searle, S.D.; Mitnitski, A.; Gahbauer, E.A.; Gill, T.M.; Rockwood, K. A standard procedure for creating a frailty index. BMC Geriatr. 2008, 8, 24. [Google Scholar] [CrossRef]
- Khezrian, M.; Myint, P.K.; McNeil, C.; Murray, A.D. A Review of Frailty Syndrome and Its Physical, Cognitive and Emotional Domains in the Elderly. Geriatrics 2017, 2, 36. [Google Scholar] [CrossRef]
- Gordon, E.H.; Reid, N.; Khetani, I.S.; Hubbard, R.E. How frail is frail? A systematic scoping review and synthesis of high impact studies. BMC Geriatr. 2021, 21, 719. [Google Scholar] [CrossRef] [PubMed]
- Rodgers, B.; Pickles, A.; Power, C.; Collishaw, S.; Maughan, B. Validity of the Malaise Inventory in general population samples. Soc. Psychiatry Psychiatr. Epidemiol. 1999, 34, 333–341. [Google Scholar] [CrossRef] [PubMed]
- Ploubidis, G.; McElroy, E.; Moreira, H. A Longitudinal Examination of the Measurement Equivalence of Mental Health As-Sessments in Two British Birth Cohorts_AAM.Pdf; UCL Centre for Longitudinal Studies: London, UK, 2019. [Google Scholar]
- Blane, D.; Wahrendorf, M.; Webb, E.; Netuveli, G. Life Course Influences on Quality of Life at Age 50 Years:: Evidence from the National Child Development Study. Longitud. Life Course Stud. 2012, 3, 346–358. [Google Scholar]
- Dennison, K.; Peters, A. National Child Development Study—Bristol Social Adjustment Guide Forms at Ages 7 and 11; UCL Centre for Longitudinal Studies: London, UK, 2013. [Google Scholar]
- Turner, A.J.; Fichera, E.; Sutton, M. Estimating the late-life effects of social and emotional skills in childhood using midlife mediators. Soc. Sci. Med. 2021, 292, 114522. [Google Scholar] [CrossRef]
- Lacey, R.E.; Cable, N.; Stafford, M.; Bartley, M.; Pikhart, H. Childhood socio-economic position and adult smoking: Are childhood psychosocial factors important? Evidence from a British birth cohort. Eur. J. Public Health 2010, 21, 725–731. [Google Scholar] [CrossRef]
- Redig, L.; Feter, N.; Dumith, S.C.; Domingues, M.R.; Rombaldi, A.J. Physical Inactivity From Childhood to Adolescence and Incident Depression. Am. J. Prev. Med. 2021, 62, 211–218. [Google Scholar] [CrossRef]
- Staff, J.; Maggs, J. Alcohol and Cigarette Use From Ages 23 to 55: Links With Health and Well-Being in the Long-Term National Child Development Study. J. Stud. Alcohol Drugs 2017, 78, 394–403. [Google Scholar] [CrossRef] [PubMed]
- Silverwood, R.; Narayanan, M.; Dodgeon, B.; Ploubidis, G. Handling Missing Data in the National Child Development Study: User Guide, Version 2; UCL Centre for Longitudinal Studies: London, UK, 2021. [Google Scholar]
- Gomez-Bernal, F.; Madva, E.N.; Puckett, J.; Amonoo, H.L.; Millstein, R.A.; Huffman, J.C. Relationships Between Life Stressors, Health Behaviors, and Chronic Medical Conditions in Mid-Life Adults: A Narrative Review. Psychosomatics 2018, 60, 153–163. [Google Scholar] [CrossRef]
- Wang, X.; Hu, J.; Wu, D. Risk factors for frailty in older adults. Medicine (Baltimore) 2022, 101, e30169. [Google Scholar] [CrossRef]
- Mallery, L.; MacLeod, T.; Allen, M.; McLean-Veysey, P.; Rodney-Cail, N.; Bezanson, E.; Steeves, B.; LeBlanc, C.; Moorhouse, P. Systematic review and meta-analysis of second-generation antidepressants for the treatment of older adults with depression: Questionable benefit and considerations for frailty. BMC Geriatr. 2019, 19, 306. [Google Scholar] [CrossRef] [PubMed]
- E. Whitton, A.; Hardy, R.; Cope, K.; Gieng, C.; Gow, L.; MacKinnon, A.; Gale, N.; O’Moore, K.; Anderson, J.; Proudfoot, J.; et al. Mental Health Screening in General Practices as a Means for Enhancing Uptake of Digital Mental Health Interventions: Observational Cohort Study. J. Med. Internet Res. 2021, 23, e28369. [Google Scholar] [CrossRef]
- Thomas, S.; Jenkins, R.; Burch, T.; Nasir, L.C.; Fisher, B.; Giotaki, G.; Gnani, S.; Hertel, L.; Marks, M.; Mathers, N.; et al. Promoting Mental Health and Preventing Mental Illness in General Practice. Lond. J. Prim. Care 2016, 8, 3–9. [Google Scholar] [CrossRef]
- Colizzi, M.; Lasalvia, A.; Ruggeri, M. Prevention and early intervention in youth mental health: Is it time for a multidisciplinary and trans-diagnostic model for care? Int. J. Ment. Health Syst. 2020, 14, 23. [Google Scholar] [CrossRef] [PubMed]
- Aprahamian, I.; Borges, M.K.; Hanssen, D.J.; Jeuring, H.W.; Voshaar, R.C.O. The Frail Depressed Patient: A Narrative Review on Treatment Challenges. Clin. Interv. Aging 2022, 17, 979–990. [Google Scholar] [CrossRef]
- O’caoimh, R.; Sezgin, D.; O’donovan, M.R.; Molloy, D.W.; Clegg, A.; Rockwood, K.; Liew, A. Prevalence of frailty in 62 countries across the world: A systematic review and meta-analysis of population-level studies. Age Ageing 2020, 50, 96–104. [Google Scholar] [CrossRef] [PubMed]
- Kojima, G.; Iliffe, S.; Walters, K. Frailty index as a predictor of mortality: A systematic review and meta-analysis. Age Ageing 2017, 47, 193–200. [Google Scholar] [CrossRef] [PubMed]

| All | Women | Men | |||||||||||||
|---|---|---|---|---|---|---|---|---|---|---|---|---|---|---|---|
| Complete Cases | Imputed Dataset | Complete Cases | Imputed Dataset | Complete Cases | Imputed Dataset | ||||||||||
| N | % | % | LCI | UCI | N | % | % | LCI | UCI | N | % | % | LCI | UCI | |
| All | 9789 | 100.0 | 4968 | 50.8 | 4821 | 49.3 | |||||||||
| Frailty at Age 50 | |||||||||||||||
| Non-frail (index score <0.25) | 6814 | 69.6 | 69.9 | 69.0 | 70.8 | 3456 | 69.6 | 69.8 | 68.5 | 71.1 | 3358 | 69.7 | 70.0 | 68.7 | 71.3 |
| Frail (index score ≥0.25) | 2905 | 29.7 | 30.1 | 29.2 | 31.0 | 1485 | 29.9 | 30.2 | 28.9 | 31.5 | 1420 | 29.5 | 30.0 | 28.7 | 31.3 |
| Missing | 70 | 0.7 | 27 | 0.5 | 43 | 0.9 | |||||||||
| Depression at Age 23 | |||||||||||||||
| Malaise inventory score <4 | 7551 | 77.1 | 91.1 | 90.5 | 91.7 | 3713 | 74.7 | 86.9 | 85.9 | 87.9 | 3838 | 79.6 | 95.5 | 94.8 | 96.1 |
| Malaise inventory score ≥4 | 684 | 7.0 | 8.9 | 8.3 | 9.5 | 518 | 10.4 | 13.1 | 12.1 | 14.1 | 166 | 3.4 | 4.5 | 3.9 | 5.2 |
| Missing | 1554 | 15.9 | 737 | 14.8 | 817 | 17.0 | |||||||||
| Depression at Age 33 | |||||||||||||||
| Malaise inventory score <4 | 7825 | 79.9 | 92.2 | 89.9 | 94.5 | 3943 | 79.4 | 89.5 | 86.9 | 92.2 | 3882 | 80.5 | 95.0 | 92.9 | 97.1 |
| Malaise inventory score ≥4 | 571 | 5.8 | 7.8 | 5.5 | 10.1 | 402 | 8.1 | 10.5 | 7.8 | 13.1 | 169 | 3.5 | 5.0 | 2.9 | 7.1 |
| Missing | 1393 | 14.2 | 623 | 12.5 | 770 | 16.0 | |||||||||
| Depression at Age 42 | |||||||||||||||
| Malaise inventory score <4 | 7874 | 80.4 | 87.0 | 86.3 | 87.7 | 3932 | 79.2 | 84.0 | 83.0 | 85.1 | 3942 | 81.8 | 90.0 | 89.1 | 90.9 |
| Malaise inventory score ≥4 | 1125 | 11.5 | 13.0 | 12.3 | 13.7 | 714 | 14.4 | 16.0 | 14.9 | 17.0 | 411 | 8.5 | 10.0 | 9.1 | 10.9 |
| Missing | 790 | 8.1 | 322 | 6.5 | 468 | 9.7 | |||||||||
| Depression (accumulated) | |||||||||||||||
| Malaise inventory score ≥4 (never) | 5681 | 58.0 | 79.7 | 78.2 | 81.2 | 2805 | 56.5 | 74.0 | 72.2 | 75.8 | 2876 | 59.7 | 85.6 | 84.0 | 87.2 |
| Malaise inventory score ≥4 (once) | 860 | 8.8 | 13.3 | 12.4 | 14.1 | 550 | 11.1 | 16.1 | 14.9 | 17.2 | 310 | 6.4 | 10.4 | 9.3 | 11.5 |
| Malaise inventory score ≥4 (twice) | 286 | 2.9 | 4.6 | 3.9 | 5.4 | 208 | 4.2 | 6.3 | 5.3 | 7.3 | 78 | 1.6 | 2.9 | 2.1 | 3.6 |
| Malaise inventory score ≥4 (thrice) | 124 | 1.3 | 2.4 | 2.0 | 2.9 | 99 | 2.0 | 3.6 | 2.9 | 4.3 | 25 | 0.5 | 1.1 | 0.7 | 1.5 |
| Missing | 2838 | 29.0 | 1306 | 26.3 | 1532 | 31.8 | |||||||||
| Marital Status (Age 50) | |||||||||||||||
| Married/Civil partnership | 6744 | 68.9 | 68.9 | 68.0 | 69.8 | 3384 | 68.1 | 68.1 | 66.8 | 69.4 | 3360 | 69.7 | 69.7 | 68.4 | 71.0 |
| Single, Never married/Civil partnership | 1064 | 10.9 | 10.9 | 10.3 | 11.5 | 467 | 9.4 | 9.4 | 8.6 | 10.2 | 597 | 12.4 | 12.4 | 11.5 | 13.3 |
| Separated/Divorced | 1840 | 18.8 | 18.8 | 18.0 | 19.6 | 1015 | 20.4 | 20.4 | 19.3 | 21.6 | 825 | 17.1 | 17.1 | 16.0 | 18.2 |
| Widowed | 140 | 1.4 | 1.4 | 1.2 | 1.7 | 101 | 2.0 | 2.0 | 1.6 | 2.4 | 39 | 0.8 | 0.8 | 0.6 | 1.1 |
| Missing | 1 | 0.0 | 1 | 0.0 | 0 | 0.0 | |||||||||
| Employment Status (Age 50) | |||||||||||||||
| Employed | 8256 | 84.3 | 84.4 | 83.6 | 85.1 | 4007 | 80.7 | 80.7 | 79.6 | 81.8 | 4249 | 88.1 | 88.2 | 87.2 | 89.1 |
| Not employed | 1527 | 15.6 | 15.6 | 14.9 | 16.4 | 957 | 19.3 | 19.3 | 18.2 | 20.4 | 570 | 11.8 | 11.8 | 10.9 | 12.8 |
| Missing | 6 | 0.1 | 4 | 0.1 | 2 | 0.0 | |||||||||
| Highest Qualification (Age 50) | |||||||||||||||
| Level 4/Degree or higher | 2360 | 24.1 | 24.1 | 23.3 | 25.0 | 1231 | 24.8 | 24.8 | 23.6 | 26.0 | 1129 | 23.42 | 23.4 | 22.2 | 24.6 |
| A Level/equivalent NVQ3 | 774 | 7.9 | 7.9 | 7.4 | 8.4 | 390 | 7.9 | 7.9 | 7.1 | 8.6 | 384 | 7.97 | 8.0 | 7.2 | 8.7 |
| O Level/equivalent NVQ2 | 3328 | 34.0 | 34.0 | 33.1 | 35.0 | 1809 | 36.4 | 36.4 | 35.1 | 37.8 | 1519 | 31.51 | 31.5 | 30.2 | 32.8 |
| CSE 2-5/equivalent NVQ1 | 1411 | 14.4 | 14.4 | 13.7 | 15.1 | 663 | 13.4 | 13.4 | 12.4 | 14.3 | 748 | 15.52 | 15.5 | 14.5 | 16.6 |
| No qualification | 1910 | 19.5 | 19.5 | 18.8 | 20.3 | 873 | 17.6 | 17.6 | 16.5 | 18.7 | 1037 | 21.51 | 21.5 | 20.4 | 22.7 |
| Missing | 6 | 0.1 | 2 | 0.0 | 4 | 0.08 | |||||||||
| Subjective Financial Status (Age 50) | |||||||||||||||
| Living comfortably | 3827 | 39.1 | 39.1 | 38.2 | 40.1 | 1967 | 39.6 | 39.6 | 38.3 | 41.0 | 1860 | 38.6 | 38.6 | 37.3 | 40.0 |
| Doing all right | 2992 | 30.6 | 30.6 | 29.7 | 31.5 | 1528 | 30.8 | 30.8 | 29.5 | 32.1 | 1464 | 30.4 | 30.5 | 29.2 | 31.8 |
| Just about getting by | 2112 | 21.6 | 21.7 | 20.9 | 22.5 | 1033 | 20.8 | 20.9 | 19.7 | 22.0 | 1079 | 22.4 | 22.5 | 21.3 | 23.7 |
| Finding it quite difficult | 566 | 5.8 | 5.8 | 5.4 | 6.3 | 302 | 6.1 | 6.1 | 5.5 | 6.8 | 264 | 5.5 | 5.5 | 4.9 | 6.2 |
| Finding it very difficult | 264 | 2.7 | 2.7 | 2.4 | 3.0 | 126 | 2.5 | 2.6 | 2.1 | 3.0 | 138 | 2.9 | 2.9 | 2.4 | 3.4 |
| Missing | 28 | 0.3 | 12 | 0.2 | 16 | 0.3 | |||||||||
| Social Class of Father’s Occupation | |||||||||||||||
| Non-manual | 2845 | 29.1 | 34.3 | 33.3 | 35.3 | 1441 | 29.0 | 34.1 | 32.7 | 35.5 | 1404.0 | 29.1 | 34.6 | 33.2 | 36.0 |
| Manual | 5479 | 56.0 | 65.7 | 64.7 | 66.7 | 2793 | 56.2 | 65.9 | 64.5 | 67.3 | 2686.0 | 55.7 | 65.4 | 64.0 | 66.8 |
| Missing | 1465 | 15.0 | 734 | 14.8 | 731 | 15.16 | |||||||||
| Childhood Disadvantage | |||||||||||||||
| None recorded | 6838 | 69.9 | 70.3 | 69.4 | 71.2 | 3424 | 68.9 | 69.4 | 68.1 | 70.7 | 3414 | 70.8 | 71.3 | 70.0 | 72.5 |
| One item recorded | 2119 | 21.7 | 21.8 | 20.9 | 22.6 | 1118 | 22.5 | 22.6 | 21.5 | 23.8 | 1001 | 20.8 | 20.9 | 19.7 | 22.0 |
| Two items recorded | 522 | 5.3 | 5.4 | 4.9 | 5.8 | 268 | 5.4 | 5.4 | 4.8 | 6.1 | 254 | 5.3 | 5.3 | 4.7 | 5.9 |
| Three items recorded | 198 | 2.0 | 2.0 | 1.8 | 2.3 | 100 | 2.0 | 2.0 | 1.6 | 2.4 | 98 | 2.0 | 2.0 | 1.6 | 2.4 |
| Four items recorded | 51 | 0.5 | 0.5 | 0.4 | 0.7 | 26 | 0.5 | 0.5 | 0.3 | 0.7 | 25 | 0.5 | 0.5 | 0.3 | 0.7 |
| Missing | 61 | 0.6 | 32 | 0.6 | 29 | 0.6 | |||||||||
| Parental Discord at Age 7 | |||||||||||||||
| No | 7094 | 72.5 | 95.1 | 94.6 | 95.5 | 3623 | 72.9 | 95.1 | 94.5 | 95.8 | 3471 | 72.0 | 95.0 | 94.3 | 95.7 |
| Yes | 382 | 3.9 | 4.9 | 4.5 | 5.4 | 192 | 3.9 | 4.9 | 4.2 | 5.5 | 190 | 3.9 | 5.0 | 4.3 | 5.7 |
| Missing | 2313 | 23.6 | 1153 | 23.2 | 1160 | 24.1 | |||||||||
| Parents Separated or Died by Age 7 | |||||||||||||||
| No | 8563 | 87.5 | 95.6 | 95.2 | 96.0 | 4347 | 87.5 | 95.3 | 94.6 | 95.9 | 4216 | 87.5 | 95.9 | 95.3 | 96.5 |
| Yes | 395 | 4.0 | 4.4 | 4.0 | 4.8 | 217 | 4.4 | 4.7 | 4.1 | 5.4 | 178 | 3.7 | 4.1 | 3.5 | 4.7 |
| Missing | 831 | 8.5 | 404 | 8.1 | 427 | 8.9 | |||||||||
| BSAG (Age 7 and 11 Mean Score) | |||||||||||||||
| 1st Quartile | 2530 | 25.9 | 32.2 | 31.2 | 33.3 | 1550.0 | 31.2 | 38.9 | 37.4 | 40.4 | 980 | 20.3 | 25.3 | 23.9 | 26.7 |
| 2nd Quartile | 1881 | 19.2 | 24.1 | 23.1 | 25.0 | 991.0 | 20.0 | 25.0 | 23.7 | 26.3 | 890 | 18.5 | 23.2 | 21.9 | 24.5 |
| 3rd Quartile | 1776 | 18.1 | 23.1 | 22.2 | 24.1 | 825.0 | 16.6 | 21.1 | 19.7 | 22.4 | 951 | 19.7 | 25.2 | 23.9 | 26.6 |
| 4th Quartile | 1564 | 16.0 | 20.6 | 19.7 | 21.5 | 581.0 | 11.7 | 15.1 | 14.0 | 16.1 | 983 | 20.4 | 26.3 | 25.0 | 27.6 |
| Missing | 2038 | 20.8 | 1021.0 | 20.6 | 1017 | 21.1 | |||||||||
| Smoking (Age 23) | |||||||||||||||
| Non-smoker | 5136 | 52.5 | 60.9 | 59.9 | 61.9 | 2654 | 53.4 | 61.1 | 59.8 | 62.5 | 2482 | 51.5 | 60.7 | 59.3 | 62.2 |
| Current or past smoker | 3173 | 32.4 | 39.1 | 38.1 | 40.1 | 1621 | 32.6 | 38.9 | 37.5 | 40.2 | 1552 | 32.2 | 39.3 | 37.8 | 40.7 |
| Missing | 1480 | 15.1 | 693 | 14.0 | 787 | 16.3 | |||||||||
| Alcohol Consumption (Age 23) | |||||||||||||||
| ≤14 units per week | 3924 | 40.1 | 61.6 | 60.4 | 62.7 | 2452 | 49.4 | 80.6 | 79.2 | 81.9 | 1472 | 30.53 | 42.0 | 40.3 | 43.6 |
| >14 units per week | 2883 | 29.5 | 38.4 | 37.3 | 39.6 | 688 | 13.9 | 19.4 | 18.1 | 20.8 | 2195 | 45.53 | 58.0 | 56.4 | 59.7 |
| Missing | 2982 | 30.5 | 1828 | 36.8 | 1154 | 23.94 | |||||||||
| Physical Activity (Age 16) | |||||||||||||||
| Active | 3951 | 40.4 | 52.9 | 51.8 | 54.0 | 1827 | 36.8 | 0.8 | 46.0 | 49.1 | 2124 | 44.1 | 58.4 | 56.9 | 59.9 |
| Inactive | 3487 | 35.6 | 47.1 | 46.0 | 48.2 | 1995 | 40.2 | 52.5 | 50.9 | 54.0 | 1492 | 31.0 | 41.6 | 40.1 | 43.1 |
| Missing | 2351 | 24.0 | 1146 | 23.1 | 1205 | 25.0 | |||||||||
| Depression at Age 23 | Depression at Age 33 | Depression at Age 42 | Accumulated Depression Score | |||||||||||||
|---|---|---|---|---|---|---|---|---|---|---|---|---|---|---|---|---|
| Independent Variables | OR | LCI | UCI | p-Value | OR | LCI | UCI | p-Value | OR | LCI | UCI | p-Value | OR | LCI | UCI | p-Value |
| Depression | ||||||||||||||||
| Malaise inventory score <4 | Ref | Ref | Ref | |||||||||||||
| Malaise inventory score ≥4 | 1.76 | 1.47 | 2.10 | <0.001 | 2.11 | 1.72 | 2.60 | <0.001 | 2.15 | 1.87 | 2.48 | <0.001 | ||||
| Depression (Accumulated) | ||||||||||||||||
| Malaise inventory score ≥4 (never) | Ref | |||||||||||||||
| Malaise inventory score ≥4 (once) | 1.92 | 1.65 | 2.23 | <0.001 | ||||||||||||
| Malaise inventory score ≥4 (twice) | 2.33 | 1.85 | 2.94 | <0.001 | ||||||||||||
| Malaise inventory score ≥4 (thrice) | 2.95 | 2.11 | 4.11 | <0.001 | ||||||||||||
| Sex | ||||||||||||||||
| Female | Ref | |||||||||||||||
| Male | 1.12 | 1.00 | 1.25 | 0.054 | 1.10 | 0.99 | 1.23 | 0.084 | 1.11 | 0.99 | 1.24 | 0.079 | 1.17 | 1.05 | 1.32 | 0.005 |
| Marital Status (Age 50) | ||||||||||||||||
| Married/Civil partnership | Ref | Ref | Ref | Ref | ||||||||||||
| Single, Never married/Civil partnership | 1.14 | 0.98 | 1.34 | 0.086 | 1.13 | 0.97 | 1.32 | 0.120 | 1.13 | 0.97 | 1.32 | 0.127 | 1.12 | 0.96 | 1.31 | 0.162 |
| Separated/Divorced | 0.89 | 0.79 | 1.01 | 0.065 | 0.88 | 0.78 | 1.00 | 0.045 | 0.88 | 0.77 | 0.99 | 0.040 | 0.87 | 0.77 | 0.99 | 0.029 |
| Widowed | 1.04 | 0.71 | 1.53 | 0.848 | 1.02 | 0.69 | 1.50 | 0.931 | 1.03 | 0.70 | 1.52 | 0.896 | 1.02 | 0.69 | 1.51 | 0.908 |
| Employment Status (Age 50) | ||||||||||||||||
| Employed | Ref | Ref | Ref | Ref | ||||||||||||
| Not employed | 2.80 | 2.46 | 3.17 | <0.001 | 2.74 | 2.41 | 3.11 | <0.001 | 2.64 | 2.33 | 3.00 | <0.001 | 2.65 | 2.33 | 3.01 | <0.001 |
| Highest Qualification (Age 50) | ||||||||||||||||
| Level 4/Degree or higher | Ref | Ref | Ref | Ref | ||||||||||||
| A Level/equivalent NVQ3 | 1.02 | 0.82 | 1.27 | 0.831 | 1.04 | 0.83 | 1.29 | 0.746 | 1.04 | 0.84 | 1.30 | 0.715 | 1.04 | 0.83 | 1.29 | 0.738 |
| O Level/equivalent NVQ2 | 1.54 | 1.34 | 1.77 | <0.001 | 1.54 | 1.34 | 1.77 | <0.001 | 1.55 | 1.35 | 1.78 | <0.001 | 1.54 | 1.34 | 1.77 | <0.001 |
| CSE 2-5/equivalent NVQ1 | 2.03 | 1.72 | 2.39 | <0.001 | 2.04 | 1.72 | 2.40 | <0.001 | 2.07 | 1.75 | 2.45 | <0.001 | 2.03 | 1.72 | 2.40 | <0.001 |
| No qualification | 2.45 | 2.09 | 2.88 | <0.001 | 2.44 | 2.08 | 2.87 | <0.001 | 2.49 | 2.12 | 2.93 | <0.001 | 2.40 | 2.03 | 2.82 | <0.001 |
| Subjective Financial Position (Age 50) | ||||||||||||||||
| Living comfortably | Ref | Ref | Ref | Ref | ||||||||||||
| Doing all right | 1.21 | 1.07 | 1.36 | 0.002 | 1.21 | 1.08 | 1.36 | 0.002 | 1.20 | 1.07 | 1.35 | 0.002 | 1.19 | 1.06 | 1.34 | 0.003 |
| Just about getting by | 1.65 | 1.45 | 1.87 | <0.001 | 1.62 | 1.43 | 1.84 | <0.001 | 1.60 | 1.41 | 1.82 | <0.001 | 1.59 | 1.40 | 1.80 | <0.001 |
| Finding it quite difficult | 2.20 | 1.80 | 2.69 | <0.001 | 2.23 | 1.83 | 2.73 | <0.001 | 2.14 | 1.75 | 2.61 | <0.001 | 2.12 | 1.74 | 2.60 | <0.001 |
| Finding it very difficult | 2.91 | 2.18 | 3.90 | <0.001 | 2.96 | 2.21 | 3.96 | <0.001 | 2.78 | 2.07 | 3.73 | <0.001 | 2.69 | 2.00 | 3.62 | <0.001 |
| Social Class of the Father’s Occupation (at Birth) | ||||||||||||||||
| Non-manual | Ref | Ref | Ref | Ref | ||||||||||||
| Manual | 1.30 | 1.15 | 1.46 | <0.001 | 1.30 | 1.15 | 1.46 | <0.001 | 1.30 | 1.15 | 1.46 | <0.001 | 1.30 | 1.16 | 1.47 | <0.001 |
| Childhood Disadvantage | ||||||||||||||||
| None recorded | Ref | Ref | Ref | Ref | ||||||||||||
| One item recorded | 1.00 | 0.89 | 1.13 | 0.961 | 1.00 | 0.89 | 1.13 | 0.950 | 1.00 | 0.89 | 1.13 | 0.982 | 0.99 | 0.88 | 1.11 | 0.839 |
| Two items recorded | 1.16 | 0.95 | 1.42 | 0.155 | 1.16 | 0.95 | 1.43 | 0.145 | 1.16 | 0.95 | 1.43 | 0.147 | 1.15 | 0.94 | 1.41 | 0.185 |
| Three items recorded | 1.38 | 1.00 | 1.91 | 0.050 | 1.33 | 0.96 | 1.84 | 0.087 | 1.33 | 0.96 | 1.85 | 0.083 | 1.35 | 0.97 | 1.87 | 0.071 |
| Four items recorded | 0.97 | 0.53 | 1.78 | 0.920 | 0.96 | 0.52 | 1.77 | 0.903 | 0.93 | 0.51 | 1.71 | 0.823 | 0.92 | 0.50 | 1.69 | 0.787 |
| Parental Discord at Age 7 | ||||||||||||||||
| No | Ref | Ref | Ref | Ref | ||||||||||||
| Yes | 0.99 | 0.77 | 1.27 | 0.939 | 0.98 | 0.76 | 1.27 | 0.894 | 1.01 | 0.78 | 1.31 | 0.933 | 0.96 | 0.74 | 1.24 | 0.752 |
| Parents Divorced, Separated or Died by Age 7 | ||||||||||||||||
| No | Ref | Ref | Ref | |||||||||||||
| Yes | 1.40 | 1.11 | 1.77 | 0.005 | 1.40 | 1.10 | 1.78 | 0.005 | 1.37 | 1.08 | 1.73 | 0.010 | 1.39 | 1.09 | 1.76 | 0.007 |
| BSAG (Age 7 and 11 Mean Score) | ||||||||||||||||
| 1st Quartile | Ref | Ref | Ref | Ref | ||||||||||||
| 2nd Quartile | 1.15 | 1.00 | 1.33 | 0.053 | 1.16 | 1.01 | 1.34 | 0.042 | 1.16 | 1.00 | 1.33 | 0.048 | 1.15 | 0.99 | 1.32 | 0.063 |
| 3rd Quartile | 1.30 | 1.12 | 1.51 | 0.001 | 1.30 | 1.12 | 1.51 | <0.001 | 1.30 | 1.12 | 1.51 | 0.001 | 1.28 | 1.10 | 1.48 | <0.001 |
| 4th Quartile | 1.48 | 1.26 | 1.73 | <0.001 | 1.50 | 1.28 | 1.75 | <0.001 | 1.50 | 1.28 | 1.75 | <0.001 | 1.44 | 1.23 | 1.69 | <0.001 |
| Smoking (Age 23) | ||||||||||||||||
| Non-smoker | Ref | Ref | Ref | Ref | ||||||||||||
| Current or past smoker | 1.14 | 1.03 | 1.27 | 0.010 | 1.15 | 1.04 | 1.28 | 0.008 | 1.16 | 1.04 | 1.28 | 0.007 | 1.13 | 1.02 | 1.26 | 0.019 |
| Alcohol Consumption (Age 23) | ||||||||||||||||
| ≤14 units per week | Ref | Ref | Ref | Ref | ||||||||||||
| >14 units per week | 0.83 | 0.74 | 0.95 | 0.005 | 0.84 | 0.74 | 0.95 | 0.007 | 0.83 | 0.73 | 0.95 | 0.006 | 0.84 | 0.74 | 0.95 | 0.006 |
| Physical Activity (Age 16) | ||||||||||||||||
| Active | Ref | Ref | Ref | Ref | ||||||||||||
| Inactive | 1.09 | 0.98 | 1.22 | 0.120 | 1.09 | 0.98 | 1.22 | 0.118 | 1.08 | 0.96 | 1.21 | 0.206 | 1.07 | 0.96 | 1.20 | 0.240 |
Disclaimer/Publisher’s Note: The statements, opinions and data contained in all publications are solely those of the individual author(s) and contributor(s) and not of MDPI and/or the editor(s). MDPI and/or the editor(s) disclaim responsibility for any injury to people or property resulting from any ideas, methods, instructions or products referred to in the content. |
© 2023 by the authors. Licensee MDPI, Basel, Switzerland. This article is an open access article distributed under the terms and conditions of the Creative Commons Attribution (CC BY) license (https://creativecommons.org/licenses/by/4.0/).
Share and Cite
Watts, P.; Menon, M.; Netuveli, G. Depression Earlier on in Life Predicts Frailty at 50 Years: Evidence from the 1958 British Birth Cohort Study. J. Clin. Med. 2023, 12, 5568. https://doi.org/10.3390/jcm12175568
Watts P, Menon M, Netuveli G. Depression Earlier on in Life Predicts Frailty at 50 Years: Evidence from the 1958 British Birth Cohort Study. Journal of Clinical Medicine. 2023; 12(17):5568. https://doi.org/10.3390/jcm12175568
Chicago/Turabian StyleWatts, Paul, Mukil Menon, and Gopalakrishnan Netuveli. 2023. "Depression Earlier on in Life Predicts Frailty at 50 Years: Evidence from the 1958 British Birth Cohort Study" Journal of Clinical Medicine 12, no. 17: 5568. https://doi.org/10.3390/jcm12175568