
Aortic Wall Thickness as a Surrogate for Subclinical Atherosclerosis in Familial and Nonfamilial Hypercholesterolemia: Quantitative 3D Magnetic Resonance Imaging Study and Interrelations with Computed Tomography Calcium Scores, and Carotid Ultrasonography
 , , , , ,
Abstract
:1. Introduction
2. Materials and Methods
2.1. Study Population
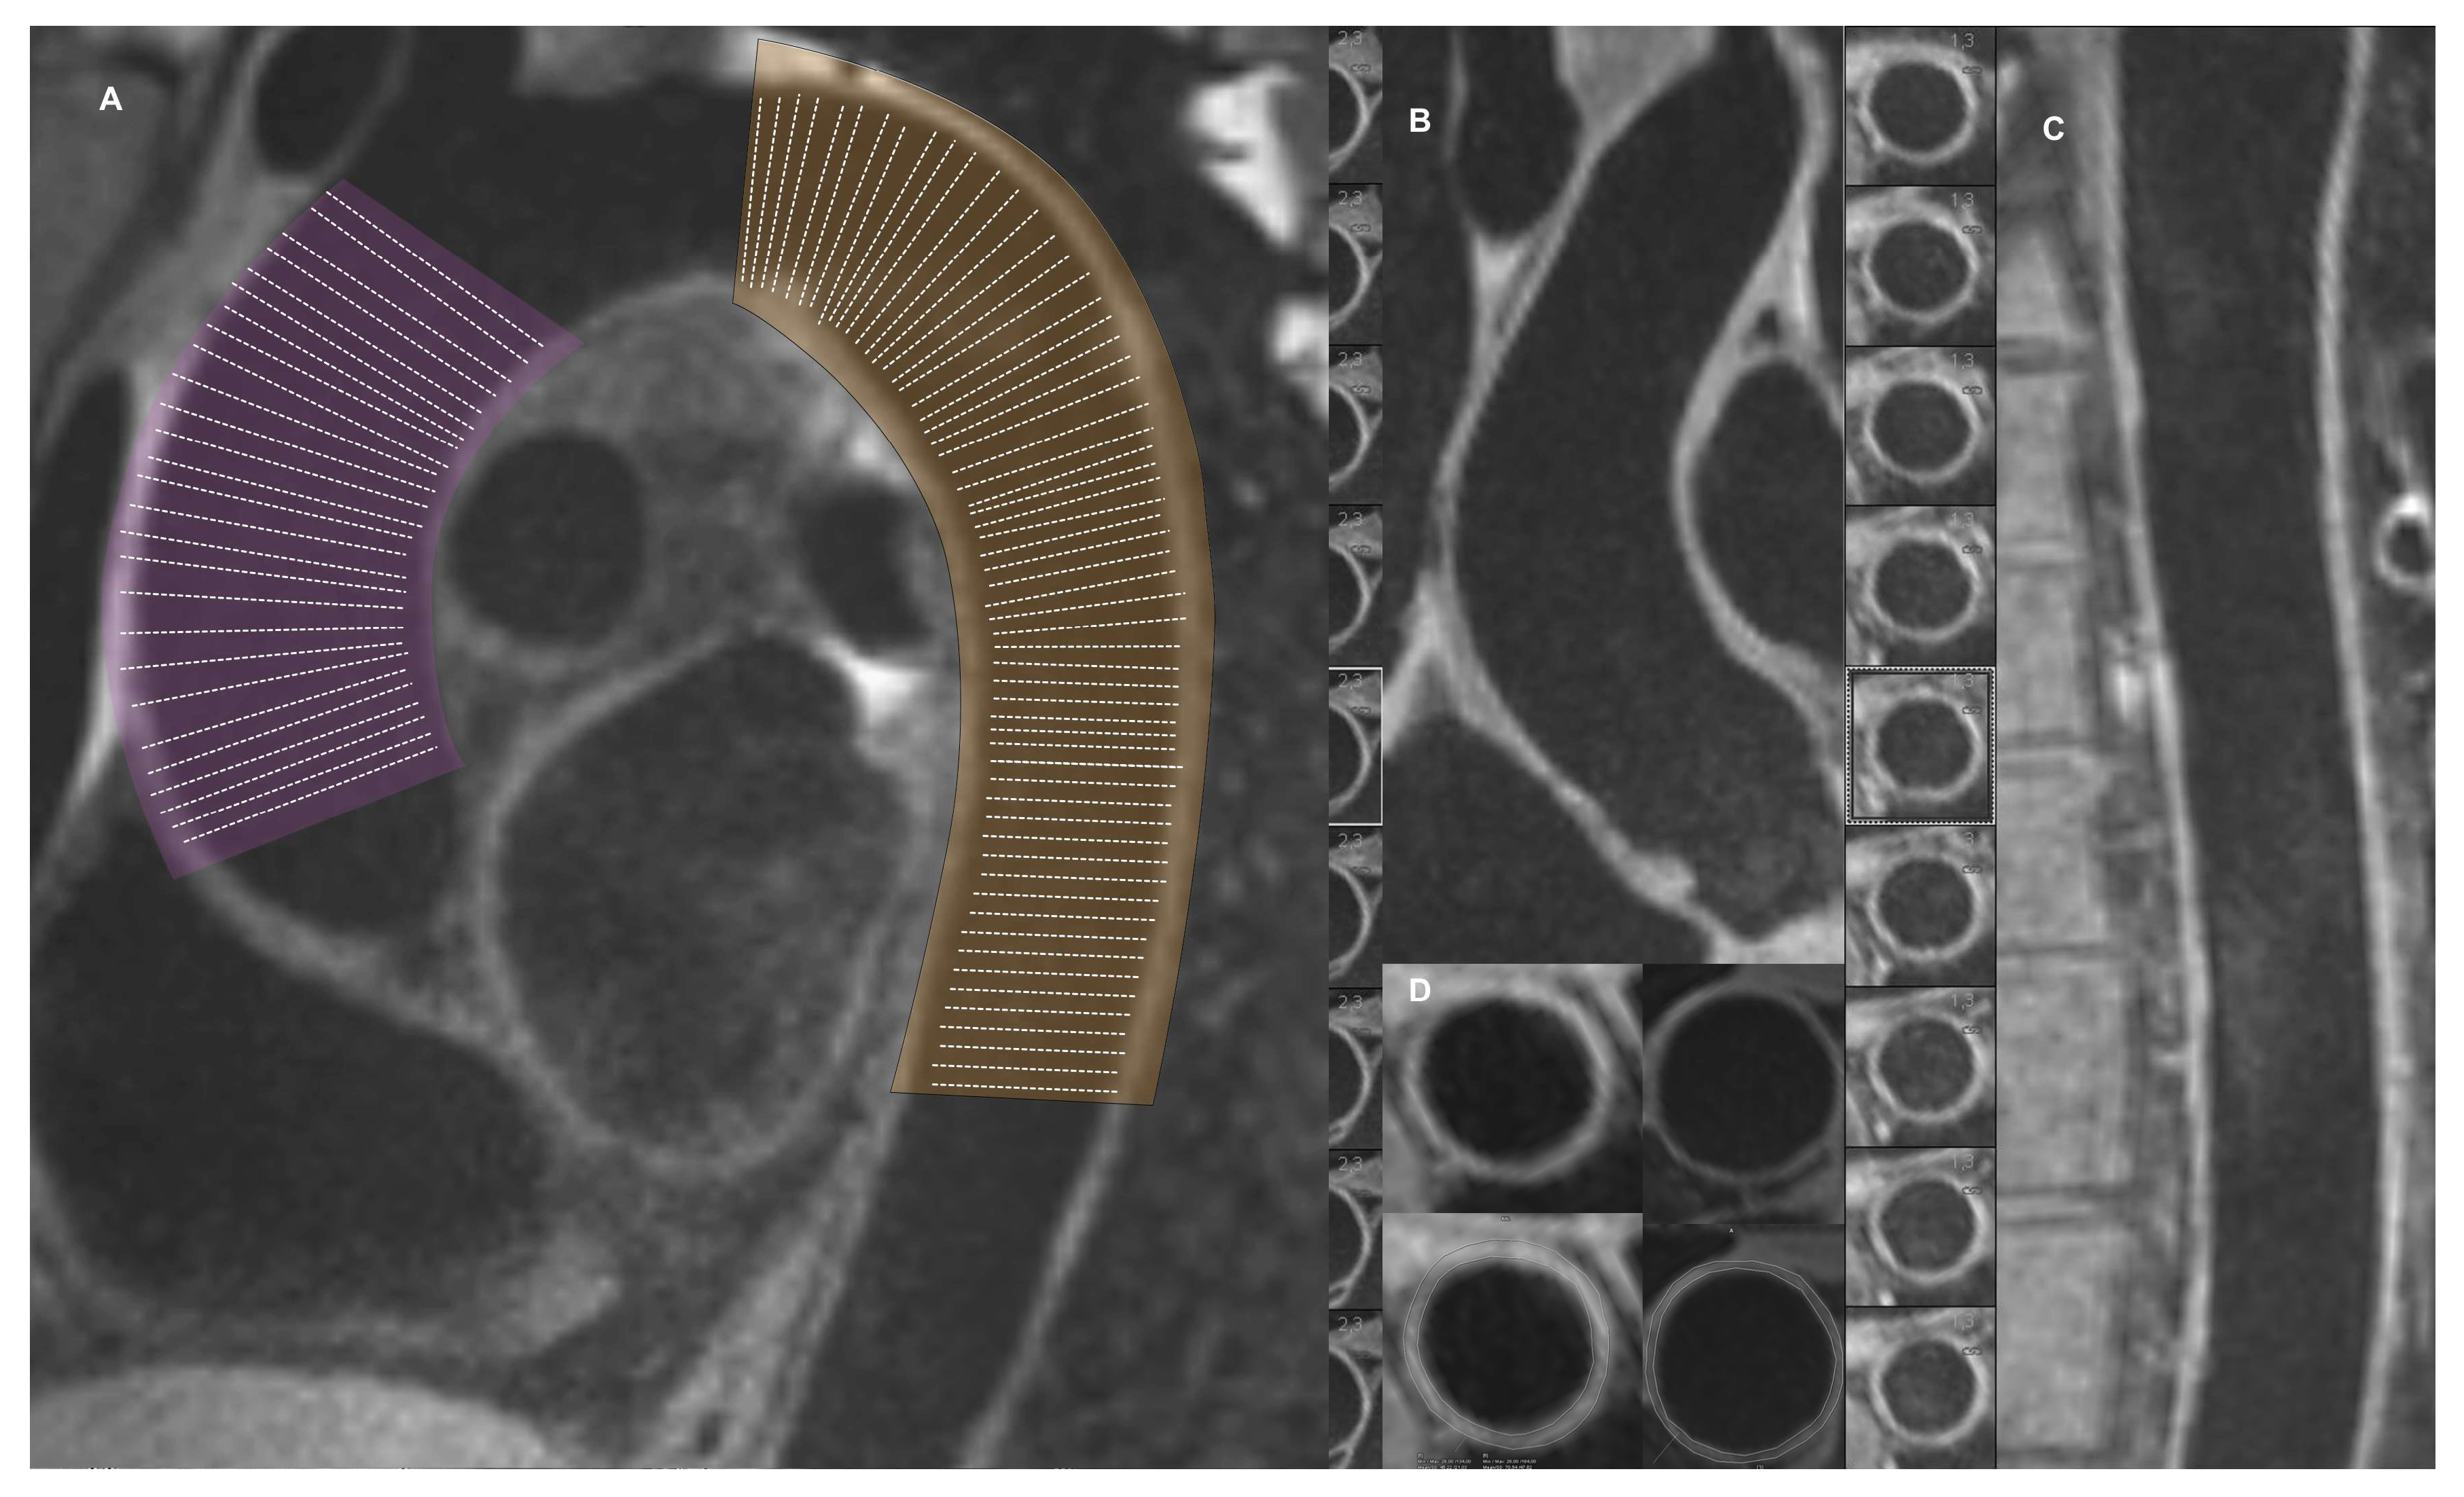
2.2. Cardiovascular Magnetic Resonance
2.3. Computed Tomography
2.4. Carotid Intima Media Thickness
2.5. Statistical Analysis
3. Results
4. Discussion
Limitations of the Study
5. Conclusions
Supplementary Materials
Author Contributions
Funding
Institutional Review Board Statement
Informed Consent Statement
Data Availability Statement
Conflicts of Interest
References
- Gidding, S.S.; Ann Champagne, M.; de Ferranti, S.D.; Defesche, J.; Ito, M.K.; Knowles, J.W.; McCrindle, B.; Raal, F.; Rader, D.; Santos, R.D.; et al. The Agenda for Familial Hypercholesterolemia. Circulation 2015, 132, 2167–2192. [Google Scholar] [CrossRef] [PubMed]
- Sniderman, A.D.; Glavinovic, T.; Thanassoulis, G. Key Questions About Familial Hypercholesterolemia: JACC Review Topic of the Week. J. Am. Coll. Cardiol. 2022, 79, 1023–1031. [Google Scholar] [CrossRef] [PubMed]
- Khera, A.V.; Won, H.H.; Peloso, G.M.; Lawson, K.S.; Bartz, T.M.; Deng, X.; van Leeuwen, E.M.; Natarajan, P.; Emdin, C.A.; Bick, A.G.; et al. Diagnostic Yield and Clinical Utility of Sequencing Familial Hypercholesterolemia Genes in Patients with Severe Hypercholesterolemia. J. Am. Coll. Cardiol. 2016, 67, 2578–2589. [Google Scholar] [CrossRef]
- Hill, J.S.; Hayden, M.R.; Frohlich, J.; Pritchard, P.H. Genetic and Environmental Factors Affecting the Incidence of Coronary Artery Disease in Heterozygous Familial Hypercholesterolemia. Arterioscler. Thromb. J. Vasc. Biol. 1991, 11, 290–297. [Google Scholar] [CrossRef] [PubMed]
- Khoury, E.; Brisson, D.; Roy, N.; Tremblay, G.; Gaudet, D. Identifying Markers of Cardiovascular Event-Free Survival in Familial Hypercholesterolemia. J. Clin. Med. 2020, 10, 64. [Google Scholar] [CrossRef]
- Harada-Shiba, M. What Arteries Are Affected in Familial Hypercholesterolemia? J. Atheroscler. Thromb. 2019, 26, 1041–1042. [Google Scholar] [CrossRef]
- Coutinho, E.R.; Miname, M.H.; Rocha, V.Z.; Bittencourt, M.S.; Jannes, C.E.; Krieger, J.E.; Pereira, A.C.; Santos, R.D. Cardiovascular Disease Onset in Old People with Severe Hypercholesterolemia. Atherosclerosis 2022, 365, 9–14. [Google Scholar] [CrossRef]
- Nakashima, Y.; Fujii, H.; Sumiyoshi, S.; Wight, T.N.; Sueishi, K. Early Human Atherosclerosis: Accumulation of Lipid and Proteoglycans in Intimal Thickenings Followed by Macrophage Infiltration. Arterioscler. Thromb. Vasc. Biol. 2007, 27, 1159–1165. [Google Scholar] [CrossRef]
- Nakashima, Y.; Wight, T.N.; Sueishi, K. Early Atherosclerosis in Humans: Role of Diffuse Intimal Thickening and Extracellular Matrix Proteoglycans. Cardiovasc. Res. 2008, 79, 14–23. [Google Scholar] [CrossRef]
- Stary, H.C. Lipid and Macrophage Accumulations in Arteries of Children and the Development of Atherosclerosis. Am. J. Clin. Nutr. 2000, 72 (Suppl. S5), 1297s–1306s. [Google Scholar] [CrossRef]
- Schmitz, S.A.; O’Regan, D.P.; Fitzpatrick, J.; Neuwirth, C.; Potter, E.; Tosi, I.; Hajnal, J.V.; Naoumova, R.P. Quantitative 3T MR Imaging of the Descending Thoracic Aorta: Patients with Familial Hypercholesterolemia Have an Increased Aortic Plaque Burden despite Long-Term Lipid-Lowering Therapy. J. Vasc. Interv. Radiol. 2008, 19, 1403–1408. [Google Scholar] [CrossRef] [PubMed]
- Chan, S.K.; Jaffer, F.A.; Botnar, R.M.; Kissinger, K.V.; Goepfert, L.; Chuang, M.L.; O’Donnell, C.J.; Levy, D.; Manning, W.J. Scan Reproducibility of Magnetic Resonance Imaging Assessment of Aortic Atherosclerosis Burden. J. Cardiovasc. Magn. Reson. 2001, 3, 331–338. [Google Scholar] [CrossRef]
- Libby, P.; Ridker, P.M.; Hansson, G.K. Progress and Challenges in Translating the Biology of Atherosclerosis. Nature 2011, 473, 317–325. [Google Scholar] [CrossRef] [PubMed]
- Raggi, P. Coronary Calcium on Electron Beam Tomography Imaging as a Surrogate Marker of Coronary Artery Disease. Am. J. Cardiol. 2001, 87 (Suppl. S1), 27–34. [Google Scholar] [CrossRef] [PubMed]
- Witteman, J.C.M.; Kannel, W.B.; Wolf, P.A.; Grobbee, D.E.; Hofman, A.; D’Agostino, R.B.; Cobb, J.C. Aortic Calcified Plaques and Cardiovascular Disease (the Framingham Study). Am. J. Cardiol. 1990, 66, 1060–1064. [Google Scholar] [CrossRef]
- Chmara, M.; Wasag, B.; Zuk, M.; Kubalska, J.; Wegrzyn, A.; Bednarska-Makaruk, M.; Pronicka, E.; Wehr, H.; Defesche, J.C.; Rynkiewicz, A.; et al. Molecular Characterization of Polish Patients with Familial Hypercholesterolemia: Novel and Recurrent LDLR Mutations. J. Appl. Genet. 2010, 51, 95–106. [Google Scholar] [CrossRef] [PubMed]
- Galaska, R.; Kulawiak-Galaska, D.; Wegrzyn, A.; Wasag, B.; Chmara, M.; Borowiec, J.; Studniarek, M.; Fijalkowski, M.; Rynkiewicz, A.; Gruchala, M. Assessment of Subclinical Atherosclerosis Using Computed Tomography Calcium Scores in Patients with Familial and Nonfamilial Hypercholesterolemia. J. Atheroscler. Thromb. 2016, 23, 588–595. [Google Scholar] [CrossRef]
- Gałąska, R.; Kulawiak-Gałąska, D.; Chmara, M.; Chlebus, K.; Mickiewicz, A.; Rynkiewicz, A.; Wasąg, B.; Studniarek, M.; Fijałkowski, M.; Gruchała, M. Carotid Intima-Media Thickness (IMT) in Patients with Severe Familial and Non-Familial Hypercholesterolemia: The Effect of Measurement Site on the IMT Correlation with Traditional Cardiovascular Risk Factors and Calcium Scores. Cardiol. J. 2021, 28, 271–278. [Google Scholar] [CrossRef]
- Rallidis, L.; Naoumova, R.P.; Thompson, G.R.; Nihoyannopoulos, P. Extent and Severity of Atherosclerotic Involvement of the Aortic Valve and Root in Familial Hypercholesterolaemia. Heart 1998, 80, 583. [Google Scholar] [CrossRef]
- Summers, R.M.; Andrasko-Bourgeois, J.; Feuerstein, I.M.; Hill, S.C.; Jones, E.C.; Busse, M.K.; Wise, B.; Bove, K.E.; Rishforth, B.A.; Tucker, E.; et al. Evaluation of the Aortic Root by MRI: Insights from Patients with Homozygous Familial Hypercholesterolemia. Circulation 1998, 98, 509–518. [Google Scholar] [CrossRef]
- Alonso, R.; Mata, N.; Castillo, S.; Fuentes, F.; Saenz, P.; Muñiz, O.; Galiana, J.; Figueras, R.; Diaz, J.L.; Gomez-Enterría, P.; et al. Cardiovascular Disease in Familial Hypercholesterolaemia: Influence of Low-Density Lipoprotein Receptor Mutation Type and Classic Risk Factors. Atherosclerosis 2008, 200, 315–321. [Google Scholar] [CrossRef] [PubMed]
- Caballero, P.; Alonso, R.; Rosado, P.; Mata, N.; Fernández-Friera, L.; Jiménez-Borreguero, L.J.; Badimon, L.; Mata, P. Detection of Subclinical Atherosclerosis in Familial Hypercholesterolemia Using Non-Invasive Imaging Modalities. Atherosclerosis 2012, 222, 468–472. [Google Scholar] [CrossRef] [PubMed]
- Sharifi, M.; Higginson, E.; Bos, S.; Gallivan, A.; Harvey, D.; Li, K.W.; Abeysekera, A.; Haddon, A.; Ashby, H.; Shipman, K.E.; et al. Greater Preclinical Atherosclerosis in Treated Monogenic Familial Hypercholesterolemia vs. Polygenic Hypercholesterolemia. Atherosclerosis 2017, 263, 405–411. [Google Scholar] [CrossRef]
- Nakashima, Y.; Chen, Y.-X.; Kinukawa, N.; Sueishi, K. Distributions of Diffuse Intimal Thickening in Human Arteries: Preferential Expression in Atherosclerosis-Prone Arteries from an Early Age. Virchows Arch. 2002, 441, 279–288. [Google Scholar] [CrossRef] [PubMed]
- Wentzel, J.J.; Corti, R.; Fayad, Z.A.; Wisdom, P.; Macaluso, F.; Winkelman, M.O.; Fuster, V.; Badimon, J.J. Does Shear Stress Modulate Both Plaque Progression and Regression in the Thoracic Aorta? Human Study Using Serial Magnetic Resonance Imaging. J. Am. Coll. Cardiol. 2005, 45, 846–854. [Google Scholar] [CrossRef]
- McGill, H.C.; McMahan, C.A.; Zieske, A.W.; Sloop, G.D.; Walcott, J.V.; Troxclair, D.A.; Malcom, G.T.; Tracy, R.E.; Oalmann, M.C.; Strong, J.P. Associations of Coronary Heart Disease Risk Factors with the Intermediate Lesion of Atherosclerosis in Youth. The Pathobiological Determinants of Atherosclerosis in Youth (PDAY) Research Group. Arterioscler. Thromb. Vasc. Biol. 2000, 20, 1998–2004. [Google Scholar] [CrossRef]
- Danese, C.; Vestri, A.R.; D’Alfonso, V.; Deriu, G.; Dispensa, S.; Baldini, R.; Ambrosino, M.; Colotto, M. Do Hypertension and Diabetes Mellitus Influence the Site of Atherosclerotic Plaques? Clin. Ter. 2006, 157, 9–13. [Google Scholar]
- Kathiresan, S.; Larson, M.G.; Keyes, M.J.; Polak, J.F.; Wolf, P.A.; D’Agostino, R.B.; Jaffer, F.A.; Clouse, M.E.; Levy, D.; Manning, W.J.; et al. Assessment by Cardiovascular Magnetic Resonance, Electron Beam Computed Tomography, and Carotid Ultrasonography of the Distribution of Subclinical Atherosclerosis Across Framingham Risk Strata. Am. J. Cardiol. 2007, 99, 310–314. [Google Scholar] [CrossRef]
- Anagnostis, P.; Vaitsi, K.; Mintziori, G.; Goulis, D.G.; Mikhailidis, D.P. Non-Coronary Atherosclerotic Cardiovascular Disease in Patients with Familial Hypercholesterolaemia. Curr. Med. Res. Opin. 2020, 36, 731–740. [Google Scholar] [CrossRef]
- Oikonomou, E.K.; Marwan, M.; Desai, M.Y.; Mancio, J.; Alashi, A.; Centeno, E.H.; Thomas, S.; Herdman, L.; Kotanidis, C.P.; Thomas, K.E.; et al. Non-Invasive Detection of Coronary Inflammation Using Computed Tomography and Prediction of Residual Cardiovascular Risk (the CRISP CT Study): A Post-Hoc Analysis of Prospective Outcome Data. Lancet 2018, 392, 929–939. [Google Scholar] [CrossRef]
- Khera, A.V.; Hegele, R.A. What Is Familial Hypercholesterolemia, and Why Does It Matter? Circulation 2020, 141, 1760–1763. [Google Scholar] [CrossRef] [PubMed]
- Eland-Bonenfant, S.B.; Paquette, M.; Fantino, M.; Bourque, L.; Saint-Pierre, N.; Baass, A.; Bernard, S. Montreal-FH-SCORE Predicts Coronary Artery Calcium Score in Patients With Familial Hypercholesterolemia. CJC Open 2021, 3, 41–47. [Google Scholar] [CrossRef] [PubMed]

| FH n = 60 | NFH n = 30 | p Value | |
|---|---|---|---|
| Age (years) | 52.3 ± 9.60 | 52.5 ± 7.90 | ns |
| Gender | 29M 31F | 14M 16F | ns |
| BSA (m2) | 1.92 ± 0.21 | 1.89 ± 0.22 | ns |
| TC max (mgL/dL) | 353 ± 71.4 | 313 ± 29.7 | <0.01 |
| LDL-C max § (mgL/dL) | 266 ± 63.4 | 223 ± 26.8 | <0.001 |
| HDL-C max § (mgL/dL) | 59.7 ± 15.1 | 62.9 ± 13.3 | ns |
| TG max § (mgL/dL) | 130 ± 73.8 | 119 ± 47.1 | ns |
| Chol-year score (mg/dL/year) | 17,660 ± 4811 | 16,620 ± 3666 | 0.04 |
| TC (mgL/dL) | 280 ± 55.11 | 282 ± 55.1 | ns |
| LDL-C (mgL/dL) | 202 ± 73.6 | 197 ± 48.2 | ns |
| HDL-C (mgL/dL) | 56.9 ± 14.3 | 58.4 ± 11.3 | ns |
| TG (mgL/dL) | 118 ± 48.6 | 122 ± 44.9 | ns |
| SBP (mmHg) | 137 ± 16.6 | 133 ± 15.3 | ns |
| DBP (mmHg) | 88.0 ± 9.70 | 83.2 ± 9.80 | 0.03 |
| Smoking ¶ (n) | 20 (33%) | 16 (53%) | ns |
| Statin treatment on 1st visit (n) | 33 (58%) | 12 (50%) | ns |
| N = 90 | aAWAI Odds Ratio (±95% CI) | p Value | dAWAI Odds Ratio (±95% CI) | p Value |
|---|---|---|---|---|
| Age | 1.08 (1.02–1.15) | 0.006 | 1.08 (1.02–1.15) | 0.009 |
| FH | 16.6 (3.44–83.5) | 0.001 | 17.9 (3.63–88.2) | 0.001 |
| FH | NFH | p Value | ||
|---|---|---|---|---|
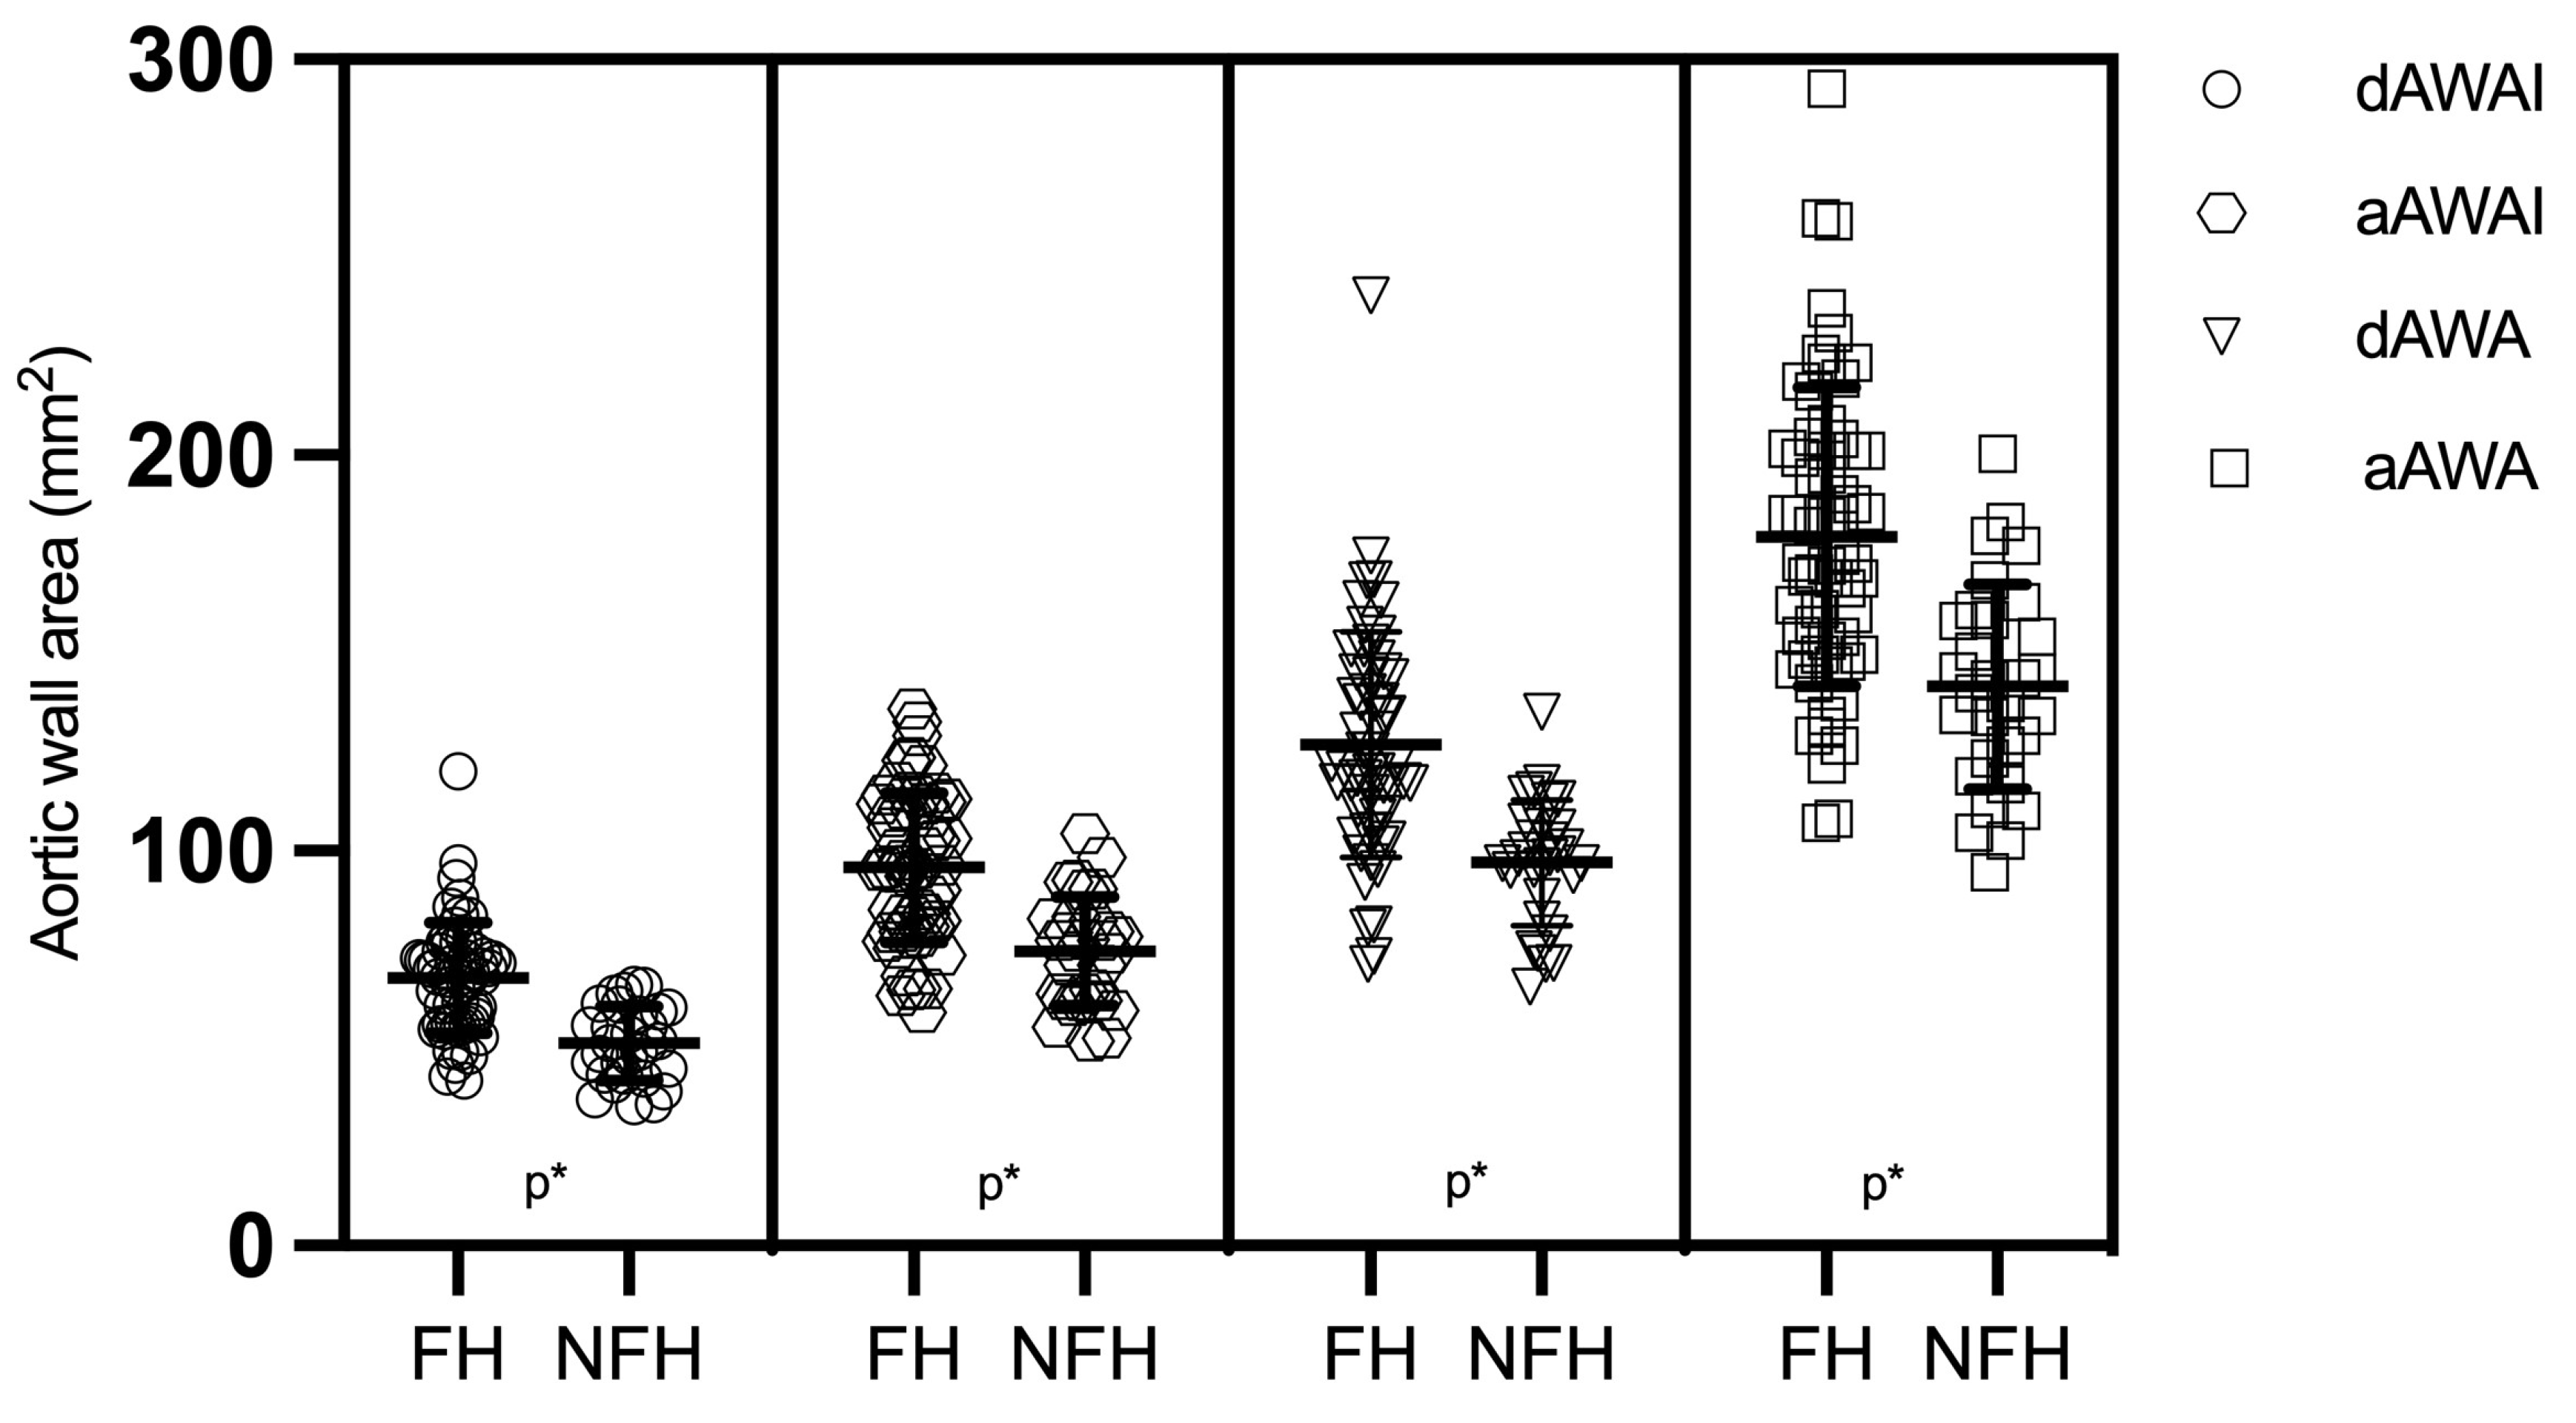
| aAWAI (mm2) | mean ± SD T2 | 95.7 ± 19.7 | 74.7 ± 13.5 | 0.001 |
| 97.6 | ||||
| dAWAI (mm2) | mean ± SD T2 | 67.8 ± 14.1 | 51.9 ± 9.8 | 0.001 |
| 68.2 | ||||
| cIMT (mm) | mean ± SD T2 | 0.73 ± 0.19 | 0.66 ± 0.12 | 0.03 |
| 0.74 | ||||
| CCS (mm3) | median mean ± SD T2 | 5.5 60.5 ± 166.2 | 3 32.9 ± 87.8 | ns |
| 20 | ||||
| TCSasc (mm3) | median mean ± SD T2 | 2 32.3 ± 61.9 | 0 4.8 ± 10.6 | 0.005 |
| 15 | ||||
| TCSdsc (mm3) | median mean ± SD T2 | 0 17.7 ± 58.3 | 0 9.5 ± 19.8 | ns |
| NA | ||||
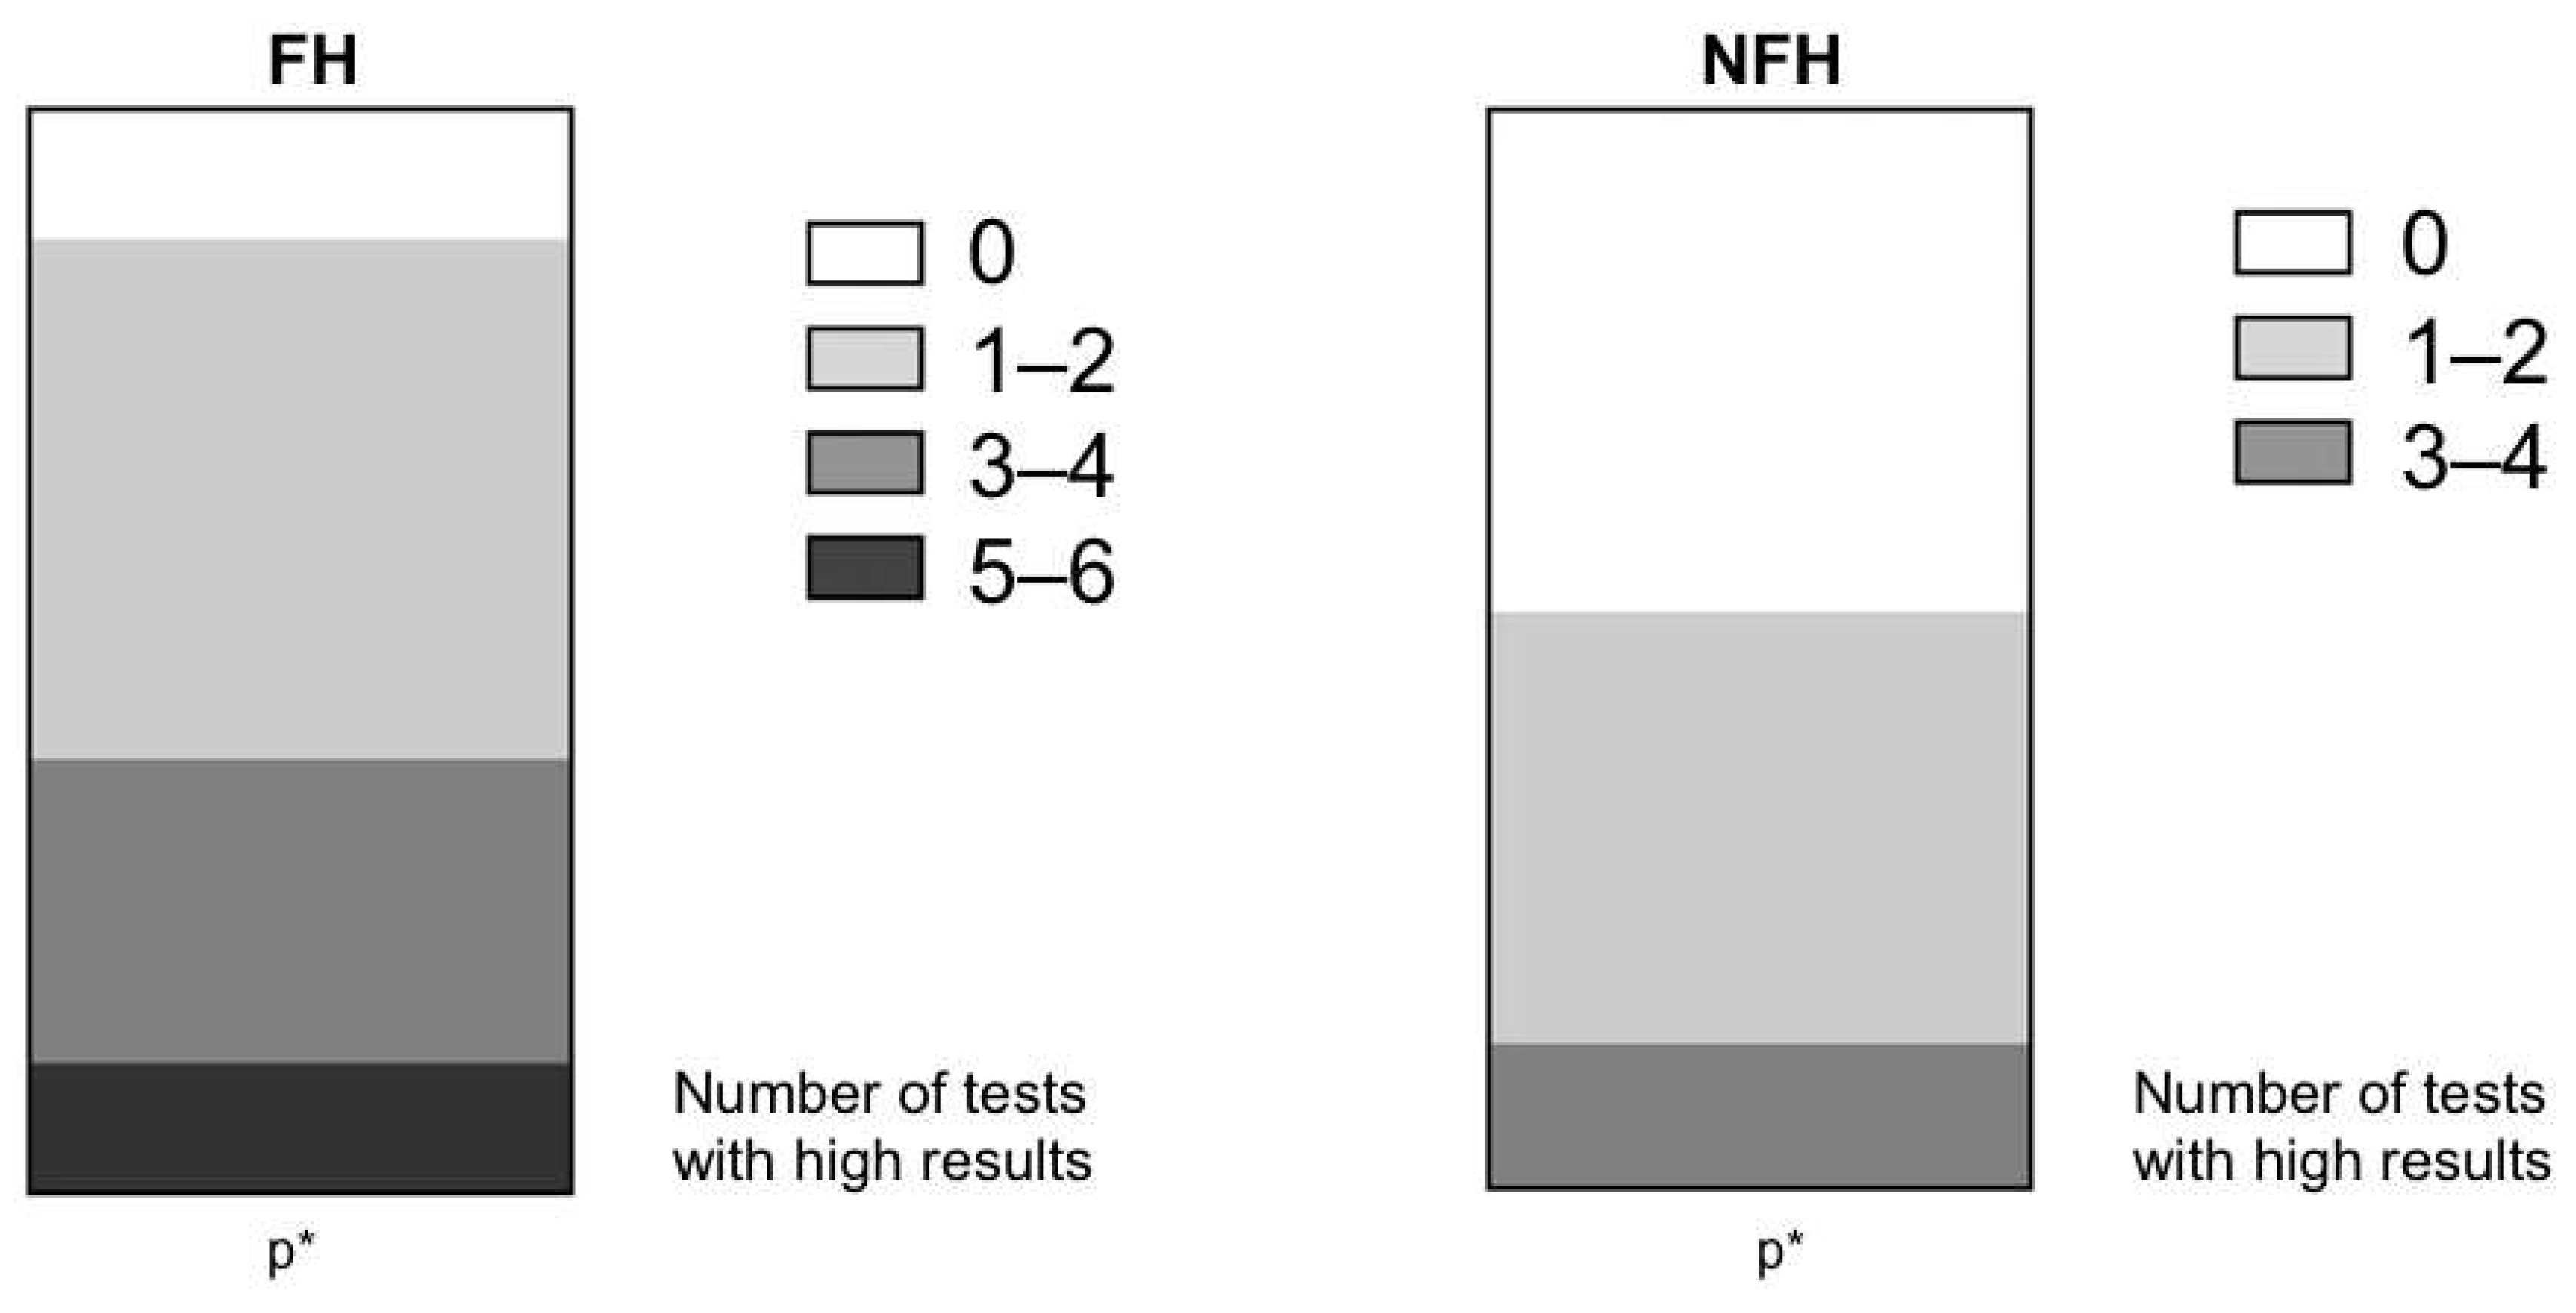
| Proportion of High Atherosclerosis Results (%) | FH (n = 60) | NFH (n = 30) | p Value |
|---|---|---|---|
| dAWAI | 48.3 (29/60) | 6.7 (1/30) | <0.001 |
| aAWAI | 46.7 (28/60) | 6.7 (2/30) | <0.001 |
| cIMT | 38.0 (23/60) | 23.3(7/39) | ns |
| TCSdsc | 25.0 (15/60) | 26.7 (8/30) | ns |
| TCSacs | 41.7 (25/60) | 16.7 (5/30) | <0.001 |
| CCS | 36.7 (22/60) | 26.7 (8/30) | ns |
Disclaimer/Publisher’s Note: The statements, opinions and data contained in all publications are solely those of the individual author(s) and contributor(s) and not of MDPI and/or the editor(s). MDPI and/or the editor(s) disclaim responsibility for any injury to people or property resulting from any ideas, methods, instructions or products referred to in the content. |
© 2023 by the authors. Licensee MDPI, Basel, Switzerland. This article is an open access article distributed under the terms and conditions of the Creative Commons Attribution (CC BY) license (https://creativecommons.org/licenses/by/4.0/).
Share and Cite
Gałąska, R.; Kulawiak-Gałąska, D.; Dorniak, K.; Stróżyk, A.; Sabisz, A.; Chmara, M.; Wasąg, B.; Mickiewicz, A.; Rynkiewicz, A.; Fijałkowski, M.; et al. Aortic Wall Thickness as a Surrogate for Subclinical Atherosclerosis in Familial and Nonfamilial Hypercholesterolemia: Quantitative 3D Magnetic Resonance Imaging Study and Interrelations with Computed Tomography Calcium Scores, and Carotid Ultrasonography. J. Clin. Med. 2023, 12, 5589. https://doi.org/10.3390/jcm12175589
Gałąska R, Kulawiak-Gałąska D, Dorniak K, Stróżyk A, Sabisz A, Chmara M, Wasąg B, Mickiewicz A, Rynkiewicz A, Fijałkowski M, et al. Aortic Wall Thickness as a Surrogate for Subclinical Atherosclerosis in Familial and Nonfamilial Hypercholesterolemia: Quantitative 3D Magnetic Resonance Imaging Study and Interrelations with Computed Tomography Calcium Scores, and Carotid Ultrasonography. Journal of Clinical Medicine. 2023; 12(17):5589. https://doi.org/10.3390/jcm12175589
Chicago/Turabian StyleGałąska, Rafał, Dorota Kulawiak-Gałąska, Karolina Dorniak, Aneta Stróżyk, Agnieszka Sabisz, Magdalena Chmara, Bartosz Wasąg, Agnieszka Mickiewicz, Andrzej Rynkiewicz, Marcin Fijałkowski, and et al. 2023. "Aortic Wall Thickness as a Surrogate for Subclinical Atherosclerosis in Familial and Nonfamilial Hypercholesterolemia: Quantitative 3D Magnetic Resonance Imaging Study and Interrelations with Computed Tomography Calcium Scores, and Carotid Ultrasonography" Journal of Clinical Medicine 12, no. 17: 5589. https://doi.org/10.3390/jcm12175589