Abstract
In echocardiography, peak strain dispersion (PSD) is the standard deviation of the time to peak longitudinal strain for each left ventricular (LV) segment during systole. It assesses the coordination and synchrony of LV segment contractility. Global work efficiency (GWE) and global wasted work (GWW) quantify LV myocardial work and, if impaired, the coupling between LV systolic contraction and early relaxation. Isovolumetric relaxation (IVRT) measures the duration of initial LV relaxation, while the ratio of early diastolic recoil to systolic excursion (E′VTI/S′VTI) describes systolic–diastolic coupling. We evaluated these parameters in 69 healthy subjects and found that PSD correlated negatively with GWE (r = −0.49, p < 0.0001) and E′VTI/S′VTI (r = −0.44, p = 0.0002), but positively with GWW (r = 0.4, p = 0.0007) and IVRT (r = 0.53, p < 0.0001). GWE correlated negatively with GWW (r = −0.94, p < 0.0001) and IVRT (r = −0.30, p = 0.0127), but positively with E′VTI/S′VTI (r = 0.3, p = 0.0132). In addition, E′VTI/S′VTI was negatively correlated with GWW (r = −0.35, p = 0.0032) and IVRT (r = −0.36, p = 0.0024). These associations remained significant after adjustment for sex, age and LV mass index of the subjects. In conclusion, there is an interaction between measures of LV asynchrony, myocardial work, diastolic function and its systolic–diastolic coupling in middle-aged healthy subjects. The clinical value of these interactions requires further investigation.
1. Introduction
As assessed by speckle-tracking echocardiography (STE), global longitudinal peak systolic strain (GLPSS) can detect early myocardial systolic dysfunction even when the left ventricular ejection fraction (LVEF) remains normal [1]. STE has significant clinical value in various patients, for instance, after myocardial infarction, with heart failure, cardiomyopathies, hypertension or diabetes. Other demonstrated uses of STE include identifying patients at risk of developing heart failure, guiding treatment decisions, assessing heart failure severity, monitoring treatment response and predicting the risk of sudden cardiac death [2,3,4,5,6,7,8].
Peak strain dispersion (PSD) represents the standard deviation of the time-to-peak longitudinal strain for each left ventricular (LV) segment over the entire cardiac cycle [2]. It evaluates how myocardial segment contractility is or is not coordinated and synchronized throughout LV systole. Higher PSD values show larger variability and worse contractile synchronicity of various LV segments. PSD is increased in patients with diabetes or hypertension, after myocardial infarction, regardless of the normal GLPSS and LVEF [9,10]. Its clinical utility has also been demonstrated in patients following myocardial infarction and heart failure. PSD may help to identify the severity of heart failure and predict the risk of death or hospitalization [11,12].
LV pressure–strain loops are used to assess the myocardium by several parameters. Global work efficiency (GWE) and global wasted work (GWW) are two commonly used examples [1,13,14,15]. Myocardial work indices also quantify LV systolic function and its abnormalities and reflect global LV systolic function [1,13,14]. However, GWE and GWW are sensitive to late systolic dysfunction due to delayed contraction of some LV segments. Such LV segments do not contribute to blood ejection into the aorta as they continue to contract after aortic valve closure in the early phases of LV diastole. As GWE and GWW depend on phenomena occurring during systole and diastole, both indices are markers of the temporal bridging and interaction between both phases of the cardiac cycle.
Abnormal GWW and GWE have been reported in cardiac patients [15,16,17,18,19], for instance, an additional prognostic value of myocardial work parameters following acute myocardial infarction. Lower GWE at 1 month after myocardial infarction was independently associated with higher major event rates. At the same time, GWE < 91% identified patients at higher risk of myocardial infarction. GWW and GWE were correlated with age, body mass index, systolic blood pressure, smoking history and left ventricular ejection fraction (LVEF) in diabetic patients [20].
Afterload is the pressure the LV must exert to eject blood during contraction. Changes in afterload affect stroke volume and end-systolic and end-diastolic volumes and pressures. The LV isovolumetric relaxation time (IVRT) is the first LV diastolic parameter that afterload may modify [21,22,23]. Both PSD and myocardial work indices are time-dependent. Delayed contractility of certain LV segments should increase PSD and GWW and reduce GWE. As they cover the transitory zone between systole and diastole, i.e., mostly isometric relaxation, both indices might quantify the coupling between LV systolic contraction and the earliest diastole phase.
Tissue Doppler measures tissue velocities of LV segments in different places, for example, at the level of septal and lateral parts of the mitral annulus during systole and diastole. The velocity time integral for the systolic part (S′VTI) reflects the total upward movement of LV segments toward the apex. In contrast, the velocity integral of the early diastole (E′VTI) quantifies the total downward movement during the early LV filling. The E′VTI/S′VTI ratio is considered an index of LV systolic–diastolic coupling.
LV compliance reflects how easily this ventricle stretches in response to blood filling during early diastole. The nadir of early diastolic tissue Doppler velocity (E′) represents the velocity at which the mitral annulus moves downward during early diastole and how the mitral annulus relaxes. The peak value of the early diastolic mitral valve flow velocity (E) by pulsed-wave Doppler shows the early filling of the LV by blood from the left atrium. The E/E′ ratio is an approximation of the LV filling pressure and thus LV compliance.
The Frank–Starling principle states that the extent to which ventricles are stretched with blood during diastole is related to the force of contraction during systole [24]. In other words, the diastolic function determines systolic performance. Therefore, changes in filling pressure and time, relaxation rate and time, systolic–diastolic coupling and ventricular compliance affect stroke volume and myocardial work. On the other hand, poorer systolic function affects LV diastolic indices, e.g., impaired contractility is associated with poorer compliance, higher filling pressures, etc. Both systole and diastole are important for proper cardiac function.
PSD and GWE are mainly associated with LV systole. GWW can include both LV systole and early diastole. IVRT represents early diastole, while E′VTI/S′VTI combines systole and early diastole beyond IVRT. Mutual associations among these parameters are uncertain. To address this issue, we designed this study to investigate peak strain dispersion in relation to myocardial work indices, IVRT and systolic–diastolic performance in a group of healthy people.
2. Materials and Methods
For the study, we used a set of rules for participants’ screening, selection and enrollment. To identify healthy participants, we used the following criteria:
- No known acute or chronic illness—participants were required to have no documented history of acute or chronic illness;
- Absence of signs and symptoms of acute disease—individuals were assessed for any physical signs or complaints related to underlying disease;
- No chronic medication use, except for oral hormonal contraception in women of reproductive age;
- Smokers were allowed to participate in the study;
- Occasional use of nonsteroid anti-inflammatory drugs for occasional pain relief (e.g., headache) was allowed, except for 48 h before ECG and echocardiography.
All potential participants underwent a comprehensive clinical evaluation consisting of the following components:
- Brachial blood pressure;
- Standard 12-lead ECG recordings were obtained to assess the presence of sinus rhythm and to detect any abnormal findings;
- Transthoracic 2D echocardiography using a GE Vivid E95 platform.
Only good-quality images and cine loops were accepted to accurately measure left ventricular longitudinal strain and myocardial work (MW) during postprocessing. In addition, the following technical requirements were mandatory for all healthy participants: no myocardial contractile abnormalities or clinically significant valvular disease. Participants were not eligible if they had valvular disease with more than mild regurgitation or stenosis. Anthropometric measurements (height, weight) were all made according to standard protocol. Sixty-nine healthy adult volunteers fulfilled all enrollment criteria. All presented sinus rhythm and normal findings on ECG. Brachial blood pressure was acquired by an oscillometric method (705IT, Omron Healthcare Co., Ltd., Kyoto, Japan) in the supine position (mean of three measurements) after 10 min of rest and was <130/80 mmHg.
The University Ethics Committee approved the study protocol. Informed consent was obtained from all participants. The Declaration of Helsinki was followed in the study [25].
2.1. Echocardiography
Transthoracic echocardiography using a commercially available ultrasound system (Vivid E95, GE Healthcare, Horten, Norway) was performed at rest with the subjects in the left lateral recumbent position. All procedures were performed using standard views according to the recommendations of the American Society of Echocardiography [26]. Digital images were stored and transferred to a computer workstation (EchoPAC version 202, GE Healthcare, Horten, Norway) for further offline analysis. Measurements of cardiac chamber dimensions, volumes and wall thickness were collected during diastole and systole. According to the modified Simpson’s rule, LV volumes and LVEF were estimated as the mean value from apical four- and two-chamber views.
The peak value of the mitral valve early diastolic flow velocity (E) was measured with pulsed-wave Doppler. Tissue Doppler was used to obtain the septal and lateral mitral annular systolic (S′) and early diastolic velocities (E′). Velocity time integrals were measured by tracing the systolic signal to measure mitral annulus systolic excursion (S′VTI) and the early diastolic signal to measure early diastolic excursion (E′VTI). These values were then used to calculate average S′ and E′ velocities, E/E′ ratio and E′VTI/S′VTI ratio [27]. IVRT was also measured as the interval between the end of S′ and the beginning of E′ from the same tissue Doppler signal. Measurements were made separately for the septal and lateral segments and then averaged.
Continuous dynamic images optimized for speckle tracking analysis were obtained at apical four-, three- and two-chamber views at a frame rate of at least 60 frames/s. The images were imported into the software dedicated for analysis (EchoPAC version 202). Automatic function imaging was used to automatically track each endocardial and epicardial boundary in the three apical dynamic images, and the region of interest (ROI) was adjusted by correcting the endocardial border or width, if necessary. Peak systolic longitudinal strain was estimated in 6 segments per one view, giving 18 values per patient. The peak strain dispersion (PSD), a synchronization marker of the myocardial contraction in the left ventricle, was calculated. Global longitudinal peak systolic strain (GLPSS) was achieved by averaging over 18 segmental peak systolic longitudinal strain values. Brachial artery pressure was measured before the echocardiographic examination, and GLPSS were used to quantify global LV myocardial work efficiency through the noninvasive LV pressure–strain analysis [15,18,19,28]. In this method, the automated function imaging software creates the LV pressure–strain loop curve adjusted to the duration of isovolumic and ejection phases, defined by mitral and aortic valvular timing events evaluated through 2D echocardiography. The area within the LV pressure–strain loop is used as an index of global myocardial work (GWI). Related indices were then calculated: global constructive work (GCW), an effective work performed during the systolic shortening and isovolumic diastolic myocardial elongation; global wasted work (GWW), which is classified as work not conducted for LV ejection, including systolic myocardial stretching during systole and isovolumic diastolic period shortening; and global myocardial work efficiency (GWE), calculated as the percentage ratio of CGW to the sum of CGW and GWW.
For this study, only one cardiologist (A.M.) experienced in clinical echocardiography acquired all echocardiographic images and cine loops, and performed all postprocessing analyses using EchoPAC. We have tested his intrarater variability for tissue Doppler, GLPSS, MW and other measures, and the observed variability was in the range 3–6%, demonstrating the consistency of the measurements performed.
Figure 1 and Figure 2 show two contrasting examples (a healthy person and a patient after myocardial infarction and left bundle branch block) of STE curves with GLPSS, LVEF and LV pressure–strain loops and results of GWE for all LV segments.
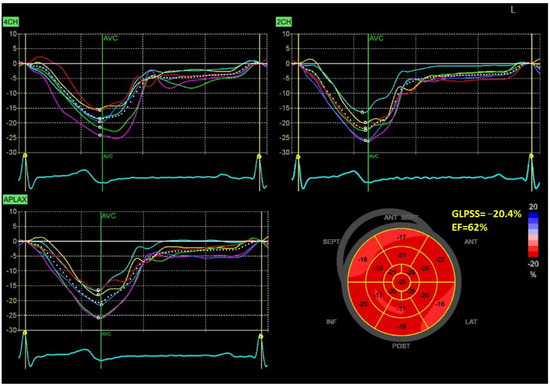
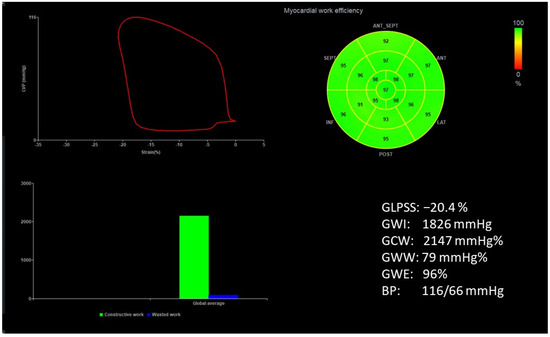
Figure 1.
An example of echocardiography of a 30-year-old healthy male. A set of individual longitudinal strain curves for all segments shown in different colors, with the average curve shown as a white dotted line, a bull’s eye of segmental longitudinal peak systolic strains and a summary of global longitudinal peak systolic strain (GLPSS) are shown in the top panel. The LV pressure–strain loop with the bull’s eye representation of myocardial work efficiency for each of the segments and a summary of all myocardial work indices are shown in the lower panel. Abbreviations: GLPSS—global longitudinal peak systolic strain, EF—ejection fraction, GWI—global myocardial work index, GCW—global constructive work, GWW—global wasted work, GWE—global work efficiency, BP—blood pressure.
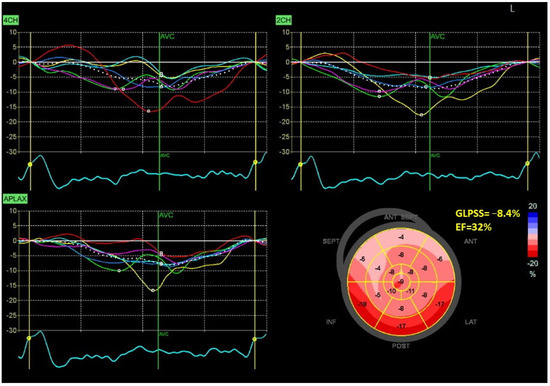
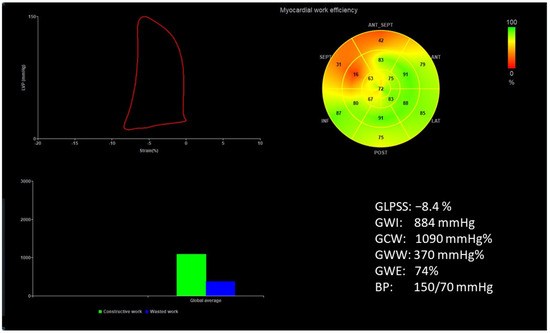
Figure 2.
An example of echocardiography of a 61-year-old man with the left bundle branch block and a history of myocardial infarction. A set of individual longitudinal strain curves for all segments shown in different colors, with the average curve shown as a white dotted line, a bull’s eye of segmental longitudinal peak systolic strains and a summary of global longitudinal peak systolic strain (GLPSS) are shown in the top panel. The LV pressure–strain loop with the bull’s eye representation of myocardial work efficiency for each of the segments and a summary of all myocardial work indices are shown in the lower panel. Abbreviations: GLS—global longitudinal peak systolic strain, EF—ejection fraction, GWI—global myocardial work index, GCW—global constructive work, GWW—global wasted work, GWE—global work efficiency, BP—blood pressure.
2.2. Statistical Analysis
Continuous data had a normal distribution (according to the D’Agostino–Pearson normality test); results are summarized as mean and standard deviation (SD) [29]. Numbers and percentages were used for categorical variables. Pearson correlation was first used to examine the association between peak strain dispersion, myocardial work indices, isovolumetric relaxation and systolic–diastolic coupling of peak strain dispersion. These reciprocal associations were then examined using linear regression models adjusted for sex, age and LVMI. All tests were two-sided. The statistical analyses and graphs were made using JMP Pro 17 (SAS Institute Inc., Cary, NC, USA), and the statistical significance was set at p < 0.05.
3. Results
Sixty-nine healthy subjects were examined (mean age 58 ± 6 years, 39 females). Essential clinical and echocardiographic characteristics are presented in Table 1. Study subjects revealed an average ejection fraction (62 ± 5%), global longitudinal peak systolic strain (GLPSS) of −18 ± 2%, global work efficiency of 94 ± 3%, and peak strain dispersion of 44 ± 12 ms.

Table 1.
Clinical and echocardiographical characteristics of study subjects.
The Interrelations between Descriptors of Strain Dispersion, Myocardial Work, Isovolumetric Relaxation and Systolic–Diastolic Coupling
Table 2 summarizes PSD, GWE, GWE, IVRT and E′VTI/S′VTI correlations. PSD correlated negatively with GWE and E′VTI/S′VTI but positively with GWW and IVRT. GWE correlated negatively with GWW (nearly linearly) and IVRT but positively with E′VTI/S′VTI. Negative correlations were found between E′VTI/S′VTI and GWW or IVRT.
Table 2.
The r coefficients of Pearson’s correlation between PSD, GWW, GWE, IVRT and E′VTI/S′VTI in healthy people. Neither repeated nor identical parameter correlations (X) are shown.
Mutual associations between PSD, GWW, GWE, IVRT and E′VTI/S′VTI are additionally shown in Figure 3, Figure 4 and Figure 5 as linear regressions.
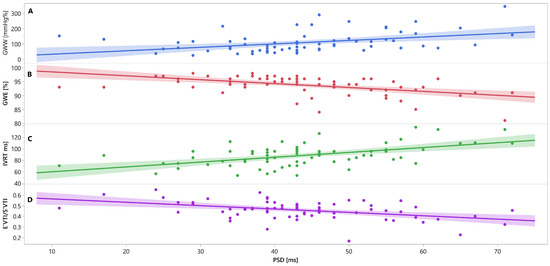
Figure 3.
Linear regression lines for associations between PSD and GWW (panel A, line and points in blue), GWE (panel B, line and points in red), IVRT (panel C, line and points in green), and E′VTI/S′VTI (panel D, line and points in purplein healthy people. Abbreviations: E′VTI/S′VTI—systolic–diastolic coupling, GWW—global wasted work, GWE—global work efficiency, IVRT—isovolumetric relaxation time, PSD—peak systolic dispersion.
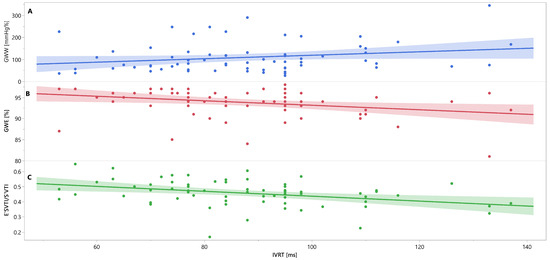
Figure 4.
Linear regression lines for associations between IVRT and GWW (panel A, line and points in blue), GWE (panel B, line and points in red), and E′VTI/S′VTI (panel C, line and points in green) in healthy people. Abbreviations: E′VTI/S′VTI—systolic–diastolic coupling, GWW—global wasted work, GWE—global work efficiency, IVRT—isovolumetric relaxation time.
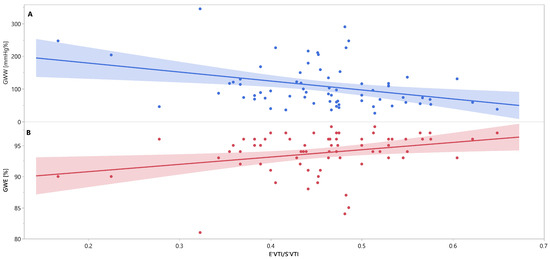
Figure 5.
Linear regression lines for associations between E′VTI/S′VTI and GWW (panel A, line and points in blue), and GWE (panel B, line and points in red) in healthy people. Abbreviations: E′VTI/S′VTI—systolic–diastolic coupling, GWW—global wasted work, GWE—global work efficiency.
Irrespective of participants’ sex, age and LVMI, most reciprocal associations remained statistically significant, as did the Pearson correlation (Table 3.). There was no change in the direction of these associations—negative remained negative, and positive retained positive. Only the associations between IVRT and GWE (or vice versa) became not quite statistically significant (p = 0.0611). The associations between IVRT and GWW were still insignificant for the Pearson correlation.
Table 3.
Linear regression models adjusted for participants’ gender, age and left ventricular mass index showing beta coefficients (slopes of regression lines) and p values for the reciprocal associations between PSD, GWW, GWE, IVRT and E′VTI/S′VTI in healthy people. Independent variables are presented in columns and dependent variables in rows. X represents cases where the same parameter cannot be both a dependent and an independent variable.
4. Discussion
The study found that indices of mechanical dispersion (PSD), myocardial work (GWE and GWW), isovolumetric relaxation (IVRT) and systolic–diastolic coupling (E′VTI/S′VTI) are interrelated in middle-aged healthy subjects. Specifically, worse systolic function (higher PSD and GWW but lower GWE) is associated with longer IVRT and lower E′VTI/S′VTI. It may imply an impaired early diastolic function and ventricular–arterial coupling.
Higher PSD represents increased heterogeneity of LV contraction and is associated with worse GWE, systolic–diastolic coupling (E′VTI/S′VTI), increased GWW and longer IVRT. GWE and GWW are inversely correlated, which is not surprising. The wasted myocardial work increases due to worsened work efficiency. Looking further ahead, longer IVRT translates into an impaired ability of the LV to relax and prepare to be filled with blood from the left atrium. Interestingly, worse GWE and E′VTI/S′VTI are associated with longer IVRT. Finally, E′VTI/S′VTI is impaired when PSD, GWW and IVR increase. Except for the association of IVRT with GWE and GWW, all the associations studied are independent of sex, age and LVMI of healthy subjects.
We conducted the study in healthy people, and the measurements were within normal ranges. Therefore, the diagnosis of systolic and diastolic dysfunction may be inappropriate. Instead, we suggest that if a person has a systolic function that is at the lower end of the normal range, then the diastolic function should also be expected to be reduced.
It was recently shown that in a subgroup of well-controlled diabetic patients, GLPSS was similar to healthy controls, whereas PSD was significantly higher in diabetic patients [9]. Similar findings have been reported in patients with uncomplicated systemic lupus, namely higher PSD and normal GLPSS compared to healthy controls [30]. Surprisingly, there are only sparse data on peak systolic strain dispersion and its correlates in healthy subjects.
PSD reflects whether the peak time of the long-axis strain of the LV myocardium is consistent and more or less uniform throughout all contracting segments. Therefore, a higher PSD translated to LV dyssynchrony. This parameter indicates an early stage of systolic dysfunction in diabetes and hypertension, which may not be detected by other markers such as ejection fraction [9,10]. Seo et al. [31] showed that LVMI was independently associated with LV dyssynchrony, measured as the standard deviation of the mean time-to-peak systolic velocity of 12 middle and basal left ventricular segments.
LV dyssynchrony results in inefficient LV contraction and reduced cardiac output. Myocardial work indices describe the productive and unproductive work of LV segments, i.e., those that contribute to ejection and those that do not. We show that GWW is positively correlated with PSD. In contrast, both PSD and GWW are negatively associated with GWE. These observations suggest that unsynchronized contraction of LV segments, represented by increased PSD, contributes to GWW and is responsible for worsening GWE.
A close relationship between systolic contraction and relaxation (systolic–diastolic coupling) influences global LV performance. E′VTI/S′VTI, a measure of systolic–diastolic coupling, describes the ratio of early diastolic recoil to systolic excursion, as explained by MacNamara et al. [27] with the spring model of LV longitudinal motion. In other words, it shows which part of the systolic movement of the LV base toward the apex is compensated during early diastole. Heart failure patients with preserved LVEF and comparable E′/E or E′ had reduced E′VTI/S′VTI compared to healthy subjects.
We show that E′VTI/S′VTI worsens when both systolic and diastolic function decline (negative correlations with PSD, GWW and IVRT, and positive with GWE). Notably, these associations were still significant after adjustment for sex, age and LVMI of the subjects.
Assessing mechanical dispersion, myocardial work, isovolumetric relaxation and systolic–diastolic coupling can provide complementary information on the global and regional LV function and performance in healthy subjects. All of these parameters have demonstrated clinical value [1,11,12,13,14,15,16,17,18,19,20,27,32,33,34,35,36,37,38,39,40].
4.1. Study’s Limitations
It is important to mention the study’s limitations, which must be addressed in future research. First, it is a medium-sized study conducted only on healthy middle-aged people. Therefore, the results may not apply to other age groups. Second, extrapolating our findings to patients with different diseases, risk factors, conditions and complications may not be justified. Third, this was an observational physiological study. It takes more than observed correlations between different parameters to explain all the physiological mechanisms behind them. We are aware that correlations do not imply causation. A final limitation relates to speckle tracking echocardiography (STE) for analyzing PSD and myocardial work indices.
PSD and GWE or GWW are derived from STE and are based on identifying LV deformation in the longitudinal direction. STE is mainly used to quantify LV systolic function. For GLPSS, the relative change in myocardial length from end-diastole to end-systole is assessed. Any problems in obtaining good quality STE automatically carry over to measurements of PSD and myocardial work indices. Some examples are imperfect tracking of myocardial motion in areas of low echogenicity. This can lead to inaccurate strain measurements in these areas.
Another limiting factor for STE is the dependence on the imaging plane. The myocardium is not a homogeneous structure, and strains can vary in different regions of the myocardium. For STE, and thus PSD, GWE and GWW, strain measurements are typically made in the apical four-, two- and three-chamber views. Although three planes are commonly used, they are not equivalent to real three-dimensional signal acquisition and strain. Some mathematical approximations are introduced that may affect the final results. Also, any inaccuracies in the plane images will affect the final measurement.
Occasionally, it is not possible to obtain good quality images in all three planes—this is often the case in patients with complex cardiac anatomy, obesity, narrow intercostal spaces or atypical heart position in the chest. Other limiting factors associated with STE are more technical, such as the frame rate of the acquired signal, the signal-to-noise ratio, angle dependence and intervendor variability. These factors can limit the accuracy and reproducibility of STE and, therefore, PSD and myocardial work analysis.
Unfortunately, strain measurements are not standardized across different software platforms, which may lead to inconsistent results and interpretation. In our study, we used the same echocardiographic system and performed all measurements using the same postprocessing platform. However, differences between echo system vendors may limit the applicability and generalizability of STE-based findings.
Despite these limitations, STE is a valuable tool for assessing LV function. The technology continues to improve, and PSD and myocardial work are good examples of this progress. Furthermore, many clinical studies have provided evidence for their practical usefulness in all these measures.
4.2. Potential Clinical Implications and Perspectives
We provide new insights into the relationships between mechanical dispersion, myocardial work, isovolumetric relaxation and systolic–diastolic coupling in healthy subjects. These parameters reflect different LV function and performance aspects, such as LV synchrony, efficiency, diastolic relaxation and systolic–diastolic interaction.
Investigation of these relationships may be helpful to understand better the physiology and clinical findings of various cardiac diseases that affect LV function and performance, such as ischemic heart disease, heart failure, cardiomyopathies, valvular heart disease, diabetes, obesity, hypertension or atrial fibrillation. Studying these relationships can also help assess the effects of any drug that directly or indirectly affects the myocardium and cardiac function. Such drugs include typical cardiac medications for hypertension or heart failure and other drugs such as chemotherapy with cardiotoxic effects or antipsychotic/antidepressant treatment with cardiac side effects.
The relationships described can also be studied in patients undergoing cardiac surgery, before and after implantation of cardiac devices, treatment of valvular heart disease and nonpharmacological interventions. Many treatment modalities have an impact on LV function and performance. For example, interventions that correct regional wall motion abnormalities may also improve myocardial work efficiency and reduce wasted work. Implanted cardiac devices optimizing LV synchrony may also improve IVRT and E′VTI/S′VTI.
Nonpharmacological interventions that modify lifestyle or risk factors, such as dietary intervention and increasing physical activity, may also have beneficial effects on PSD, myocardial work, diastolic function, etc. Therefore, these parameters may serve as noninvasive and inexpensive echocardiographic biomarkers to monitor the response and outcome of various therapeutic modalities in patients with impaired LV function and performance.
5. Conclusions
Overall, there is interaction between measures of LV asynchrony, myocardial work, diastolic function and its systolic–diastolic coupling in middle-aged healthy individuals. These parameters provide complementary information on global and regional LV function and performance. How these interactions change in different clinical conditions and whether any treatment can modify them is unknown and deserves further study.
Author Contributions
Conceptualization, A.W.; data curation, A.M. and A.W.; formal analysis, A.W., A.M. and P.G.; funding acquisition, A.W. and P.G.; investigation, A.M., A.S. and A.P.-B.; methodology, A.M., A.W., A.S. and P.G.; project administration, A.M. and A.W.; supervision, A.W. and A.M.; statistical analysis, A.W. and P.G.; writing—original draft A.W., A.M. and A.P.-B.; writing—review and editing, A.W., A.M. and P.G. All authors have read and agreed to the published version of the manuscript.
Funding
This research received no external funding. It was covered by inner research funds of Poznań University of Medical Sciences, Poznań, Poland. The open access article publications charges for this paper were covered by the project “Development of the University Centre for Sports and Medical Studies in Poznan, Poland” (Number: NdS/544750/2021/2022) with Principal Investigator Prof. Przemysław Guzik. The Ministry of Education and Science, Warsaw, Poland, funded the project within the “Science for Society” Program.
Institutional Review Board Statement
The study was conducted in accordance with the Declaration of Helsinki, and approved by the Institutional Ethics Committee of Poznań University School of Medicine (protocol code 398/13, date of approval 9 May 2013.).
Informed Consent Statement
Informed consent was obtained from all subjects involved in the study.
Data Availability Statement
Not applicable.
Conflicts of Interest
The authors declare no conflict of interest.
References
- Minczykowski, A.; Zwanzig, M.; Dziarmaga, M.; Rutkowska, A.; Baliński, M.; Krauze, T.; Guzik, P.; Wykrętowicz, A. First-Phase Left Ventricular Ejection Fraction as an Early Sign of Left Ventricular Dysfunction in Patients with Stable Coronary Artery Disease. J. Clin. Med. 2023, 12, 868. [Google Scholar] [CrossRef]
- Mornos, C.; Muntean, D.; Mornos, A.; Crisan, S.; Petrescu, L.; Ionac, A.; Sosdean, R.; Cozma, D. Risk stratification in patients with heart failure: The value of considering both global longitudinal left ventricular strain and mechanical dispersion. Can. J. Physiol. Pharmacol. 2017, 95, 1360–1368. [Google Scholar] [CrossRef]
- Pignatelli, R.H.; Ghazi, P.; Reddy, S.C.; Thompson, P.; Cui, Q.; Castro, J.; Okcu, M.F.; Jefferies, J.L. Abnormal Myocardial Strain Indices in Children Receiving Anthracycline Chemotherapy. Pediatr. Cardiol. 2015, 36, 1610–1616. [Google Scholar] [CrossRef] [PubMed]
- Pastore, M.C.; Mandoli, G.E.; Contorni, F.; Cavigli, L.; Focardi, M.; D’Ascenzi, F.; Patti, G.; Mondillo, S.; Cameli, M. Speckle Tracking Echocardiography: Early Predictor of Diagnosis and Prognosis in Coronary Artery Disease. Biomed. Res. Int. 2021, 2021, 6685378. [Google Scholar] [CrossRef]
- Mandoli, G.E.; Borrelli, C.; Cameli, M.; Mondillo, S.; Ghiadoni, L.; Taddei, C.; Passino, C.; Emdin, M.; Giannoni, A. Speckle tracking echocardiography in heart failure development and progression in patients with apneas. Heart Fail. Rev. 2022, 27, 1869–1881. [Google Scholar] [CrossRef]
- Pastore, M.C.; De Carli, G.; Mandoli, G.E.; D’Ascenzi, F.; Focardi, M.; Contorni, F.; Mondillo, S.; Cameli, M. The prognostic role of speckle tracking echocardiography in clinical practice: Evidence and reference values from the literature. Heart Fail. Rev. 2021, 26, 1371–1381. [Google Scholar] [CrossRef] [PubMed]
- Bandera, F.; Baghdasaryan, L.; Mandoli, G.E.; Cameli, M. Multimodality imaging predictors of sudden cardiac death. Heart Fail. Rev. 2020, 25, 427–446. [Google Scholar] [CrossRef] [PubMed]
- Cameli, M.; Mandoli, G.E.; Sciaccaluga, C.; Mondillo, S. More than 10 years of speckle tracking echocardiography: Still a novel technique or a definite tool for clinical practice? Echocardiography 2019, 36, 958–970. [Google Scholar] [CrossRef]
- Li, C.; Yuan, M.; Li, K.; Bai, W.; Rao, L. Value of peak strain dispersion in discovering left ventricular dysfunction in diabetes mellitus. Sci. Rep. 2020, 8, 21437. [Google Scholar] [CrossRef] [PubMed]
- de Andrade Hygidio, D.; Le Bihan, D.; Batista Souza, J.; Bellio de Matos Barettto, R.; Mathias, W., Jr.; de Sousa, M. Evaluation of myocardial work in patients with resistant arterial hypertension. Echocardiography 2022, 39, 1412–1419. [Google Scholar] [CrossRef]
- Iwahashi, N.; Kirigaya, J.; Gohbara, M.; Abe, T.; Horii, M.; Hanajima, Y.; Toya, N.; Takahashi, H.; Kirigaya, H.; Minamimoto, Y.; et al. Mechanical dispersion combined with global longitudinal strain estimated by three dimensional speckle tracking in patients with ST elevation myocardial infarction. Int. J. Cardiol. Heart Vasc. 2022, 40, 101028. [Google Scholar] [CrossRef]
- Haugaa, K.H.; Grenne, B.L.; Eek, C.H.; Ersbøll, M.; Valeur, N.; Svendsen, J.H.; Florian, A.; Sjøli, B.; Brunvand, H.; Køber, L.; et al. Strain echocardiography improves risk prediction of ventricular arrhythmias after myocardial infarction. JACC Cardiovasc. Imaging 2013, 6, 841–850. [Google Scholar] [CrossRef] [PubMed]
- Dziarmaga, M.; Minczykowski, A.; Zwanzig, M.; Krauze, T.; Rutkowska, A.; Morawski, J.; Baliński, M.; Piskorski, J.; Guzik, P.; Wykrętowicz, A. Influence of increased arterial stiffness on myocardial work efficiency in patients with stable coronary artery disease. Kardiol. Pol. 2021, 79, 196–198. [Google Scholar] [CrossRef] [PubMed]
- Cebrowska, K.; Minczykowski, A.; Krauze, T.; Guzik, P.; Szczepanik, A.; Wykrętowicz, A. The pressure-strain work indices in response to isometric handgrip exercise. Kardiol. Pol. 2021, 79, 455–457. [Google Scholar] [CrossRef] [PubMed]
- Russell, K.; Eriksen, M.; Aaberge, L.; Wilhelmsen, N.; Skulstad, H.; Remme, E.W.; Haugaa, K.H.; Opdahl, A.; Fjeld, J.G.; Gjesdal, O.; et al. A novel clinical method for quantification of regional left ventricular pressure-strain loop area: A noninvasive index of myocardial work. Eur. Heart J. 2012, 33, 724–733. [Google Scholar] [CrossRef] [PubMed]
- Meucci, M.C.; Butcher, S.C.; Galloo, X.; van der Velde, E.T.; Marsan, N.A.; Bax, J.J.; Delgado, V. Noninvasive left ventricular myocardial work in patients with chronic aortic regurgitation and preserved left ventricular ejection fraction. J. Am. Soc. Echocardiogr. 2022, 35, 703–711.e3. [Google Scholar] [CrossRef] [PubMed]
- Einarsen, E.; Hjertaas, J.J.; Gu, H.; Matre, K.; Chowienczyk, P.J.; Gerdts, E.; Chambers, J.B.; Saeed, S. Impact of arterio-ventricular interaction on first-phase ejection fraction in aortic stenosis. Eur. Heart J. Cardiovasc. Imaging 2021, 22, 650–657. [Google Scholar] [CrossRef] [PubMed]
- Papadopoulos, K.; Tok, Ö.Ö.; Mitrousi, K.; Ikonomidis, I. Myocardial work: Methodology and clinical applications. Diagnostics 2021, 11, 573. [Google Scholar] [CrossRef] [PubMed]
- Roemer, S.; Jaglan, A.; Santos, D.; Umland, M.; Jain, R.; Tajik, A.J.; Khandheria, B.K. The utility of myocardial work in clinical practice. J. Am. Soc. Echocardiogr. 2021, 34, 807–818. [Google Scholar] [CrossRef] [PubMed]
- Lustosa, R.P.; Butcher, S.C.; van der Bijl, P.; El Mahdiui, M.; Montero-Cabezas, J.M.; Kostyukevich, M.V.; Rocha De Lorenzo, A.; Knuuti, J.; Ajmone Marsan, N.; Bax, J.J.; et al. Global Left Ventricular Myocardial Work Efficiency and Long-Term Prognosis in Patients After ST-Segment-Elevation Myocardial Infarction. Circ. Cardiovasc. Imaging 2021, 14, e012072. [Google Scholar] [CrossRef]
- Nagueh, S.F.; Smiseth, O.A.; Appleton, C.P.; Byrd, B.F., III; Dakainish, H.; Edvardsen, T.; Flachskampf, F.A.; Gillebert, T.C.; Klein, A.L.; Lancellotti, P.; et al. Recommendations for the evaluation of left ventricular diastolic function by echocardiography: An update from the American Society of Echocardiography and the European Association of Cardiovascular Imaging. Eur. Heart J. Cardiovasc. Imaging 2016, 17, 1321–1360. [Google Scholar] [CrossRef] [PubMed]
- Johnson, A.; Ahrens, T. Stroke volume optimization: The new hemodynamic algorithm. Crit. Care Nurse 2015, 35, 11–27. [Google Scholar] [CrossRef]
- Yamamoto, K. The time constant of left ventricular relaxation: Extrication from load dependence and overestimation of functional abnormality. Circ. Heart Fail. 2010, 3, 178–180. [Google Scholar] [CrossRef] [PubMed][Green Version]
- O’Rourke, M.F. Starling’s law of the heart: An appraisal 70 years on. Aust. N. Z. J. Med. 1984, 14, 879–887. [Google Scholar] [CrossRef]
- Sawicka-Gutaj, N.; Gruszczyński, D.; Guzik, P.; Mostowska, A.; Walkowiak, J. Publication ethics of human studies in the light of the Declaration of Helsinki—A mini-review. JMS 2022, 91, e700. [Google Scholar] [CrossRef]
- Mitchell, C.; Rahko, P.S.; Blauwet, L.A.; Canaday, B.; Finstuen, J.A.; Foster, M.C.; Horton, K.; Ogunyankin, K.O.; Palma, R.A.; Velazquez, E.J. Guidelines for Performing a Comprehensive Transthoracic Echocardiographic Examination in Adults: Recommendations from the American Society of Echocardiography. J. Am. Soc. Echocardiogr. 2019, 32, 1–64. [Google Scholar] [CrossRef]
- MacNamara, J.P.; Koshti, V.; Dias, K.A.; Howden, E.; Hearon, C.M., Jr.; Cheng, I.-J.; Hynan, L.S.; Levine, B.D.; Sarma, S. The impact of cardiac loading on a novel metric of left ventricular diastolic function in healthy middle-aged adults: Systolic-diastolic coupling. Physiol. Rep. 2021, 9, e15129. [Google Scholar] [CrossRef]
- Boe, E.; Skulstad, H.; Smiseth, O.A. Myocardial work by echocardiography: A novel method ready for clinical testing. Eur. Heart J. Cardiovasc. Imaging 2019, 20, 18–20. [Google Scholar] [CrossRef]
- Guzik, P.; Więckowska, B. Data distribution analysis—A preliminary approach to quantitative data in biomedical research. J. Med. Sci. 2023, 92, e869. [Google Scholar] [CrossRef]
- Li, C.; Li, K.; Yuan, M.; Bai, W.; Ra, L. Peak strain dispersion within the left ventricle detected by two-dimensional speckle tracking in patients with uncomplicated systemic lupus erythematosus. Int. J. Cardiovasc. Imaging 2021, 37, 2197–2205. [Google Scholar] [CrossRef]
- Seo, H.-S.; Cho, Y.-H.; Choi, J.H.; Suh, J.; Lee, N.-H.; Lim, O.K. The association of left ventricular hypertrophy with intraventricular dyssynchrony at rest and during exercise in hypertensive patients. J. Cardiovasc. Ultrasound 2012, 20, 174–180. [Google Scholar] [CrossRef] [PubMed]
- Michalik, J.; Dąbrowska-Kugacka, A.; Kosmalska, K.; Moroz, R.; Kot, A.; Lewicka, E.; Szolkiewicz, M. Hemodynamic Effects of Permanent His Bundle Pacing Compared to Right Ventricular Pacing Assessed by Two-Dimensional Speckle-Tracking Echocardiography. Int. J. Environ. Res. Public Health 2021, 18, 11721. [Google Scholar] [CrossRef]
- Ji, X.; Zhang, X.; Feng, H. Evaluation of left ventricular systolic synchrony by peak strain dispersion in patients with rheumatoid arthritis. J. Int. Med. Res. 2021, 49, 3000605211007737. [Google Scholar] [CrossRef] [PubMed]
- Jaglan, A.; Roemer, S.; Perez Moreno, A.C.; Khandheria, B.K. Myocardial work in Stage 1 and 2 hypertensive patients. Eur. Heart J. Cardiovasc. Imaging 2021, 22, 744–750. [Google Scholar] [CrossRef] [PubMed]
- Manganaro, R.; Marchetta, S.; Dulgheru, R.; Ilardi, F.; Sugimoto, T.; Robinet, S.; Cimino, S.; Go, Y.Y.; Bernard, A.; Kacharava, G.; et al. Echocardiographic reference ranges for normal non-invasive myocardial work indices: Results from the EACVI NORRE study. Eur. Heart J. Cardiovasc. Imaging 2019, 20, 582–590. [Google Scholar] [CrossRef] [PubMed]
- Hedwig, F.; Nemchyna, O.; Stein, J.; Knosalla, C.; Merke, N.; Knebel, F.; Hagendorff, A.; Schoenrath, F.; Falk, V.; Knierim, J. Myocardial Work Assessment for the Prediction of Prognosis in Advanced Heart Failure. Front. Cardiovasc. Med. 2021, 8, 691611. [Google Scholar] [CrossRef]
- Biering-Sørensen, T.; Mogelvang, R.; Jensen, J.S. Prognostic value of cardiac time intervals measured by tissue Doppler imaging M-mode in the general population. Heart 2015, 101, 954–960. [Google Scholar] [CrossRef]
- Tan, C.; Rubenson, D.; Srivastava, A.; Mohan, R.; Smith, M.R.; Billick, K.; Bardarian, S.; Thomas Heywood, J. Left ventricular outflow tract velocity time integral outperforms ejection fraction and Doppler-derived cardiac output for predicting outcomes in a select advanced heart failure cohort. Cardiovasc. Ultrasound 2017, 15, 18. [Google Scholar] [CrossRef]
- Capone, C.A.; Lamour, J.M.; Lorenzo, J.; Tria, B.; Ye, K.; Hsu, D.T.; Mahgerefteh, J. Ventricular Arterial Coupling: A Novel Echocardiographic Risk Factor for Disease Progression in Pediatric Dilated Cardiomyopathy. Pediatr. Cardiol. 2019, 40, 330–338. [Google Scholar] [CrossRef] [PubMed]
- Friedberg, M.K.; Margossian, R.; Lu, M.; Mercer-Rosa, L.; Henderson, H.T.; Nutting, A.; Friedman, K.; Molina, K.M.; Altmann, K.; Canter, C.; et al. Pediatric Heart Network Investigators. Systolic-diastolic functional coupling in healthy children and in those with dilated cardiomyopathy. J. Appl. Physiol. 2016, 120, 1301–1318. [Google Scholar] [CrossRef] [PubMed]


Disclaimer/Publisher’s Note: The statements, opinions and data contained in all publications are solely those of the individual author(s) and contributor(s) and not of MDPI and/or the editor(s). MDPI and/or the editor(s) disclaim responsibility for any injury to people or property resulting from any ideas, methods, instructions or products referred to in the content. |
© 2023 by the authors. Licensee MDPI, Basel, Switzerland. This article is an open access article distributed under the terms and conditions of the Creative Commons Attribution (CC BY) license (https://creativecommons.org/licenses/by/4.0/).