Article

Inverted U-Shaped Relationship between Obesity Parameters and Bone Mineral Density in Korean Adolescents

1
School of Artificial Intelligence Convergence, Hallym University, Chuncheon 24253, Republic of Korea
2
Division of Endocrinology and Metabolism, Department of Internal Medicine, Chuncheon Sacred Heart Hospital, Chuncheon 24253, Republic of Korea
*
Authors to whom correspondence should be addressed.
J. Clin. Med. 2023, 12(18), 5869; https://doi.org/10.3390/jcm12185869
Submission received: 1 August 2023 / Revised: 29 August 2023 / Accepted: 7 September 2023 / Published: 9 September 2023
(This article belongs to the Section Epidemiology & Public Health)

Abstract

:
As the association between obesity and bone health remains controversial in children and adolescents, we investigate the effects of obesity parameters on bone mineral density (BMD) in 2060 Korean adolescents who participated in the 2008–2011 Korea National Health and Nutrition Examination Survey (KNHANES). Multiple regression analysis and analysis of covariance (ANCOVA) were conducted to examine both the linear and non-linear associations between total-body-less-head (TBLH) BMD and four obesity parameters: body mass index, waist circumference, waist-to-height ratio, and total-body fat mass (FM). In a multiple linear regression analysis adjusted for age, menarcheal status (in females only), and total-body lean mass, there was no significant linear association between obesity parameters and TBLH BMD, except for total-body FM in males. However, upon adding a second-order polynomial term for each obesity parameter, a significant quadratic relationship between all obesity parameters and TBLH BMD was observed, with the corresponding quadratic term being negative. The results of ANCOVA also revealed an inverted U-shaped relationship between each obesity parameter and TBLH BMD. Our findings suggest the existence of an optimal range of obesity parameters for developing or maintaining optimal bone health in Korean Adolescents. Deviation from this range, in either direction (being underweight or having obesity), may compromise bone health.

1. Introduction

Both obesity and osteoporosis are serious global health concerns that are experiencing a rise in prevalence, leading to substantial impacts on mortality and morbidity [1,2,3,4,5]. Not only in adults but also in children and adolescents, the worldwide prevalence of obesity has been steadily increasing for several decades [6,7,8]. Childhood obesity tends to persist into adulthood and is linked to cardo-metabolic and psychosocial comorbidity as well as premature mortality [9,10,11]. Being overweight or obese is associated with the development of various musculoskeletal problems, ranging from general discomfort and pain in the joints and muscles to more severe injuries such as fractures, even during childhood [12,13]. The association between obesity and musculoskeletal disorders highlights the importance of addressing body composition and promoting optimal bone health from an early age to minimize the risk of these complications.
Adolescence is characterized by dramatic changes in body composition that significantly influence bone health [14]. It is well-known that childhood and adolescence are crucial periods for skeletal development and maturation, with approximately half of peak bone mass being attained in childhood and nearly all of adult bone mass being achieved by the end of adolescence [15]; therefore, the amount of bone mass accrued during these periods is a major determinant of the adult’s risk for osteoporosis [16]. Recognizing the significance of this developmental phase and understanding how aspects of body composition, such as obesity, influence bone mineral accrual is essential for promoting optimal bone health and reducing the risk of fractures later in life.
Recently, there has been growing concern regarding the impact of obesity or excessive fat mass (FM) on bone development in children and adolescents; however, it remains controversial whether obesity has a beneficial or detrimental effect on the growing skeleton, with conflicting and inconclusive findings from studies. While some studies have reported positive associations between obesity parameters and bone health [17,18,19,20,21,22], others have found negative associations [23,24,25,26,27,28,29]. There is also evidence indicating no significant association between obesity and bone health in children and adolescents [30,31,32,33,34]. Positive associations emphasize the risk of being underweight, whereas negative associations highlight the risk related to being overweight or obese. We tested the hypothesis that both underweight and overweight/obesity can have detrimental impacts on bone health, thus, prompting the exploration of potential non-linear relationships between obesity and bone health.
The objective of this study was to investigate the impact of obesity on bone development in Korean adolescents aged 10–19 years. Obesity was assessed using four indicators: body mass index (BMI), waist circumference (WC), waist-to-height ratio (WHtR), and total-body FM. We examined the linear relationship between each obesity parameter and total-body-less-head (TBLH) bone mineral density (BMD), separately for males and females, while controlling for age, menarcheal status (in females only), and total-body lean mass (LM). Moreover, we explored the possibility of a quadratic relationship between each obesity parameter and TBLH BMD. By considering the potential non-linear associations, our study contributes to the current understanding in this field.

2. Materials and Methods

2.1. Study Population

The study population consisted of 2060 Korean adolescents, including 1114 males and 946 females, aged 10–19 years, who were selected from the Korea National Health and Nutrition Examination Survey (KNHANES) conducted between 2008 and 2011. KNHANES is a nationwide, population-based, cross-sectional survey conducted by the Korea Disease Control and Prevention Agency (KDCA) since 1998. It utilizes a stratified, multistage, clustered probability sampling method to select a representative sample of the non-institutionalized civilian Korean population. The survey was approved by the Institutional Review Board of the KDCA (approval codes: 2008-04EXP-01-C, 2009-01CON-03-2C, 2010-02CON-21-C, 2011-02CON-06-C), and all participants provided written informed consent.
For the present study, we included teenagers who completed body composition and bone examinations. Out of 5105 teenagers who participated in the 2008–2011 KNHANES, we excluded those who did not undergo body composition and bone examinations, as well as those who had missing physical measurements or who did not respond to self-reported questionnaires about menstruation. The total number of participants in the analysis was 2060.

2.2. Measurements

Body composition and bone parameters were measured by DXA using a DISCOVERY-W fan beam densitometer (Hologic Inc., Waltham, MA, USA) according to standard procedures. The total body mass is composed of LM, FM, and bone mass. In this study, TBLH BMD was used to evaluate bone health. TBLH BMD was chosen instead of total-body BMD to minimize the impact of the skull and teeth on BMD measurements, which can lead to inaccurate results [35]. This is particularly important in studies that involve children and adolescents, as their heads are proportionally larger than those of adults, and differences in head size can significantly affect BMD measurements [36]. TBLH measurements are widely used for relative comparisons of bone density and are particularly suitable for populations with obesity or underweight, where TBLH measurements provide more accurate results than total-body measurements [37].
Anthropometric variables such as body weight, height, and WC were measured in this study. Participants were instructed to wear light clothing and remove their shoes during weight measurements, which were recorded to the nearest 0.1 kg. Height measurements were taken to the nearest 0.1 cm using a wall-mounted stadiometer. WC was measured to the nearest 0.1 cm at the midpoint between the lower border of the rib cage and the iliac crest. BMI was calculated by dividing the weight in kilograms by the square of the height in meters. WHtR was calculated by dividing WC in centimeters by the height in centimeters.
Obesity was assessed using four measures of obesity: BMI, WC, WHtR, and total-body FM. Based on each of these obesity parameters, subjects were categorized into four percentile groups: underweight (<5th percentile), normal-weight (5th–85th percentile), overweight (86th–94th percentile), and obesity (≥95th percentile). The BMI percentile groups were stratified based on the 2007 Korea National Growth Charts [38], considering gender and age (Supplementary Tables S1 and S2). This stratification followed the recommendations set forth by the United States Centers for Disease Control and Prevention (CDC) Growth Reference for children and adolescents aged 2 to 20 years [39]. The percentile groups of WC, WHtR, and total-body FM were determined using the observed sample distributions in the study, separately for males and females (Supplementary Table S3).
Pubertal development was assessed through self-reported questionnaires, which included inquiries about the presence or absence of menstruation and the onset of menarche. These assessments were used to determine the pubertal stage of female participants.

2.3. Statistical Analysis

The study population characteristics were presented as means and standard deviations (SD) for the study variables and compared between genders using a t-test for two independent samples. To evaluate the differences in mean values of TBLH BMD among the four percentile groups of each obesity parameter (BMI, WC, WHtR, and total-body FM) separately for males and females, one-way analysis of variance (ANOVA) was performed.
Multiple regression analysis was conducted to examine the linear relationship between each obesity parameter and TBLH BMD while controlling for age, menarcheal status (for females only), and total-body LM. However, if there is a curved relationship between the obesity parameter and TBLH BMD, then a linear model may not be the best fit. Therefore, the possibility of a curvilinear relationship between each obesity parameter and TBLH BMD was explored by incorporating a second-order polynomial term for each obesity parameter (BMI2, WC2, WHtR2, or FM2) into the regression model. For example, the statistical model used to examine the quadratic effect of BMI on TBLH BMD, characterized by a single turning point, is as follows:
TBLH BMD = β0 + (β1 × Age) + (β2 × LM) + (β3 × BMI) + (β4 × BMI2) + ε
where β0 = intercept
  • β1 × Age = linear effect of Age
  • β2 × LM = linear effect of total-body LM
  • β3 × BMI = linear effect of BMI
  • β4 × BMI2 = quadratic effect of BMI
This modeling approach allows us to directly investigate whether a quadratic effect of BMI on TBLH BMD exists, with the coefficient β4 and its statistical significance. In terms of interpretation, a positive quadratic coefficient indicates a ∪-shaped curve, whereas a negative coefficient indicates a ∩-shaped curve. To assess for a significant quadratic trend in the means of TBLH BMD across percentile groups for each obesity parameter, while adjusting for the covariates, analysis of covariance (ANCOVA) was used, and the results were reported graphically.
The IBM SPSS Statistics for Windows (Version 27; IBM Corp., Armonk, NY, USA) was used for data analysis. All statistical tests were two-sided, and p-values less than 0.05 were considered statistically significant.

3. Results

3.1. Characteristics of Study Population

Table 1 presents the characteristics of the study population, including the means of the study variables stratified by gender. The study comprised 2060 adolescent subjects, with 1114 males and 946 females, and mean ages of 14.17 and 14.28 years, respectively. Except for age and percent bone mass means, all other variables exhibited statistically significant differences between males and females. Females exhibited significantly higher values for two FM-related variables (FM and percent FM), while males had significantly higher values for other obesity, body composition, and TBLH bone parameters.

3.2. Age-Related Changes in TBLH BMD, Total-Body LM, and Total-Body FM

In this study, we observed age-related changes in mean values of TBLH BMD, total-body LM, and total-body FM. Figure 1 depicts the age-related changes in the means and 95% confidence intervals (CI) of TBLH BMD, total-body LM, and total-body FM, separately by gender (refer to Supplementary Table S4 for sample distribution according to age groups, separately for males and females). The findings indicate that the age-related changes in mean TBLH BMD exhibited a pattern similar to the changes in mean total-body LM, rather than the changes in mean total-body FM. The mean values of TBLH BMD increased with age in both males and females but the rate of increase was more prominent in males, particularly after the age of 14. Consequently, the mean TBLH BMD values between males and females were not significantly different from ages 10 to 13 but males had significantly higher values than females from ages 14 to 19 (Supplementary Table S5). Regarding the mean values of total-body LM, males showed a continuous increase from ages 10 to 19, while females experienced relatively stable levels after the age of 14. On the other hand, the mean values of total-body FM in females continued to increase from ages 10 to 19, while in males, there was no significant increase after the age of 12. As a result, females had significantly higher mean values of total-body FM than males from ages 13 to 19 (Supplementary Table S5).

3.3. Crude Relationship between Obesity Parameters and TBLH BMD

The unadjusted relationship between obesity parameters (BMI, WC, WHtR, and total-body FM) and TBLH BMD was examined using correlation and simple regression analysis by gender, as shown in Figure 2. Each obesity parameter exhibited a positive linear association with TBLH BMD in both males and females (all p-values < 0.001). The proportion of variance in TBLH BMD explained by the different obesity parameters as follows: BMI explained 22.4% and 28.5% in males and females, respectively; WC explained 27.6% and 29.9%; WHtR explained 1.3% and 10.2%; and total-body FM explained 6.0% and 25.6%. In addition, the mean values of TBLH BMD were compared among four percentile groups (<5th percentile, underweight; 5th–85th percentile, normal-weight; 86th–94th percentile, overweight; ≥95th percentile, obesity) stratified on the basis of each obesity parameter (refer to Supplementary Table S6 for the mean comparison of age among four percentile groups). Except for WHtR in males, there was a significant linear trend for the means of TBLH BMD to increase across the percentile groups of each obesity parameter in both males and females (Supplementary Table S7).

3.4. Linear Relationship between Obesity Parameters and TBLH BMD

Table 2 presents the results of multiple regression analysis separately by gender, adjusted for age, menarcheal status (in females only), and total-body lean mass. There was no significant linear association between TBLH BMD and the obesity parameters, except for total-body FM in males, which showed a significant negative association with TBLH BMD. In all models, age and total-body LM were positively related to TBLH BMD, with total-body LM demonstrating the highest explanatory power in terms of the largest partial R. Furthermore, females who had started menstruation had higher TBLH BMD than those who had not, assuming all other conditions were the same. The models for males explained 73.5% to 73.8% of the variance in TBLH BMD, while the models for females accounted for about 60.8% of the variance.

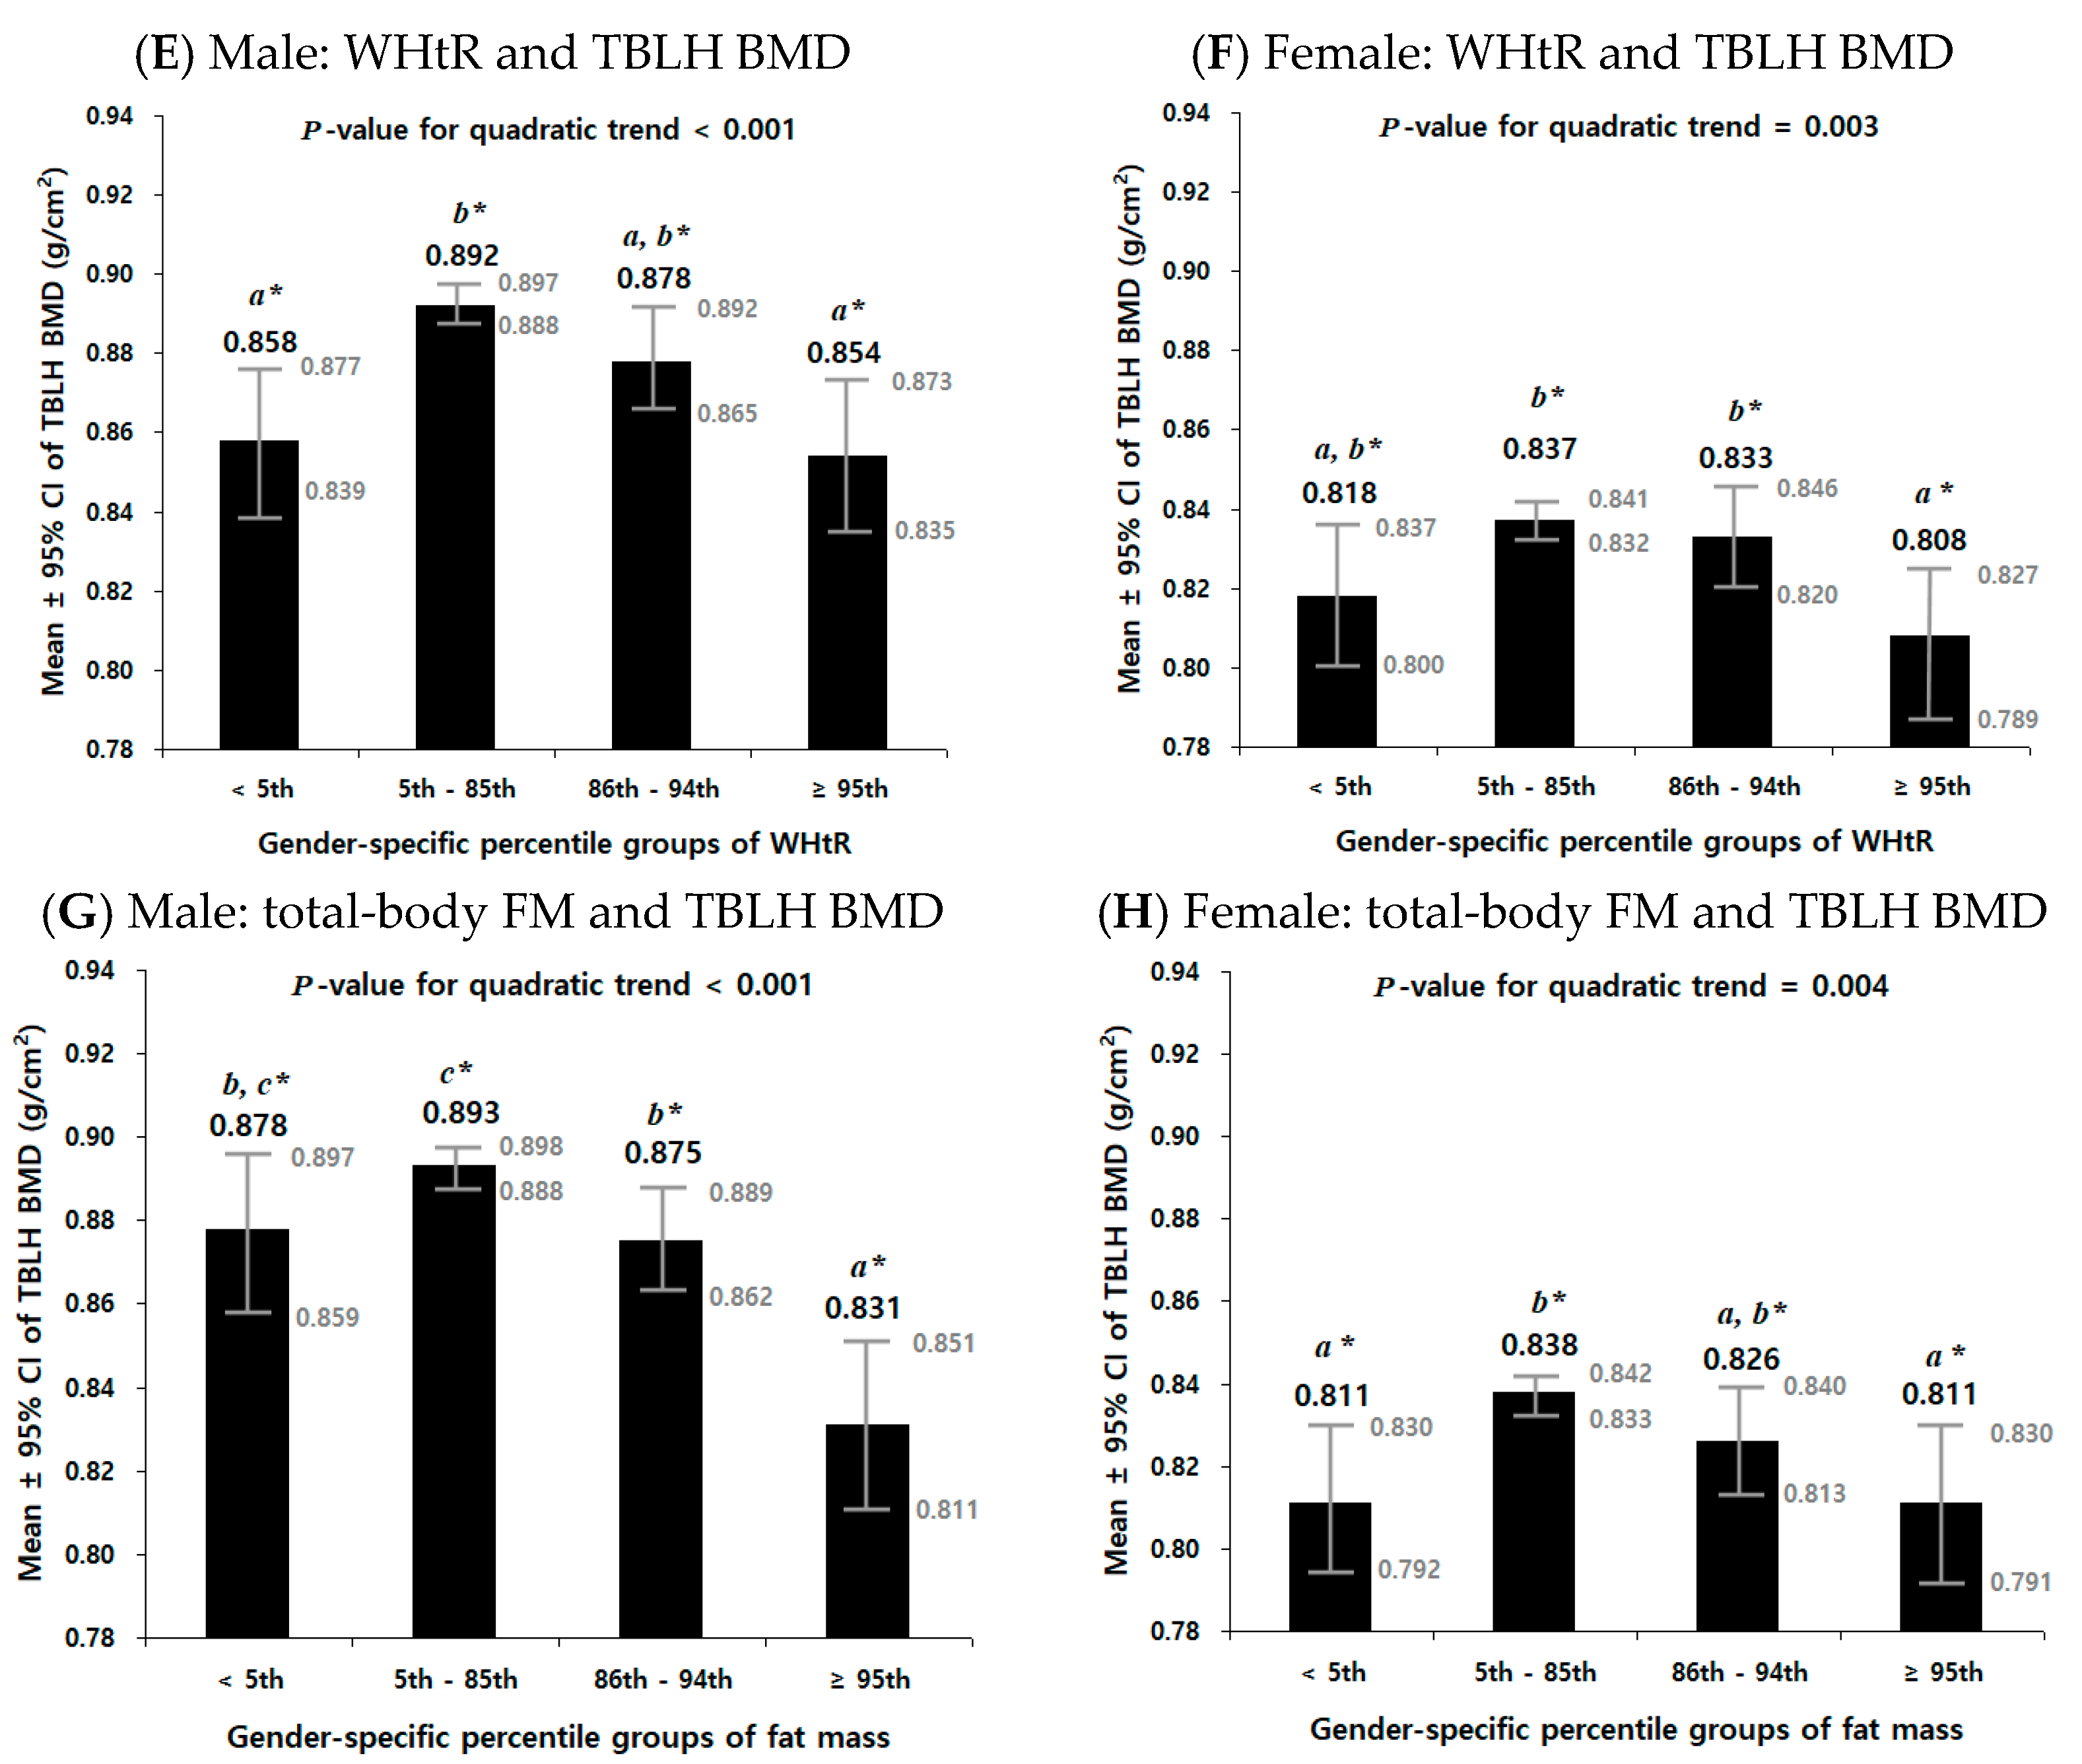
3.5. Non-Linear Relationship between Obesity Parameters and TBLH BMD

To explore the possibility of a non-linear relationship between the obesity parameters and TBLH BMD, a second-order polynomial term for each of the obesity parameters (BMI2, WC2, WHtR2, or FM2) was added to the regression model in Table 2. The results, as presented in Table 3, revealed a significant quadratic relationship between all obesity parameters and TBLH BMD in both genders, with the corresponding quadratic term being negative, indicating an inverted U-shaped curve (refer to Supplementary Figure S1 for graphical representation). Moreover, all coefficients of the independent variables were statistically significant, and the inclusion of the quadratic terms enhanced the explanatory power of the models. Specifically, the models for males explained 74.0% to 74.3% of the variance in TBLH BMD, while the models for females accounted for 61.6% to 62.1% of the variance.
Figure 3 illustrates the inverted U-shaped relationship between each obesity parameter and TBLH BMD, separately for males and females, after adjusting for age, menarcheal status (for females), and total-body LM. The figure displays the mean and 95% CI of TBLH BMD among the four percentile groups based on each obesity parameter. It can be observed that there was a significant quadratic trend for the means of TBLH BMD to increase across the percentile groups of each obesity parameter in both males and females (all p-values for the quadratic trend < 0.005). The mean values of TBLH BMD increased from the underweight group to the normal-weight or overweight group but subsequently decreased as the percentile groups progressed towards obesity.

4. Discussion

In this study, we found that the relationship between obesity parameters and TBLH BMD in Korean adolescents did not follow a linear pattern but rather an inverted U-shaped curve, after controlling for age, menarcheal status (in females only), and total-body LM. This indicates that obesity parameters are positively related to TBLH BMD until reaching a healthy weight from being underweight; however, if obesity parameters exceed a certain threshold, such as the overweight or obese state, they are negatively related to TBLH BMD.
Adolescence is a critical period for achieving peak bone mass, which has long-term implications for bone health later in life. Extensive research has been conducted to investigate the influence of body composition and obesity on bone health during this crucial growth phase. Most studies have emphasized the role of LM as a strong predictor of bone mass and density, demonstrating a positive association in children and adolescents [20,21,22,32,33,34], which is consistent with our findings; however, the impact of obesity or excessive FM on bone remains controversial. Some studies have reported positive associations between obesity parameters and bone health [17,18,19,20,21,22], suggesting that being overweight or obese may have beneficial effects on bone. These findings also highlight that being underweight is widely recognized as a risk factor for fractures [40]. Conversely, other studies have found negative associations between these variables [23,24,25,26,27,28,29], implying that obesity could have detrimental effects on bone. Furthermore, there is evidence to indicate no significant association [30,31,32,33,34], suggesting that the relationship might be indirect and mediated by other factors, such as the contribution of lean mass.
These inconsistencies in the findings may be largely attributed to the confounding effects of growth, maturation, and body composition. In this study, we initially observed a significant positive association between each of the obesity parameters (BMI, WC, WHtR, and total-body FM) and TBLH BMD in both males and females when considering the unadjusted regression analysis (Figure 2). However, after controlling for age, menarcheal status (in females only), and total-body LM, these associations were no longer observed and became non-significant (Table 2). The exception was total-body FM in males, which showed a significant negative association with TBLH BMD.
Our findings are supported by previous studies that also adjusted for total-body LM and reported no significant associations between obesity parameters and bone health. For instance, Hage et al. [31] found no significant differences in total-body BMD among different BMI groups (obese, overweight, and normal) in adolescent girls after adjustment for LM. Similarly, Valdimarsson et al. [32] and Witzke et al. [33] reported no significant association between total-body FM and total-body BMD in females. Gracia-Marco et al. [34] reported a significant negative association between FM and total-body BMD in males but not in females, which aligns with our results. Additionally, studies investigating the relationship between FM and femoral neck BMD also reported non-significant associations [22,32,34]. These findings further support the notion that the relationship between obesity parameters and bone health may be influenced by other factors, such as LM.
Indeed, there is growing evidence to suggest that excessive fat mass, rather than obesity per se, may have a negative impact on bone health in children and adolescents. Several studies have reported associations of abdominal fat with decreased bone formation rate and lower bone quality compared to resorption. Additionally, higher amounts of FM have been found to be a risk factor for fractures in adolescence [41,42]. This negative effect is thought to be due to the pro-inflammatory effects of adipose tissue on bone cells, leading to increased bone resorption and decreased bone formation. Excessive adipose tissue in obese individuals is known to secrete various inflammatory cytokines, such as interleukin-6 and tumor necrosis factor-alpha [43]. The increased secretion of these cytokines, particularly from visceral fat, may contribute to a decrease in bone density by promoting greater bone resorption [44,45]. Furthermore, insulin resistance, which is commonly associated with obesity, has been found to be negatively associated with BMD in obese adolescents [46]. Insulin resistance can disrupt normal bone metabolism and lead to impaired bone formation. These findings highlight the complex interactions between adipose tissue, inflammation, and bone health. Excessive FM, especially when accompanied by systemic inflammation and insulin resistance, may contribute to compromised bone health in children and adolescents.
Both underweight and overweight/obesity conditions can have detrimental impacts on bone health, indicating the need to investigate the dual effects of obesity status on BMD. To explore the possibility of a non-linear relationship between the obesity parameters and TBLH BMD, we added a second-order polynomial term for each of the obesity parameters (BMI2, WC2, WHtR2, or FM2) to the regression model. The results demonstrated a significant quadratic relationship between all obesity parameters and TBLH BMD in both males and females (Table 3). The negative coefficient of the quadratic term indicates an inverted U-shaped curve, as illustrated in Figure 3. The mean values of TBLH BMD showed an upward trend from the underweight group to the normal weight or overweight group; however, as the percentile groups progressed towards obesity, a subsequent decline in TBLH BMD was observed. This suggests that there may be an optimal range of obesity parameters for maintaining optimal bone health, with deviations from this range in either direction (being underweight or having obesity) potentially leading to compromised bone health.
Recent studies have reported non-linear associations between obesity and bone health, which further support our findings. For instance, two studies involving Chinese children aged 0–5 years [47] and Spanish children aged 4–18 years [48], respectively, revealed that the positive association between BMI and BMD reached a plateau or attenuated at higher levels of obesity, suggesting that there is a saturation point beyond which increasing BMI does not lead to additional increases in BMD. A similar saturation effect of BMI on BMD was also observed in a cross-sectional study involving US adolescents aged 8–19 years, indicating that maintaining BMI at saturation values may have benefits in mitigating other adverse effects associated with obesity [49]. These studies highlight the importance of considering the non-linear nature of the relationship between obesity and bone health, emphasizing the need to maintain obesity parameters within an optimal range to achieve optimal BMD.
In this study, we observed a significant association between menarcheal status and bone health. After controlling for the covariates including age, we found that post-menarcheal females had higher TBLH BMD compared to pre-menarcheal females (Table 2 and Table 3). This finding suggests that the onset of menarche, which represents the beginning of reproductive maturity in females, may have a positive impact on bone health. Menarche is accompanied by hormonal changes, particularly an increase in estrogen levels. Estrogen plays a crucial role in bone metabolism, promoting the growth and strength of bones [50]. It enhances the lifespan and activity of osteoblasts—the cells responsible for bone formation—while inhibiting the activity of osteoclasts, the cells involved in bone resorption [51]. Therefore, the higher TBLH BMD observed in post-menarcheal females can be attributed to the beneficial effects of estrogen on bone health. The timing and duration of exposure to estrogen during puberty play a vital role in determining peak bone mass. A shorter period of exposure to higher estrogen levels, particularly in late menarcheal girls, is considered a risk factor for decreased BMD and increased susceptibility to osteoporosis later in life.
Our study has some limitations. First, this is a cross-sectional analysis, which does not allow us to identify the causal effects of obesity on BMD. Second, it is important to note that DXA measures areal bone density (in g/cm2), not volumetric bone density (in g/cm3). DXA bone area measurement captures the length and width of bones but does not directly assess the greater depth or thickness of bones. Therefore, individuals with larger bone sizes may have a greater areal BMD reading, even if their volumetric BMD is the same [52]. Third, we were not able to include variables to assess physical activity, vitamin D levels, nutritional status [53], and other chemical mediators between fat and bone, including inflammatory cytokines and gonadal steroids. Finally, in order to better understand the impact of obesity on bone density, it would be necessary to determine regional fat distribution using computed tomography or magnetic resonance imaging; however, we were unable to differentiate between subcutaneous and visceral fat.
Despite these limitations, our study has several strengths. One notable advantage is the sampling design of the KNHANES, which ensures that our study sample is nationally representative of Korean adolescents, allowing for generalization to the broader Korean adolescent population. Furthermore, we addressed a statistical methodological concern by employing multiple regression modeling to adjust the associations for relevant covariates, including age, menarcheal status, and total-body LM. By considering these factors, we aimed to provide a more accurate assessment of the associations between obesity parameters and BMD. Moreover, it is worth noting that previous studies have predominantly focused on examining the linear relationship of obesity with bone parameters. This emphasis on linearity may be one of the reasons for the seemingly contrasting evidence reported in the literature regarding the relationship between obesity and bone health. By exploring potential non-linear associations, our study adds to the current understanding in this field.

5. Conclusions

In conclusion, we investigated the relationship between four obesity parameters and TBLH BMD to examine the impact of obesity on bone health. The analysis revealed a tendency where TBLH BMD increased with increasing the obesity parameters; however, an inverted U-shaped pattern was observed, indicating that TBLH BMD decreased as the obesity parameters reached a certain threshold, such as the overweight or obese state. In other words, optimal BMD was achieved within a specific range of obesity parameters, and deviation from this range, whether towards underweight or obesity, could lead to BMD deterioration. Considering obesity in childhood and adolescence persists into adulthood and produces more harmful effects on health, maintaining a healthy weight in adolescence is an essential aspect of preventing osteoporosis in older adults. To clarify the causal relationship between obesity and bone health, intervention studies aimed at maintaining a healthy weight in the adolescent population with obesity should be conducted.

Supplementary Materials

The following supporting information can be downloaded at: https://www.mdpi.com/article/10.3390/jcm12185869/s1. Table S1: Gender- and age-specific 5th, 85th, and 95th percentiles of body mass index (BMI) based on the 2007 Korea National Growth Chart [38]; Table S2: Sample distribution of gender-and-age-specific percentile groups of body mass index (BMI) by gender and age; Table S3: Sample distribution of gender-specific percentile groups of waist circumference (WC), waist-to-height ratio (WHtR), and total-body fat mass (FM) by gender; Table S4: Sample distribution according to age groups, overall, and by gender; Table S5: Mean comparison between male and female by age group; Table S6: Mean comparison of age among four percentile groups of each obesity parameter by gender in 2060 Korean adolescents aged 10 to 19 years from the KNHANES 2008–2011; Table S7: Mean comparison of total-body-less-head (TBLH) bone mineral density (BMD) among four percentile groups of each obesity parameter by gender in 2060 Korean adolescents aged 10 to 19 years from the KNHANES 2008–2011; Figure S1: Non-linear relationship between obesity and the estimated values of total-body-less-head (TBLH) bone mineral density (BMD), while adjusting for age, menarcheal status (for females only), and total-body lean mass, by gender in 2060 Korean adolescents aged 10 to 19 years from the 2008–2011 Korea National Health and Nutrition Examination Survey (KNHANES).

Author Contributions

Conceptualization, J.L. and O.-H.R.; methodology, J.L.; data acquisition and preprocessing, I.Y. and H.C.; statistical analysis and interpretation, J.L., I.Y. and H.-J.K.; drafting the work or revision, J.L., I.Y., H.C. and O.-H.R.; final approval of the manuscript, J.L. and O.-H.R. All authors have read and agreed to the published version of the manuscript.

Funding

This work was supported by the National Research Foundation of Korea (NRF) grant funded by the Korea government (MSIT) (No. 2022R1A5A8019303).

Institutional Review Board Statement

The analyses involving the Korea National Health and Nutrition Survey (KNHANES) data adhered to the guidelines set forth in the Declaration of Helsinki. As the Institutional Review Board (IRB) of the Korea Disease Control and Prevention Agency had already approved the 2008–2011 KNHANES (approval codes: 2008-04EXP-01-C, 2009-01CON-03-2C, 2010-02CON-21-C, 2011-02CON-06-C), obtaining additional IRB approval for our study was not necessary.

Informed Consent Statement

All subjects in the study provided written informed consent.

Data Availability Statement

The data used in the study are accessible on the KNHANES website: https://knhanes,kdca.go.kr/knhanes/eng/index.go, accessed on 27 July 2023.

Conflicts of Interest

The authors declare no conflict of interest.

References

  1. Greenberg, J.A. Obesity and early mortality in the United States. Obesity 2013, 21, 405–412. [Google Scholar] [CrossRef]
  2. Britton, K.A.; Massaro, J.M.; Murabito, J.M.; Kreger, B.E.; Hoffmann, U.; Fox, C.S. Body Fat Distribution, Incident Cardiovascular Disease, Cancer, and All-Cause Mortality. J. Am. Coll. Cardiol. 2013, 62, 921–925. [Google Scholar] [CrossRef]
  3. Rössner, S. Obesity: The disease of the twenty-first century. Int. J. Obes. 2002, 26, S2–S4. [Google Scholar] [CrossRef] [PubMed]
  4. Verras, G.-I.; Mulita, F.; Pouwels, S.; Parmar, C.; Drakos, N.; Bouchagier, K.; Kaplanis, C.; Skroubis, G. Outcomes at 10-Year Follow-Up after Roux-en-Y Gastric Bypass, Biliopancreatic Diversion, and Sleeve Gastrectomy. J. Clin. Med. 2023, 12, 4973. [Google Scholar] [CrossRef] [PubMed]
  5. Mulita, F.; Lampropoulos, C.; Kehagias, D.; Verras, G.-I.; Tchabashvili, L.; Kaplanis, C.; Liolis, E.; Iliopoulos, F.; Perdikaris, I.; Kehagias, I. Long-term nutritional deficiencies following sleeve gastrectomy: A 6-year single-centre retrospective study. Menopause Rev. 2021, 20, 170–176. [Google Scholar] [CrossRef]
  6. Jebeile, H.; Kelly, A.S.; O’Malley, G.; Baur, L.A. Obesity in children and adolescents: Epidemiology, causes, assessment, and management. Lancet Diabetes Endocrinol. 2022, 10, 351–365. [Google Scholar] [CrossRef]
  7. Sanyaolu, A.; Okorie, C.; Qi, X.; Locke, J.; Rehman, S. Childhood and adolescent obesity in the United States: A public health concern. Glob. Pediatr. Health 2019, 6, 2333794X19891305. [Google Scholar] [CrossRef]
  8. Kim, J.H.; Moon, J.S. Secular trends in pediatric overweight and obesity in Korea. J. Obes. Metab. Syndr. 2020, 29, 12. [Google Scholar] [CrossRef] [PubMed]
  9. Pulgarón, E.R. Childhood obesity: A review of increased risk for physical and psychological comorbidities. Clin. Ther. 2013, 35, A18–A32. [Google Scholar] [CrossRef]
  10. Horesh, A.; Tsur, A.M.; Bardugo, A.; Twig, G. Adolescent and childhood obesity and excess morbidity and mortality in young adulthood—A systematic review. Curr. Obes. Rep. 2021, 10, 301–310. [Google Scholar] [CrossRef]
  11. Jebeile, H.; Cardel, M.I.; Kyle, T.K.; Jastreboff, A.M. Addressing psychosocial health in the treatment and care of adolescents with obesity. Obesity 2021, 29, 1413–1422. [Google Scholar] [CrossRef] [PubMed]
  12. Paulis, W.; Silva, S.; Koes, B.; van Middelkoop, M. Overweight and obesity are associated with musculoskeletal complaints as early as childhood: A systematic review. Obes. Rev. 2014, 15, 52–67. [Google Scholar] [CrossRef]
  13. Dimitri, P.; Bishop, N.; Walsh, J.; Eastell, R. Obesity is a risk factor for fracture in children but is protective against fracture in adults: A paradox. Bone 2012, 50, 457–466. [Google Scholar] [CrossRef] [PubMed]
  14. Hui, S.L.; Slemenda, C.W.; Johnston, C.C. Age and bone mass as predictors of fracture in a prospective study. J. Clin. Investig. 1988, 81, 1804–1809. [Google Scholar] [CrossRef] [PubMed]
  15. Bland, V.L.; Bea, J.W.; Blew, R.M.; Roe, D.J.; Lee, V.R.; Funk, J.L.; Going, S.B. Influence of changes in soft tissue composition on changes in bone strength in peripubertal girls: The STAR longitudinal study. J. Bone Miner. Res. 2021, 36, 123–132. [Google Scholar] [CrossRef]
  16. Rizzoli, R.; Bianchi, M.L.; Garabédian, M.; McKay, H.A.; Moreno, L.A. Maximizing bone mineral mass gain during growth for the prevention of fractures in the adolescents and the elderly. Bone 2010, 46, 294–305. [Google Scholar] [CrossRef]
  17. Leonard, M.B.; Shults, J.; Wilson, B.A.; Tershakovec, A.M.; Zemel, B.S. Obesity during childhood and adolescence augments bone mass and bone dimensions. Am. J. Clin. Nutr. 2004, 80, 514–523. [Google Scholar] [CrossRef] [PubMed]
  18. Clark, E.; Ness, A.; Tobias, J.; Avon Longitudinal Study of Parents and Children Study Team. Adipose tissue stimulates bone growth in prepubertal children. J. Clin. Endocrinol. Metab. 2006, 91, 2534–2541. [Google Scholar] [CrossRef]
  19. Maggio, A.B.; Belli, D.C.; Puigdefabregas, J.W.B.; Rizzoli, R.; Farpour-Lambert, N.J.; Beghetti, M.; McLin, V.A. High bone density in adolescents with obesity is related to fat mass and serum leptin concentrations. J. Pediatr. Gastroenterol. Nutr. 2014, 58, 723–728. [Google Scholar] [CrossRef]
  20. Kâ, K.; Rousseau, M.-C.; Lambert, M.; O’loughlin, J.; Henderson, M.; Tremblay, A.; Alos, N.; Nicolau, B. Association between lean and fat mass and indicators of bone health in prepubertal caucasian children. Horm. Res. Paediatr. 2013, 80, 154–162. [Google Scholar] [CrossRef]
  21. Cole, Z.; Harvey, N.C.; Kim, M.; Ntani, G.; Robinson, S.; Inskip, H.; Godfrey, K.; Cooper, C.; Dennison, E.; The Southampton Women’s Survey Study Group. Increased fat mass is associated with increased bone size but reduced volumetric density in pre pubertal children. Bone 2012, 50, 562–567. [Google Scholar] [CrossRef] [PubMed]
  22. Wiebe, P.N.; Blimkie, C.J.; Farpour-Lambert, N.; Briody, J.; Woodhead, H.; Cowell, C.; Howman-Giles, R. Correlates and determinants of bone mineral density in prepubertal girls. Pediatr. Exerc. Sci. 2002, 14, 345–357. [Google Scholar] [CrossRef]
  23. de Moraes, A.M.; Gonçalves, E.M.; de Oliveira Barbeta, V.J.; Guerra-Júnior, G. Cross-sectional study of the association of body composition and physical fitness with bone status in children and adolescents from 11 to 16 years old. BMC Pediatr. 2013, 13, 117. [Google Scholar] [CrossRef]
  24. Goulding, A.; Taylor, R.; Jones, I.; McAuley, K.; Manning, P.; Williams, S. Overweight and obese children have low bone mass and area for their weight. Int. J. Obes. 2000, 24, 627–632. [Google Scholar] [CrossRef]
  25. Ivuskans, A.; Lätt, E.; Mäestu, J.; Saar, M.; Purge, P.; Maasalu, K.; Jürimäe, T.; Jürimäe, J. Bone mineral density in 11–13-year-old boys: Relative importance of the weight status and body composition factors. Rheumatol. Int. 2013, 33, 1681–1687. [Google Scholar] [CrossRef]
  26. Ma, C.-M.; Lu, N.; Kong, F.-S.; Zhang, X.; Wang, R.; Yin, F.-Z. The relationship between metabolic syndrome and bone mineral density in adolescents: Analysis of the National Health and Nutrition Examination Survey. J. Pediatr. Endocrinol. Metab. 2022, 35, 901–912. [Google Scholar] [CrossRef]
  27. Petit, M.A.; Beck, T.J.; Shults, J.; Zemel, B.S.; Foster, B.J.; Leonard, M.B. Proximal femur bone geometry is appropriately adapted to lean mass in overweight children and adolescents. Bone 2005, 36, 568–576. [Google Scholar] [CrossRef] [PubMed]
  28. Pollock, N.K.; Laing, E.M.; Baile, C.A.; Hamrick, M.W.; Hall, D.B.; Lewis, R.D. Is adiposity advantageous for bone strength? A peripheral quantitative computed tomography study in late adolescent females. Am. J. Clin. Nutr. 2007, 86, 1530–1538. [Google Scholar] [CrossRef]
  29. Wang, L.; Xu, Z.; Li, N.; Meng, X.; Wang, S.; Yu, C.; Leng, J.; Zhao, M.; Li, W.; Deng, Y. The association between overweight and obesity on bone mineral density in 12 to 15 years old adolescents in China. Medicine 2021, 100, e26872. [Google Scholar] [CrossRef]
  30. Manzoni, P.; Brambilla, P.; Pietrobelli, A.; Beccaria, L.; Bianchessi, A.; Mora, S.; Chiumello, G. Influence of body composition on bone mineral content in children and adolescents. Am. J. Clin. Nutr. 1996, 64, 603–607. [Google Scholar] [CrossRef]
  31. El Hage, Z.; Theunynck, D.; Jacob, C.; Moussa, E.; Baddoura, R.; Zunquin, G.; El Hage, R. Bone mineral content and density in obese, overweight and normal weight adolescent boys. Leban. Med. J. 2013, 61, 148–154. [Google Scholar] [CrossRef] [PubMed]
  32. Valdimarsson, Ö.; Kristinsson, J.; Stefansson, S.; Valdimarsson, S.; Sigurdsson, G. Lean mass and physical activity as predictors of bone mineral density in 16–20-year old women. J. Intern. Med. 1999, 245, 489–496. [Google Scholar] [CrossRef]
  33. Witzke, K.A.; Snow, C.M. Lean body mass and leg power best predict bone mineral density in adolescent girls. Med. Sci. Sports Exerc. 1999, 31, 1558–1563. [Google Scholar] [CrossRef]
  34. Gracia-Marco, L.; Ortega, F.; Jimenez-Pavon, D.; Rodriguez, G.; Castillo, M.; Vicente-Rodriguez, G.; Moreno, L. Adiposity and bone health in Spanish adolescents. The HELENA study. Osteoporos. Int. 2012, 23, 937–947. [Google Scholar] [CrossRef]
  35. Brismar, T.; Ringertz, H. Effect of bone density of the head on total body DEXA measurements in 100 healthy Swedish women. Acta Radiol. 1996, 37, 101–106. [Google Scholar] [CrossRef]
  36. Taylor, A.; Konrad, P.T.; Norman, M.E.; Harcke, H.T. Total body bone mineral density in young children: Influence of head bone mineral density. J. Bone Miner. Res. 1997, 12, 652–655. [Google Scholar] [CrossRef] [PubMed]
  37. Crabtree, N.J.; Arabi, A.; Bachrach, L.K.; Fewtrell, M.; Fuleihan, G.E.-H.; Kecskemethy, H.H.; Jaworski, M.; Gordon, C.M. Dual-energy X-ray absorptiometry interpretation and reporting in children and adolescents: The revised 2013 ISCD Pediatric Official Positions. J. Clin. Densitom. 2014, 17, 225–242. [Google Scholar] [CrossRef]
  38. Moon, J.-S.; Lee, S.-Y.; Nam, C.-M.; Choi, J.-M.; Choe, B.-K.; Seo, J.-W.; Oh, K.; Jang, M.-J.; Hwang, S.-S.; Yoo, M.-H. 2007 Korean National Growth Charts: Review of developmental process and an outlook. Korean J. Pediatr. 2008, 51, 1–25. [Google Scholar] [CrossRef]
  39. Centers for Disease Control and Prevention National Center for Health Statistics. CDC Growth Charts. 2000. Available online: http://www.cdc.gov/growthcharts/ (accessed on 27 July 2023).
  40. De Laet, C.; Kanis, J.; Odén, A.; Johanson, H.; Johnell, O.; Delmas, P.; Eisman, J.; Kroger, H.; Fujiwara, S.; Garnero, P. Body mass index as a predictor of fracture risk: A meta-analysis. Osteoporos. Int. 2005, 16, 1330–1338. [Google Scholar] [CrossRef]
  41. Valerio, G.; Gallè, F.; Mancusi, C.; Di Onofrio, V.; Guida, P.; Tramontano, A.; Ruotolo, E.; Liguori, G. Prevalence of overweight in children with bone fractures: A case control study. BMC Pediatr. 2012, 12, 166. [Google Scholar] [CrossRef] [PubMed]
  42. Kessler, J.; Koebnick, C.; Smith, N.; Adams, A. Childhood obesity is associated with increased risk of most lower extremity fractures. Clin. Orthop. Relat. Res. 2013, 471, 1199–1207. [Google Scholar] [CrossRef]
  43. Tilg, H.; Moschen, A.R. Adipocytokines: Mediators linking adipose tissue, inflammation and immunity. Nat. Rev. Immunol. 2006, 6, 772–783. [Google Scholar] [CrossRef] [PubMed]
  44. Russell, M.; Mendes, N.; Miller, K.K.; Rosen, C.J.; Lee, H.; Klibanski, A.; Misra, M. Visceral fat is a negative predictor of bone density measures in obese adolescent girls. J. Clin. Endocrinol. Metab. 2010, 95, 1247–1255. [Google Scholar] [CrossRef]
  45. Halade, G.V.; El Jamali, A.; Williams, P.J.; Fajardo, R.J.; Fernandes, G. Obesity-mediated inflammatory microenvironment stimulates osteoclastogenesis and bone loss in mice. Exp. Gerontol. 2011, 46, 43–52. [Google Scholar] [CrossRef] [PubMed]
  46. Pirgon, O.; Bilgin, H.; Tolu, I.; Odabas, D. Correlation of insulin sensitivity with bone mineral status in obese adolescents with nonalcoholic fatty liver disease. Clin. Endocrinol. 2011, 75, 189–195. [Google Scholar] [CrossRef] [PubMed]
  47. Zhao, Y.; Qin, R.; Ma, X.; Qin, Z.; Yang, Z.; Hong, H.; Lv, H.; Ye, K.; Wei, Y.; Zheng, W. Adiposity is not beneficial to bone mineral density in 0–5 year old Chinese children: The Jiangsu bone health study. Obes. Res. Clin. Pract. 2020, 14, 39–46. [Google Scholar] [CrossRef]
  48. Ferrer, F.S.; Castell, E.C.; Marco, F.C.; Ruiz, M.J.; Rico, J.A.Q.; Roca, A.P.N. Influence of weight status on bone mineral content measured by DXA in children. BMC Pediatr. 2021, 21, 185. [Google Scholar] [CrossRef]
  49. Ma, C.-M.; Lu, N.; Zhang, M.-M.; Kong, F.-S.; Lu, Q.; Yin, F.-Z.; Zhang, X.; Wang, R. The relationship between obesity and bone mineral density in children and adolescents: Analysis of the National Health and Nutrition Examination Survey. Arch. Osteoporos. 2023, 18, 25. [Google Scholar] [CrossRef]
  50. Klein, K.O.; Martha, P.M., Jr.; Blizzard, R.M.; Herbst, T.; Rogol, A.D. A longitudinal assessment of hormonal and physical alterations during normal puberty in boys. II. Estrogen levels as determined by an ultrasensitive bioassay. J. Clin. Endocrinol. Metab. 1996, 81, 3203–3207. [Google Scholar]
  51. Bailey, D.A.; Martin, A.D.; McKay, H.A.; Whiting, S.; Mirwald, R. Calcium accretion in girls and boys during puberty: A longitudinal analysis. J. Bone Miner. Res. 2000, 15, 2245–2250. [Google Scholar] [CrossRef] [PubMed]
  52. Binkovitz, L.A.; Henwood, M.J.; Sparke, P. Pediatric dual-energy X-ray absorptiometry: Technique, interpretation, and clinical applications. Semin. Nucl. Med. 2007, 37, 303–313. [Google Scholar] [CrossRef] [PubMed]
  53. Rondanelli, M.; Faliva, M.A.; Barrile, G.C.; Cavioni, A.; Mansueto, F.; Mazzola, G.; Oberto, L.; Patelli, Z.; Pirola, M.; Tartara, A.; et al. Nutrition, Physical Activity, and Dietary Supplementation to Prevent Bone Mineral Density Loss: A Food Pyramid. Nutrients 2021, 14, 74. [Google Scholar] [CrossRef] [PubMed]
Figure 1. Age-related changes in total-body-less-head (TBLH) bone mineral density (BMD), total-body lean mass (LM), and total-body fat mass (FM) by gender in 2060 Korean adolescents aged 10 to 19 years from the Korea National Health and Nutrition Examination Survey (KNHANES) 2008–2011. Mean ± 95% confidence interval (CI) was calculated by one-way analysis of variances (ANOVA). The figure presented the mean ± 95% confidence interval of TBLH BMD for (A) males and (B) females, total-body LM for (C) males and (D) females, and total-body FM for (E) males and (F) females. * The same letters indicate that the mean difference between groups is not significant (α = 0.05) on pairwise post-hoc comparisons using Bonferroni’s test (equal variance assumed) or the Games–Howell test (equal variance not assumed).
Jcm 12 05869 g001
Figure 2. Unadjusted relationships between obesity and total-body-less-head (TBLH) bone mineral density (BMD) by gender in 2060 Korean adolescents aged 10 to 19 years from the Korea National Health and Nutrition Examination Survey (KNHANES) 2008–2011. The figure illustrates the simple regression results showing the associations of TBLH BMD with four obesity parameters: body mass index (BMI) for (A) males and (B) females, waist circumstance (WC) for (C) males and (D) females, waist-to-height ratio (WHtR) for (E) males and (F) females, and total-body fat mass (FM) for (G) males and (H) females. The black line is the fitted regression line. “r” is Pearson’s correlation coefficient.
Jcm 12 05869 g002aJcm 12 05869 g002b
Figure 3. Quadratic relationships between obesity and total-body-less-head bone mineral density (TBLH BMD) adjusted for age, menarcheal status (for females only), and total-body lean mass by gender in 2060 Korean adolescents aged 10 to 19 years from the 2008–2011 Korea National Health and Nutrition Examination Survey (KNHANES). The bars from left to right are percentile groups (<5th percentile, underweight; 5th–85th percentile, normal-weight; 86th–94th percentile, overweight; and ≥95th percentile, obesity) of body mass index (BMI), waist circumference (WC), waist-to-height ratio (WHtR), or total-body fat mass (FM), separately for males and females. Especially, the gender- and age-specific percentile groups of BMI were stratified on the basis of the 2007 Korea National Growth Charts [38] (Supplemental Tables S1 and S2). The percentile groups of WC, WHtR, and total-body FM were determined using the observed sample distributions in the study, separately for males and females (Supplementary Table S3). Results show mean ± 95% confidence interval of TBLH BMD for (A) males and (B) females stratified by the percentile groups of BMI, for (C) males and (D) females stratified by the percentile groups of WC, for (E) males and (F) females stratified by the percentile groups of WHtR, and for (G) males and (H) females stratified by the percentile groups of total-body FM. An analysis of covariance (ANCOVA) was used with age, menarcheal status (for females only), and total-body lean mass as covariates. Statistical significances were evaluated to test for whether there is a significant quadratic trend for the means of TBLH BMD to increase across the percentile groups of each obesity variable when controlling for the covariates. * The same letters indicate that the mean difference between groups is not significant (α = 0.05) on pairwise post-hoc comparisons using Bonferroni’s test.
Jcm 12 05869 g003aJcm 12 05869 g003b
Table 1. Characteristics of study population by gender in 2060 Korean adolescents aged 10 to 19 years from the KNHANES 2008–2011.
Male (n = 1114)Female (n = 946)
VariableMean(SD)Mean(SD)p-Value *
Age (years)14.17(2.81)14.28(2.91)0.372
Weight (kg)56.91(15.50)50.23(11.18)<0.001
Height (cm)163.78(12.96)157.21(8.13)<0.001
Obesity
 BMI (kg/m2)20.88(3.82)20.28(3.51)<0.001
 Waist circumference (cm)71.09(10.60)67.23(8.66)<0.001
 Waist-to-height ratio (cm/cm)0.434(0.057)0.427(0.049)0.003
Body composition
 Lean mass (kg)40.95(10.73)32.06(5.62)<0.001
 Fat mass (kg)13.42(6.87)16.27(6.13)<0.001
 Bone mass (kg)1.98(0.58)1.77(0.39)<0.001
 Percent lean mass (%)72.45(7.56)64.27(5.64)<0.001
 Percent fat mass (%)23.12(8.08)31.40(5.92)<0.001
 Percent bone mass (%)3.50(0.53)3.53(0.49)0.335
TBLH bone
 Bone mineral density (g/cm2)0.887(0.138)0.834(0.100)<0.001
 Bone mineral content (g)1497.30(490.56)1268.94(298.84)<0.001
 Bone area (cm2)1646.94(340.93)1505.78(233.89)<0.001
KNHANES: Korea National Health and Nutrition Examination Survey; SD: standard deviation; BMI: body mass index; TBLH: total-body-less-head. * Statistical significances were assessed using t-test for two independent samples.
Table 2. Multiple regression results using total-body-less-head (TBLH) bone mineral density (BMD) as the dependent variable by gender in 2060 Korean adolescents aged 10 to 19 years from the KNHANES 2008–2011.
Dependent Variable: TBLH BMD (g/cm2)
Male (n = 1114)Female (n = 946)
ParameterIndependent Variablebp-ValuePartial RAd-R2bp-ValuePartial RAd-R2
BMIIntercept0.4091<0.001 0.7360.3999<0.001 0.608
Age (years)0.0080<0.0010.180 0.0060<0.0010.207
Menarcheal status *NA 0.0396<0.0010.184
Lean mass (kg)0.0096<0.0010.562 0.0099<0.0010.438
BMI (kg/m2)−0.00140.072−0.054 0.00000.9900.000
WCIntercept0.4092<0.001 0.7350.3903<0.001 0.608
Age (years)0.0084<0.0010.194 0.0061<0.0010.209
Menarcheal status *NA 0.0403<0.0010.187
Lean mass (kg)0.0095<0.0010.563 0.0095<0.0010.422
WC (cm)−0.00040.137−0.045 0.00030.3660.029
WHtRIntercept0.4155<0.001 0.7350.3930<0.001 0.608
Age (years)0.0083<0.0010.189 0.0061<0.0010.208
Menarcheal status *NA 0.0402<0.0010.185
Lean mass (kg)0.0093<0.0010.631 0.0097<0.0010.501
WHtR (cm/cm)−0.06320.125−0.046 0.02430.6230.016
Total-body FMIntercept0.4012<0.001 0.7380.3968<0.001 0.608
Age (years)0.0073<0.0010.167 0.0061<0.0010.208
Menarcheal status *NA 0.0395<0.0010.184
Lean mass (kg)0.0098<0.0010.628 0.0102<0.0010.493
Total-body FM (kg)−0.0013<0.001−0.109 −0.00040.436−0.025
KNHANES: Korea National Health and Nutrition Examination Survey; TBLH: total-body-less-head; BMD: bone mineral density; b: unstandardized beta coefficient; Partial R: partial correlation coefficient; Ad-R2; adjusted R2; BMI: body mass index; WC: waist circumference; WHtR: waist-to-height ratio; NA: not applicable. * Menarcheal status = 0 if pre-menarche, 1 if post-menarch.
Table 3. Multiple regression results representing curvilinear effects with the obesity variable squared (X2) as an independent variable by gender in 2060 Korean adolescents aged 10 to 19 years from the KNHANES 2008–2011.
Dependent Variable: TBLH BMD (g/cm2)
Male (n = 1114)Female (n = 946)
ParameterIndependent Variablebp-ValuePartial RAd-R2bp-ValuePartial RAd-R2
BMIIntercept0.13060.013 0.7430.17230.001 0.616
Age (years)0.0079<0.0010.180 0.0061<0.0010.211
Menarcheal status *NA 0.0330<0.0010.153
Lean mass (kg)0.0094<0.0010.556 0.0097<0.0010.436
BMI (kg/m2)0.0251<0.0010.155 0.0219<0.0010.142
[BMI]2 (kg/m2)−0.0006<0.001−0.166 −0.0005<0.001−0.144
WCIntercept0.00110.988 0.743−0.06350.456 0.621
Age (years)0.0080<0.0010.187 0.0059<0.0010.207
Menarcheal status *NA 0.0329<0.0010.153
Lean mass (kg)0.0093<0.0010.557 0.0095<0.0010.430
WC (cm)0.0110<0.0010.160 0.0135<0.0010.181
[WC]2 (cm)−0.0001<0.001−0.168 −0.0001<0.001−0.179
WHtRIntercept0.00100.992 0.740−0.08960.402 0.616
Age (years)0.0084<0.0010.194 0.0061<0.0010.212
Menarcheal status *NA 0.0360<0.0010.167
Lean mass (kg)0.0093<0.0010.631 0.0100<0.0010.514
WHtR (cm/cm)1.7790<0.0010.125 2.1793<0.0010.149
[WHtR]2 (cm/cm)−2.0057<0.001−0.130 −2.4083<0.001−0.148
Total-body FMIntercept0.3752<0.001 0.7410.3536<0.001 0.616
Age (years)0.0072<0.0010.167 0.0059<0.0010.206
Menarcheal status *NA 0.0333<0.0010.155
Lean mass (kg)0.0098<0.0010.629 0.0101<0.0010.494
Total-body FM (kg)0.00270.0210.069 0.0056<0.0010.128
[Total-body FM]2 (kg)−0.0001<0.001−0.108 −0.0001<0.001−0.144
KNHANES: Korea National Health and Nutrition Examination Survey; TBLH: total-body-less-head; BMD: bone mineral density; b: unstandardized beta coefficient; Partial R: partial correlation coefficient; Ad-R2; adjusted R2; BMI: body mass index; WC: waist circumference; WHtR: waist-to-height ratio; NA: not applicable. * Menarcheal status = 0 if pre-menarche, 1 if post-menarch.
Disclaimer/Publisher’s Note: The statements, opinions and data contained in all publications are solely those of the individual author(s) and contributor(s) and not of MDPI and/or the editor(s). MDPI and/or the editor(s) disclaim responsibility for any injury to people or property resulting from any ideas, methods, instructions or products referred to in the content.

