
Changes in Maternal Heart Rate and Autonomic Regulation following the Antenatal Administration of Corticosteroids: A Secondary Analysis
 , ,
, ,  , and
, and
Abstract
:1. Introduction
2. Materials and Methods
2.1. Study Population
2.2. Measurements
2.3. Analysis
2.4. Outcome Measures
2.5. Data Acquisition and Signal Pre-Processing
2.6. HR and HRV Analysis
2.7. Statistical Analysis
3. Results
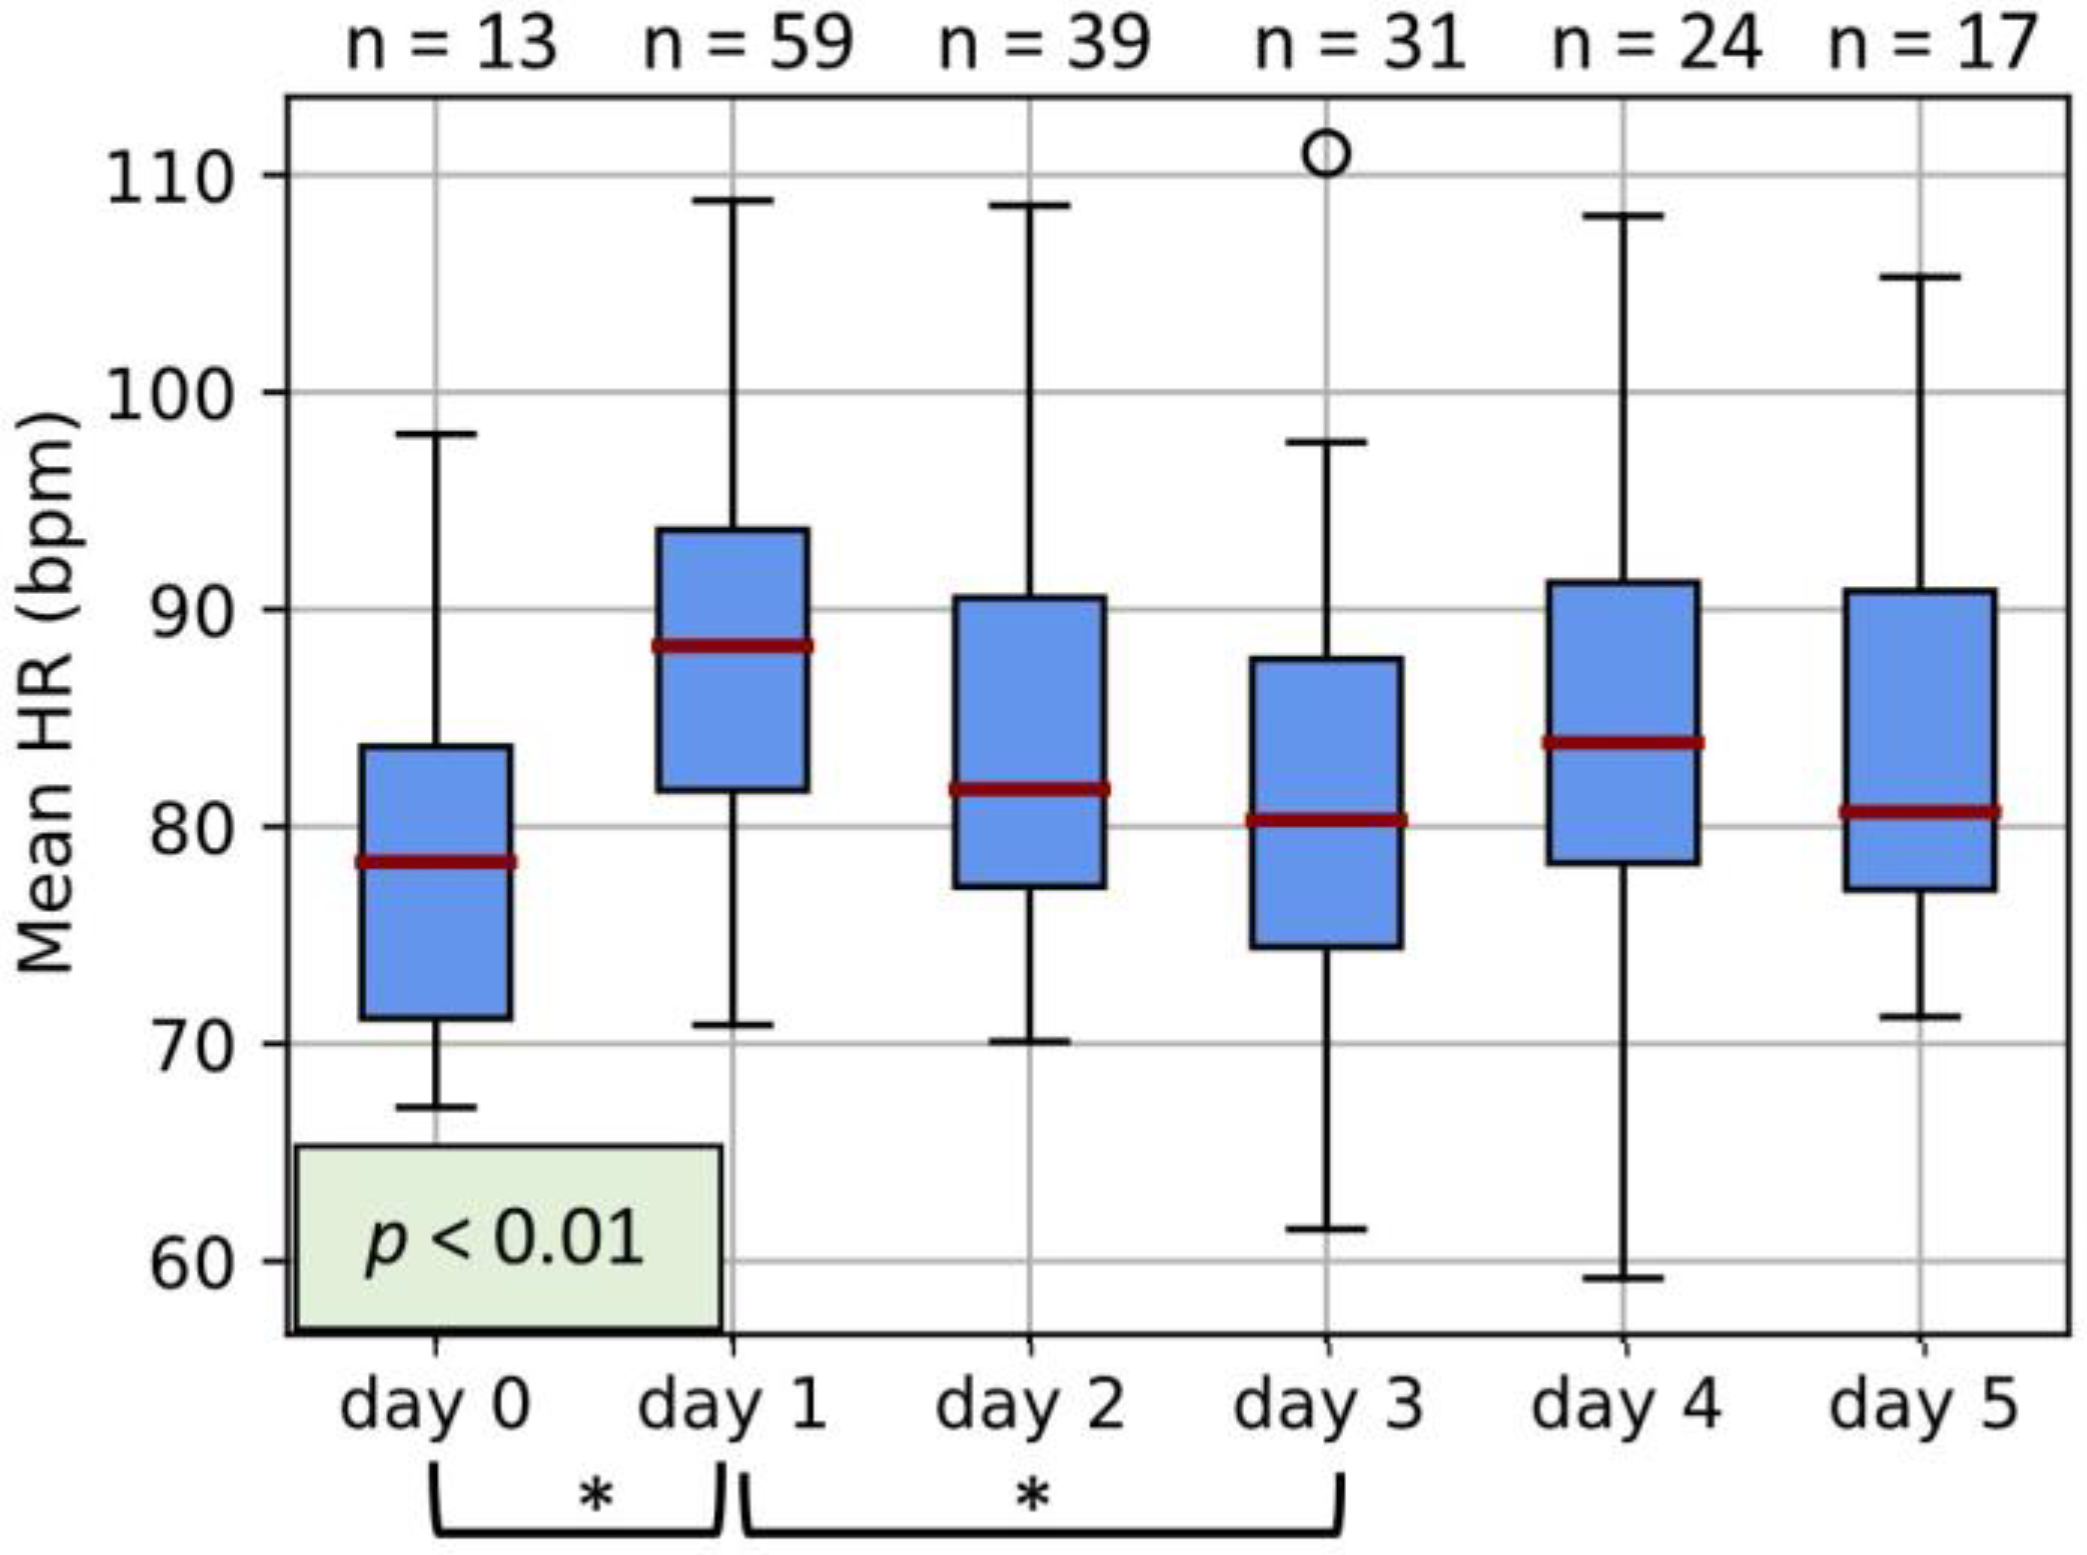
3.1. Maternal HR
3.2. Maternal HRV
4. Discussion
5. Conclusions
Author Contributions
Funding
Institutional Review Board Statement
Informed Consent Statement
Data Availability Statement
Conflicts of Interest
Appendix A


References
- Liggins, C.; Howie, R. A controlled trial of antepartum glucocorticoid treatment for prevention of the respiratory distress syndrome in premature infants. Pediatrics 1972, 50, 515–525. [Google Scholar] [CrossRef]
- Kemp, M.W.; Newnham, J.P.; Challis, J.G.; Jobe, A.H.; Stock, S.J. The clinical use of corticosteroids in pregnancy. Hum. Reprod. Update 2015, 22, 240–259. [Google Scholar] [CrossRef] [Green Version]
- Shanks, A.L.; Grasch, J.L.; Quinney, S.K.; Haas, D.M. Controversies in antenatal corticosteroids. Semin. Fetal. Neonatal Med. 2019, 24, 182–188. [Google Scholar] [CrossRef]
- Hantoushzadeh, S.; Saleh, M.; Maleki, A. Effects of antenatal corticosteroids on maternal cardiovascular system, an underestimated notion in pregnant women. BJOG Int. J. Obstet. Gynaecol. 2022, 129, 834–835. [Google Scholar] [CrossRef]
- Tsai, P. Re: Effects of antenatal corticosteroids on maternal cardiovascular system, an underestimated notion in pregnant women. BJOG Int. J. Obstet. Gynaecol. 2022, 129, 835–836. [Google Scholar] [CrossRef]
- Timmermans, S.; Souffriau, J.; Libert, C. A General Introduction to Glucocorticoid Biology. Front. Immunol. 2019, 10, 1545. [Google Scholar] [CrossRef] [Green Version]
- Cottin, F.; Malcurat, V.; Zorgati, H.; Prieur, F.; Labsy, Z.; Do, M.C.; Gagey, O.; Collomp, K. Effect of oral glucocorticoid intake on autonomic cardiovascular control. SpringerPlus 2015, 4, 622. [Google Scholar] [CrossRef] [PubMed] [Green Version]
- Haddad, S.; Souza, R.; Cecatti, J.; The WHO Intrapartum Care Algorithms Working Group. Management of maternal pulse and blood pressure abnormalities during labour and childbirth: Evidence-based algorithms for intrapartum care decision support. BJOG Int. J. Obstet. Gynaecol. 2022. [Google Scholar] [CrossRef] [PubMed]
- Shields, L.E.; Wiesner, S.; Klein, C.; Pelletreau, B.; Hedriana, H.L. Use of Maternal Early Warning Trigger tool reduces maternal morbidity. Am. J. Obstet. Gynecol. 2016, 214, 527.e1–527.e6. [Google Scholar] [CrossRef]
- Ekholm, E.M.K.; Piha, S.J.; Erkkola, R.U.; Antila, K.J. Autonomic cardiovascular reflexes in pregnancy. A longitudinal study. Clin. Auton. Res. 1994, 4, 161–165. [Google Scholar] [CrossRef]
- Moors, S.; Staaks, K.J.J.; Westerhuis, M.E.M.H.; Dekker, L.R.C.; Verdurmen, K.M.J.; Oei, S.G.; van Laar, J.O.E.H. Heart rate variability in hypertensive pregnancy disorders: A systematic review. Pregnancy Hypertens. 2020, 20, 56–68. [Google Scholar] [CrossRef] [PubMed]
- Täufer Cederlöf, E.; Lundgren, M.; Lindahl, B.; Christersson, C. Pregnancy Complications and Risk of Cardiovascular Disease Later in Life: A Nationwide Cohort Study. J. Am. Heart Assoc. 2022, 11, e023079. [Google Scholar] [CrossRef] [PubMed]
- Reyes, L.M.; Khurana, R.; Usselman, C.W.; Busch, S.A.; Skow, R.J.; Boulé, N.G.; Davenport, M.H.; Steinback, C.D. Sympathetic nervous system activity and reactivity in women with gestational diabetes mellitus. Physiol. Rep. 2020, 8, e14504. [Google Scholar] [CrossRef]
- Shaffer, F.; Ginsberg, J.P. An Overview of Heart Rate Variability Metrics and Norms. Front. Public Health 2017, 5, 258. [Google Scholar] [CrossRef] [Green Version]
- Rowan, S.P.; Lilly, C.L.; Claydon, E.A.; Wallace, J.; Merryman, K. Monitoring one heart to help two: Heart rate variability and resting heart rate using wearable technology in active women across the perinatal period. BMC Pregnancy Childbirth 2022, 22, 887. [Google Scholar] [CrossRef]
- Rang, S.; Wolf, H.; Montfrans, G.A.; Karemaker, J.M. Non–invasive assessment of autonomic cardiovascular control in normal human pregnancy and pregnancy- associated hypertensive disorders: A review. J. Hypertens. 2002, 20, 2111–2119. [Google Scholar] [CrossRef] [Green Version]
- Pal, G.K.; Shyma, P.; Habeebullah, S.; Shyjus, P.; Pal, P. Spectral Analysis of Heart Rate Variability for Early Prediction of Pregnancy-Induced Hypertension. Clin. Exp. Hypertens. 2009, 31, 330–341. [Google Scholar] [CrossRef]
- Bester, M.; Moors, S.; Joshi, R.; Nichting, T.J.; van der Hout-van der Jagt, M.B.; Oei, S.G.; Mischi, M.; Vullings, R.; van Laar, J.O.E.H. Changes in Maternal Heart Rate Variability in Response to the Administration of Routine Obstetric Medication in Hospitalized Patients: Study Protocol for a Cohort Study (MAMA-Heart Study). Clin. Pract. 2021, 11, 13–25. [Google Scholar] [CrossRef] [PubMed]
- Verdurmen, K.M.J.; Warmerdam, G.J.J.; Lempersz, C.; Hulsenboom, A.D.J.; Renckens, J.; Dieleman, J.P.; Vullings, R.; van Laar, J.O.E.H.; Oei, S.G. The influence of betamethasone on fetal heart rate variability, obtained by non-invasive fetal electrocardiogram recordings. Early Hum. Dev. 2018, 119, 8–14. [Google Scholar] [CrossRef]
- Noben, L.; Verdurmen, K.M.J.; Warmerdam, G.J.J.; Vullings, R.; Oei, S.G.; van Laar, J.O.E.H. The fetal electrocardiogram to detect the effects of betamethasone on fetal heart rate variability. Early Hum. Dev. 2019, 130, 57–64. [Google Scholar] [CrossRef]
- Verdurmen, K.; Van, L.J.; Oei, S. Corticosteroids and fetal heart rate variability. J. Matern. Fetal Neonatal Med. 2014, 27, 361. [Google Scholar] [CrossRef]
- Rooijakkers, M.J.; Song, S.; Rabotti, C.; Oei, S.G.; Bergmans, J.W.M.; Cantatore, E.; Mischi, M. Influence of Electrode Placement on Signal Quality for Ambulatory Pregnancy Monitoring. Comput. Math. Methods Med. 2014, 2014, 960980. [Google Scholar] [CrossRef] [PubMed] [Green Version]
- Rooijakkers, M.J.; Rabotti, C.; Bennebroek, M.; van Meerbergen, J.; Mischi, M. Low-complexity R-peak detection in ECG signals: A preliminary step towards ambulatory fetal monitoring. In Proceedings of the 2011 Annual International Conference of the IEEE Engineering in Medicine and Biology Society, Boston, MA, USA, 30 August–3 September 2011; pp. 1761–1764. [Google Scholar]
- Bester, M.; Joshi, R.; Mischi, M.; van Laar, J.O.E.H.; Vullings, R. Longitudinally Tracking Maternal Autonomic Modulation During Normal Pregnancy With Comprehensive Heart Rate Variability Analyses. Front. Physiol. 2022, 13, 874684. [Google Scholar] [CrossRef]
- Peters, C.; Vullings, R.; Bergmans, J.; Oei, G.; Wijn, P. The effect of artifact correction on spectral estimates of heart rate variability. In Proceedings of the 2008 30th Annual International Conference of the IEEE Engineering in Medicine and Biology Society, Vancouver, BC, Canada, 20–24 August 2008; pp. 2669–2672. [Google Scholar]
- Peters, C.H.L.; Vullings, R.; Rooijakkers, M.J.; Bergmans, J.W.M.; Oei, S.G.; Wijn, P.F.F. A continuous wavelet transform-based method for time-frequency analysis of artefact-corrected heart rate variability data. Physiol. Meas. 2011, 32, 1517–1527. [Google Scholar] [CrossRef] [PubMed]
- Campana, L.M.; Owens, R.L.; Clifford, G.D.; Pittman, S.D.; Malhotra, A. Phase-rectified signal averaging as a sensitive index of autonomic changes with aging. J. Appl. Physiol. 2010, 108, 1668–1673. [Google Scholar] [CrossRef]
- Task Force of The European Society of Cardiology and The North American Society of Pacing and Electrophysiology Heart rate variability. Standards of measurement, physiological interpretation, and clinical use. Eur. Heart J. 1996, 17, 354–381. [CrossRef] [Green Version]
- Khandoker, A.H.; Karmakar, C.; Brennan, M.; Palaniswami, M.; Voss, A. Poincaré Plot Methods for Heart Rate Variability Analysis; Springer: Boston, MA, USA, 2013; ISBN 978-1-4614-7374-9. [Google Scholar]
- Peng, C.-K.; Havlin, S.; Stanley, H.E.; Goldberger, A.L. Quantification of scaling exponents and crossover phenomena in nonstationary heartbeat time series. Chaos Interdiscip. J. Nonlinear Sci. 1995, 5, 82–87. [Google Scholar] [CrossRef]
- Richman, J.S.; Moorman, J.R. Physiological time-series analysis using approximate entropy and sample entropy. Am. J. Physiol.-Heart Circ. Physiol. 2000, 278, H2039–H2049. [Google Scholar] [CrossRef] [Green Version]
- Bakhchina, A.; Arutyunova, K.; Sozinov, A.; Demidovsky, A.; Alexandrov, Y. Sample Entropy of the Heart Rate Reflects Properties of the System Organization of Behaviour. Entropy 2018, 20, 449. [Google Scholar] [CrossRef] [Green Version]
- Yeh, R.-G.; Shieh, J.-S.; Chen, G.-Y.; Kuo, C.-D. Detrended fluctuation analysis of short-term heart rate variability in late pregnant women. Auton. Neurosci. 2009, 150, 122–126. [Google Scholar] [CrossRef]
- Sapolsky, R.M.; Romero, L.M.; Munck, A.U. How Do Glucocorticoids Influence Stress Responses? Integrating Permissive, Suppressive, Stimulatory, and Preparative Actions. Endocr. Rev. 2000, 21, 35. [Google Scholar]
- Green, L.J.; Mackillop, L.H.; Salvi, D.; Pullon, R.; Loerup, L.; Tarassenko, L.; Mossop, J.; Edwards, C.; Gerry, S.; Birks, J.; et al. Gestation-Specific Vital Sign Reference Ranges in Pregnancy. Obstet. Gynecol. 2020, 135, 653–664. [Google Scholar] [CrossRef] [PubMed]
- Bester, M.; Joshi, R.; Linders, A.; Mischi, M.; van Laar, J.O.E.H.; Vullings, R. Characterizing the effect of demographics, cardiorespiratory factors, and inter-subject variation on maternal heart rate variability in pregnancy with statistical modeling: A retrospective observational analysis. Sci. Rep. 2022, 12, 19305. [Google Scholar] [CrossRef] [PubMed]
- Schweizer, M.W.; Brachmann, J.; Kirchner, U.; Walter-Sack, I.; Dickhaus, H.; Metze, C.; Kubler, W. Heart rate variability in time and frequency domains: Effects of gallopamil, nifedipine, and metoprolol compared with placebo. Heart 1993, 70, 252–258. [Google Scholar] [CrossRef] [PubMed]
- Sarumi, M.A.; Hole, J.W.; Gherman, R.B. Maternal Bradycardia Associated with Betamethasone Administration During Pregnancy. Case Rep. Obstet. Gynecol. 2019, 2019, 6873057. [Google Scholar] [CrossRef] [Green Version]
- Koenen, S.V.; Mecenas, C.A.; Smith, G.S.; Jenkins, S.; Nathanielsz, P.W. Effects of maternal betamethasone administration on fetal and maternal blood pressure and heart rate in the baboon at 0.7 of gestation. Am. J. Obstet. Gynecol. 2002, 186, 812–817. [Google Scholar] [CrossRef]
- Matera, M.G.; Rinaldi, B.; Calzetta, L.; Rogliani, P.; Cazzola, M. Pharmacokinetics and pharmacodynamics of inhaled corticosteroids for asthma treatment. Pulm. Pharmacol. Ther. 2019, 58, 101828. [Google Scholar] [CrossRef]
- Koenen, S.V.; Mulder, E.J.H.; Wijnberger, L.D.; Visser, G.H.A. Transient Loss of the Diurnal Rhythms of Fetal Movements, Heart Rate, and Its Variation after Maternal Betamethasone Administration. Pediatr. Res. 2005, 57, 662–666. [Google Scholar] [CrossRef] [Green Version]
- Agorastos, A.; Heinig, A.; Stiedl, O.; Hager, T.; Sommer, A.; Müller, J.C.; Schruers, K.R.; Wiedemann, K.; Demiralay, C. Vagal effects of endocrine HPA axis challenges on resting autonomic activity assessed by heart rate variability measures in healthy humans. Psychoneuroendocrinology 2019, 102, 196–203. [Google Scholar] [CrossRef]
- Jobe, A.H.; Milad, M.A.; Peppard, T.; Jusko, W.J. Pharmacokinetics and Pharmacodynamics of Intramuscular and Oral Betamethasone and Dexamethasone in Reproductive Age Women in India. Clin. Transl. Sci. 2019, 13, 391–399. [Google Scholar] [CrossRef] [Green Version]
- MSD. Celestone Chronodose, Suspensie Voor Injectie 5.7 mg/mL; Merck Sharp & Dohme B.V.: Haarlen, The Netherlands, 2018. [Google Scholar]
- Thayer, J.F.; Sternberg, E. Beyond Heart Rate Variability: Vagal Regulation of Allostatic Systems. Ann. N. Y. Acad. Sci. 2006, 1088, 361–372. [Google Scholar] [CrossRef] [PubMed]
- Mazgelytė, E.; Chomentauskas, G.; Dereškevičiūtė, E.; Rekienė, V.; Jakaitienė, A.; Petrėnas, T.; Songailienė, J.; Utkus, A.; Aušrelė, K.; Karčiauskaitė, D. Association of salivary steroid hormones and their ratios with time-domain heart rate variability indices in healthy individuals. J. Med. Biochem. 2021, 40, 173–180. [Google Scholar] [CrossRef] [PubMed]
- Pellissier, S.; Dantzer, C.; Mondillon, L.; Trocme, C.; Gauchez, A.-S.; Ducros, V.; Mathieu, N.; Toussaint, B.; Fournier, A.; Canini, F.; et al. Relationship between Vagal Tone, Cortisol, TNF-Alpha, Epinephrine and Negative Affects in Crohn’s Disease and Irritable Bowel Syndrome. PLoS ONE 2014, 9, e105328. [Google Scholar] [CrossRef] [Green Version]
- Golczynska, A.; Lenders, J.W.M.; Goldstein, D.S. Glucocorticoid-induced sympathoinhibition in humans. Clin. Pharmacol. Ther. 1995, 58, 90–98. [Google Scholar] [CrossRef] [PubMed] [Green Version]
- Berry, N.T.; Rhea, C.K.; Wideman, L. Cardio-Hypothalamic-Pituitary Coupling during Rest and in Response to Exercise. Entropy 2022, 24, 1045. [Google Scholar] [CrossRef]
- Bechtold, A.G.; Scheuer, D.A. Glucocorticoids act in the dorsal hindbrain to modulate baroreflex control of heart rate. Am. J. Physiol.-Regul. Integr. Comp. Physiol. 2006, 290, R1003–R1011. [Google Scholar] [CrossRef]
- Ballard, L.; Ballard, A. Scientific basis and therapeutic regimens for use of antenatal glucocorticoids. Am. J. Obstet. Gynecol. 1995, 173, 254–262. [Google Scholar] [CrossRef] [PubMed]


| Characteristic | |
|---|---|
| Indication for betamethasone (no. of participants) | |
| Threatened preterm labor | 18 |
| Vaginal bleeding | 9 |
| Preterm rupture of membranes | 12 |
| Preeclampsia | 2 |
| HELLP | 2 |
| Fetal intra-uterine growth restriction | 3 |
| Gestational age at inclusion (weeks + days) | 29 weeks 2 days (26 weeks–31 weeks 2 days) |
| BMI | 24.4 (21.9–29.3) kg/m2 |
| Nulliparous | 41.3% |
| Co-administration of other medications (no. of participants) | |
| Antibiotics (erythromycin or Augmentin) | 13 |
| Nifedipine | 25 |
| Anti-hypertensive (methyldopa or labetalol) | 5 |
| Magnesium sulfate | 5 |
| Atosiban | 3 |
Disclaimer/Publisher’s Note: The statements, opinions and data contained in all publications are solely those of the individual author(s) and contributor(s) and not of MDPI and/or the editor(s). MDPI and/or the editor(s) disclaim responsibility for any injury to people or property resulting from any ideas, methods, instructions or products referred to in the content. |
© 2023 by the authors. Licensee MDPI, Basel, Switzerland. This article is an open access article distributed under the terms and conditions of the Creative Commons Attribution (CC BY) license (https://creativecommons.org/licenses/by/4.0/).
Share and Cite
Bester, M.; Joshi, R.; van Dooren, J.H.A.M.; Mischi, M.; Vullings, R.; van Laar, J.O.E.H. Changes in Maternal Heart Rate and Autonomic Regulation following the Antenatal Administration of Corticosteroids: A Secondary Analysis. J. Clin. Med. 2023, 12, 588. https://doi.org/10.3390/jcm12020588
Bester M, Joshi R, van Dooren JHAM, Mischi M, Vullings R, van Laar JOEH. Changes in Maternal Heart Rate and Autonomic Regulation following the Antenatal Administration of Corticosteroids: A Secondary Analysis. Journal of Clinical Medicine. 2023; 12(2):588. https://doi.org/10.3390/jcm12020588
Chicago/Turabian StyleBester, Maretha, Rohan Joshi, Joyce H. A. M. van Dooren, Massimo Mischi, Rik Vullings, and Judith O. E. H. van Laar. 2023. "Changes in Maternal Heart Rate and Autonomic Regulation following the Antenatal Administration of Corticosteroids: A Secondary Analysis" Journal of Clinical Medicine 12, no. 2: 588. https://doi.org/10.3390/jcm12020588
APA StyleBester, M., Joshi, R., van Dooren, J. H. A. M., Mischi, M., Vullings, R., & van Laar, J. O. E. H. (2023). Changes in Maternal Heart Rate and Autonomic Regulation following the Antenatal Administration of Corticosteroids: A Secondary Analysis. Journal of Clinical Medicine, 12(2), 588. https://doi.org/10.3390/jcm12020588