Article

Phenotypic Clustering of Beta-Thalassemia Intermedia Patients Using Cardiovascular Magnetic Resonance

1
Department of Radiology, Fondazione G. Monasterio CNR-Regione Toscana, 56124 Pisa, PI, Italy
2
Unità Operativa Complessa Bioingegneria, Fondazione G. Monasterio CNR-Regione Toscana, 56124 Pisa, PI, Italy
3
Dipartimento di Ingegneria dell’Informazione, Università degli Studi di Pisa, 56122 Pisa, PI, Italy
4
Unità Operativa Complessa Ricerca Clinica, Fondazione G. Monasterio CNR-Regione Toscana, 56124 Pisa, PI, Italy
5
Unità Operativa Radiologia Universitaria, Azienda Ospedaliero-Universitaria “S. Anna”, 44124 Cona, FE, Italy
6
Sezione di Scienze Radiologiche, Dipartimento di Biopatologia e Biotecnologie Mediche, Policlinico “Paolo Giaccone”, 90127 Palermo, PA, Italy
7
Struttura Complessa di Cardioradiologia-UTIC, Presidio Ospedaliero “Giovanni Paolo II”, 88046 Lamezia Terme, CZ, Italy
8
Unità Operativa Complessa Diagnostica per Immagini, Ospedale “Sandro Pertini”, 00157 Roma, RM, Italy
9
Unità Operativa Semplice Dipartimentale Malattie Rare del Globulo Rosso, Azienda Ospedaliera di Rilievo Nazionale “A. Cardarelli”, 80131 Napoli, NA, Italy
10
Unità Operativa Semplice Talassemia, Presidio Ospedaliero “Umberto I”, 96100 Siracusa, SR, Italy
11
Ematologia Microcitemia, Ospedale San Giovanni di Dio—ASP Crotone, 88900 Crotone, KR, Italy
12
Unità Operativa Semplice Dipartimentale di Talassemia, Presidio Ospedaliero “Giovanni Paolo II”—Distretto AG2 di Sciacca, 92019 Sciacca, AG, Italy
13
Unità Operativa Complessa Ematologia con Talassemia, ARNAS Civico “Benfratelli-Di Cristina”, 90134 Palermo, PA, Italy
*
Author to whom correspondence should be addressed.
J. Clin. Med. 2023, 12(21), 6706; https://doi.org/10.3390/jcm12216706
Submission received: 13 September 2023 / Revised: 13 October 2023 / Accepted: 16 October 2023 / Published: 24 October 2023
(This article belongs to the Special Issue Advances in Clinical Cardiovascular Magnetic Resonance Imaging)

Abstract

:
We employed an unsupervised clustering method that integrated demographic, clinical, and cardiac magnetic resonance (CMR) data to identify distinct phenogroups (PGs) of patients with beta-thalassemia intermedia (β-TI). We considered 138 β-TI patients consecutively enrolled in the Myocardial Iron Overload in Thalassemia (MIOT) Network who underwent MR for the quantification of hepatic and cardiac iron overload (T2* technique), the assessment of biventricular size and function and atrial dimensions (cine images), and the detection of replacement myocardial fibrosis (late gadolinium enhancement technique). Three mutually exclusive phenogroups were identified based on unsupervised hierarchical clustering of principal components: PG1, women; PG2, patients with replacement myocardial fibrosis, increased biventricular volumes and masses, and lower left ventricular ejection fraction; and PG3, men without replacement myocardial fibrosis, but with increased biventricular volumes and masses and lower left ventricular ejection fraction. The hematochemical parameters and the hepatic and cardiac iron levels did not contribute to the PG definition. PG2 exhibited a significantly higher risk of future cardiovascular events (heart failure, arrhythmias, and pulmonary hypertension) than PG1 (hazard ratio-HR = 10.5; p = 0.027) and PG3 (HR = 9.0; p = 0.038). Clustering emerged as a useful tool for risk stratification in TI, enabling the identification of three phenogroups with distinct clinical and prognostic characteristics.

1. Introduction

Beta-thalassemias are inherited disorders determined by a decrease (β+) or absence (β0) of the production of β-globin chains [1,2]. The spectrum of beta-thalassemias ranges from thalassemia minor, which presents as mild hypochromic microcytic anemia without significant clinical symptoms, to beta-thalassemia major (β-TM), which is characterized by severe anemia starting in early childhood and requiring lifelong regular blood transfusions [3]. Beta-thalassemia intermedia (β-TI) falls between these two extremes, with manifestations that are less severe than those of β-TM, but more significant than those of thalassemia minor [4]. β-TI is categorized as one of the non-transfusion-dependent thalassemias (NTDTs), along with mild/moderate HbE/β-thalassemia and α-thalassemia intermedia. NTDT refers to thalassemic conditions in which regular transfusions are unnecessary for the patient’s survival [5]. However, certain β-TI patients may necessitate transfusions during specific circumstances, such as pregnancy, acute infections, and surgery, or may require regular blood transfusions at some stage of their lives to ensure proper growth, prevent complications, or manage existing ones [6,7,8].
In β-TI, the clinical manifestations are heterogeneous and arise from three main underlying factors: ineffective erythropoiesis, chronic anemia, and iron overload. The ineffective production of red blood cells and the presence of chronic anemia result in the suppression of hepcidin, a hormone involved in regulating iron levels [9,10]. This reduction in the hepcidin levels causes an increase in iron absorption from the gastrointestinal tract and prompts the release of previously recycled iron from the reticuloendothelial system [11]. In β-TI, the liver is the main site for iron accumulation, while the heart is relatively spared [12,13,14,15,16,17]. Chronic anemia triggers a series of compensatory mechanisms within the cardiovascular system. Initially, the body responds to hypoxia by increasing cardiac output through various adaptations, including an elevation in heart rate and an increase in stroke volume [18,19]. To sustain the increased workload, the heart undergoes structural changes, including the enlargement of its chambers [20]. Since this remodeling can lead to decreased cardiac function and heart failure over time, regular cardiac monitoring, allowing for prompt intervention and therapy, may help to slow the progression of early stage disease and avoid the onset of overt cardiovascular disease.
Cardiac magnetic resonance (CMR) imaging provides a valuable means to assess and understand the physiological and pathological aspects of the heart. CMR is considered the gold standard for the quantification of biventricular volumes, masses, and functions due to its exceptional accuracy and reproducibility [21,22]. Moreover, CMR is the reference standard for the non-invasive quantification of tissue iron overload by the T2* technique [23,24,25] and allows the non-invasive detection of myocardial fibrosis [22,26,27].
The interpretation and integration of CMR, demographic, and clinical parameters can be complex and challenging, often requiring expert knowledge and experience. Machine learning algorithms provide a means to uncover hidden patterns within complex and heterogeneous datasets [28,29,30]. Supervised learning involves training a model to classify or predict specific outputs or outcomes based on labeled training data. Conversely, unsupervised learning algorithms work by exploring the intrinsic characteristics and organization of the data themselves to discover hidden insights, detect anomalies, or identify similarities or patterns between variables. Common unsupervised learning methods include clustering algorithms that classify data points into distinct groups or categories based on their intrinsic characteristics or proximity to one another [31,32]. Cluster analysis has been successfully applied in healthcare, allowing the identification of phenogroups or clusters with specific clinical and prognostic profiles in different disease settings [33,34,35,36,37,38,39].
The aims of this multicenter study were: (1) to demonstrate the ability of an unsupervised clustering approach to identify phenogroups among patients with β-TI using demographic, clinical, and CMR data; (2) to determine the clinical implications of the detected phenogroups by discovering their association with distinct profiles in the baseline characteristics; and (3) to assess the prognostic value of the detected phenogroups by comparing the cardiovascular outcomes.

2. Materials and Methods

2.1. Patient Population

We considered 342 β-TI patients (mean age: 38.4 ± 11.7 years; 50.9% females) consecutively enrolled within the Myocardial Iron Overload in Thalassemia (MIOT) Network. The MIOT Network was an Italian Network of 70 thalassemia centers and 10 magnetic resonance imaging (MRI) sites adopting a standardized and homogeneous MRI protocol [40,41]. All patients underwent their first MRI examination between April 2006 and May 2014. According to the study’s protocol, patients underwent regular MRI follow-up examinations every 18 ± 3 months. All the MIOT centers were interconnected through a shared web-based database, where a detailed clinical history of the patients was recorded [42]. The clinical and instrumental data were updated in correspondence to each new MRI scan.
The study received approval from the institutional ethics committee and was conducted in compliance with the principles stated in the Declaration of Helsinki. Informed consent was obtained from all patients.

2.2. Patient Follow-Up and Outcomes

A comprehensive follow-up was conducted for all patients until the end of the MIOT project (November 2015). For each patient, a case report form detailing cardiovascular outcomes between the last available MRI and November 2015 was completed by the caring hematologist.
The following cardiovascular events were considered: heart failure (HF), arrhythmias, and pulmonary hypertension (PH). HF diagnosis was performed by clinicians based on symptoms, signs, and instrumental findings according to the American Heart Association (AHA)/American College of Cardiology (ACC) guidelines [43]. Arrhythmias were diagnosed if documented by electrocardiogram (ECG) or 24 h Holter ECG and if specific medications were required. The classification of arrhythmias was carried out according to the AHA/ACC guidelines [44]. PH was diagnosed if the trans-tricuspidal velocity jet measured by echocardiography exceeded 3.2 m/s [45]. If a patient had more than one complication, only the first one was taken into account.

2.3. Magnetic Resonance Imaging

MRI examinations were conducted using 1.5 T scanners from three main vendors (GE Healthcare, Milwaukee, WI, USA; Philips, Best, The Netherlands; and Siemens Healthineers, Erlangen, Germany) equipped with phased-array coils. Breath-holding end-expiration and ECG gating were employed for signal reception.
To assess iron overload, T2* gradient-echo multiecho sequences were used. A single axial mid-hepatic slice [40] and three parallel short-axis views (basal, medium, and apical) of the left ventricle (LV) were acquired [41]. Analysis of the T2* images was carried out using custom-written, previously validated software (HIPPOMIOT®,Version 1.0, Consiglio Nazionale delle Ricerche and Fondazione Toscana Gabriele Monasterio, Pisa, Italy) [46]. The liver T2* value was measured within a standard-sized region of interest (ROI), carefully selected to be devoid of blood vessels and distant from areas more susceptible to artifacts caused by magnetic susceptibility [40,47]. The conversion of liver T2* into liver iron concentration (LIC) values was performed by employing the calibration curve introduced by Wood et al. [48]. The software provided T2* values for all 16 segments of the LV following the standard AHA/ACC model [49]. To account for susceptibility and geometric artifacts, an appropriate correction map was applied [46]. The global heart T2* value was derived from the average of the 16 segmental T2* values.
To quantify biventricular function parameters, steady-state free procession (SSFP) end-expiration breath-hold cines were acquired in contiguous short-axis slices (slice thickness 8 mm, without gap) from the atrioventricular ring to the apex. The analysis of the images followed a standard procedure conducted by experienced observers [50]. The process involved manual contouring of the epicardial and endocardial borders in relevant slices during the end-diastolic and end-systolic phases. The interventricular septum was considered part of the LV. Additionally, the papillary muscles and trabeculations within the LV and right ventricular (RV) cavities were included in the respective cavity volumes. The end-diastolic volume (EDV) and end-systolic volume (ESV) were calculated without making geometric assumptions. The ejection fraction (EF) was determined by dividing the stroke volume (difference between EDV and ESV) by the EDV. The wall mass was obtained by multiplying the volume of the myocardium by its specific weight, which was assumed to be 1.05 g/cm3. The assessment of the RV mass was centralized in the coordinating center of the MIOT Network and performed by a single experienced operator. The left and right atrial areas were assessed from the four-chamber view projection during the ventricular end-systolic phase. To account for individual variations, the biventricular volumes, masses, and atrial areas were indexed to the body surface area (BSA).
To detect the presence of focal/replacement myocardial fibrosis, late gadolinium enhancement (LGE) images were obtained 10–18 min after the intravenous administration of a standard dose (0.2 mmol/kg) of Gadobutrol (Gadovist®; Bayer Schering Pharma; Berlin, Germany) using a fast gradient-echo inversion recovery T1 weighted sequence. Short-axis and vertical, horizontal, and oblique long-axis views were acquired. LGE images were not acquired in patients with a glomerular filtration rate inferior to 30 mL/min/1.73 m2, nor in patients who declined the administration of the contrast medium. The presence of LGE was determined based on visual assessment in at least two different views [51].

2.4. Cluster Analysis

The cluster analysis was performed using the free software R (version 4.3.1).
A total of 16 clinical and CMR variables were selected for the clustering model and the determination of phenogroups. There were three categorical variables (sex, presence of regular transfusions, and replacement myocardial fibrosis) and 13 continuous variables (age, mean serum hemoglobin, mean serum ferritin, MRI LIC, global heart T2* values, LV and RV end-diastolic volume index, LV and RV mass index, LV and RV EF, and left and right atrial area index).

2.5. Data Pre-Processing

The raw clinical data were pre-elaborated before the application of clustering algorithms.
To handle the missing data, the complete case analysis strategy was adopted: patients with missing data on any input variable were excluded from the analysis.
To ensure that variables with different ranges contributed equally to the clustering process, normalization of continuous variables was performed. Z-score normalization (or standardization), scaling the data by the mean and standard deviation, was chosen.

2.6. Evaluation of Clustering Tendency

The Hopkins statistic was computed by the Hopkins function (Hopkins 1.0 package) to determine if the observations within the dataset were clusterizable [52]. The Hopkins statistic measures the probability that a given data set is created by a uniform data distribution. The Hopkins statistic score is between 0 and 1, with a value of >0.5 indicating that the dataset is clusterizable.

2.7. Definition of Phenogroups

Phenogroups were defined using an unsupervised hierarchical clustering on principal components (HCPC) approach, performed by the functions MFA and HCPC of the FactoMineR 2.8 package.
The algorithm consisted of two steps. First, a multiple-factor analysis (MFA) was conducted. MFA is an extension of principal component analysis (PCA), which is able to handle both continuous and categorical variables [53]. PCA is a technique for reducing the dimensionality of large datasets containing highly correlated variables [54]. It identifies the underlying structure in a single set of variables by creating a smaller set of synthetic variables that explain most of the variability in the original data. Conversely to PCA, MFA allows for the analysis of multiple related data tables simultaneously. Individual PCA is conducted on each data table (table of continuous variables and table of categorical variables) to obtain the principal components and their associated variance. These individual PCA results are then combined using appropriate weighting schemes to create a joint factorial space. This joint space captures the overall relationships and variability between the different groups.
In the second step, the hierarchical clustering algorithm was applied to the principal component space [55]. The data points were grouped into phenogroups based on their proximity in the principal component space. The Euclidean distance, based on the concept of Euclidean geometry, where distances are measured along straight paths, was employed to determine the similarity between pairs of data points. This information was crucial for constructing the dendrogram, which visually represents the clustering process and enables the identification of phenogroups at different levels of similarity. Ward’s method was used to build the dendrogram tree.
The optimal number of phenogroups was suggested by the HCPC function itself, and the estimation was based on the between-variance. The optimal number of phenogroups was also estimated by using the NbClust function (Nbclust 3.0.1 package), which provided the calculation of 30 different indexes.
The over- or under-representation of variables in each phenogroup was evaluated by the v-test, based on the hypergeometric distribution, using the catdes function (FactoMineR 2.8 package).

2.8. Supervised Random Forest

Random forest (RF) is a machine learning algorithm classified as an ensemble method, comprising multiple decision trees trained on distinct subsets of data and features [56,57]. In the supervised setting, it necessitates labeled data with known target variables during the training phase.
In this study, the phenogroups generated by the unsupervised HCPC method were used as inputs for the supervised RF algorithm (randomForest function of the randomForest 4.7.1.1 package) to detect which patient parameters or features were most influential in distinguishing the phenogroups. The sample variables and number of trees were set to 4 and 500, respectively.
The mean decrease in the Gini coefficient was used to assess the importance of each input variable. A high mean decrease Gini score signifies higher relevance.

2.9. Statistical Analysis

All data were analyzed using SPSS version 27.0 (Chicago, IL, USA).
Continuous variables were presented as mean ± standard deviation (SD). Categorical variables were represented as counts with percentages.
The normality of the parameter distribution was evaluated through the Kolmogorov–Smirnov test.
Group comparisons were conducted using one-way ANOVA for continuous values with normal distribution and the Kruskal–Wallis test for continuous values with non-normal distributions. Χ2 testing was employed for categorical variables. The Bonferroni test was used for the post hoc analysis where appropriate.
The Cox proportional hazard model was employed to determine the effect of the phenogroups on the outcome. The results were presented as the hazard ratio (HR) with 95% confidence intervals (CI). Kaplan–Meier curves were generated and the log-rank test was employed to compare the different phenogroups regarding event-free survival.
In all tests, a 2-tailed probability value of 0.05 was considered statistically significant.

3. Results

3.1. Patients’ Characteristics

Twenty-three patients were excluded from the present study because a cardiac complication was present at the time of their first MRI. Specifically, seven patients had HF, six had arrhythmias, six had PH, two had HF and arrhythmias, and two had HF and PH.
Among the remaining 319 patients, 101 (31.7%) did not receive the contrast medium and were excluded from the analysis, reducing the study size to 218. SSFP images were not acquired for 13 patients because the lack of collaboration caused the advanced interruption of the exam. Moreover, out of the available 205 SSFP acquisitions, 67 were not collected in Pisa, making it not possible to assess the RV mass index. Therefore, the final study population comprised 138 patients for which all MRI parameters were measured.
Table 1 shows the clinical and MRI characteristics of the 138 considered patients. All patients were white and had a homogeneous sex distribution.
Replacement myocardial fibrosis was detected in 37 (26.8%) patients. Thirty-six patients had non-ischemic LGE patterns, while a subendocardial LGE pattern, typical of coronary artery disease, was found in one patient. Eleven patients had a single focus, while twenty-six had at least two foci. The mean number of LGE segments per patient was 2.4 ± 1.3. LGE involved the septal region in 81.1% of patients.

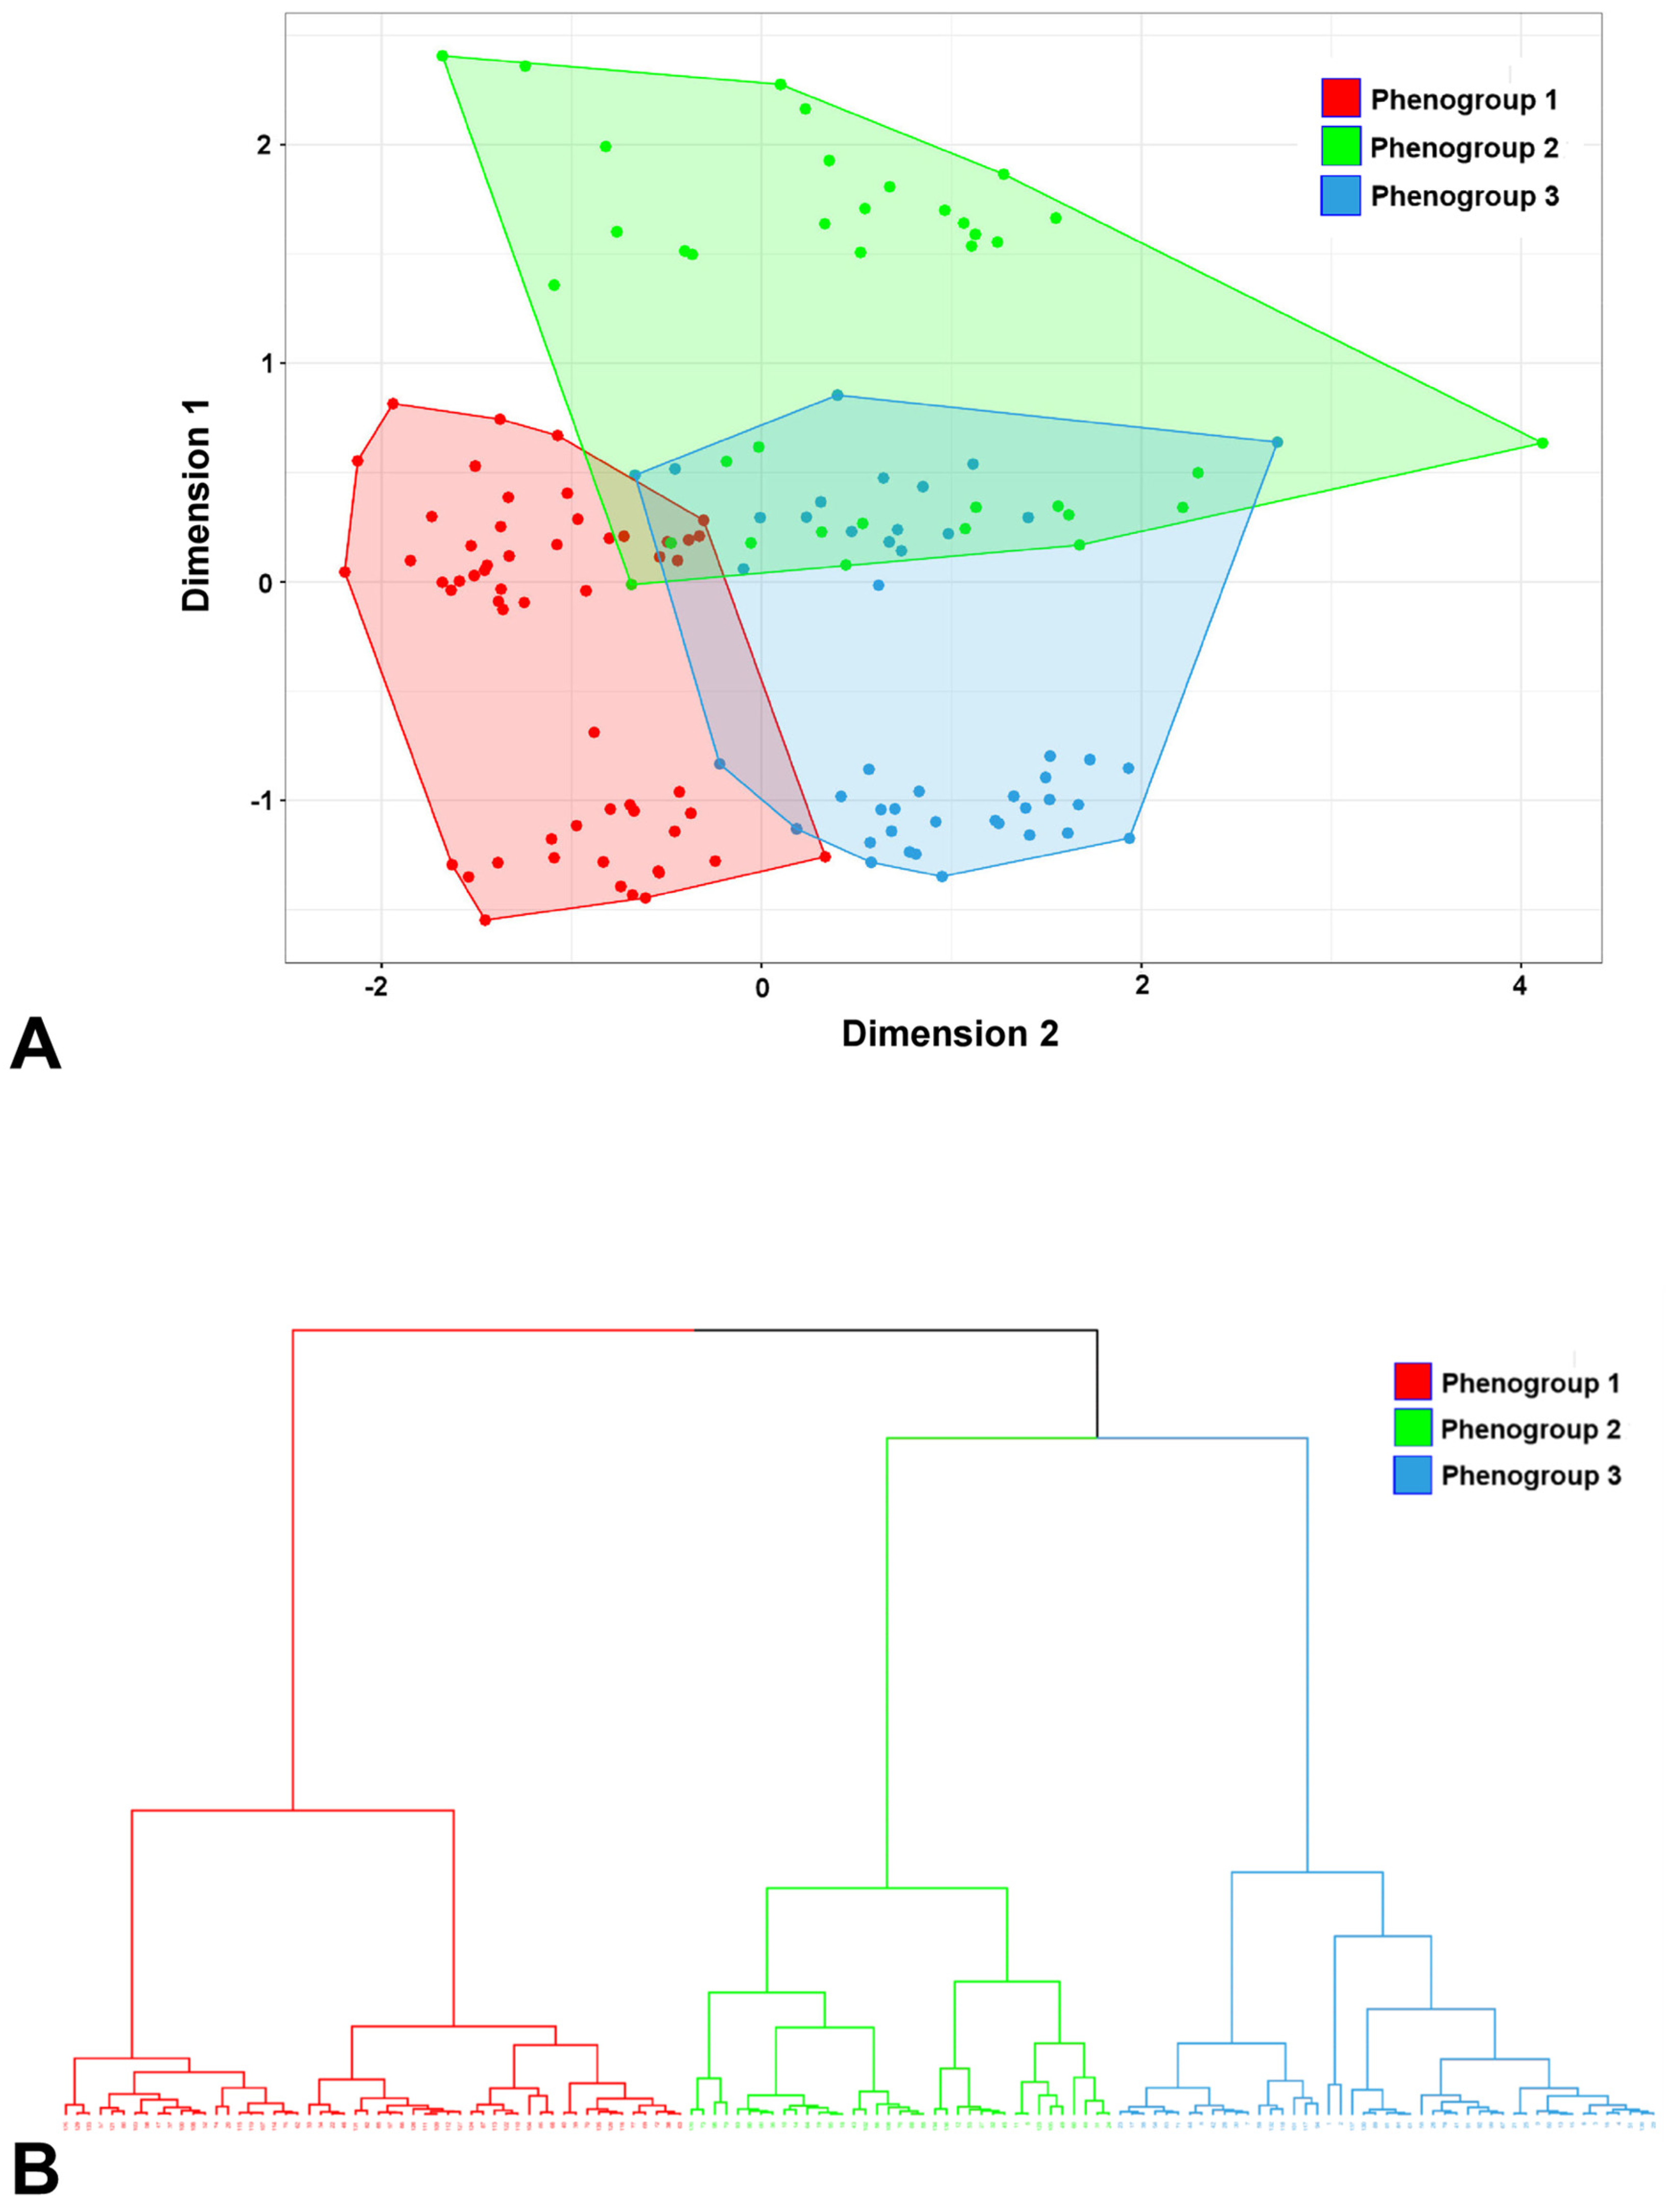
3.2. Clustering Results

The Hopkins statistic score was 0.99, revealing a strong clustering tendency within the set of observations.
The number of PCs to use as input for hierarchical clustering was chosen to guarantee at least 80% of the explained variance, and this was obtained with seven or more PCs. By choosing seven PCs, the dimension of the problem was strongly reduced: the sixteen original variables were replaced by seven synthetic variables (the seven PCs). Table 2 shows the percentage contributions of the variables to the seven dimensions.
Hierarchical clustering analysis indicated that the achievement of the highest gain in inertia or within-group variance was achieved with three phenogroups. Accordingly, the majority of indexes (18/30) evaluated by the Nbclust package proposed three as the best number of phenogroups for the considered dataset.
The three phenogroups are visible upon projection into a two-dimensional correspondence analysis biplot (Figure 1A). A dendrogram representation of the three phenogroups is presented in Figure 1B.

3.3. Comparison among Phenogroups

Nine input variables contributed differently to the definition of the patient’s phenogroups (Figure 2). Age, hematochemical parameters, hepatic and cardiac iron levels, left trial area index, and RV EF did not contribute. Table 3 shows the differences among the three phenogroups.
Phenogroup 1 (56 patients; 40.6%) comprised almost exclusively women (98.2%). It exhibited significantly lower biventricular end-diastolic volume indexes and masses indexed by BSA and significantly higher LV EF compared with both phenogroups 2 and 3. No patient in this group had replacement myocardial fibrosis.
Phenogroup 2 (37 patients; 26.8%) was well balanced between sexes (45.9% females) and included all patients with replacement myocardial fibrosis.
Phenogroup 3 (45 patients; 32.6%) comprised only men and was characterized by the absence of replacement myocardial fibrosis.

3.4. Relevant Features for Clustering

In the supervised RF analysis, sex and replacement myocardial fibrosis by LGE emerged as the key parameters that significantly contributed to the differentiation of patients in each phenogroup (Figure 3). The presence of regular transfusions was associated with the lower mean Gini index.

3.5. Association of Phenogroups with Cardiovascular Complications

The mean follow-up time was 55.8 ± 22.7 months (median 54.0 months).
Cardiac events were recorded in 10 patients (7.2%). There was one episode of HF, five arrhythmias (all supraventricular), and four PH. The overall mean time elapsing between the first MR scan and the occurrence of a cardiac complication was 37.4 ± 26.5 months, and three (30.0%) cardiac events occurred within the first year of follow-up.
The prevalence of cardiovascular events was significantly higher in phenogroup 2 than in both phenogroup 1 (21.6% vs. 1.8%; p = 0.006) and phenogroup 3 (21.6% vs. 2.2%; p = 0.027) (Figure 4A). Phenogroup 2 was associated with a significantly increased risk of cardiovascular complications compared with phenogroup 1 (HR = 10.5, 95%CI = 1.3–83.9; p = 0.027) as well as phenogroup 3 (HR = 9.0, 95%CI = 1.1–72.1; p = 0.038). Figure 4B shows the Kaplan–Meier curve. The log-rank test demonstrated significant differences in the occurrence of cardiovascular complications across phenogroups (p = 0.002).

4. Discussion

Machine learning algorithms possess the ability to process large volumes of data, identify patterns, and make predictions, which makes them well-suited for analyzing complex and diverse datasets commonly found in medical research. In the present study, we employed unsupervised clustering analysis on demographic, clinical, and CMR data with the aim of uncovering meaningful patterns and groupings within the β-TI population. Within the β-TI population, a substantial heterogeneity exists in patient characteristics, illness severity, and responses to treatment. Gaining a deeper insight into such heterogeneity could pave the way for more personalized care to better suit patient profiles. The statistical method of cluster analysis is a means by which such heterogeneity can be understood. We identified three mutually exclusive phenogroups of patients characterized by different levels of cardiac involvement and risks of cardiovascular outcomes.
Phenogroup 1 was primarily composed of female patients, while phenogroup 3 comprised only males. This gender difference may be the main cause of the difference between these two phenogroups in biventricular volumes and masses. Indeed, in healthy subjects [58,59] as well as in patients with hemoglobinopathies [50,60], all biventricular volume indexes as well as the LV mass index were demonstrated to be significantly greater in males compared with females. Conversely, phenogroup 1 was associated with a significantly higher LV EF. Several recent large-scale studies that used CMR or echocardiographic techniques detected a significantly greater LV EF in women compared with men [59,61,62]. Kerkhof et al. suggested that this finding may be explained by the disproportional increase in EF at smaller end-systolic volumes in women [63]. However, it is important to underline that phenogroups 1 and 3 were comparable in terms of prognosis. Therefore, although gender emerged as one of the key parameters that significantly contributed to the differentiation of patients in phenogroups, it did not play a significant role in cardiac risk stratification.
Phenogroup 2 included all patients with replacement myocardial fibrosis. These patients accounted for more than one-quarter of the total β-TI population (26.8%), indicating that replacement myocardial fibrosis is relatively common among Italian β-TI patients. Importantly, participants belonging to phenogroup 2 had a significantly increased risk of cardiovascular events compared with those in both phenogroups 1 and 3. The frequency of positive LGE was the only CMR parameter that significantly differed between phenogroups 2 and 3. At the same time, no difference was detected in biventricular volumes, ejection fractions, masses, or bi-atrial areas. These results suggest that, in β-TI, replacement myocardial fibrosis is potentially a better marker of cardiovascular risk stratification than conventional cardiac function parameters. In line with our findings, a growing body of evidence has shown the prognostic significance of LGE in predicting cardiovascular complications and death in both ischemic and nonischemic cardiomyopathies [64,65,66,67,68]. In particular, in thalassemia major, where the introduction of the T2* technique allowed for better management and control of cardiac iron, myocardial fibrosis emerged as the most potent predictor of HF and cardiac complications [69]. Unlike cardiac dysfunction and iron accumulation, fibrosis appears to be an irreversible process, suggestive of a potentially more significant and lasting injury to the myocardium. Although more studies involving larger cohorts of patients are needed to confirm the important prognostic implications of replacement myocardial fibrosis, the inclusion of LGE imaging within the cardiac MRI exam, if not contraindicated, can indeed be of significant value in the cardiological management of TI patients. The serial injection of Gadobutrol in patients with thalassemia without neurological lesions was demonstrated to be safe [51] and to not cause a signal hyperintensity of the dentate nucleus, globus pallidum, pons, and thalamus, potentially associated with the tissue deposition of the contrast media [70].
The cardiac T2* values did not provide sufficient discriminatory information to effectively distinguish or separate patients into their respective phenogroups. This result can be explained by the fact that the majority of our patients had normal (>20 ms) or only slightly reduced T2* values. It is well known that the T2* technique has reduced sensitivity for detecting changes associated with mild or early myocardial iron overload [71,72].
The three phenogroups were comparable in terms of the frequency of regular transfusions. This finding recalls a recent study that applied unsupervised RF clustering to identify subgroups of clinical severity in a large cohort of β-thalassemia patients, including TM patients, regularly transfused TI patients, and non-transfused TI patients [73]. Nineteen indicators of phenotype severity, which did not include MRI data, were considered, and the presence of regular transfusions did not play a significant role in grouping the patients into phenogroups.

Limitations

Our study is not free from limitations.
The study was completed over 7 years ago and had a relatively small sample size. Moreover, all patients were from Italy, which possesses one of the best standards of care for thalassemia, arising from the high prevalence of the disease and availability of resources. All these factors may limit the generalizability of our findings. Therefore, new larger studies involving patients from different countries and backgrounds are needed to confirm our results.
As usual in clinical trials [74], complete case analysis (case deletion) was selected as the method for handling missing data in our dataset: all cases (patients) with missing data were discarded from the analysis. We basically assumed that the missing data were missing at random or completely at random (i.e., missingness was unrelated to the variables of interest or other observed characteristics). In this scenario, complete case analysis can yield unbiased estimates. Complete case analysis led to a significant decrease in the sample size, potentially reducing the statistical power of the analysis. Different approaches, like multiple imputation, maximum likelihood estimation, or weighted methods, can be used to impute or estimate the missing values [75]. Replacing missing clinical values with synthetically generated values enables the inclusion of all available cases in the analysis. However, imputing missing data involves making assumptions about the missing values, and these assumptions may not accurately represent the true values for the missing observations. In addition, imputation can alter the intrinsic characteristics of a dataset, introduce biases, and distort the relationships between variables.
Due to the limited number of events, we had to pool multiple types of cardiovascular events together, combining them into a single composite endpoint. Therefore, we could not evaluate the associations of the phenogroups with specific outcomes.
The current study was not designed to assess which CMR or clinical parameter was most powerful in predicting cardiovascular events.
The adopted approach represents a significant departure from traditional studies. Although phenogrouping holds the potential to pave the way for a more personalized approach to patient management, its actual impact on clinical decision-making is yet to be fully explored and understood.

5. Conclusions

Within the β-TI population, unsupervised learning algorithms, which integrated routinely measured CMR parameters, led to the identification of three phenogroups with distinct clinical and prognostic characteristics. Unsupervised phenogrouping conveys the potential to significantly impact patient care and improve cardiovascular outcomes by enabling the early detection of cardiac remodeling and damage, as well as enhanced risk stratification.

Author Contributions

Conceptualization, A.M., V.P. and A.C.; methodology, A.M., M.P. and V.P.; software, M.P. and V.P.; formal analysis, A.M., M.P. and V.P.; investigation, A.M., M.P. and V.P.; resources, E.G., S.R., P.F., A.S. (Anna Spasiano), A.S. (Alessandra Salvo), S.B., C.G. and Z.B.; data curation, L.P.; writing-original draft preparation, A.M.; writing—review and editing, M.P., L.P., A.C., E.G., S.R., P.F., A.S. (Anna Spasiano), A.S. (Alessandra Salvo), S.B., C.G., Z.B., F.C. and V.P.; supervision, F.C. All authors have read and agreed to the published version of the manuscript.

Funding

The MIOT project received “no-profit support” from industrial sponsorships (Chiesi Farmaceutici S.p.A. and ApoPharma Inc.). The funders had no role in the study design, data collection and analysis, decision to publish, or preparation of the manuscript.

Institutional Review Board Statement

This study was conducted according to the guidelines of the Declaration of Helsinki and approved by the Institutional Ethics Committee of Area Vasta Nord Ovest (protocol code 34008, date of approval 29 September 2006).

Informed Consent Statement

Informed consent was obtained from all subjects involved in the study.

Data Availability Statement

The data underlying this article cannot be shared publicly due to privacy reasons. The data will be shared on reasonable request to the corresponding author.

Acknowledgments

We would like to thank all the colleagues involved in the MIOT project (https://miot.ftgm.it/) and all patients for their cooperation.

Conflicts of Interest

The authors declare no conflict of interest.

References

  1. Weatherall, D.J. The thalassaemias. BMJ 1997, 314, 1675–1678. [Google Scholar] [CrossRef] [PubMed]
  2. Galanello, R.; Origa, R. Beta-thalassemia. Orphanet J. Rare Dis. 2010, 5, 11. [Google Scholar] [CrossRef] [PubMed]
  3. Rund, D.; Rachmilewitz, E. Beta-thalassemia. N. Engl. J. Med. 2005, 353, 1135–1146. [Google Scholar] [CrossRef] [PubMed]
  4. Ben Salah, N.; Bou-Fakhredin, R.; Mellouli, F.; Taher, A.T. Revisiting beta thalassemia intermedia: Past, present, and future prospects. Hematology 2017, 22, 607–616. [Google Scholar] [CrossRef] [PubMed]
  5. Weatherall, D.J. The definition and epidemiology of non-transfusion-dependent thalassemia. Blood Rev. 2012, 26 (Suppl. S1), S3–S6. [Google Scholar] [CrossRef] [PubMed]
  6. Taher, A.T.; Musallam, K.M.; El-Beshlawy, A.; Karimi, M.; Daar, S.; Belhoul, K.; Saned, M.S.; Graziadei, G.; Cappellini, M.D. Age-related complications in treatment-naive patients with thalassaemia intermedia. Br. J. Haematol. 2010, 150, 486–489. [Google Scholar] [CrossRef] [PubMed]
  7. Taher, A.T.; Musallam, K.M.; Karimi, M.; El-Beshlawy, A.; Belhoul, K.; Daar, S.; Saned, M.S.; El-Chafic, A.H.; Fasulo, M.R.; Cappellini, M.D. Overview on practices in thalassemia intermedia management aiming for lowering complication rates across a region of endemicity: The OPTIMAL CARE study. Blood 2010, 115, 1886–1892. [Google Scholar] [CrossRef] [PubMed]
  8. Haddad, A.; Tyan, P.; Radwan, A.; Mallat, N.; Taher, A. beta-Thalassemia Intermedia: A Bird’s-Eye View. Turk. J. Haematol. 2014, 31, 5–16. [Google Scholar] [CrossRef] [PubMed]
  9. Ginzburg, Y.; Rivella, S. beta-thalassemia: A model for elucidating the dynamic regulation of ineffective erythropoiesis and iron metabolism. Blood 2011, 118, 4321–4330. [Google Scholar] [CrossRef] [PubMed]
  10. Zhang, D.L.; Senecal, T.; Ghosh, M.C.; Ollivierre-Wilson, H.; Tu, T.; Rouault, T.A. Hepcidin regulates ferroportin expression and intracellular iron homeostasis of erythroblasts. Blood 2011, 118, 2868–2877. [Google Scholar] [CrossRef] [PubMed]
  11. D’Angelo, G. Role of hepcidin in the pathophysiology and diagnosis of anemia. Blood Res. 2013, 48, 10–15. [Google Scholar] [CrossRef] [PubMed]
  12. Origa, R.; Barella, S.; Argiolas, G.M.; Bina, P.; Agus, A.; Galanello, R. No evidence of cardiac iron in 20 never- or minimally-transfused patients with thalassemia intermedia. Haematologica 2008, 93, 1095–1096. [Google Scholar] [CrossRef] [PubMed]
  13. Roghi, A.; Cappellini, M.D.; Wood, J.C.; Musallam, K.M.; Patrizia, P.; Fasulo, M.R.; Cesaretti, C.; Taher, A.T. Absence of cardiac siderosis despite hepatic iron overload in Italian patients with thalassemia intermedia: An MRI T2* study. Ann. Hematol. 2010, 89, 585–589. [Google Scholar] [CrossRef] [PubMed]
  14. Liguori, C.; Pitocco, F.; Di Giampietro, I.; De Vivo, A.E.; Schena, E.; Giurazza, F.; Sorrentino, F.; Zobel, B.B. Magnetic resonance comparison of left-right heart volumetric and functional parameters in thalassemia major and thalassemia intermedia patients. Biomed. Res. Int. 2015, 2015, 857642. [Google Scholar] [CrossRef] [PubMed]
  15. Taher, A.T.; Musallam, K.M.; Wood, J.C.; Cappellini, M.D. Magnetic resonance evaluation of hepatic and myocardial iron deposition in transfusion-independent thalassemia intermedia compared to regularly transfused thalassemia major patients. Am. J. Hematol. 2010, 85, 288–290. [Google Scholar] [CrossRef] [PubMed]
  16. Meloni, A.; Pistoia, L.; Gamberini, M.R.; Ricchi, P.; Cecinati, V.; Sorrentino, F.; Cuccia, L.; Allo, M.; Righi, R.; Fina, P.; et al. The Link of Pancreatic Iron with Glucose Metabolism and Cardiac Iron in Thalassemia Intermedia: A Large, Multicenter Observational Study. J. Clin. Med. 2021, 10, 5561. [Google Scholar] [CrossRef] [PubMed]
  17. Ricchi, P.; Meloni, A.; Pistoia, L.; Spasiano, A.; Spiga, A.; Allo, M.; Gamberini, M.R.; Lisi, R.; Campisi, S.; Peluso, A.; et al. The effect of desferrioxamine chelation versus no therapy in patients with non transfusion-dependent thalassaemia: A multicenter prospective comparison from the MIOT network. Ann. Hematol. 2018, 97, 1925–1932. [Google Scholar] [CrossRef] [PubMed]
  18. Varat, M.A.; Adolph, R.J.; Fowler, N.O. Cardiovascular effects of anemia. Am. Heart J. 1972, 83, 415–426. [Google Scholar] [CrossRef] [PubMed]
  19. Williams, A.M.; Levine, B.D.; Stembridge, M. A change of heart: Mechanisms of cardiac adaptation to acute and chronic hypoxia. J. Physiol. 2022, 600, 4089–4104. [Google Scholar] [CrossRef] [PubMed]
  20. Aessopos, A.; Berdoukas, V. Cardiac function and iron chelation in thalassemia major and intermedia: A review of the underlying pathophysiology and approach to chelation management. Mediterr. J. Hematol. Infect. Dis. 2009, 1, e2009002. [Google Scholar] [CrossRef] [PubMed]
  21. Pennell, D.J. Cardiovascular Magnetic Resonance. Circulation 2010, 121, 692–705. [Google Scholar] [CrossRef] [PubMed]
  22. Han, Y.; Chen, Y.; Ferrari, V.A. Contemporary Application of Cardiovascular Magnetic Resonance Imaging. Annu. Rev. Med. 2020, 71, 221–234. [Google Scholar] [CrossRef] [PubMed]
  23. Wood, J.C. Diagnosis and management of transfusion iron overload: The role of imaging. Am. J. Hematol. 2007, 82, 1132–1135. [Google Scholar] [CrossRef] [PubMed]
  24. Pennell, D.J.; Udelson, J.E.; Arai, A.E.; Bozkurt, B.; Cohen, A.R.; Galanello, R.; Hoffman, T.M.; Kiernan, M.S.; Lerakis, S.; Piga, A.; et al. Cardiovascular function and treatment in beta-thalassemia major: A consensus statement from the American Heart Association. Circulation 2013, 128, 281–308. [Google Scholar] [CrossRef] [PubMed]
  25. Meloni, A.; Maggio, A.; Positano, V.; Leto, F.; Angelini, A.; Putti, M.C.; Maresi, E.; Pucci, A.; Basso, C.; Perazzolo Marra, M.; et al. CMR for Myocardial Iron Overload Quantification: Calibration Curve from the MIOT Network. Eur. Radiol. 2020, 29, 2246–2252. [Google Scholar] [CrossRef] [PubMed]
  26. Mahrholdt, H.; Wagner, A.; Judd, R.M.; Sechtem, U.; Kim, R.J. Delayed enhancement cardiovascular magnetic resonance assessment of non-ischaemic cardiomyopathies. Eur. Heart J. 2005, 26, 1461–1474. [Google Scholar] [CrossRef] [PubMed]
  27. Hassan, S.; Barrett, C.J.; Crossman, D.J. Imaging tools for assessment of myocardial fibrosis in humans: The need for greater detail. Biophys. Rev. 2020, 12, 969–987. [Google Scholar] [CrossRef] [PubMed]
  28. Mahesh, B. Machine learning algorithms-a review. Int. J. Sci. Res. 2020, 9, 381–386. [Google Scholar]
  29. Pugliese, R.; Regondi, S.; Marini, R. Machine learning-based approach: Global trends, research directions, and regulatory standpoints. Data Sci. Manag. 2021, 4, 19–29. [Google Scholar] [CrossRef]
  30. Peng, J.; Jury, E.C.; Dönnes, P.; Ciurtin, C. Machine Learning Techniques for Personalised Medicine Approaches in Immune-Mediated Chronic Inflammatory Diseases: Applications and Challenges. Front. Pharmacol. 2021, 12, 720694. [Google Scholar] [CrossRef] [PubMed]
  31. Loftus, T.J.; Shickel, B.; Balch, J.A.; Tighe, P.J.; Abbott, K.L.; Fazzone, B.; Anderson, E.M.; Rozowsky, J.; Ozrazgat-Baslanti, T.; Ren, Y.; et al. Phenotype clustering in health care: A narrative review for clinicians. Front. Artif. Intell. 2022, 5, 842306. [Google Scholar] [CrossRef] [PubMed]
  32. Ezugwu, A.E.; Ikotun, A.M.; Oyelade, O.O.; Abualigah, L.; Agushaka, J.O.; Eke, C.I.; Akinyelu, A.A. A comprehensive survey of clustering algorithms: State-of-the-art machine learning applications, taxonomy, challenges, and future research prospects. Eng. Appl. Artif. Intell. 2022, 110, 104743. [Google Scholar] [CrossRef]
  33. Shah, S.J.; Katz, D.H.; Selvaraj, S.; Burke, M.A.; Yancy, C.W.; Gheorghiade, M.; Bonow, R.O.; Huang, C.C.; Deo, R.C. Phenomapping for novel classification of heart failure with preserved ejection fraction. Circulation 2015, 131, 269–279. [Google Scholar] [CrossRef] [PubMed]
  34. Verdonschot, J.A.J.; Merlo, M.; Dominguez, F.; Wang, P.; Henkens, M.T.H.M.; Adriaens, M.E.; Hazebroek, M.R.; Masè, M.; Escobar, L.E.; Cobas-Paz, R.; et al. Phenotypic clustering of dilated cardiomyopathy patients highlights important pathophysiological differences. Eur. Heart J. 2020, 42, 162–174. [Google Scholar] [CrossRef] [PubMed]
  35. Pezel, T.; Unterseeh, T.; Hovasse, T.; Asselin, A.; Lefèvre, T.; Chevalier, B.; Neylon, A.; Benamer, H.; Champagne, S.; Sanguineti, F.; et al. Phenotypic Clustering of Patients With Newly Diagnosed Coronary Artery Disease Using Cardiovascular Magnetic Resonance and Coronary Computed Tomography Angiography. Front. Cardiovasc. Med. 2021, 8, 760120. [Google Scholar] [CrossRef] [PubMed]
  36. Yamga, E.; Mullie, L.; Durand, M.; Cadrin-Chenevert, A.; Tang, A.; Montagnon, E.; Chartrand-Lefebvre, C.; Chassé, M. Interpretable clinical phenotypes among patients hospitalized with COVID-19 using cluster analysis. Front. Digit. Health 2023, 5, 1142822. [Google Scholar] [CrossRef] [PubMed]
  37. Koo, H.-K.; Min, J.; Kim, H.W.; Ko, Y.; Oh, J.Y.; Jeong, Y.-J.; Kang, H.H.; Kang, J.Y.; Lee, S.-S.; Seo, M.; et al. Cluster analysis categorizes five phenotypes of pulmonary tuberculosis. Sci. Rep. 2022, 12, 10084. [Google Scholar] [CrossRef] [PubMed]
  38. Robinson, G.A.; Peng, J.; Dönnes, P.; Coelewij, L.; Naja, M.; Radziszewska, A.; Wincup, C.; Peckham, H.; Isenberg, D.A.; Ioannou, Y.; et al. Disease-associated and patient-specific immune cell signatures in juvenile-onset systemic lupus erythematosus: Patient stratification using a machine-learning approach. Lancet Rheumatol. 2020, 2, e485–e496. [Google Scholar] [CrossRef] [PubMed]
  39. Figgett, W.A.; Monaghan, K.; Ng, M.; Alhamdoosh, M.; Maraskovsky, E.; Wilson, N.J.; Hoi, A.Y.; Morand, E.F.; Mackay, F. Machine learning applied to whole-blood RNA-sequencing data uncovers distinct subsets of patients with systemic lupus erythematosus. Clin. Transl. Immunol. 2019, 8, e01093. [Google Scholar] [CrossRef] [PubMed]
  40. Positano, V.; Salani, B.; Pepe, A.; Santarelli, M.F.; De Marchi, D.; Ramazzotti, A.; Favilli, B.; Cracolici, E.; Midiri, M.; Cianciulli, P.; et al. Improved T2* assessment in liver iron overload by magnetic resonance imaging. Magn. Reson. Imaging 2009, 27, 188–197. [Google Scholar] [CrossRef] [PubMed]
  41. Meloni, A.; Positano, V.; Pepe, A.; Rossi, G.; Dell’Amico, M.; Salvatori, C.; Keilberg, P.; Filosa, A.; Sallustio, G.; Midiri, M.; et al. Preferential patterns of myocardial iron overload by multislice multiecho T*2 CMR in thalassemia major patients. Magn. Reson. Med. 2010, 64, 211–219. [Google Scholar] [CrossRef] [PubMed]
  42. Meloni, A.; Ramazzotti, A.; Positano, V.; Salvatori, C.; Mangione, M.; Marcheschi, P.; Favilli, B.; De Marchi, D.; Prato, S.; Pepe, A.; et al. Evaluation of a web-based network for reproducible T2* MRI assessment of iron overload in thalassemia. Int. J. Med. Inform. 2009, 78, 503–512. [Google Scholar] [CrossRef] [PubMed]
  43. Jessup, M.; Abraham, W.T.; Casey, D.E.; Feldman, A.M.; Francis, G.S.; Ganiats, T.G.; Konstam, M.A.; Mancini, D.M.; Rahko, P.S.; Silver, M.A.; et al. 2009 focused update: ACCF/AHA Guidelines for the Diagnosis and Management of Heart Failure in Adults: A report of the American College of Cardiology Foundation/American Heart Association Task Force on Practice Guidelines: Developed in collaboration with the International Society for Heart and Lung Transplantation. Circulation 2009, 119, 1977–2016. [Google Scholar] [PubMed]
  44. Buxton, A.E.; Calkins, H.; Callans, D.J.; DiMarco, J.P.; Fisher, J.D.; Greene, H.L.; Haines, D.E.; Hayes, D.L.; Heidenreich, P.A.; Miller, J.M.; et al. ACC/AHA/HRS 2006 key data elements and definitions for electrophysiological studies and procedures: A report of the American College of Cardiology/American Heart Association Task Force on Clinical Data Standards (ACC/AHA/HRS Writing Committee to Develop Data Standards on Electrophysiology). Circulation 2006, 114, 2534–2570. [Google Scholar] [PubMed]
  45. Cogliandro, T.; Derchi, G.; Mancuso, L.; Mayer, M.C.; Pannone, B.; Pepe, A.; Pili, M.; Bina, P.; Cianciulli, P.; De Sanctis, V.; et al. Guideline recommendations for heart complications in thalassemia major. J. Cardiovasc. Med. 2008, 9, 515–525. [Google Scholar] [CrossRef] [PubMed]
  46. Positano, V.; Pepe, A.; Santarelli, M.F.; Scattini, B.; De Marchi, D.; Ramazzotti, A.; Forni, G.; Borgna-Pignatti, C.; Lai, M.E.; Midiri, M.; et al. Standardized T2* map of normal human heart in vivo to correct T2* segmental artefacts. NMR Biomed. 2007, 20, 578–590. [Google Scholar] [CrossRef] [PubMed]
  47. Meloni, A.; Luciani, A.; Positano, V.; De Marchi, D.; Valeri, G.; Restaino, G.; Cracolici, E.; Caruso, V.; Dell’amico, M.C.; Favilli, B.; et al. Single region of interest versus multislice T2* MRI approach for the quantification of hepatic iron overload. J. Magn. Reson. Imaging 2011, 33, 348–355. [Google Scholar] [CrossRef] [PubMed]
  48. Wood, J.C.; Enriquez, C.; Ghugre, N.; Tyzka, J.M.; Carson, S.; Nelson, M.D.; Coates, T.D. MRI R2 and R2* mapping accurately estimates hepatic iron concentration in transfusion-dependent thalassemia and sickle cell disease patients. Blood 2005, 106, 1460–1465. [Google Scholar] [CrossRef] [PubMed]
  49. Cerqueira, M.D.; Weissman, N.J.; Dilsizian, V.; Jacobs, A.K.; Kaul, S.; Laskey, W.K.; Pennell, D.J.; Rumberger, J.A.; Ryan, T.; Verani, M.S. Standardized myocardial segmentation and nomenclature for tomographic imaging of the heart. A statement for healthcare professionals from the Cardiac Imaging Committee of the Council on Clinical Cardiology of the American Heart Association. Circulation 2002, 105, 539–542. [Google Scholar] [PubMed]
  50. Meloni, A.; Righi, R.; Missere, M.; Renne, S.; Schicchi, N.; Gamberini, M.R.; Cuccia, L.; Lisi, R.; Spasiano, A.; Roberti, M.G.; et al. Biventricular Reference Values by Body Surface Area, Age, and Gender in a Large Cohort of Well-Treated Thalassemia Major Patients Without Heart Damage Using a Multiparametric CMR Approach. J. Magn. Reson. Imaging 2021, 53, 61–70. [Google Scholar] [CrossRef] [PubMed]
  51. Meloni, A.; Favilli, B.; Positano, V.; Cianciulli, P.; Filosa, A.; Quarta, A.; D’Ascola, D.; Restaino, G.; Lombardi, M.; Pepe, A. Safety of cardiovascular magnetic resonance gadolinium chelates contrast agents in patients with hemoglobinopaties. Haematologica 2009, 94, 1625–1627. [Google Scholar] [CrossRef] [PubMed]
  52. Hopkins, B.; Skellam, J.G. A New Method for determining the Type of Distribution of Plant Individuals. Ann. Bot. 1954, 18, 213–227. [Google Scholar] [CrossRef]
  53. Abdi, H.; Valentin, D. Multiple Factor Analysis (MFA). In Encyclopedia of Measurement and Statistics; Sage Publications: Thousand Oaks, CA, USA, 2007. [Google Scholar]
  54. Jolliffe, I.T. Principal Component Analysis; Springer: Berlin/Heidelberg, Germany, 2002. [Google Scholar]
  55. Josse, J. Principal Component Methods—Hierarchical Clustering—Partitional Clustering: Why Would We Need to Choose for Visualizing Data? Agrocampus Ouest: Rennes, France, 2010. [Google Scholar]
  56. Rigatti, S.J. Random Forest. J. Insur. Med. 2017, 47, 31–39. [Google Scholar] [CrossRef] [PubMed]
  57. Parmar, A.; Katariya, R.; Patel, V. A Review on Random Forest: An Ensemble Classifier. In Proceedings of the International Conference on Intelligent Data Communication Technologies and Internet of Things (ICICI) 2018, Coimbatore, India, 7–8 August 2018; Springer International Publishing: Cham, Switzerland, 2019; pp. 758–763. [Google Scholar]
  58. Kawel-Boehm, N.; Maceira, A.; Valsangiacomo-Buechel, E.R.; Vogel-Claussen, J.; Turkbey, E.B.; Williams, R.; Plein, S.; Tee, M.; Eng, J.; Bluemke, D.A. Normal values for cardiovascular magnetic resonance in adults and children. J. Cardiovasc. Magn. Reson. 2015, 17, 29. [Google Scholar] [CrossRef] [PubMed]
  59. Petersen, S.E.; Aung, N.; Sanghvi, M.M.; Zemrak, F.; Fung, K.; Paiva, J.M.; Francis, J.M.; Khanji, M.Y.; Lukaschuk, E.; Lee, A.M.; et al. Reference ranges for cardiac structure and function using cardiovascular magnetic resonance (CMR) in Caucasians from the UK Biobank population cohort. J. Cardiovasc. Magn. Reson. 2017, 19, 18. [Google Scholar] [CrossRef] [PubMed]
  60. Meloni, A.; Detterich, J.; Berdoukas, V.; Pepe, A.; Lombardi, M.; Coates, T.D.; Wood, J.C. Comparison of biventricular dimensions and function between pediatric sickle-cell disease and thalassemia major patients without cardiac iron. Am. J. Hematol. 2013, 88, 213–218. [Google Scholar] [CrossRef] [PubMed]
  61. Chung, A.K.; Das, S.R.; Leonard, D.; Peshock, R.M.; Kazi, F.; Abdullah, S.M.; Canham, R.M.; Levine, B.D.; Drazner, M.H. Women Have Higher Left Ventricular Ejection Fractions Than Men Independent of Differences in Left Ventricular Volume. Circulation 2006, 113, 1597–1604. [Google Scholar] [CrossRef] [PubMed]
  62. Yeon, S.B.; Salton, C.J.; Gona, P.; Chuang, M.L.; Blease, S.J.; Han, Y.; Tsao, C.W.; Danias, P.G.; Levy, D.; O’Donnell, C.J.; et al. Impact of age, sex, and indexation method on MR left ventricular reference values in the Framingham Heart Study offspring cohort. J. Magn. Reson. Imaging 2015, 41, 1038–1045. [Google Scholar] [CrossRef] [PubMed]
  63. Kerkhof, P.L.M.; Handly, N. Insights from physiology applied to interpretation of supranormal ejection fraction in women. Eur. Heart J. Cardiovasc. Imaging 2020, 21, 375–377. [Google Scholar] [CrossRef] [PubMed]
  64. Assomull, R.G.; Prasad, S.K.; Lyne, J.; Smith, G.; Burman, E.D.; Khan, M.; Sheppard, M.N.; Poole-Wilson, P.A.; Pennell, D.J. Cardiovascular magnetic resonance, fibrosis, and prognosis in dilated cardiomyopathy. J. Am. Coll. Cardiol. 2006, 48, 1977–1985. [Google Scholar] [CrossRef] [PubMed]
  65. Bruder, O.; Wagner, A.; Jensen, C.J.; Schneider, S.; Ong, P.; Kispert, E.-M.; Nassenstein, K.; Schlosser, T.; Sabin, G.V.; Sechtem, U.; et al. Myocardial Scar Visualized by Cardiovascular Magnetic Resonance Imaging Predicts Major Adverse Events in Patients With Hypertrophic Cardiomyopathy. J. Am. Coll. Cardiol. 2010, 56, 875–887. [Google Scholar] [CrossRef] [PubMed]
  66. Roes, S.D.; Kelle, S.; Kaandorp, T.A.; Kokocinski, T.; Poldermans, D.; Lamb, H.J.; Boersma, E.; van der Wall, E.E.; Fleck, E.; de Roos, A.; et al. Comparison of myocardial infarct size assessed with contrast-enhanced magnetic resonance imaging and left ventricular function and volumes to predict mortality in patients with healed myocardial infarction. Am. J. Cardiol. 2007, 100, 930–936. [Google Scholar] [CrossRef] [PubMed]
  67. Bing, R.; Dweck, M.R. Myocardial fibrosis: Why image, how to image and clinical implications. Heart 2019, 105, 1832–1840. [Google Scholar] [CrossRef] [PubMed]
  68. Wu, K.C.; Weiss, R.G.; Thiemann, D.R.; Kitagawa, K.; Schmidt, A.; Dalal, D.; Lai, S.; Bluemke, D.A.; Gerstenblith, G.; Marbán, E.; et al. Late gadolinium enhancement by cardiovascular magnetic resonance heralds an adverse prognosis in nonischemic cardiomyopathy. J. Am. Coll. Cardiol. 2008, 51, 2414–2421. [Google Scholar] [CrossRef] [PubMed]
  69. Pepe, A.; Meloni, A.; Rossi, G.; Midiri, M.; Missere, M.; Valeri, G.; Sorrentino, F.; D’Ascola, D.G.; Spasiano, A.; Filosa, A.; et al. Prediction of cardiac complications for thalassemia major in the widespread cardiac magnetic resonance era: A prospective multicentre study by a multi-parametric approach. Eur. Heart J. Cardiovasc. Imaging 2018, 19, 299–309. [Google Scholar] [CrossRef] [PubMed]
  70. Meloni, A.; Montanaro, D.; De Marchi, D.; Resta, M.; Keilberg, P.; Pistoia, L.; Positano, V.; Spasiano, A.; Casini, T.; De Bari, C.C.; et al. Absence of T1 Hyperintensity in the Brain of High-risk Patients After Multiple Administrations of High-dose Gadobutrol for Cardiac Magnetic Resonance. Clin. Neuroradiol. 2020, 31, 347–355. [Google Scholar] [CrossRef] [PubMed]
  71. Wood, J.C.; Ghugre, N. Magnetic resonance imaging assessment of excess iron in thalassemia, sickle cell disease and other iron overload diseases. Hemoglobin 2008, 32, 85–96. [Google Scholar] [CrossRef] [PubMed]
  72. Meloni, A.; Martini, N.; Positano, V.; De Luca, A.; Pistoia, L.; Sbragi, S.; Spasiano, A.; Casini, T.; Bitti, P.P.; Allò, M.; et al. Myocardial iron overload by cardiovascular magnetic resonance native segmental T1 mapping: A sensitive approach that correlates with cardiac complications. J. Cardiovasc. Magn. Reson. 2021, 23, 70. [Google Scholar] [CrossRef] [PubMed]
  73. Vitrano, A.; Musallam, K.M.; Meloni, A.; Addario Pollina, S.; Karimi, M.; El-Beshlawy, A.; Hajipour, M.; Di Marco, V.; Ansari, S.H.; Filosa, A.; et al. Random Forest Clustering Identifies Three Subgroups of β-Thalassemia with Distinct Clinical Severity. Thalass. Rep. 2022, 12, 14–23. [Google Scholar]
  74. Bell, M.L.; Fiero, M.; Horton, N.J.; Hsu, C.-H. Handling missing data in RCTs; a review of the top medical journals. BMC Med. Res. Methodol. 2014, 14, 118. [Google Scholar] [CrossRef] [PubMed]
  75. Jakobsen, J.C.; Gluud, C.; Wetterslev, J.; Winkel, P. When and how should multiple imputation be used for handling missing data in randomised clinical trials—A practical guide with flowcharts. BMC Med. Res. Methodol. 2017, 17, 162. [Google Scholar] [CrossRef] [PubMed]
Figure 1. Cluster analysis. (A) Biplot with the first two components from the principal component analysis. Points represent individual patients displayed based on their individual characteristics. The colors represent the clear differentiation of the three phenogroups from the cluster analysis. (B) Dendrogram of the hierarchical cluster analysis. The ordinate axis represents the distance between merged phenogroups. Dashed lines indicate the partitioning with three phenogroups.
Jcm 12 06706 g001
Figure 2. Characteristic plots of the three mutually exclusive phenogroups, including their most representative clinical variables. The over- or underrepresentation of a variable within a cluster was analyzed by a v-test within the hierarchical clustering of principal component function based on the hypergeometric distribution. A positive value indicates that the variable is overrepresented in the relevant phenogroup, while a negative value implies an underrepresentation of the corresponding variable. Only significant variables with p < 0.05 are listed.
Jcm 12 06706 g002
Figure 3. Variable importance plot from the supervised random forest model. Variables appear in decreasing order based on the contribution to the differentiation of patients in phenogroups.
Jcm 12 06706 g003
Figure 4. (A) Frequency of cardiovascular events in the three phenogroups. (B) Kaplan–Meier curves for cardiovascular events stratified by phenogroup.
Jcm 12 06706 g004
Table 1. Demographic, clinical, and MRI data at the baseline MRI.
All β-TI Patients (N = 138)
Females, N (%)72 (52.2)
Age (years)38.1 ± 11.4
Regular transfusions, N (%)73 (52.9)
Serum hemoglobin (g/dL)9.1 ± 1.1
Serum ferritin (ng/L)813.8 ± 911.9
MRI LIC (mg/g/dw)7.9 ± 7.7
Global heart T2* (ms)35.9 ± 8.4
LV EDVI (mL/m2)97.1 ± 20.6
LV mass index (g/m2)63.6 ± 12.9
LV EF (%)62.8 ± 5.9
RV EDVI (mL/m2)90.0 ± 22.2
RV mass index (g/m2)22.7 ± 6.2
RV EF (%)65.3 ± 6.4
Replacement myocardial fibrosis, N(%)37 (26.8)
LA area index (cm2/m2)14.2 ± 2.6
RA area index (cm2/m2)13.1 ± 2.5
β-TI = beta thalassemia intermedia, N = number, MRI = magnetic resonance imaging, LIC = liver iron concentration, LV = left ventricular, EDVI = end-diastolic volume index, EF = ejection fraction, RV = right ventricular, LA = left atrial, RA = right atrial.
Table 2. Contribution of continuous and categorical variables to the 7 dimensions. Only variables with a contribution > 5% are reported. Variables are ordered on the basis of the contribution level.
DimensionVariance/
Cumulative Variance (%)
Variables with Contribution > 5%
122.3/22.3Sex, LV EDVI, RV EDVI, LV mass index, RV mass index
216.5/38.8Regular transfusions, replacement myocardial fibrosis
313.2/52.0Replacement myocardial fibrosis, regular transfusions
411.4/63.4Sex, RA area index, LA area index, RV EDVI, hemoglobin, LV EDVI, RV mass index
57.9/71.3Ferritin, RV EF
66.9/78.2Age, LV EF, RV EF, ferritin
74.6/82.8Age, LA area index, RA area index, hemoglobin, RV EF, RV mass index
LV = left ventricular, EDVI = end-diastolic volume index, RV = right ventricular; RA = right atrial, LA = left atrial.
Table 3. Comparison of baseline demographic, clinical, and MRI findings among the three phenogroups.
Phenogroup 1
(N = 56)
Phenogroup 2
(N = 37)
Phenogroup 3
(N = 45)
p-ValuePairwise Comparisons
Females, N (%)55 (98.2)17 (45.9)0 (0.0)<0.00011 vs. 2: p < 0.0001
1 vs. 3: p < 0.0001
2 vs. 3: p < 0.0001
Age (years)36.6 ± 12.339.8 ± 9.938.8 ± 11.50.380
Regular transfusions, N (%)34 (60.7)21 (56.8)18 (40.0)0.100
Serum hemoglobin (g/dL)8.9 ± 0.89.0 ± 0.99.3 ± 1.40.349
Serum ferritin (ng/L)860.1 ± 956.1977.9 ± 1142.9621.1 ± 560.70.351
MRI LIC (mg/g/dw)8.5 ± 8.18.7 ± 8.46.5 ± 6.40.228
Global heart T2* (ms)36.3 ± 8.534.6 ± 10.636.6 ± 6.20.931
LV EDVI (ml/m2)87.6 ± 15.1101.2 ± 20.8105.7 ± 21.8<0.00011 vs. 2: p = 0.003
1 vs. 3: p < 0.0001
LV mass index (g/m2)56.7 ± 10.565.6 ± 12.270.6 ± 11.8<0.00011 vs. 2: p = 0.001
1 vs. 3: p < 0.0001
LV EF (%)64.9 ± 6.761.7 ± 4.961.0 ± 4.80.0051 vs. 2: p = 0.045
1 vs. 3: p = 0.009
RV EDVI (mL/m2)80.3 ± 17.296.3 ± 23.497.0 ± 22.6<0.00011 vs. 2: p = 0.001
1 vs. 3: p < 0.0001
RV mass index (g/m2)20.3 ± 3.824.7 ± 8.123.9 ± 6.0<0.00011 vs. 2: p = 0.009
1 vs. 3: p < 0.0001
RV EF (%)66.3 ± 7.163.9 ± 5.565.1 ± 6.20.201
Replacement myocardial fibrosis, N (%)0 (0.0)37 (100.0)0 (0.0)<0.00011 vs. 2: p < 0.0001
2 vs. 3: p < 0.0001
LA area index (cm2/m2)14.0 ± 2.614.3 ± 3.114.4 ± 2.30.765
RA area index (cm2/m2)12.7 ± 2.512.7 ± 2.513.8 ± 2.40.053
N = number, MRI = magnetic resonance imaging, LIC = liver iron concentration, LV = left ventricular, EDVI = end-diastolic volume index, EF = ejection fraction, RV = right ventricular, LA = left atrial, RA = right atrial.
Disclaimer/Publisher’s Note: The statements, opinions and data contained in all publications are solely those of the individual author(s) and contributor(s) and not of MDPI and/or the editor(s). MDPI and/or the editor(s) disclaim responsibility for any injury to people or property resulting from any ideas, methods, instructions or products referred to in the content.

