
The Role of Chest Compressions on Ventilation during Advanced Cardiopulmonary Resuscitation

 , , , , , , , ,
Abstract
:1. Introduction
2. Materials and Methods
2.1. Data Collection
2.2. Data Inclusion
2.2.1. TVF&R Database
2.2.2. MUV Database
2.3. Data Annotation and Methodology
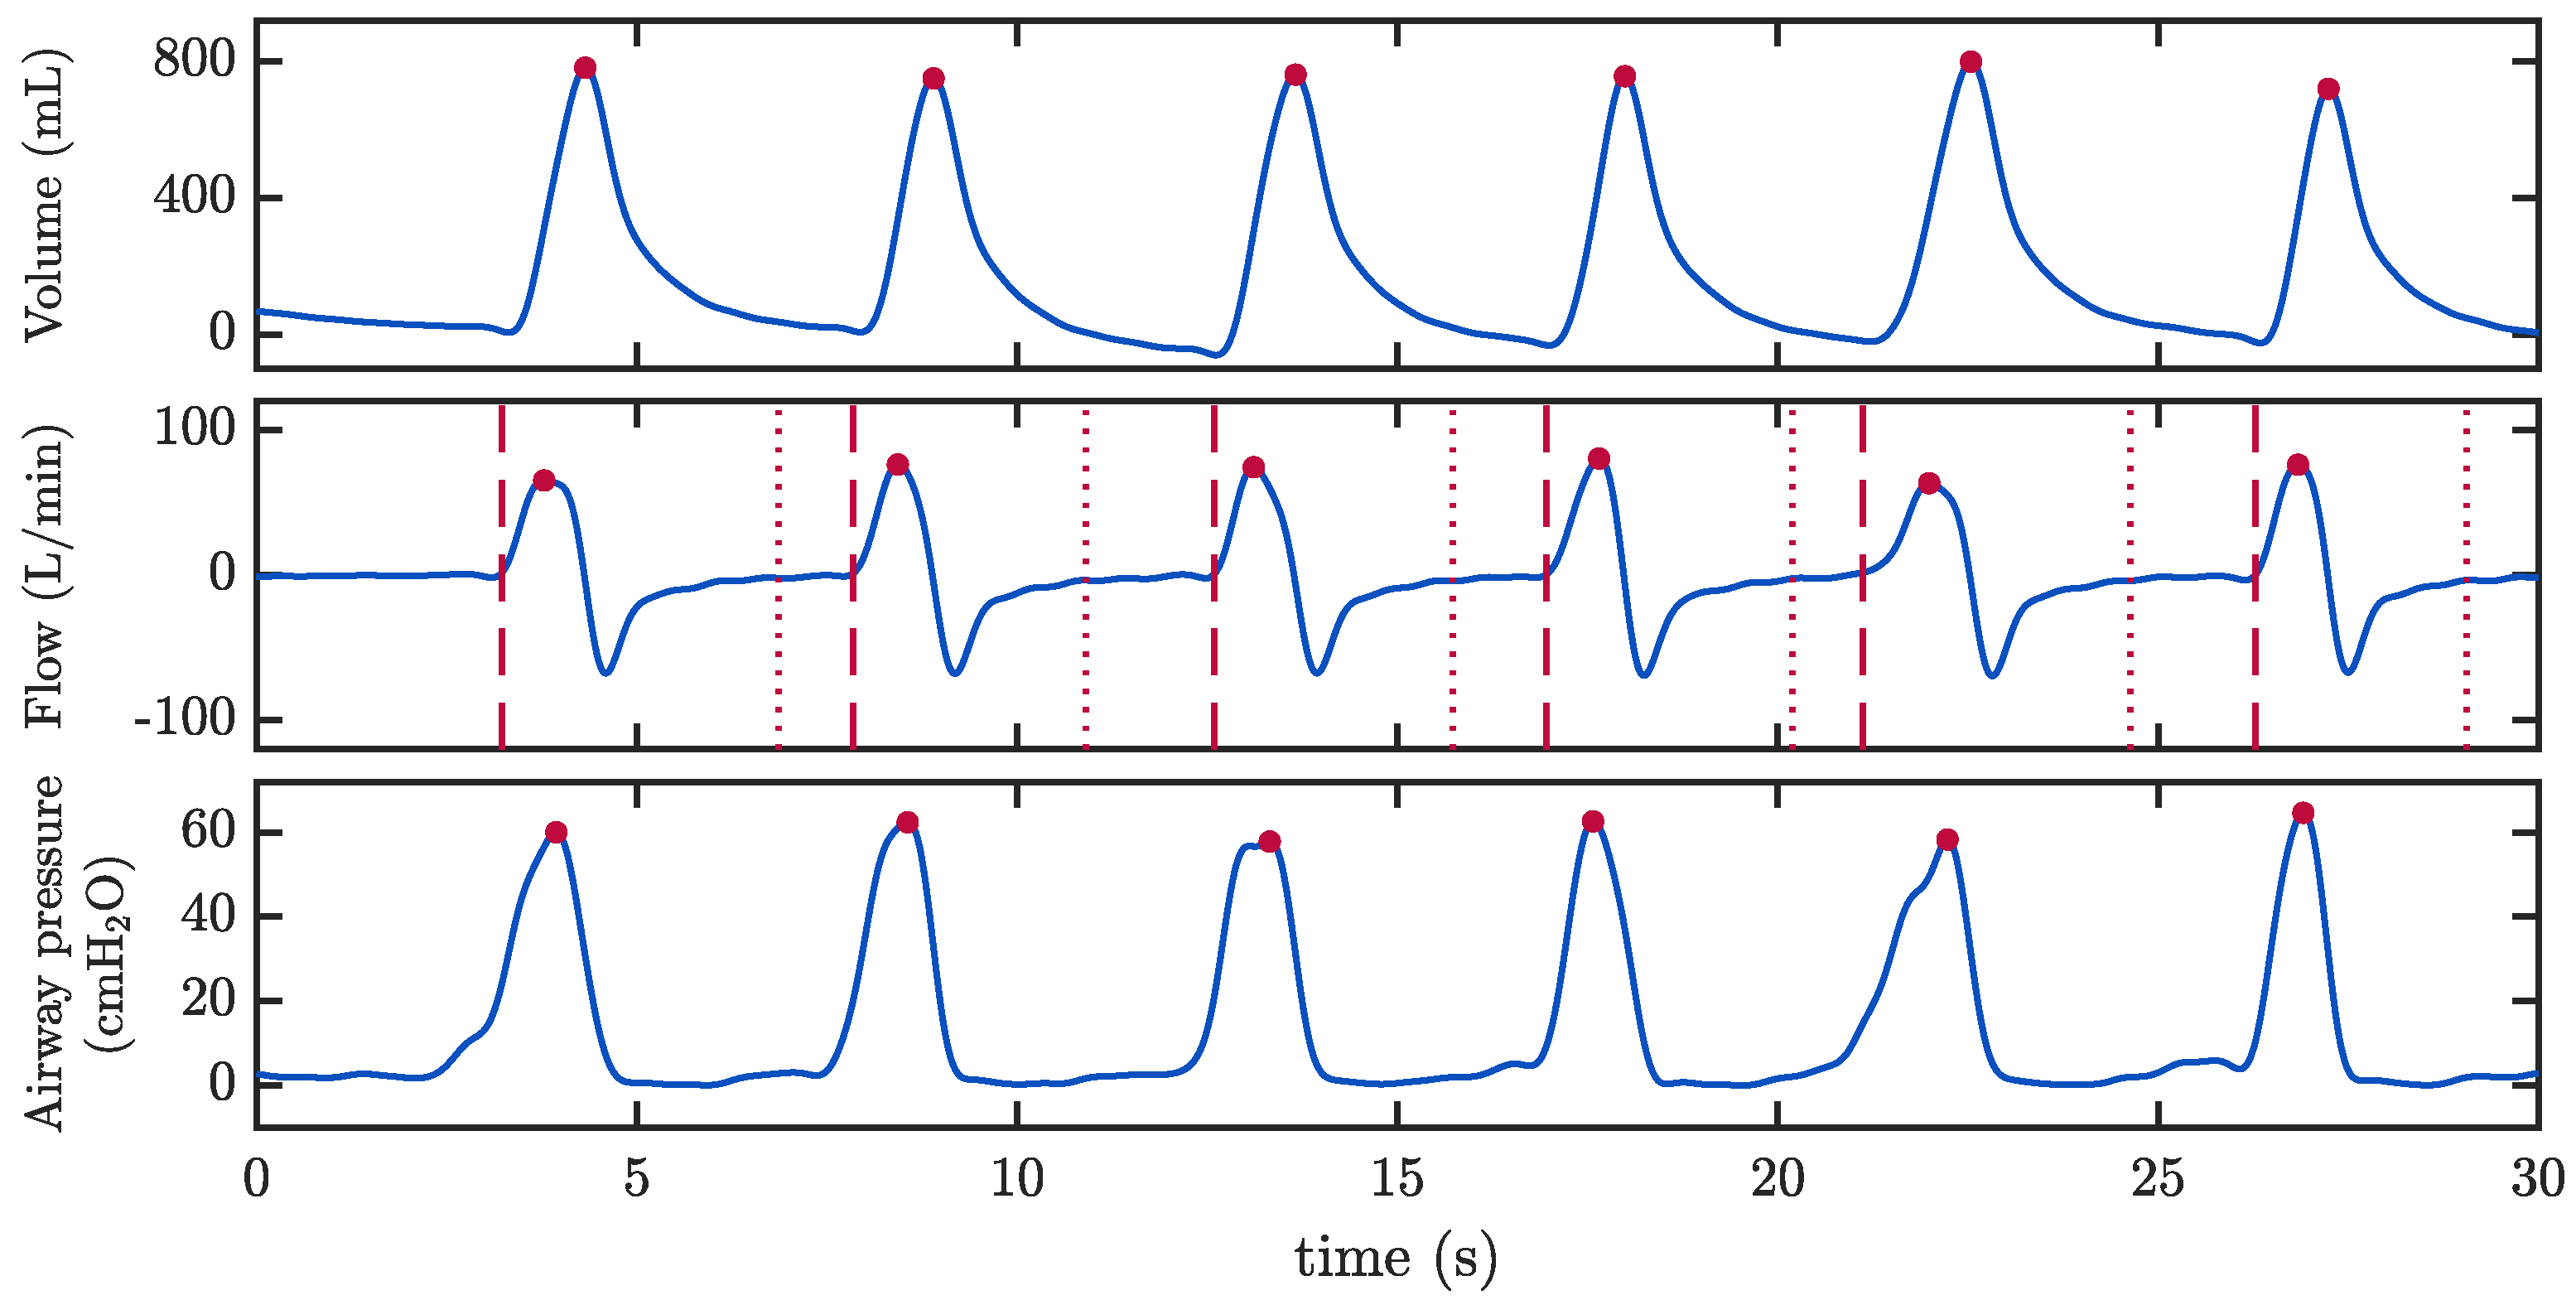
2.3.1. Assessment of Ventilation Quality Parameters
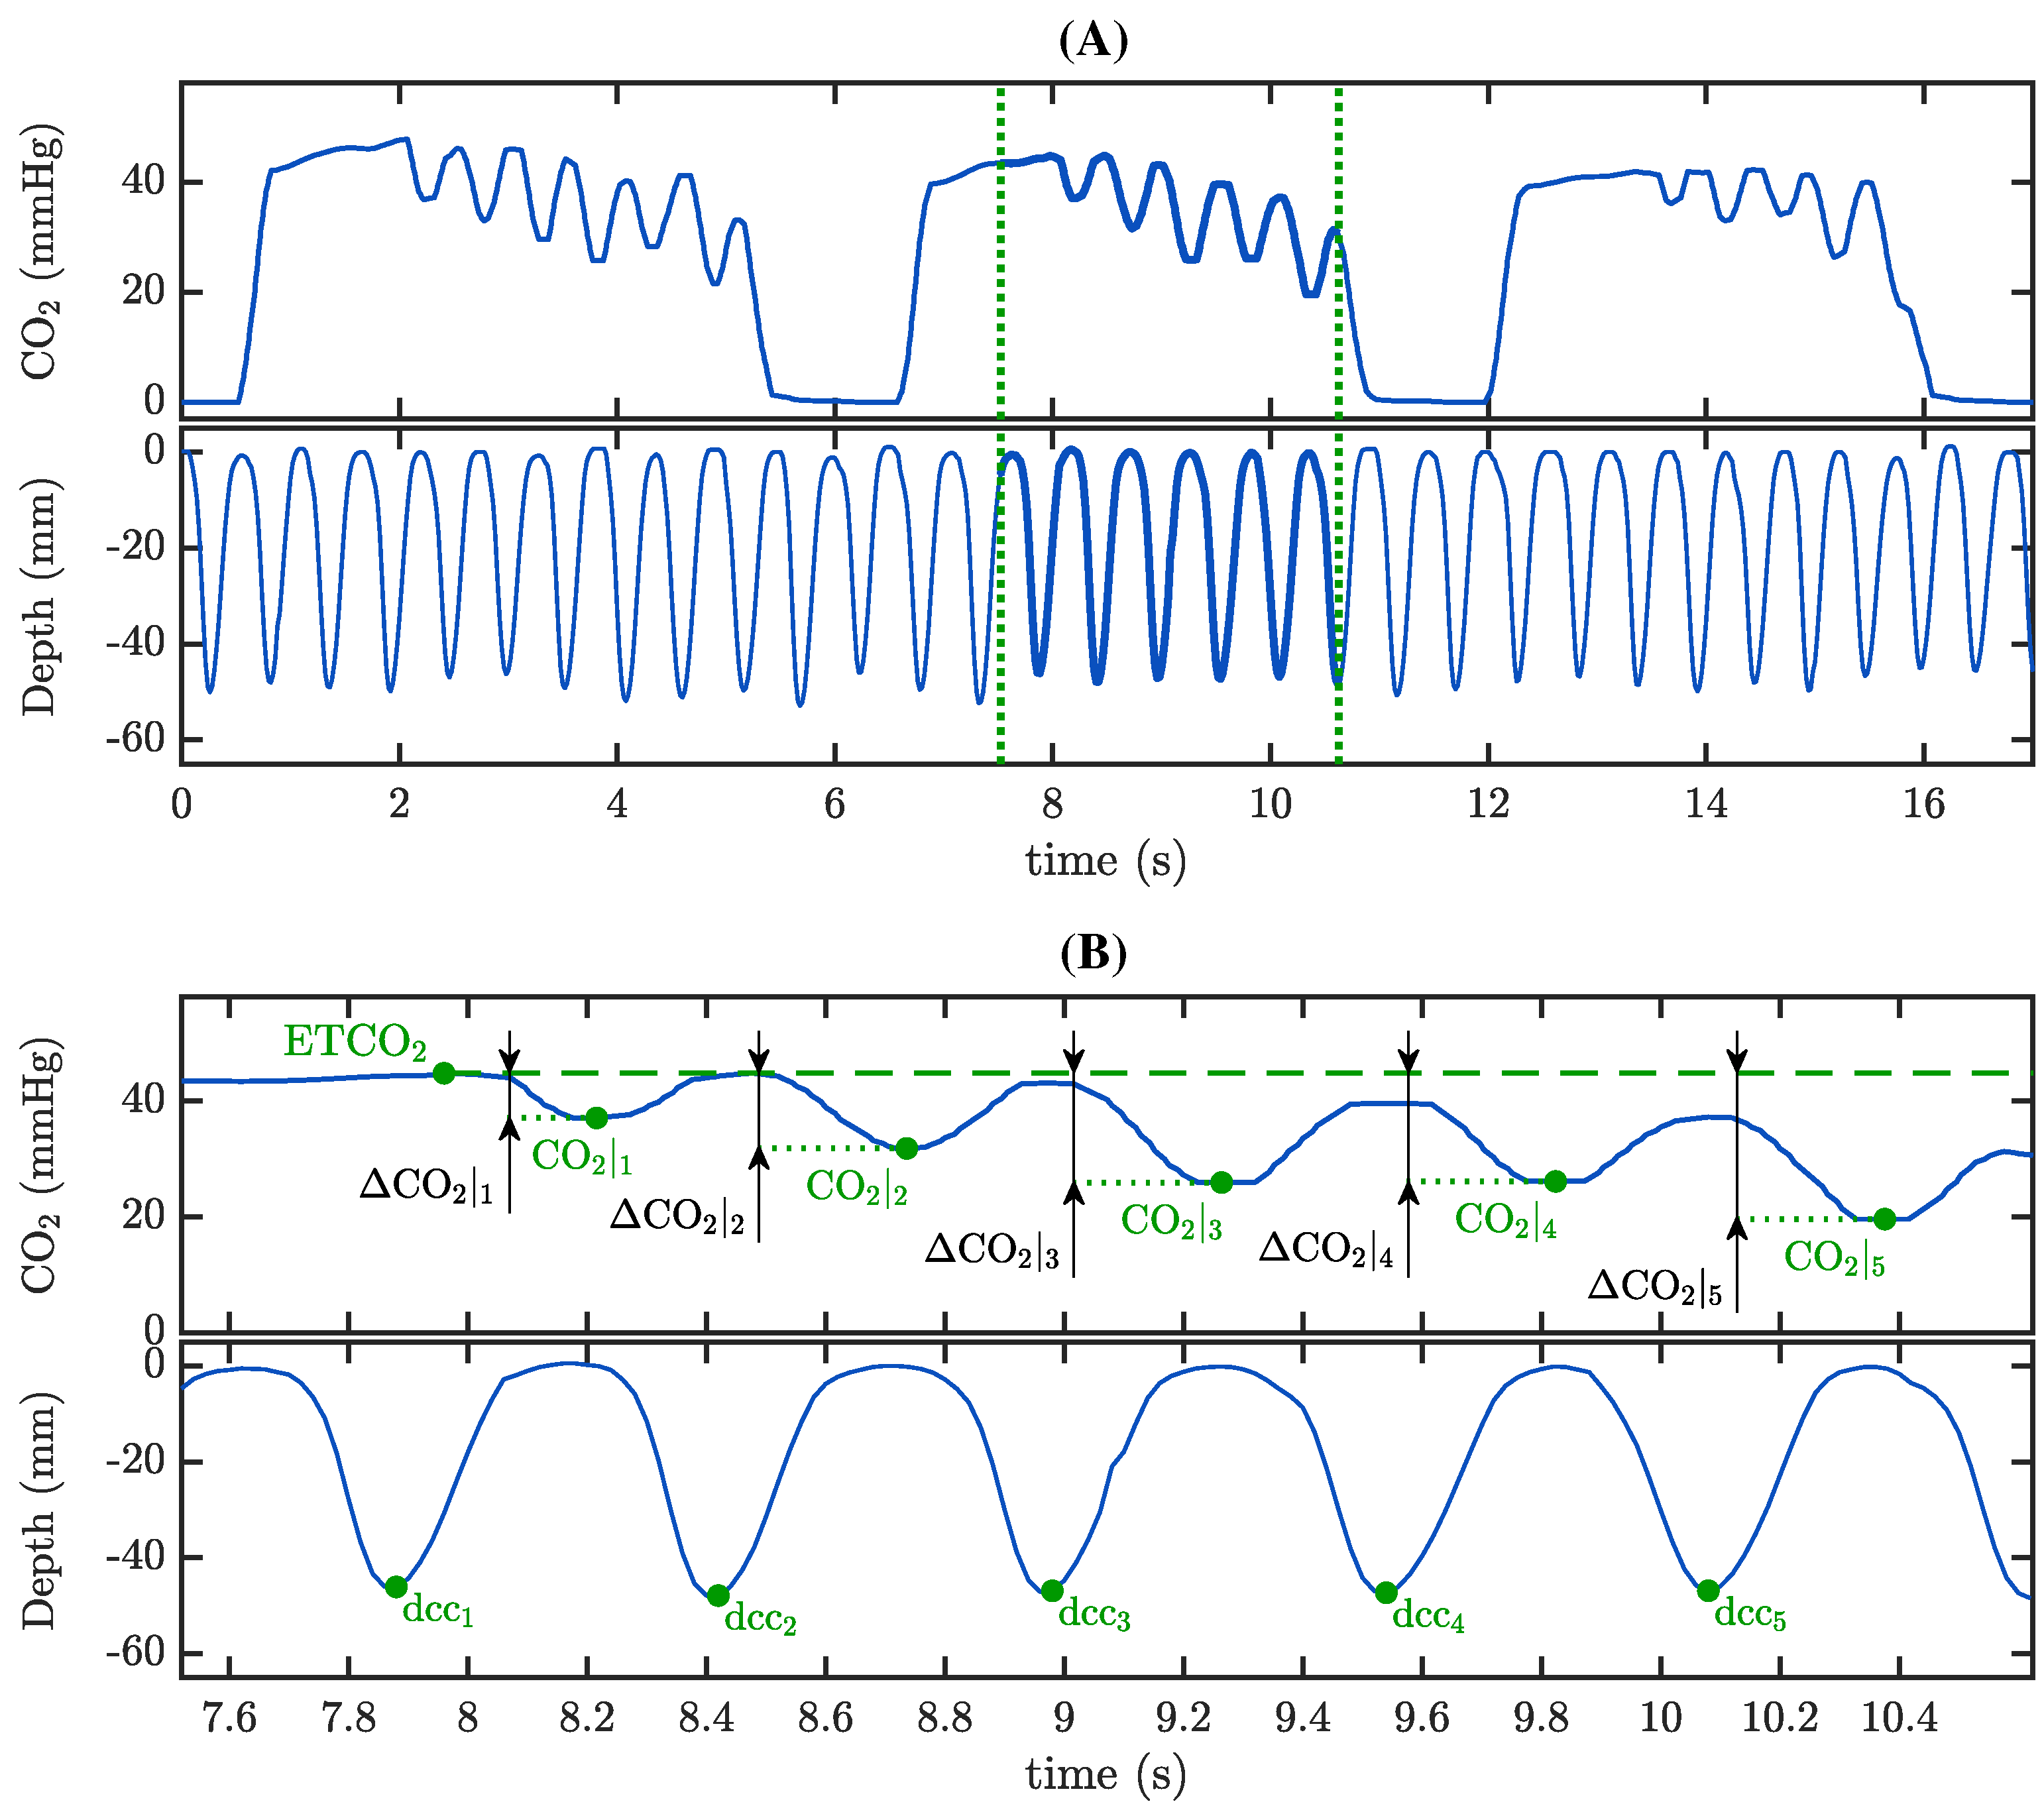
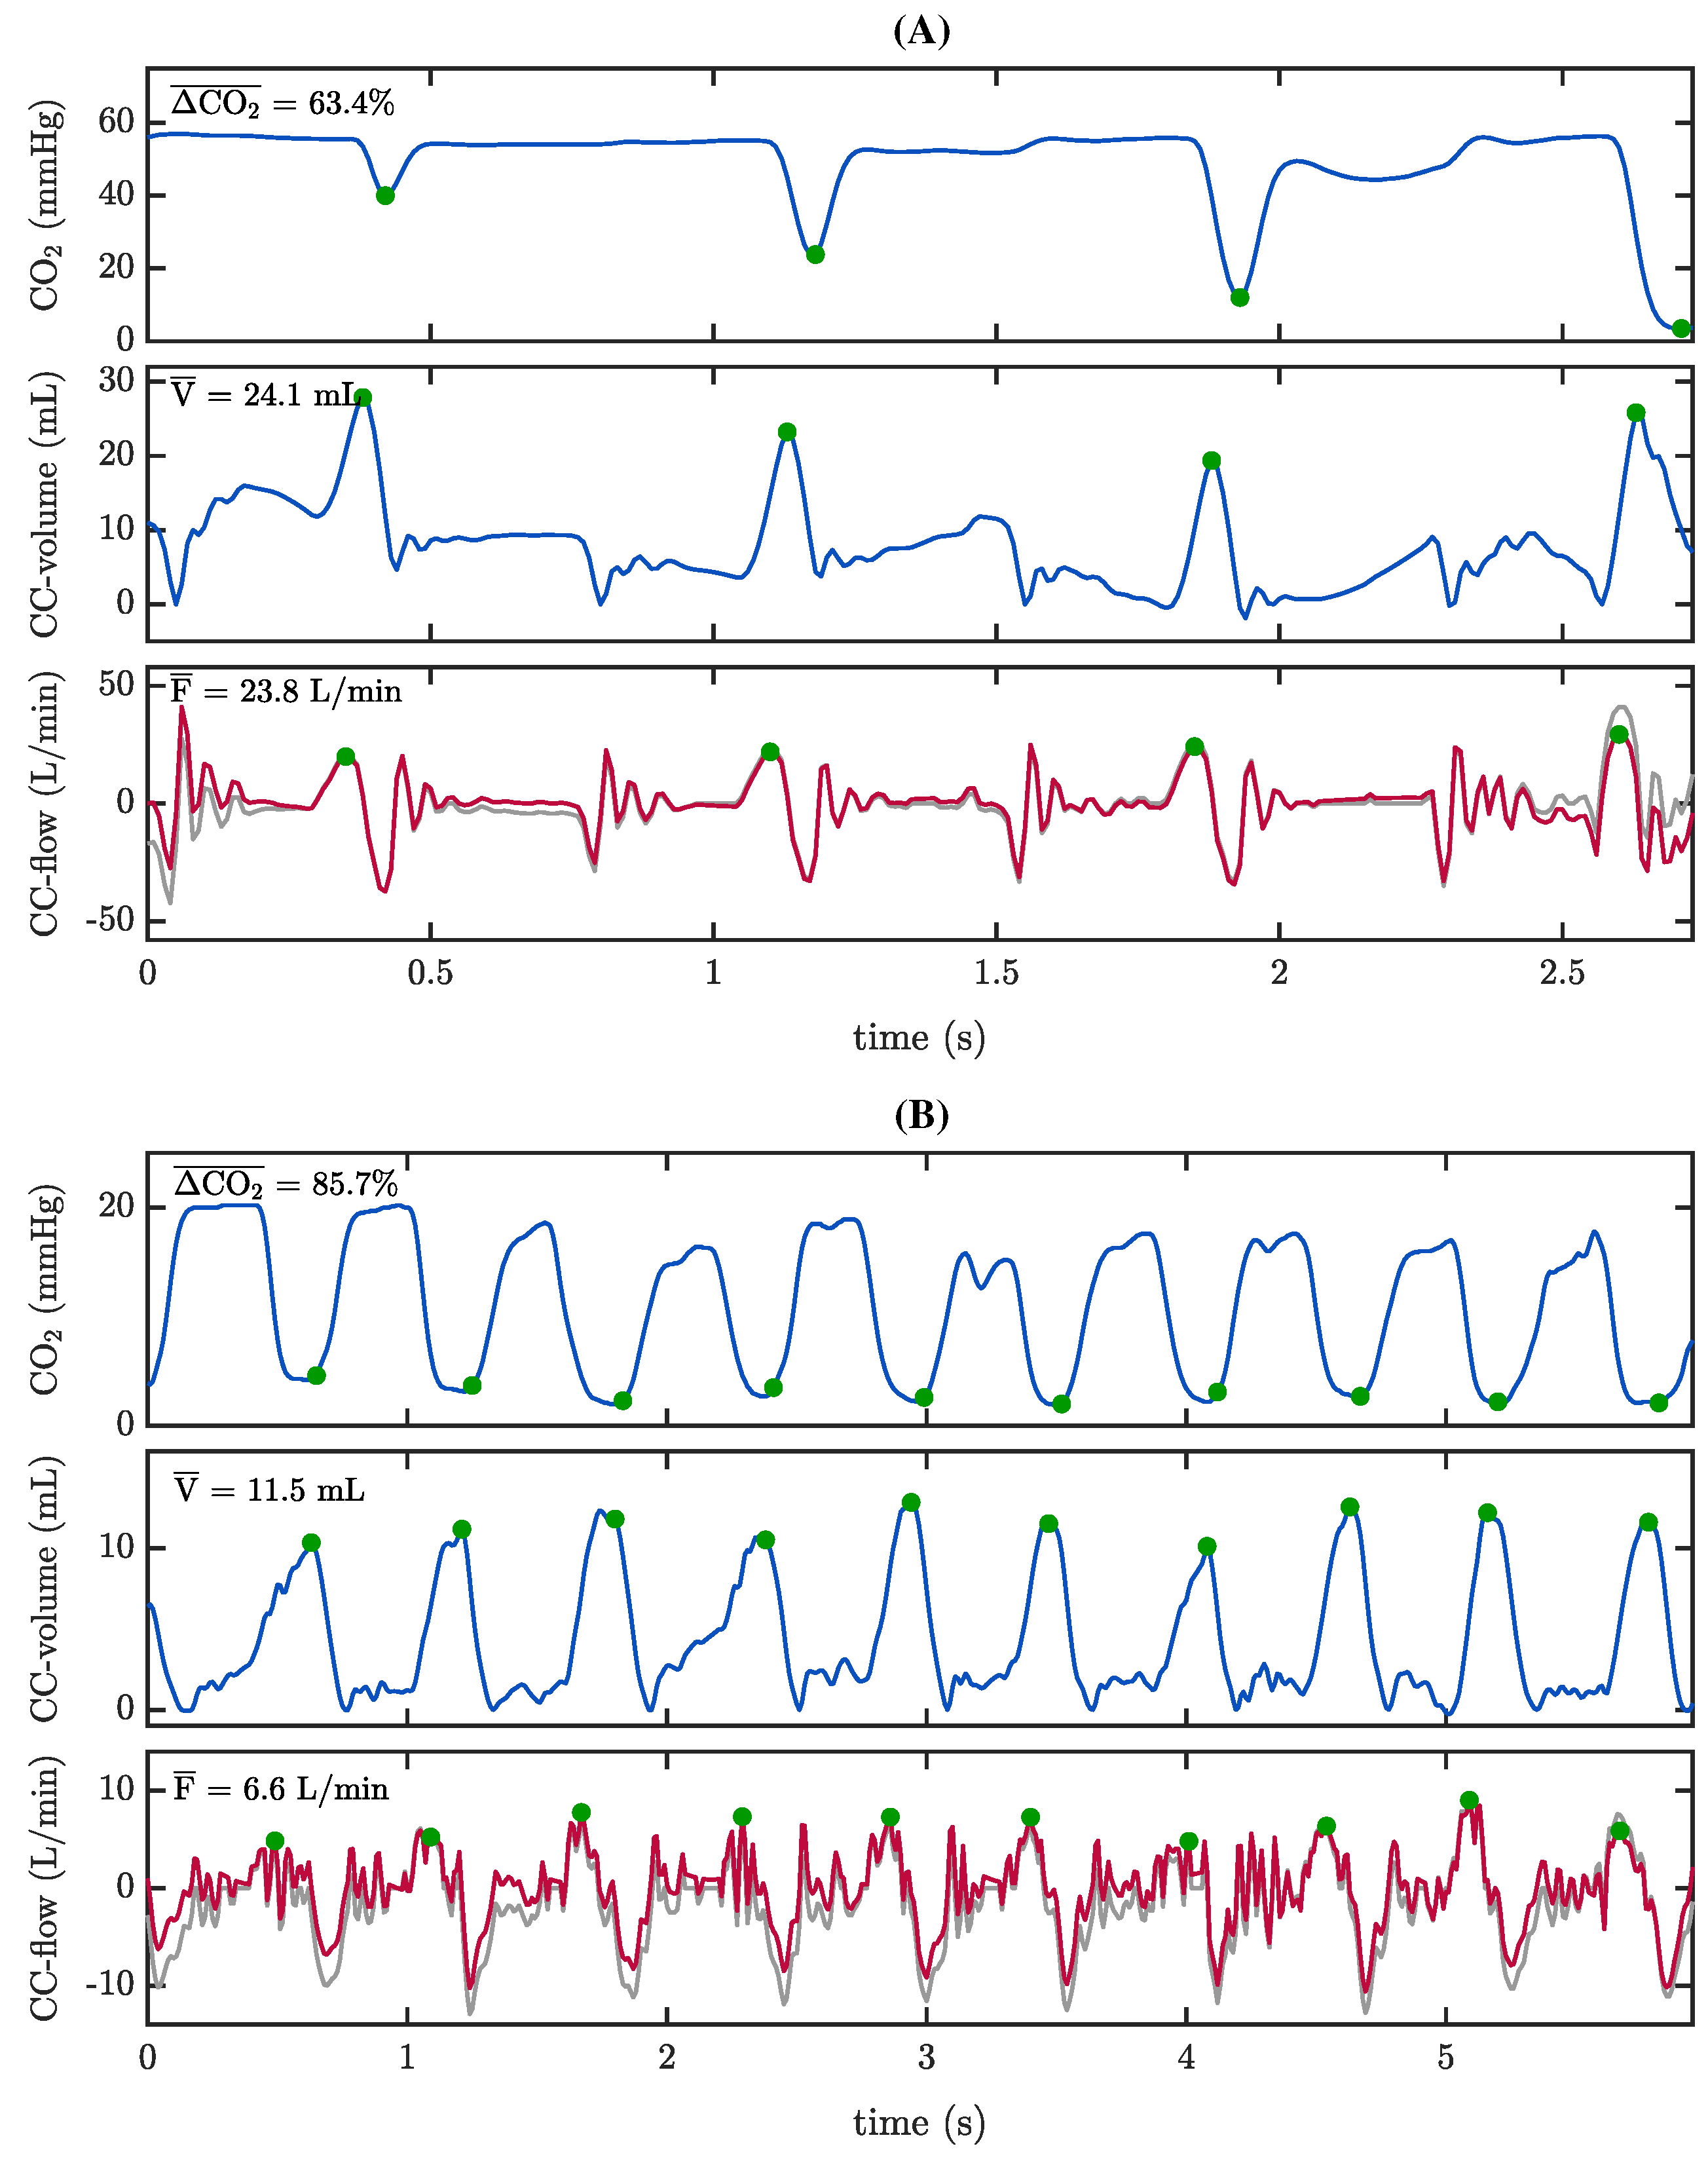
2.3.2. Characterization of the Capnogram Oscillation and Its Relationship with Compression Depth
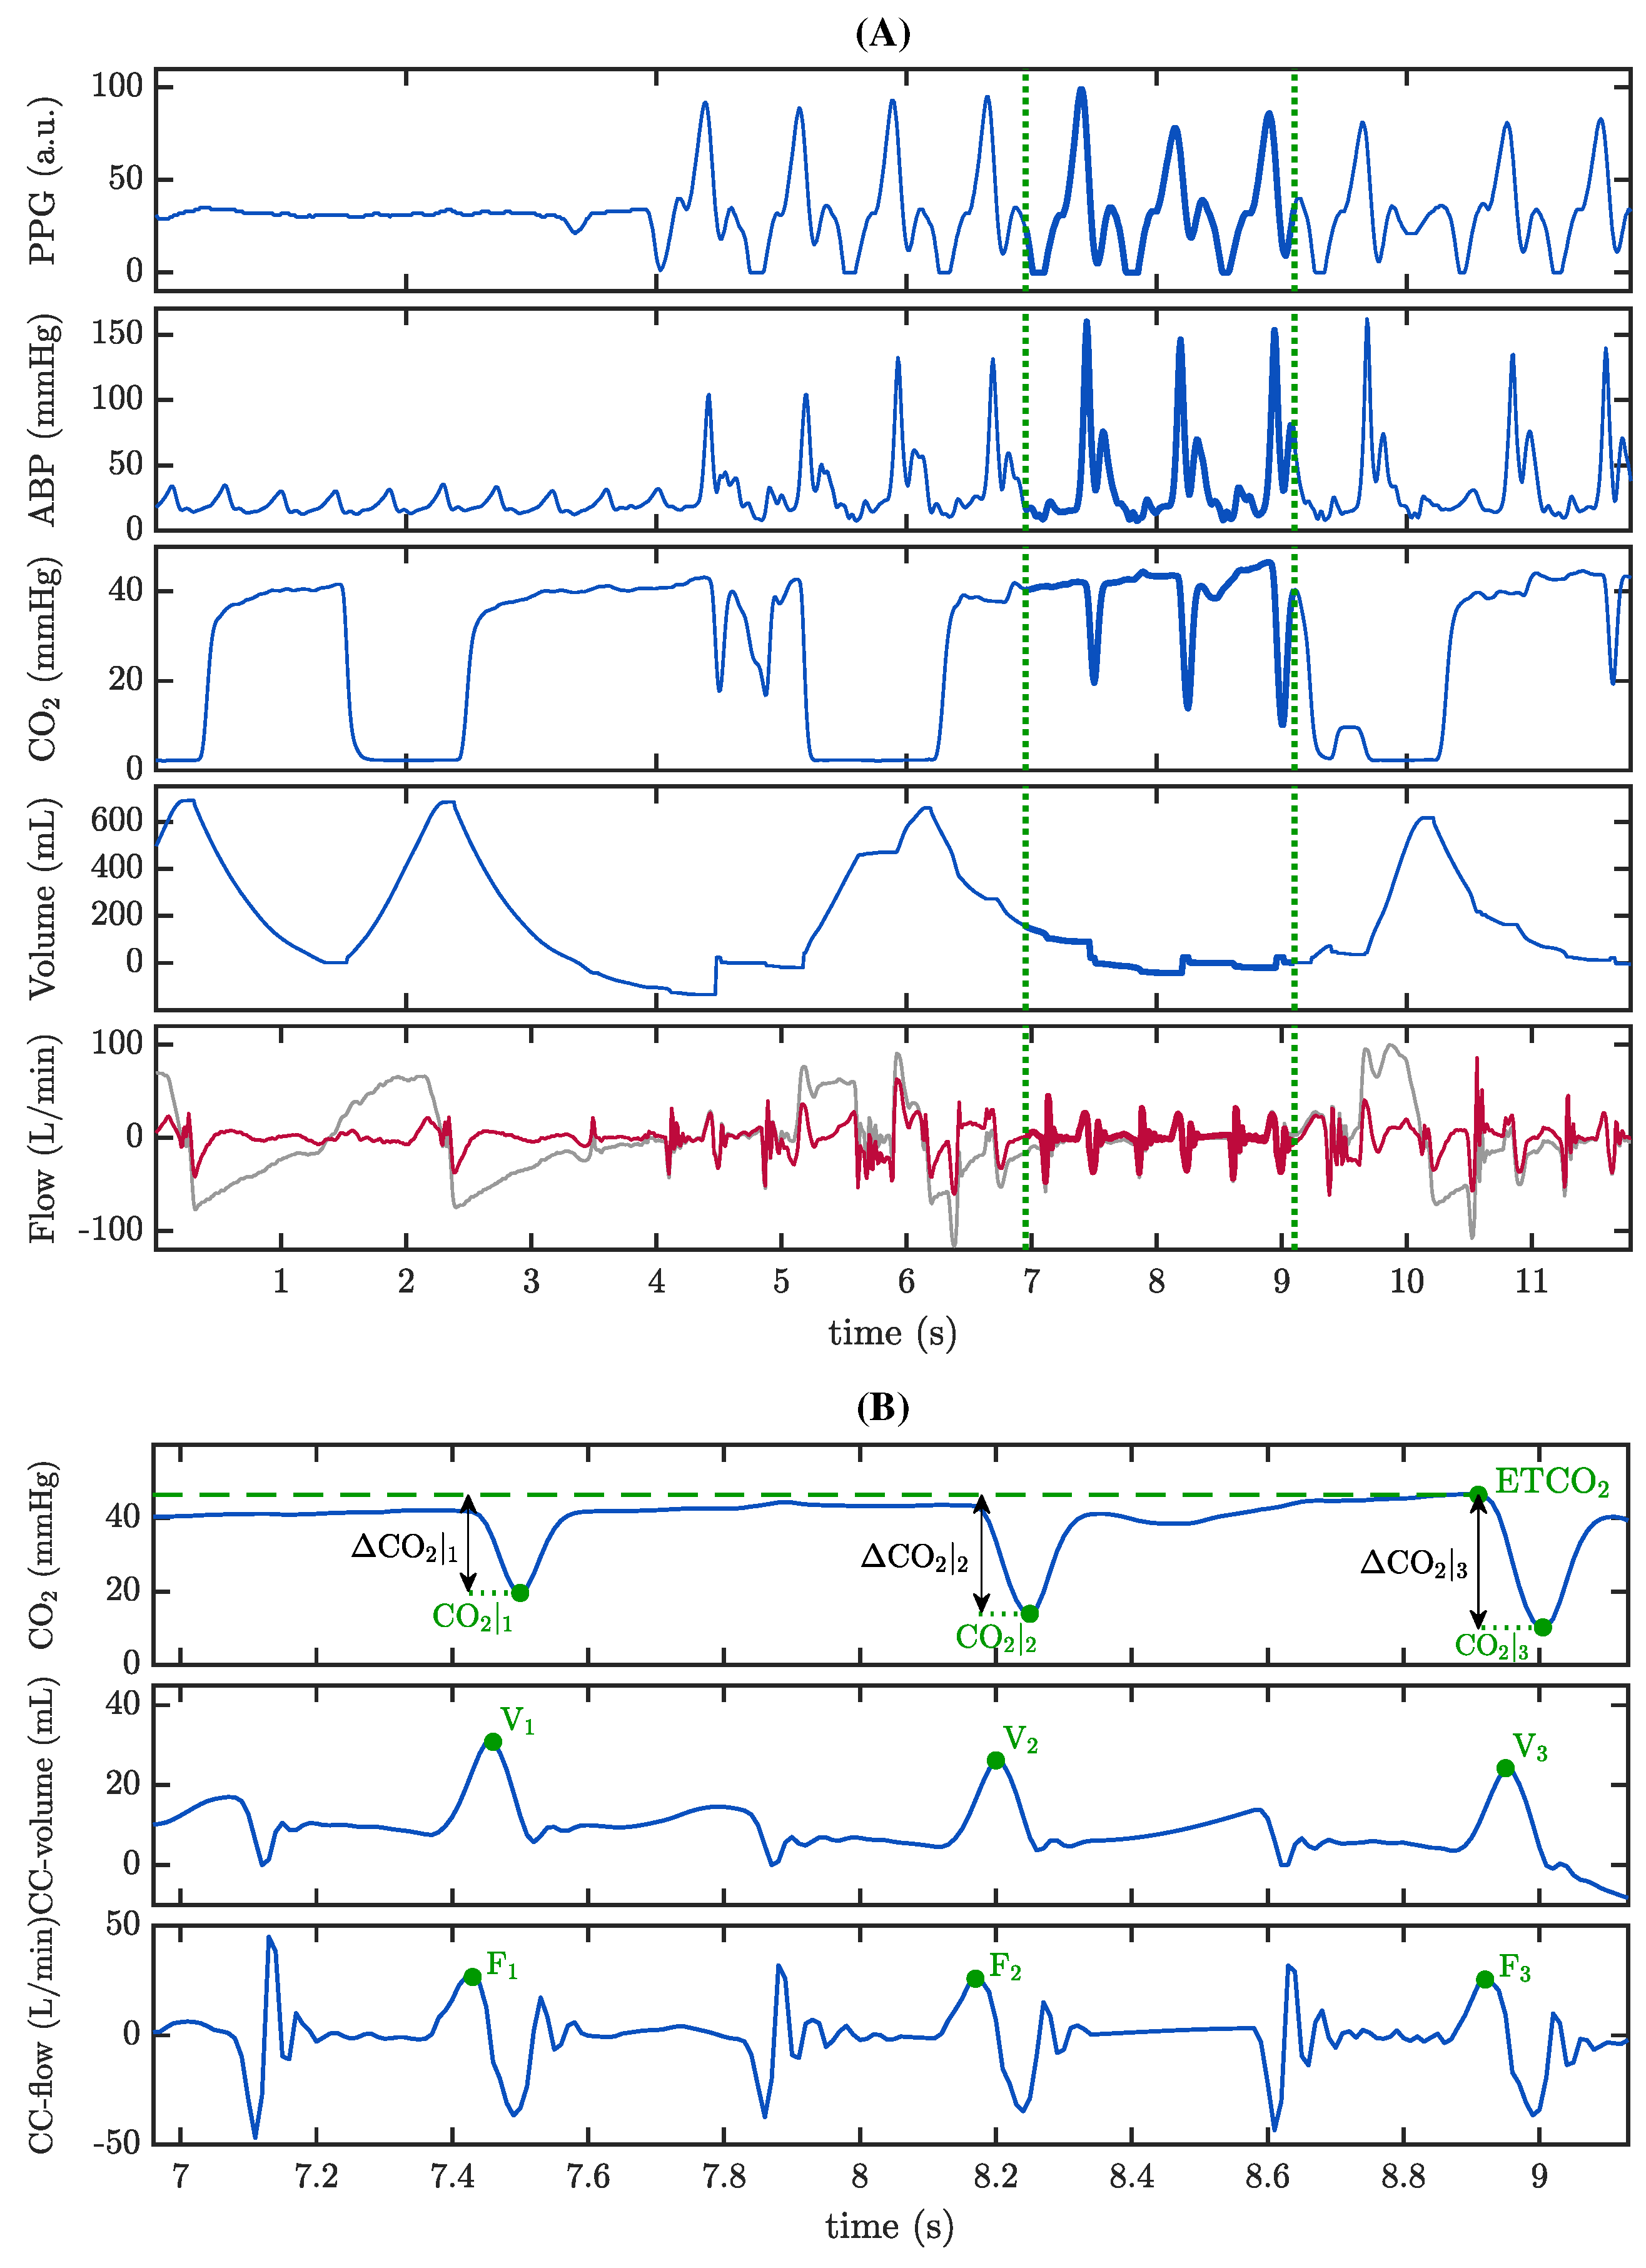
2.3.3. Characterization of the Capnogram Oscillation and Its Relationship with Associated Pseudo-Volume
2.3.4. The Role of Reversed Airflow
2.3.5. Statistical Analysis
3. Results
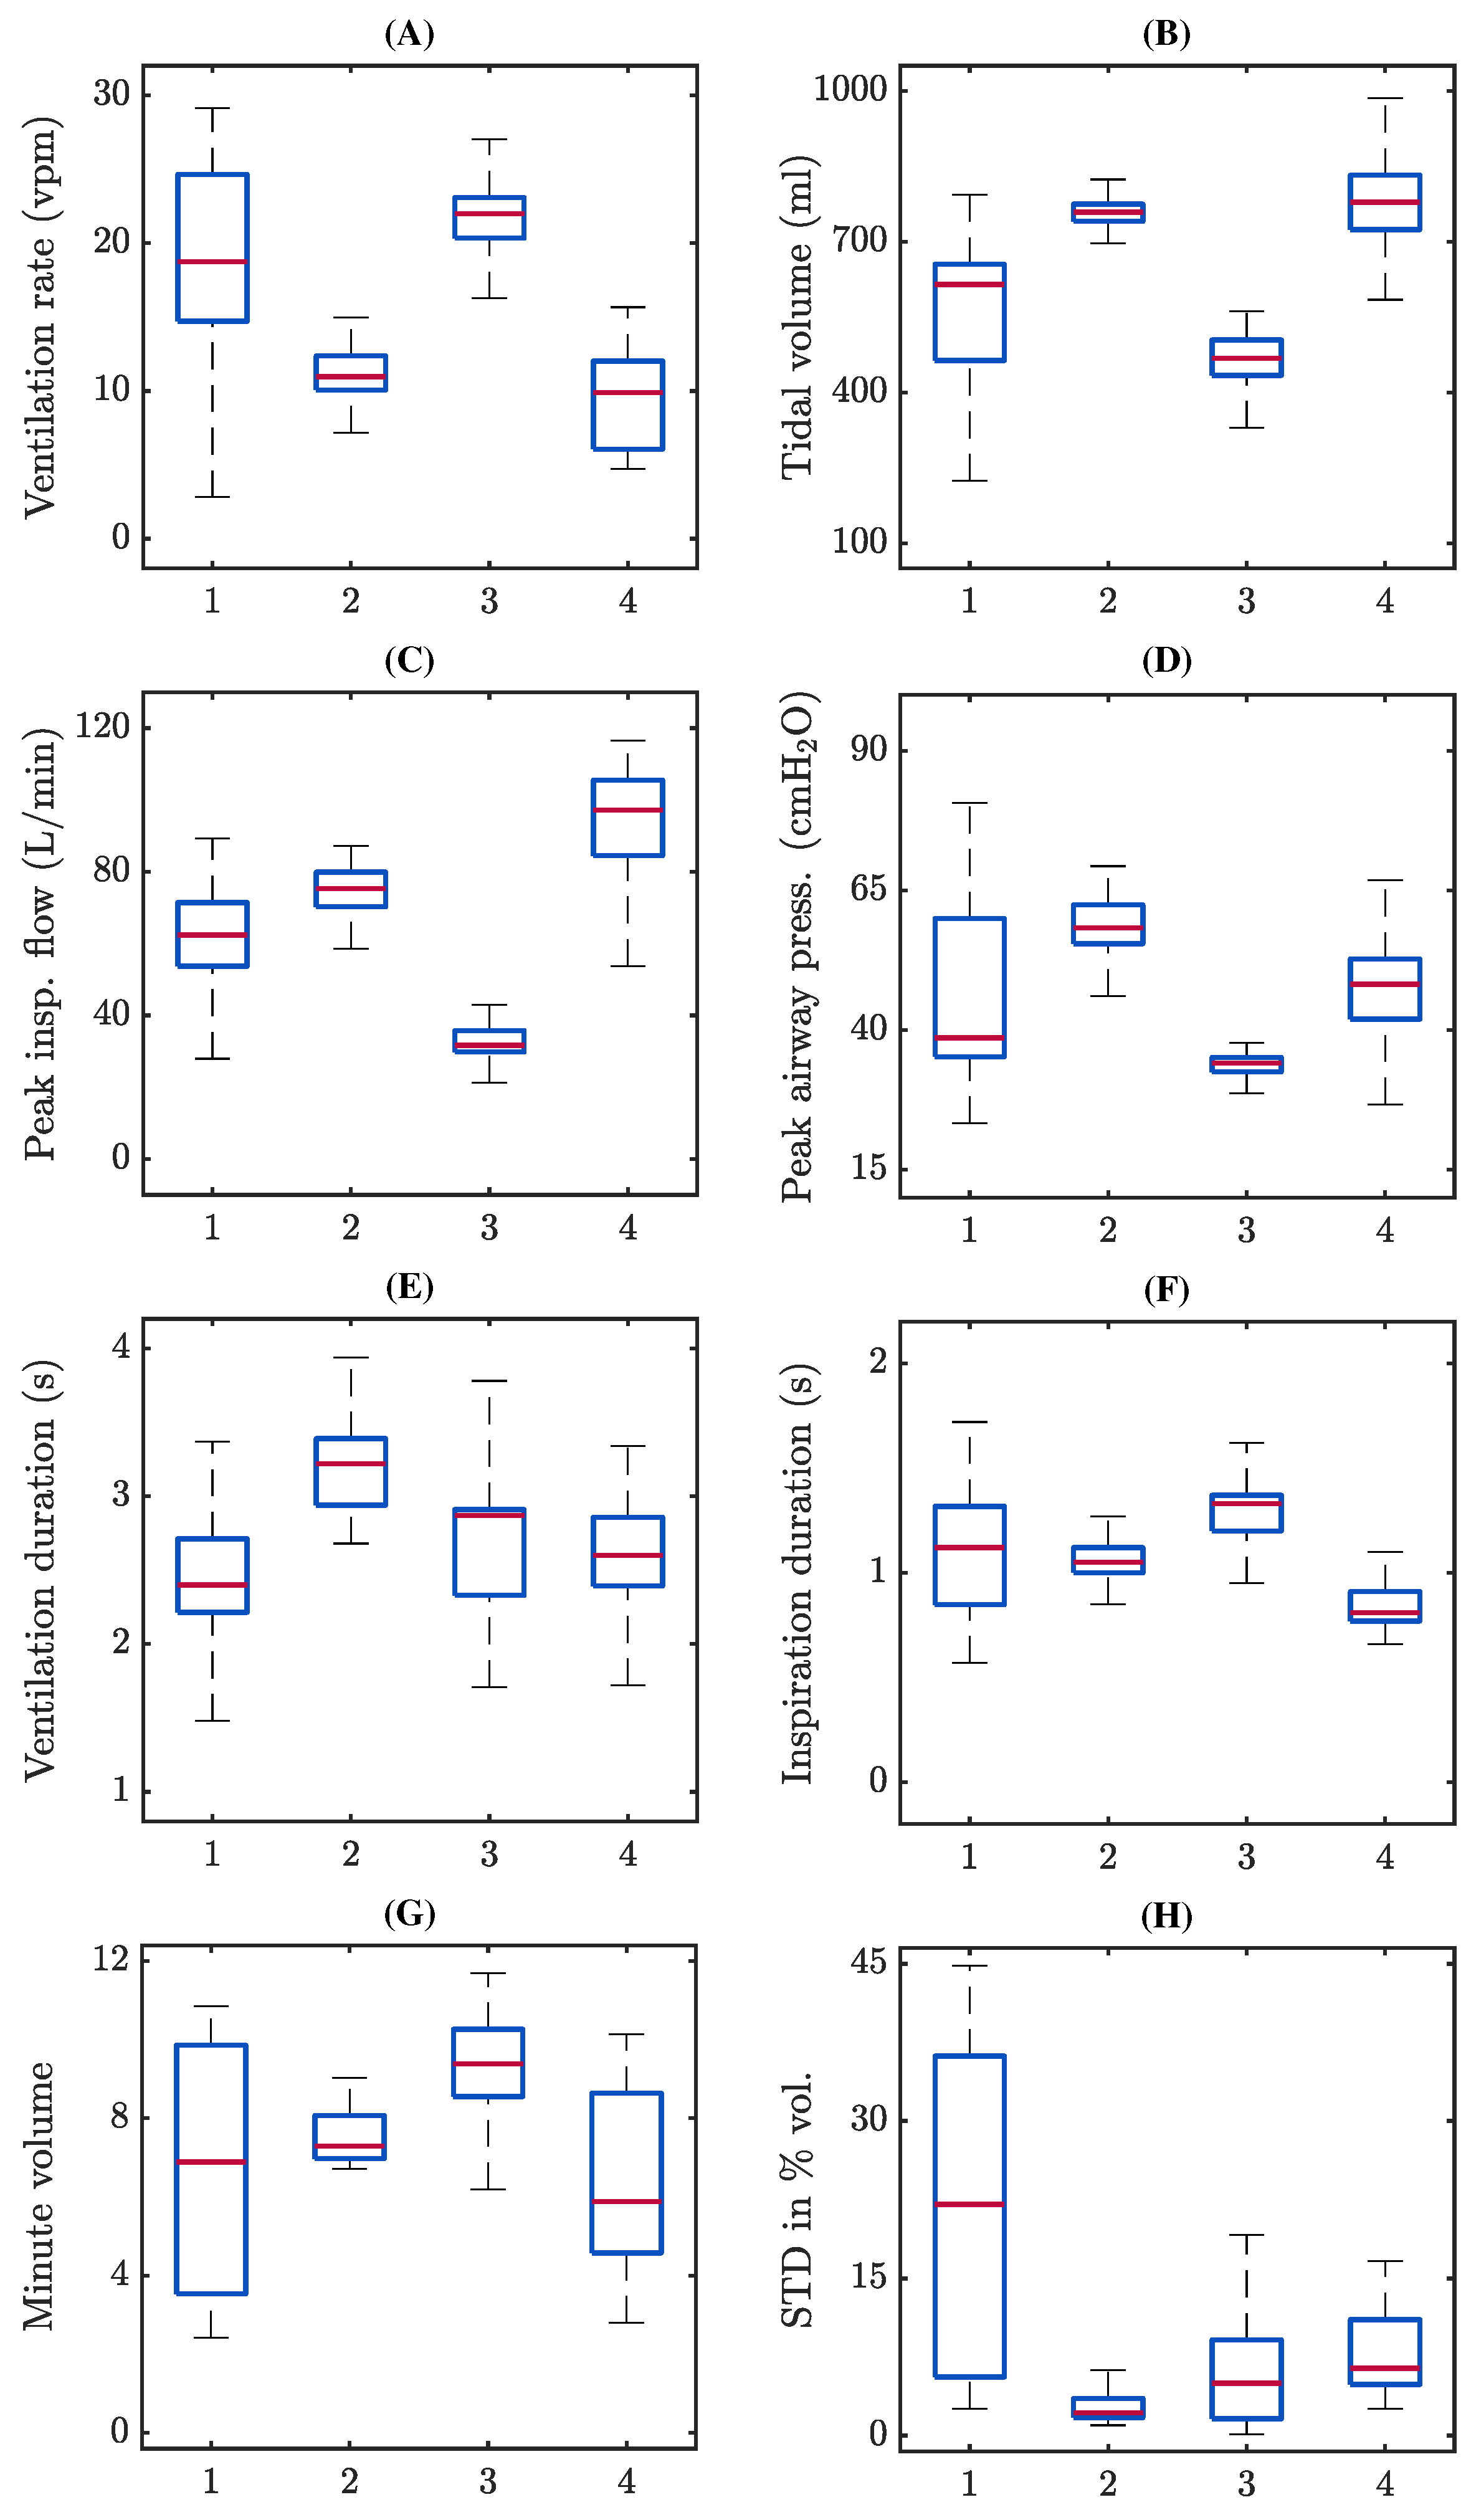
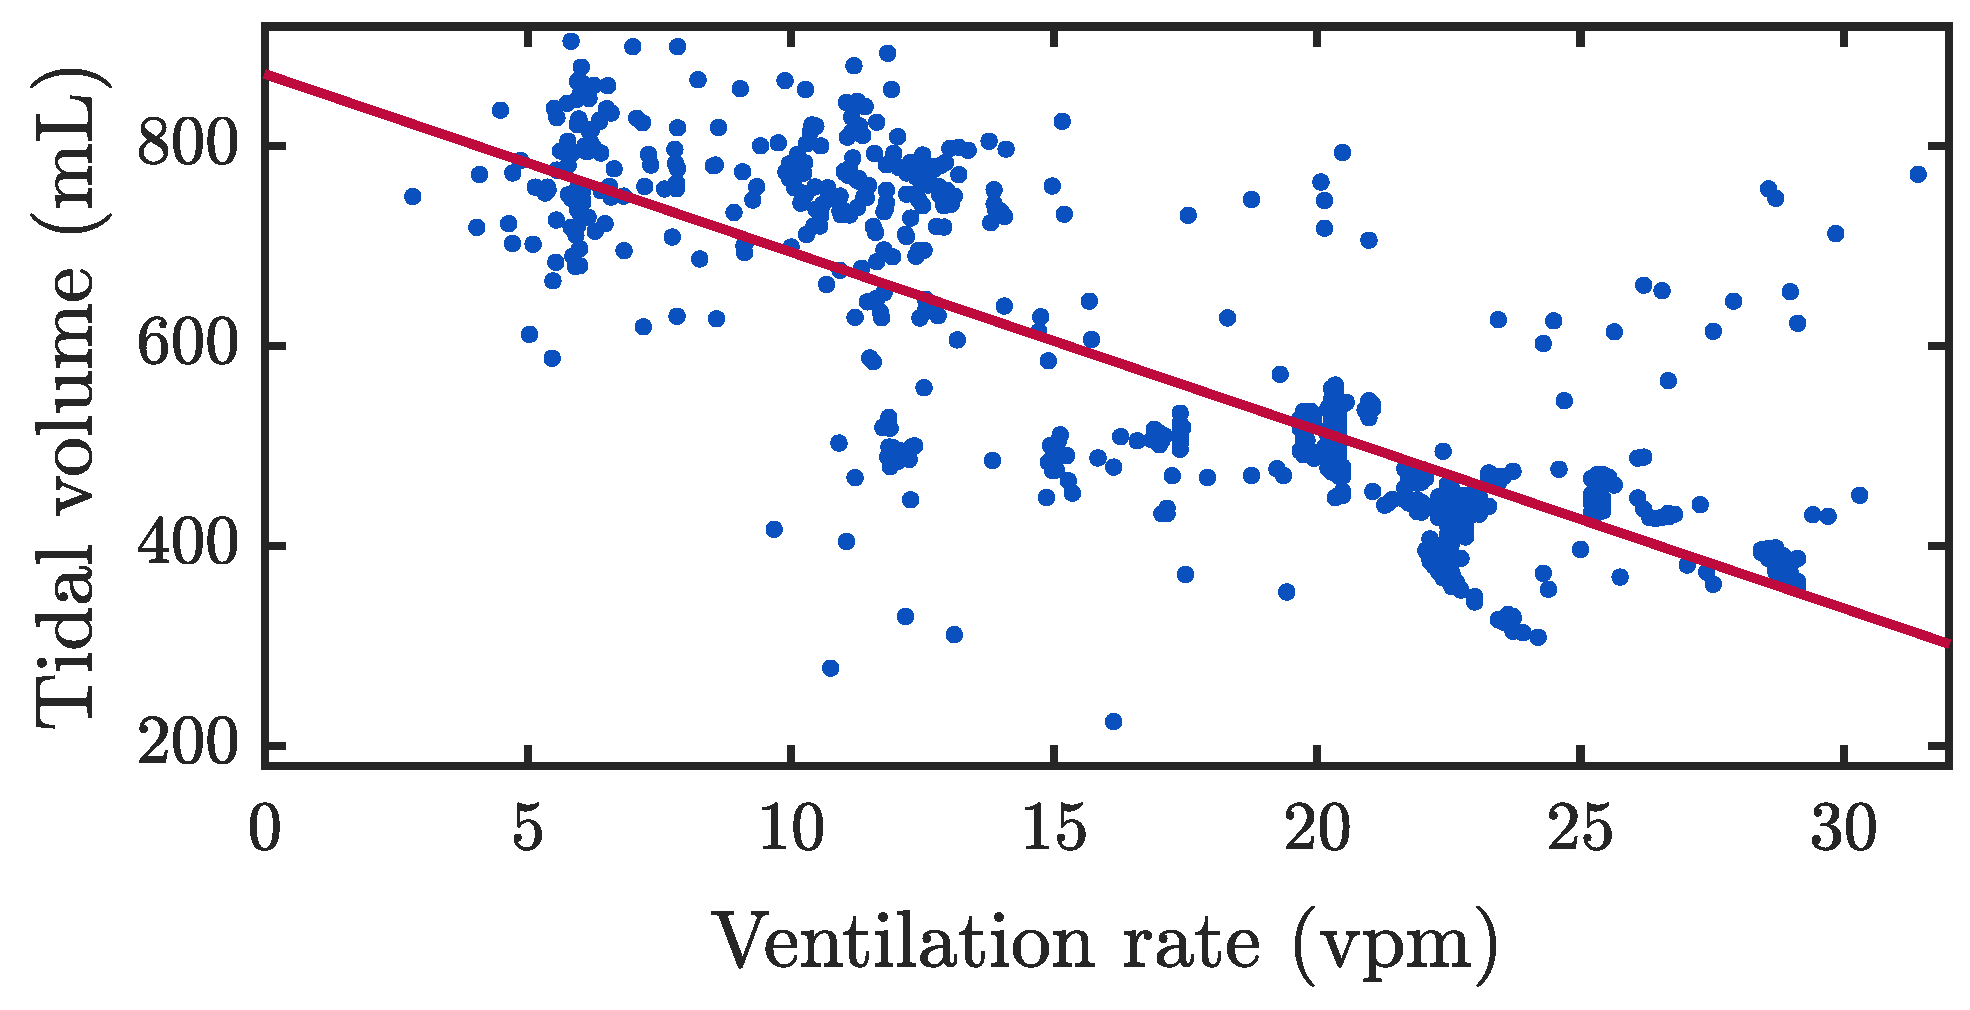
3.1. Assessment of Ventilation Quality Parameters
3.2. Capnogram Oscillation Amplitude and Compression Depth
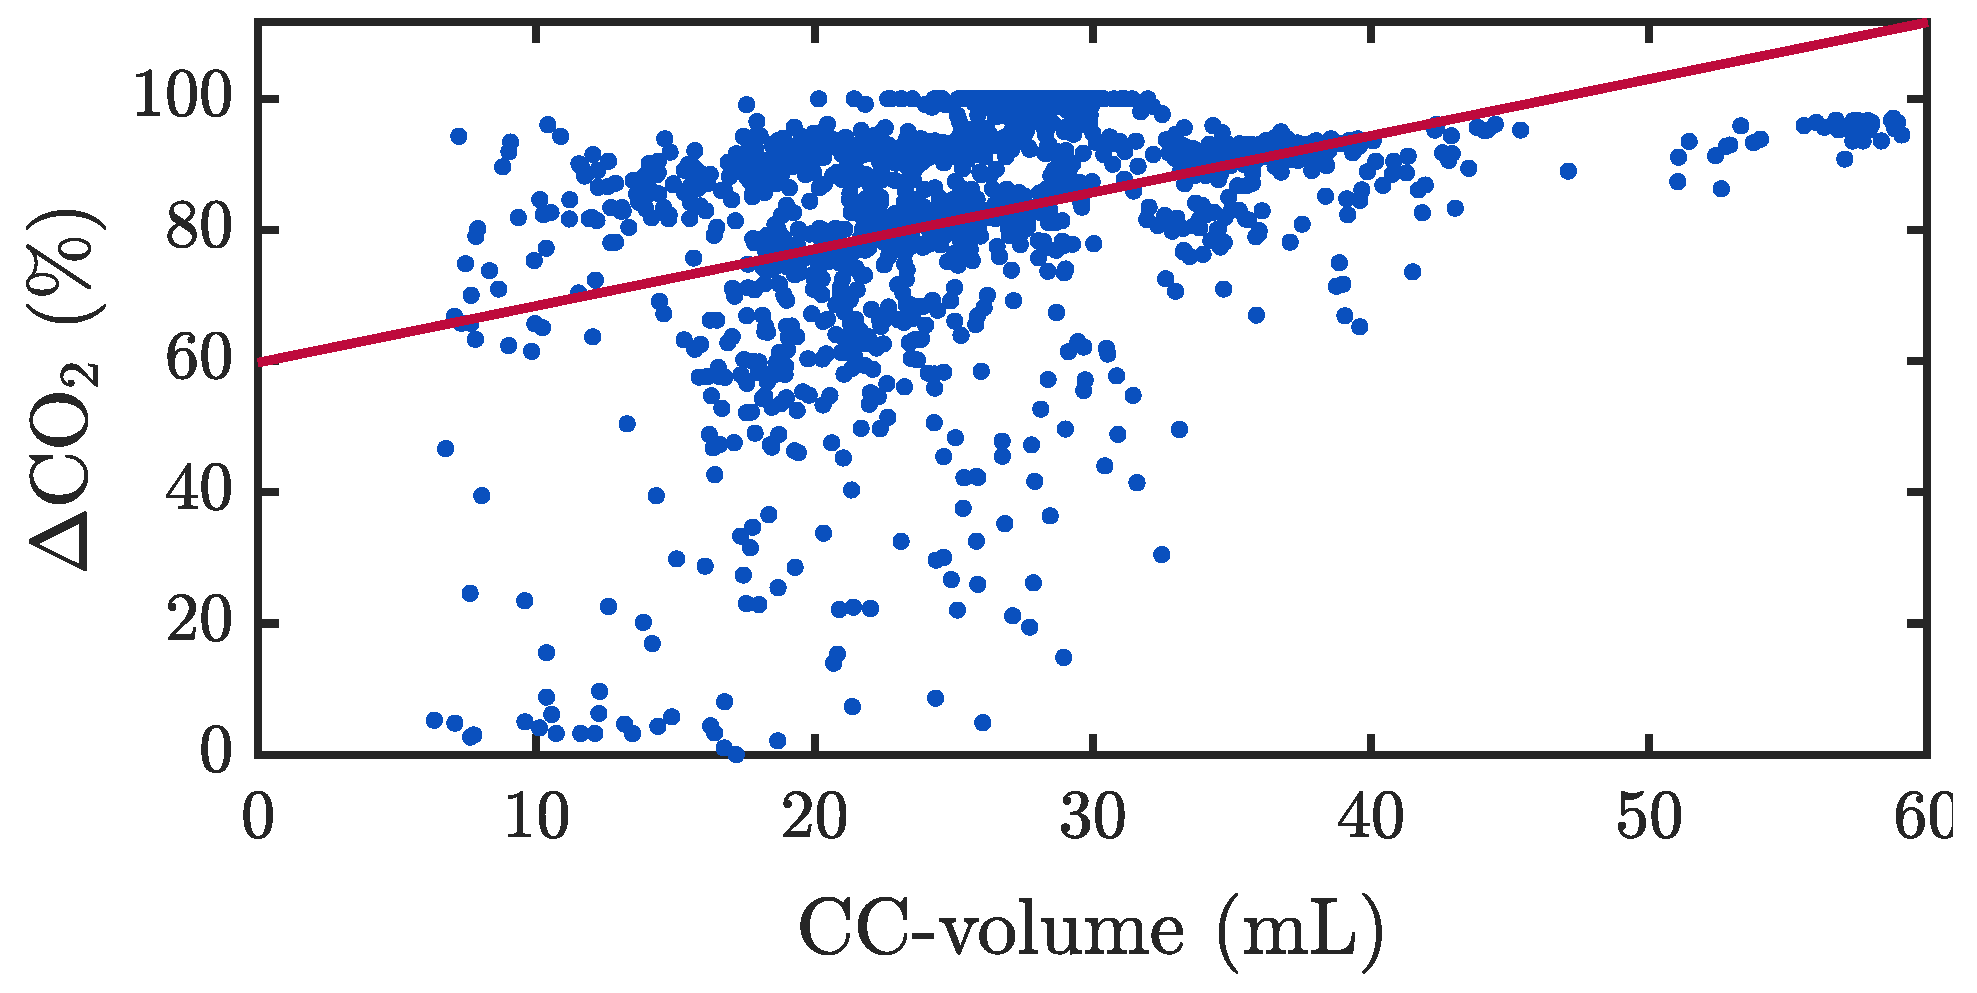
3.3. Capnogram Oscillation Amplitude and Pseudo-Volumes
3.4. The Role of Reversed Airflow
4. Discussion
4.1. Assessment of Ventilation Quality Parameters
4.2. What We Know about Oscillations in the Capnogram Plateau during Chest Compressions
4.3. The Role of Reversed Airflow during Chest Compressions
4.4. Limitations
5. Conclusions
Author Contributions
Funding
Institutional Review Board Statement
Informed Consent Statement
Data Availability Statement
Acknowledgments
Conflicts of Interest
Abbreviations
| CPR | Cardiopulmonary resuscitation |
| CCs | Chest compressions |
| ROSC | Restoration of spontaneous circulation |
| ALS | Advanced life support |
| ETCO2 | End-tidal CO2 |
| OHCA | Out-of-hospital cardiac arrest |
| TVF&R | Tualatin Valley Fire & Rescue |
| EMS | Emergency medical services |
| ROC | Resuscitation outcomes consortium |
| OHSU | Oregon Health & Science University |
| MUV | Medical University of Vienna |
| TI | Transthoracic impedance |
| PPG | Photoplethysmography |
| ABP | Arterial blood pressure |
| AOI | Airway opening index |
| RF | Reversed airflow |
References
- Meaney, P.A.; Bobrow, B.J.; Mancini, M.E.; Christenson, J.; De Caen, A.R.; Bhanji, F.; Abella, B.S.; Kleinman, M.E.; Edelson, D.P.; Berg, R.A.; et al. Cardiopulmonary resuscitation quality: Improving cardiac resuscitation outcomes both inside and outside the hospital: A consensus statement from the American Heart Association. Circulation 2013, 128, 417–435. [Google Scholar] [CrossRef]
- Gul, S.S.; Cohen, S.A.; Avery, K.L.; Balakrishnan, M.P.; Balu, R.; Chowdhury, M.A.B.; Crabb, D.; Huesgen, K.W.; Hwang, C.W.; Maciel, C.B.; et al. Cardiac arrest: An interdisciplinary review of the literature from 2018. Resuscitation 2020, 148, 66–82. [Google Scholar] [CrossRef]
- Neth, M.R.; Idris, A.; McMullan, J.; Benoit, J.L.; Daya, M.R. A review of ventilation in adult out-of-hospital cardiac arrest. J. Am. Coll. Emerg. Physicians Open 2020, 1, 190–201. [Google Scholar] [CrossRef] [PubMed]
- Dorph, E.; Wik, L.; Strømme, T.; Eriksen, M.; Steen, P. Oxygen delivery and return of spontaneous circulation with ventilation: Compression ratio 2: 30 versus chest compressions only CPR in pigs. Resuscitation 2004, 60, 309–318. [Google Scholar] [CrossRef]
- Idris, A.H.; Banner, M.J.; Wenzel, V.; Fuerst, R.S.; Becker, L.B.; Melker, R.J. Ventilation caused by external chest compression is unable to sustain effective gas exchange during CPR: A comparison with mechanical ventilation. Resuscitation 1994, 28, 143–150. [Google Scholar] [CrossRef] [PubMed]
- Idris, A.H.; Wenzel, V.; Becker, L.B.; Banner, M.J.; Orban, D.J. Does hypoxia or hypercarbia independently affect resuscitation from cardiac arrest? Chest 1995, 108, 522–528. [Google Scholar] [CrossRef] [PubMed]
- Aufderheide, T.P.; Lurie, K.G. Death by hyperventilation: A common and life-threatening problem during cardiopulmonary resuscitation. Crit. Care Med. 2004, 32, S345–S351. [Google Scholar] [CrossRef]
- Aufderheide, T.P.; Sigurdsson, G.; Pirrallo, R.G.; Yannopoulos, D.; McKnite, S.; Von Briesen, C.; Sparks, C.W.; Conrad, C.J.; Provo, T.A.; Lurie, K.G. Hyperventilation-induced hypotension during cardiopulmonary resuscitation. Circulation 2004, 109, 1960–1965. [Google Scholar] [CrossRef] [PubMed]
- Pepe, P.E.; Roppolo, L.P.; Fowler, R.L. The detrimental effects of ventilation during low-blood-flow states. Curr. Opin. Crit. Care 2005, 11, 212–218. [Google Scholar] [CrossRef]
- Panchal, A.R.; Berg, K.M.; Hirsch, K.G.; Kudenchuk, P.J.; Del Rios, M.; Cabañas, J.G.; Link, M.S.; Kurz, M.C.; Chan, P.S.; Morley, P.T.; et al. American Heart Association focused update on advanced cardiovascular life support: Use of advanced airways, vasopressors, and extracorporeal cardiopulmonary resuscitation during cardiac arrest: An update to the American Heart Association guidelines for cardiopulmonary resuscitation and emergency cardiovascular care. Circulation 2019, 140, e881–e894. [Google Scholar]
- Soar, J.; Böttiger, B.W.; Carli, P.; Couper, K.; Deakin, C.D.; Djärv, T.; Lott, C.; Olasveengen, T.; Paal, P.; Pellis, T.; et al. European Resuscitation Council guidelines 2021: Adult advanced life support. Resuscitation 2021, 161, 115–151. [Google Scholar] [CrossRef]
- Panchal, A.R.; Bartos, J.A.; Cabañas, J.G.; Donnino, M.W.; Drennan, I.R.; Hirsch, K.G.; Kudenchuk, P.J.; Kurz, M.C.; Lavonas, E.J.; Morley, P.T.; et al. Part 3: Adult basic and advanced life support: 2020 American Heart Association guidelines for cardiopulmonary resuscitation and emergency cardiovascular care. Circulation 2020, 142, S366–S468. [Google Scholar] [CrossRef] [PubMed]
- Olasveengen, T.M.; Semeraro, F.; Ristagno, G.; Castren, M.; Handley, A.; Kuzovlev, A.; Monsieurs, K.G.; Raffay, V.; Smyth, M.; Soar, J.; et al. European resuscitation council guidelines 2021: Basic life support. Resuscitation 2021, 161, 98–114. [Google Scholar] [CrossRef]
- Robba, C.; Badenes, R.; Battaglini, D.; Ball, L.; Brunetti, I.; Jakobsen, J.C.; Lilja, G.; Friberg, H.; Wendel-Garcia, P.D.; Young, P.J.; et al. Ventilatory settings in the initial 72 h and their association with outcome in out-of-hospital cardiac arrest patients: A preplanned secondary analysis of the targeted hypothermia versus targeted normothermia after out-of-hospital cardiac arrest (TTM2) trial. Intensive Care Med. 2022, 48, 1024–1038. [Google Scholar] [PubMed]
- Robba, C.; Badenes, R.; Battaglini, D.; Ball, L.; Sanfilippo, F.; Brunetti, I.; Jakobsen, J.C.; Lilja, G.; Friberg, H.; Wendel-Garcia, P.D.; et al. Oxygen targets and 6-month outcome after out of hospital cardiac arrest: A pre-planned sub-analysis of the targeted hypothermia versus targeted normothermia after Out-of-Hospital Cardiac Arrest (TTM2) trial. Crit. Care 2022, 26, 323. [Google Scholar] [CrossRef]
- LA Via, L.; Astuto, M.; Bignami, E.; Busalacchi, D.; Dezio, V.; Girardis, M.; Lanzafame, B.; Ristagno, G.; Pelosi, P.; Sanfilippo, F. The effects of exposure to severe hyperoxemia on neurological outcome and mortality after cardiac arrest. Minerva Anestesiol. 2022, 88, 853–863. [Google Scholar]
- Idris, A. The importance of measuring ventilation during resuscitation. Resuscitation 2022, 177, 41–42. [Google Scholar] [CrossRef]
- Falk, J.L.; Rackow, E.C.; Weil, M.H. End-tidal carbon dioxide concentration during cardiopulmonary resuscitation. N. Engl. J. Med. 1988, 318, 607–611. [Google Scholar] [CrossRef]
- Ortega, R.; Connor, C.; Kim, S.; Djang, R.; Patel, K. Monitoring ventilation with capnography. N. Engl. J. Med. 2012, 367, e27. [Google Scholar] [CrossRef]
- Sandroni, C.; De Santis, P.; D’Arrigo, S. Capnography during cardiac arrest. Resuscitation 2018, 132, 73–77. [Google Scholar] [CrossRef] [PubMed]
- Yang, B.Y.; Blackwood, J.E.; Shin, J.; Guan, S.; Gao, M.; Jorgenson, D.B.; Boehl, J.E.; Sayre, M.R.; Kudenchuk, P.J.; Rea, T.D.; et al. A pilot evaluation of respiratory mechanics during prehospital manual ventilation. Resuscitation 2022, 177, 55–62. [Google Scholar] [CrossRef]
- Vanwulpen, M.; Wolfskeil, M.; Duchatelet, C.; Hachimi-Idrissi, S. Do manual chest compressions provide substantial ventilation during prehospital cardiopulmonary resuscitation? Am. J. Emerg. Med. 2021, 39, 129–131. [Google Scholar] [CrossRef]
- Khoury, A.; De Luca, A.; Sall, F.; Pazart, L.; Capellier, G. Performance of manual ventilation: How to define its efficiency in bench studies? A review of the literature. Anaesthesia 2015, 70, 985–992. [Google Scholar] [CrossRef] [PubMed]
- Leturiondo, M.; Ruiz de Gauna, S.; Ruiz, J.M.; Gutiérrez, J.J.; Leturiondo, L.A.; González-Otero, D.M.; Russell, J.K.; Zive, D.; Daya, M. Influence of chest compression artefact on capnogram-based ventilation detection during out-of-hospital cardiopulmonary resuscitation. Resuscitation 2018, 124, 63–68. [Google Scholar] [CrossRef]
- Leturiondo, M.; Ruiz de Gauna, S.; Gutiérrez, J.J.; Alonso, D.; Corcuera, C.; Urtusagasti, J.F.; González-Otero, D.M.; Russell, J.K.; Daya, M.R.; Ruiz, J.M. Chest compressions induce errors in end-tidal carbon dioxide measurement. Resuscitation 2020, 153, 195–201. [Google Scholar] [CrossRef] [PubMed]
- Rodarte, J.R.; Hyatt, R.E.; Cortese, D.A. Influence of expiratory flow on closing capacity at low expiratory flow rates. J. Appl. Physiol. 1975, 39, 60–65. [Google Scholar] [CrossRef]
- Deakin, C.D.; O’Neill, J.F.; Tabor, T. Does compression-only cardiopulmonary resuscitation generate adequate passive ventilation during cardiac arrest? Resuscitation 2007, 75, 53–59. [Google Scholar] [CrossRef]
- McDannold, R.; Bobrow, B.J.; Chikani, V.; Silver, A.; Spaite, D.W.; Vadeboncoeur, T. Quantification of ventilation volumes produced by compressions during emergency department cardiopulmonary resuscitation. Am. J. Emerg. Med. 2018, 36, 1640–1644. [Google Scholar] [CrossRef]
- Hubner, P.; Wijshoff, R.W.; Muehlsteff, J.; Wallmüller, C.; Warenits, A.M.; Magnet, I.A.M.; Nammi, K.; Russell, J.K.; Sterz, F. On detection of spontaneous pulse by photoplethysmography in cardiopulmonary resuscitation. Am. J. Emerg. Med. 2020, 38, 526–533. [Google Scholar] [CrossRef] [PubMed]
- Idris, A.H.; Daya, M.; Owens, P.; O’Neill, S.; Helfenbein, E.D.; Babaeizadeh, S.; Zhou, S.H. High incidence of chest compression oscillations associated with capnography during out-of-hospital cardiopulmonary resuscitation. Circulation 2010, 122, A83. [Google Scholar]
- Gravenstein, J.S.; Jaffe, M.B.; Gravenstein, N.; Paulus, D.A. Capnography; Cambridge University Press: Cambridge, UK, 2011. [Google Scholar]
- Duchatelet, C.; Kalmar, A.F.; Monsieurs, K.G.; Hachimi-Idrissi, S. Chest compressions during ventilation in out-of-hospital cardiac arrest cause reversed airflow. Resuscitation 2018, 129, 97–102. [Google Scholar] [CrossRef]
- Van Den Daele, C.; Vanwulpen, M.; Hachimi-Idrissi, S. Chest compressions during ventilation in out-of-hospital cardiopulmonary resuscitation cause fragmentation of the airflow. Am. J. Emerg. Med. 2021, 50, 455–458. [Google Scholar] [CrossRef]
- O’Neill, J.F.; Deakin, C.D. Do we hyperventilate cardiac arrest patients? Resuscitation 2007, 73, 82–85. [Google Scholar] [CrossRef]
- McCarty, K.; Roosa, J.; Kitamura, B.; Page, R.; Roque, P.; Silver, A.; Spaite, D.; Stolz, U.; Vadeboncoeur, T.; Bobrow, B. Ventilation rates and tidal volume during emergency department cardiac resuscitation. Resuscitation 2012, 83, e45. [Google Scholar] [CrossRef]
- Gutiérrez, J.J.; Leturiondo, M.; Ruiz de Gauna, S.; Ruiz, J.M.; Leturiondo, L.A.; González-Otero, D.M.; Zive, D.; Russell, J.K.; Daya, M. Enhancing ventilation detection during cardiopulmonary resuscitation by filtering chest compression artifact from the capnography waveform. PLoS ONE 2018, 13, e0201565. [Google Scholar] [CrossRef] [PubMed]
- González-Otero, D.M.; Ruiz de Gauna, S.; Ruiz, J.; Daya, M.R.; Wik, L.; Russell, J.K.; Kramer-Johansen, J.; Eftestøl, T.; Alonso, E.; Ayala, U. Chest compression rate feedback based on transthoracic impedance. Resuscitation 2015, 93, 82–88. [Google Scholar] [CrossRef] [PubMed]
- Khoury, A.; De Luca, A.; Sall, F.S.; Pazart, L.; Capellier, G. Ventilation feedback device for manual ventilation in simulated respiratory arrest: A crossover manikin study. Scand. J. Trauma Resusc. Emerg. Med. 2019, 27, 1–8. [Google Scholar] [CrossRef]
- You, K.M.; Lee, C.; Kwon, W.Y.; Lee, J.C.; Suh, G.J.; Kim, K.S.; Park, M.J.; Kim, S. Real-time tidal volume feedback guides optimal ventilation during simulated CPR. Am. J. Emerg. Med. 2017, 35, 292–298. [Google Scholar] [CrossRef]
- Whitehurst, M.E.; Blount, A.D.; Austin, P.E.; Carroll, R.G. Ventilatory strategies affect gas exchange in a pig model of closed-chest cardiac compression. Ann. Emerg. Med. 1998, 31, 568–574. [Google Scholar] [CrossRef]
- Grieco, D.L.; Brochard, L.J.; Drouet, A.; Telias, I.; Delisle, S.; Bronchti, G.; Ricard, C.; Rigollot, M.; Badat, B.; Ouellet, P.; et al. Intrathoracic airway closure impacts CO2 signal and delivered ventilation during cardiopulmonary resuscitation. Am. J. Respir. Crit. Care Med. 2019, 199, 728–737. [Google Scholar] [CrossRef]
- Daya, M.; Helfenbein, E.; Idris, A.; Edelson, D.; Firoozabadi, R.; Babaeizadeh, S.; Zhou, S. Hyperventilation Alert During Out-of-Hospital Cardiopulmonary Resuscitation Using an Automated Capnogram Analysis Algorithm. Circulation 2011, 124, A84. [Google Scholar]
- Leturiondo, M.; Ruiz de Gauna, S.; Gutiérrez, J.J.; Ruiz, J.; Corcuera, C.; Ustusagasti, J.F.; Russell, J.K.; Daya, M.R. Chest compression artefact compromises real-time feedback capnometry: Quantification of differences in end-tidal measurements by two capnometers. Resuscitation 2019, 142, e32. [Google Scholar] [CrossRef]
- Charbonney, E.; Grieco, D.L.; Cordioli, R.L.; Badat, B.; Savary, D.; Richard, J.C.M. Ventilation during cardiopulmonary resuscitation: What have we learned from models? Respiratory Care 2019, 64, 1132–1138. [Google Scholar] [CrossRef] [PubMed]
- Ruiz de Gauna, S.; Leturiondo, M.; Gutiérrez, J.J.; Ruiz, J.M.; González-Otero, D.M.; Russell, J.K.; Daya, M. Enhancement of capnogram waveform in the presence of chest compression artefact during cardiopulmonary resuscitation. Resuscitation 2018, 133, 53–58. [Google Scholar] [CrossRef] [PubMed]


Disclaimer/Publisher’s Note: The statements, opinions and data contained in all publications are solely those of the individual author(s) and contributor(s) and not of MDPI and/or the editor(s). MDPI and/or the editor(s) disclaim responsibility for any injury to people or property resulting from any ideas, methods, instructions or products referred to in the content. |
© 2023 by the authors. Licensee MDPI, Basel, Switzerland. This article is an open access article distributed under the terms and conditions of the Creative Commons Attribution (CC BY) license (https://creativecommons.org/licenses/by/4.0/).
Share and Cite
Azcarate, I.; Urigüen, J.A.; Leturiondo, M.; Sandoval, C.L.; Redondo, K.; Gutiérrez, J.J.; Russell, J.K.; Wallmüller, P.; Sterz, F.; Daya, M.R.; et al. The Role of Chest Compressions on Ventilation during Advanced Cardiopulmonary Resuscitation. J. Clin. Med. 2023, 12, 6918. https://doi.org/10.3390/jcm12216918
Azcarate I, Urigüen JA, Leturiondo M, Sandoval CL, Redondo K, Gutiérrez JJ, Russell JK, Wallmüller P, Sterz F, Daya MR, et al. The Role of Chest Compressions on Ventilation during Advanced Cardiopulmonary Resuscitation. Journal of Clinical Medicine. 2023; 12(21):6918. https://doi.org/10.3390/jcm12216918
Chicago/Turabian StyleAzcarate, Izaskun, Jose Antonio Urigüen, Mikel Leturiondo, Camilo Leonardo Sandoval, Koldo Redondo, José Julio Gutiérrez, James Knox Russell, Pia Wallmüller, Fritz Sterz, Mohamud Ramzan Daya, and et al. 2023. "The Role of Chest Compressions on Ventilation during Advanced Cardiopulmonary Resuscitation" Journal of Clinical Medicine 12, no. 21: 6918. https://doi.org/10.3390/jcm12216918
APA StyleAzcarate, I., Urigüen, J. A., Leturiondo, M., Sandoval, C. L., Redondo, K., Gutiérrez, J. J., Russell, J. K., Wallmüller, P., Sterz, F., Daya, M. R., & Ruiz de Gauna, S. (2023). The Role of Chest Compressions on Ventilation during Advanced Cardiopulmonary Resuscitation. Journal of Clinical Medicine, 12(21), 6918. https://doi.org/10.3390/jcm12216918