
Characterizing Movement Patterns of Older Individuals with T2D in Free-Living Environments Using Wearable Accelerometers

 , , , ,
  ,
,
Abstract
:1. Introduction
2. Materials and Methods
2.1. Participants
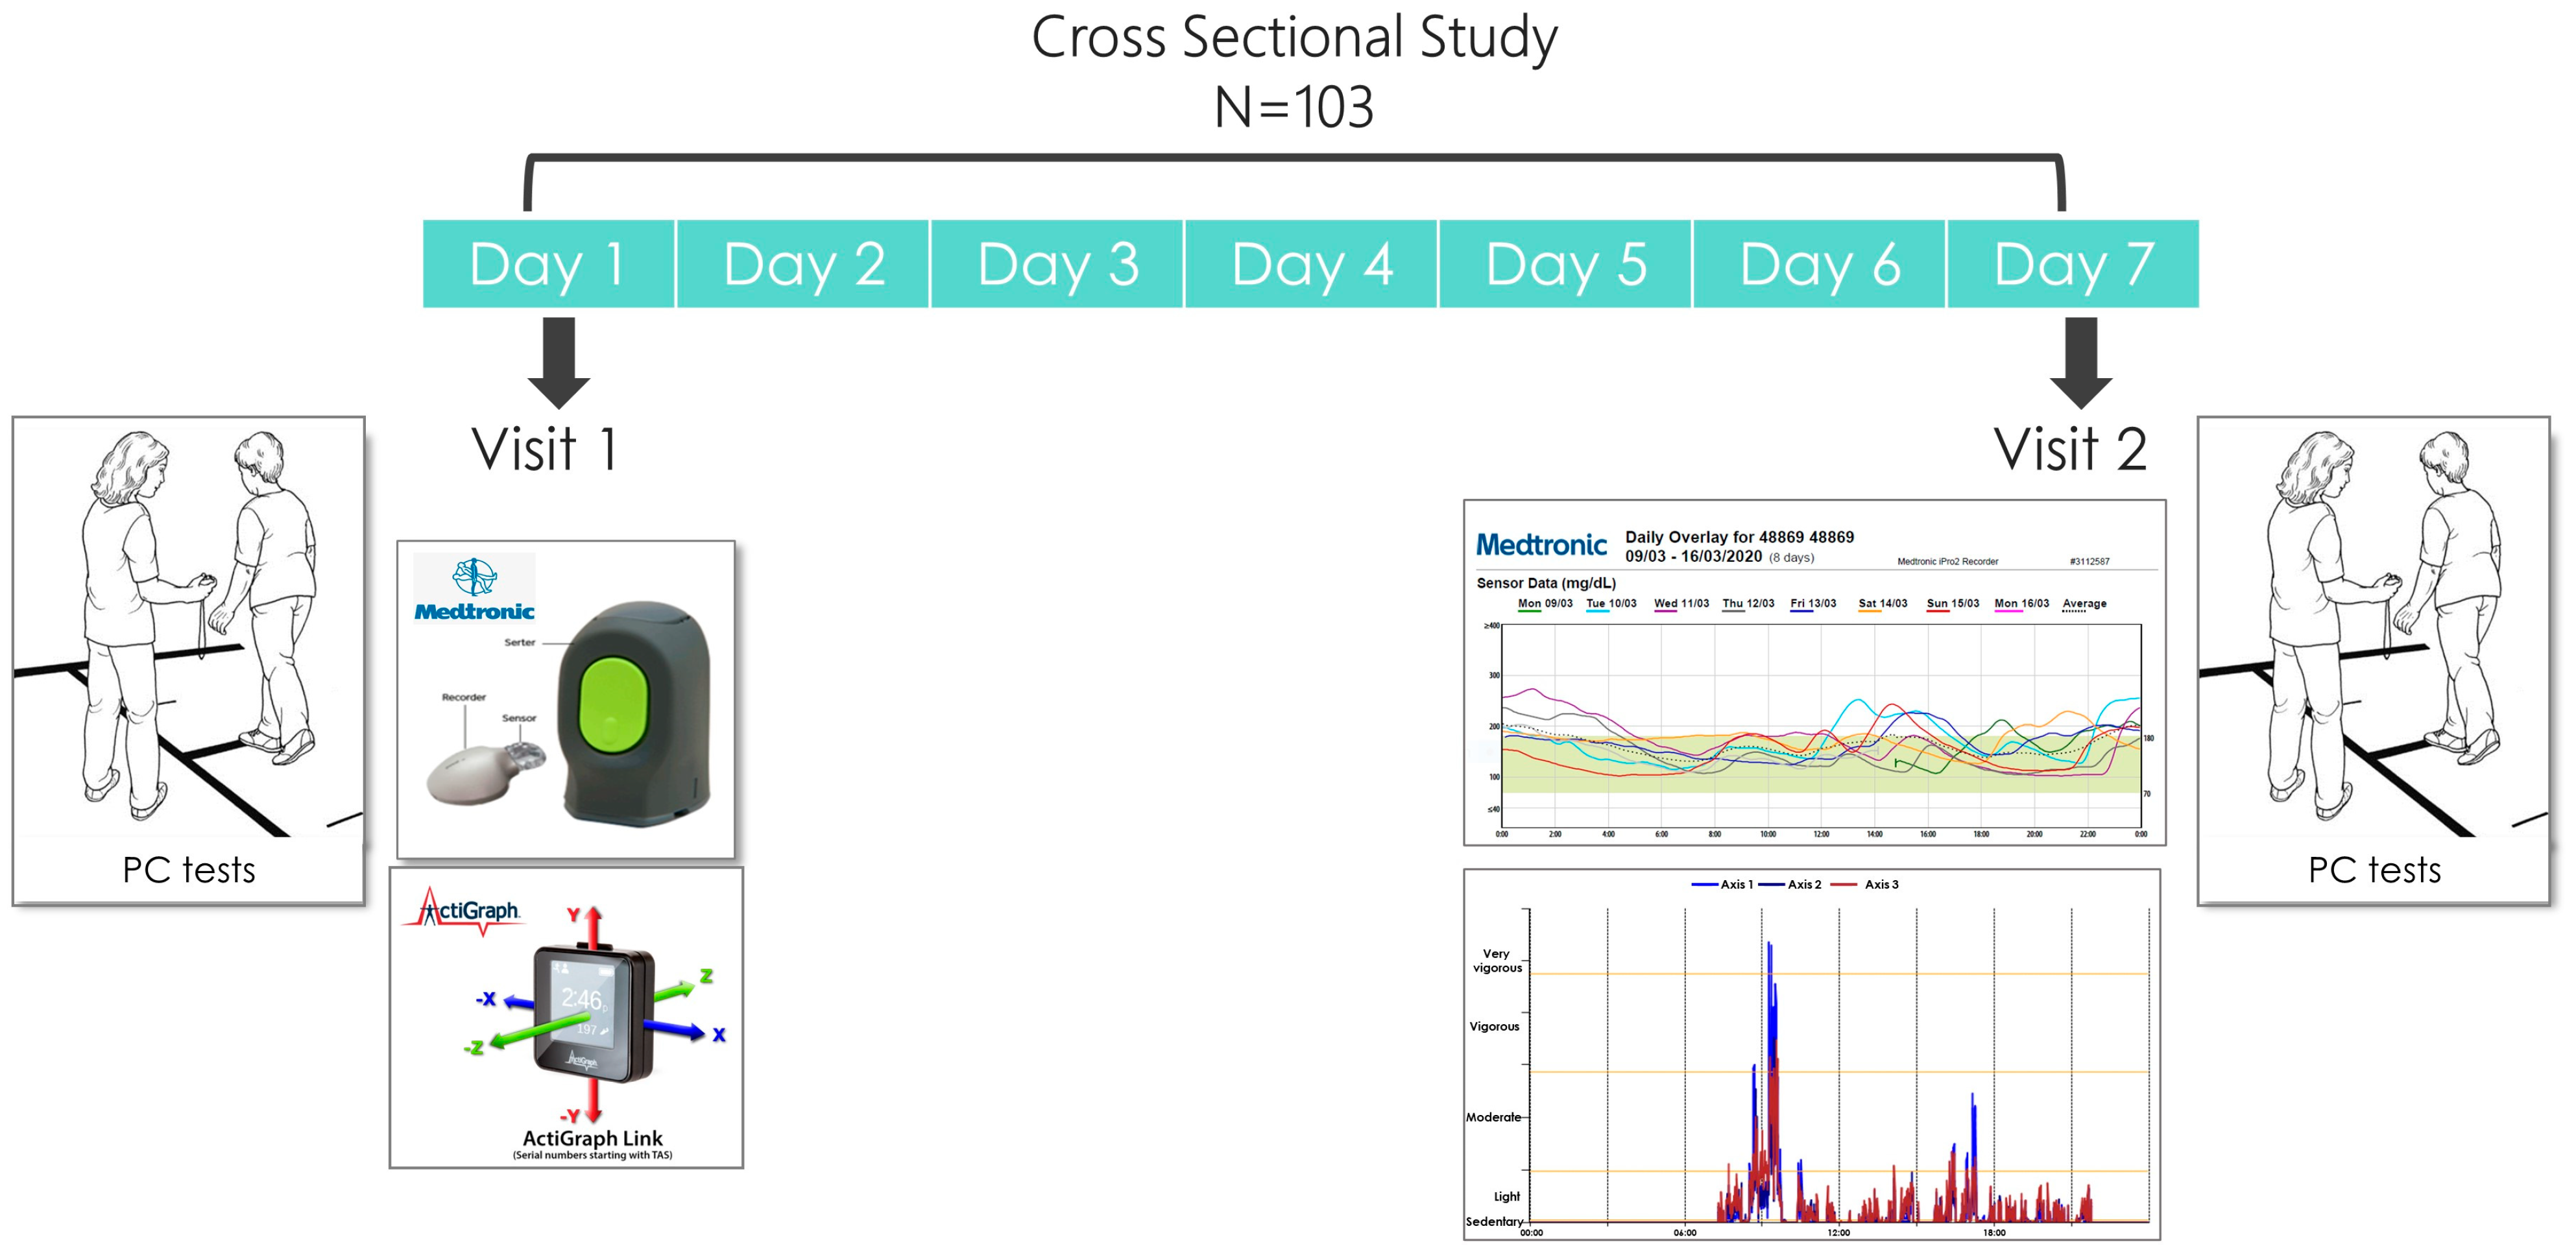
2.2. Study Design
2.3. Socio-Demographic Measures
2.4. Glycemic Control (GC) Status
2.5. Physical Capacity (PC) Battery
2.5.1. Muscle Strength Assessment
- The hand grip strength test was used to assess upper body muscular strength [28]. This test was conducted with a dynamometer (Jamar) in a seated position with the patient’s elbow flexed to 90 degrees and their forearm and wrist neutral. An average score (kg) from three repetitions was calculated for the dominant and nondominant hand and compared to the general population according to age and gender. The grip position of the dynamometer was adjusted to each individual’s hand size. Measurements of grip strength taken with the Jamar dynamometer have evidence for good to excellent (r > 0.80) test–retest reproducibility and excellent (r = 0.98) inter-rater reliability [28]. Longitudinal studies confirm that grip strength declines after midlife, with loss accelerating with increasing age and through old age. Grip strength assessment has been shown to have predictive validity, and low values are associated with falls, disability, impaired health-related quality of life, a prolonged length of stay in hospital, and increased mortality [29].
- The 30 s chair stand (STS) was used to assess lower limb muscle strength [30]. The patient instructions were to stand up from a seated position as many times as possible with arms crossed on the chest for 30 s. Participants were familiarized with the task before the beginning of the test. The number of times within 30 s that the participant could rise to a full stand from a seated position with his back straight and feet flat on the floor “as fast as possible” was counted. The strength of the lower limb muscles has a crucial impact on daily functioning, for example, in movement from a sitting position to a standing position, climbing up stairs, and walking. Failure to perform STS movements efficiently and smoothly may lead to falls [31]. For individuals aged 70–74, a score below 10 signifies a high risk of falling for women, and a score below 12 indicates a high risk for men [32]. To maintain physical independence, a score of 14 or higher is necessary for women, while men require a score of 15 or higher [33].
2.5.2. Aerobic Capacity Assessment
2.5.3. Gait Speed Assessment
2.5.4. Balance Assessment
- The TUG [40] test examines most mobility skills. The participant is asked to get up from a chair with handles, walk three meters, turn, walk back, and sit down in the shortest possible time. The score is categorized according to the risk of falls and independent walking. The following cut-offs are conventionally used: less than 14 s indicates independent mobility; 15–20 s signifies semi-independent mobility, suggesting a somewhat elevated risk of falls and necessitating further assessment, with the possibility of requiring a walking aid; 20–30 s indicates dependent mobility. Data suggests that the TUG test is a reliable and valid test for quantifying functional mobility and risk for falls that may also be useful in following clinical change over time [41].
- The BBS [42] test includes 14 tasks which evaluate static and dynamic balance. Each task receives a score of 0 to 4 points depending on the quality and task execution time. The maximum score is 56 points. The scores are dichotomized in the following manner: Scores below 36 indicate impairment with an increased risk of falls, scores between 37- 45 indicate the need for a walking aid in order to walk in a safe manner, and scores above 45 indicate an independent walker without an increased risk of falls. In assessing the risk of fall among the community-dwelling elderly, the TUG and the BBS can be used in combination to increase the diagnostic accuracy of the risk of fall [43].
- The FSST [44] evaluates dynamic balance at a high functional level and features stepping forward, backwards, left, and right over two 90 cm and 2.5 cm high long sticks that divide the floor into four squares. The subject stands in square 1 facing square 2. The aim is to step as fast as possible into each square with both feet in the following sequence: Square 2, 3, 4, 1, 4, 3, 2, 1 (clockwise to counterclockwise) without touching the sticks. The score is the time required to complete the entire route. Subjects with scores higher than 15 s are associated with a greater risk of falls.
2.5.5. Frailty Assessment
2.6. Allocation to PC Categories
2.7. Assessment of Movement Patterns (MPs) Using Accelerometers
2.8. Assessment of Physical Activity (PA) Using Accelerometers
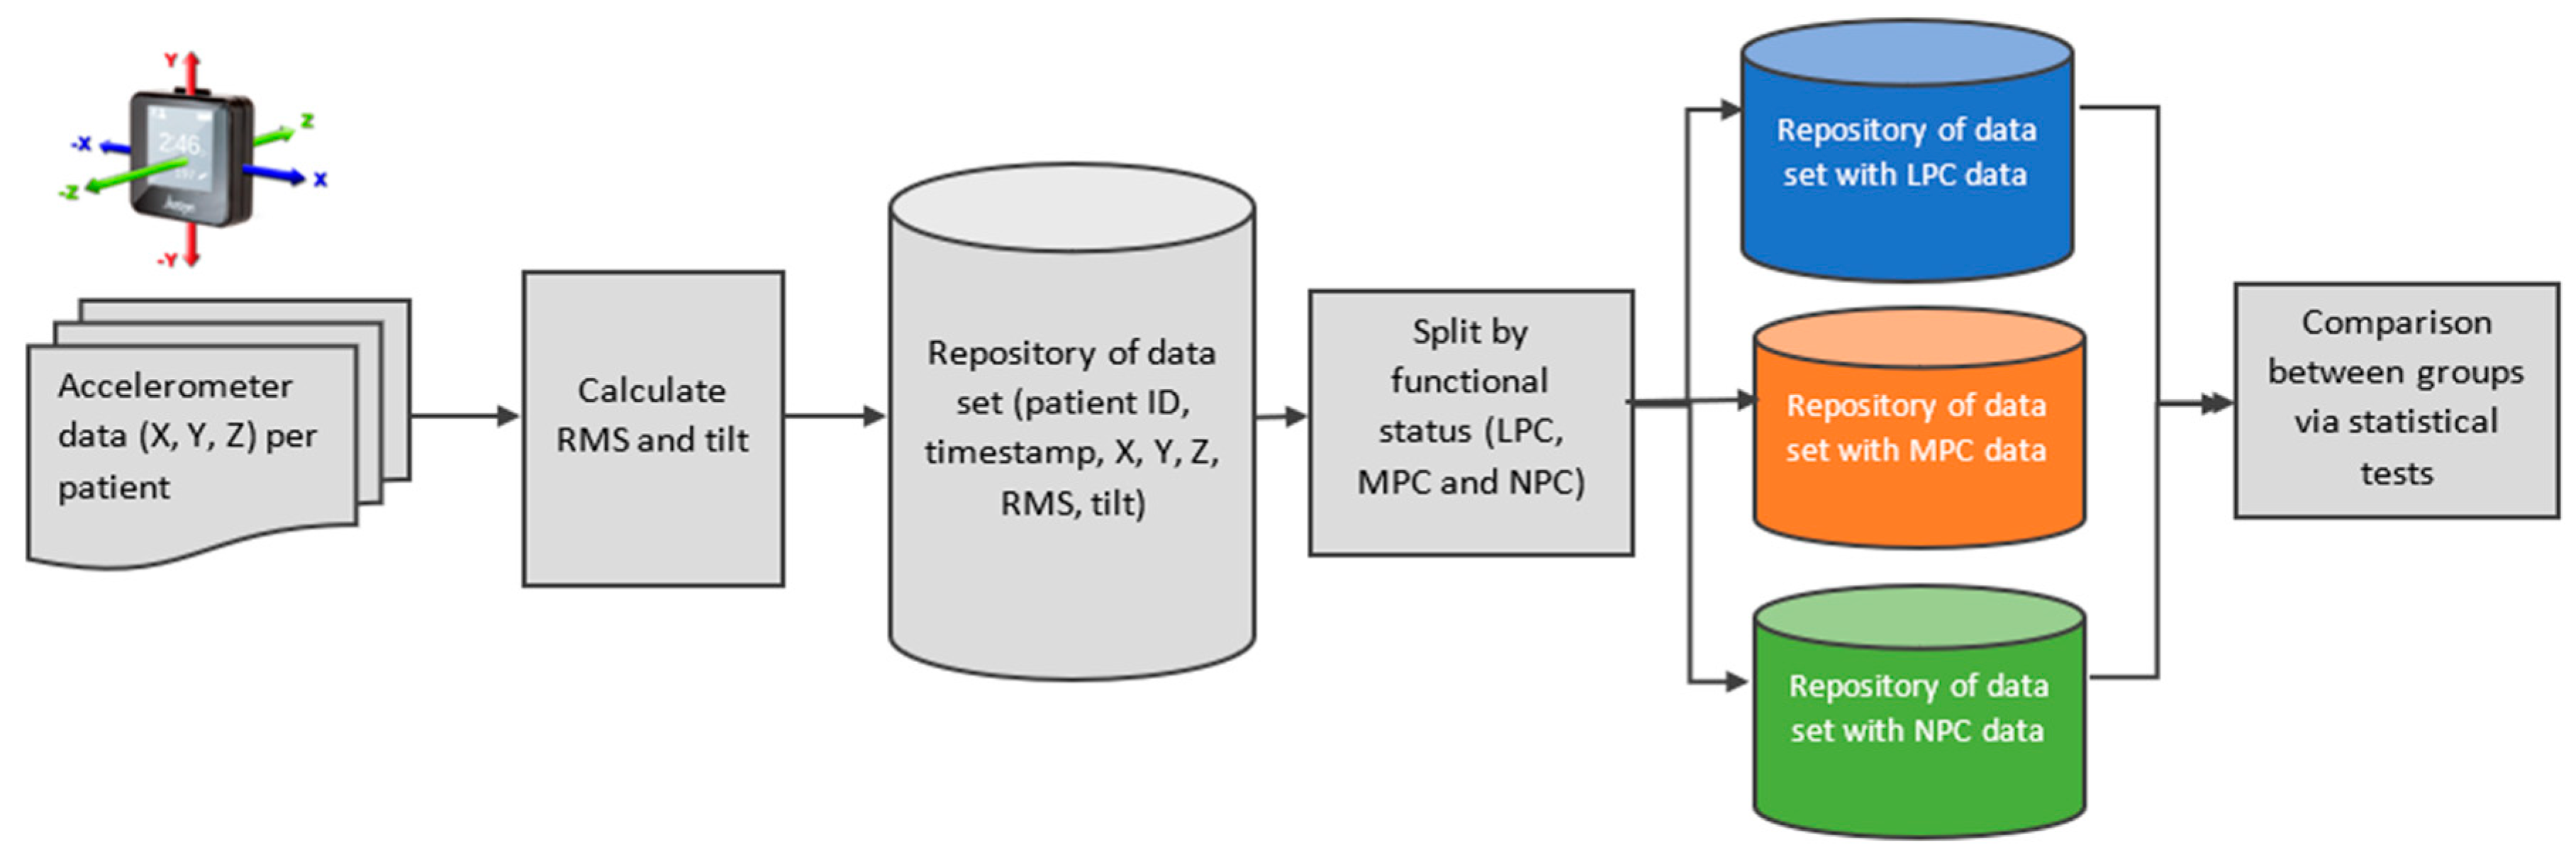
2.9. Accelerometer Data Integration and Analysis (Figure 2)
3. Results
3.1. Dataset Description
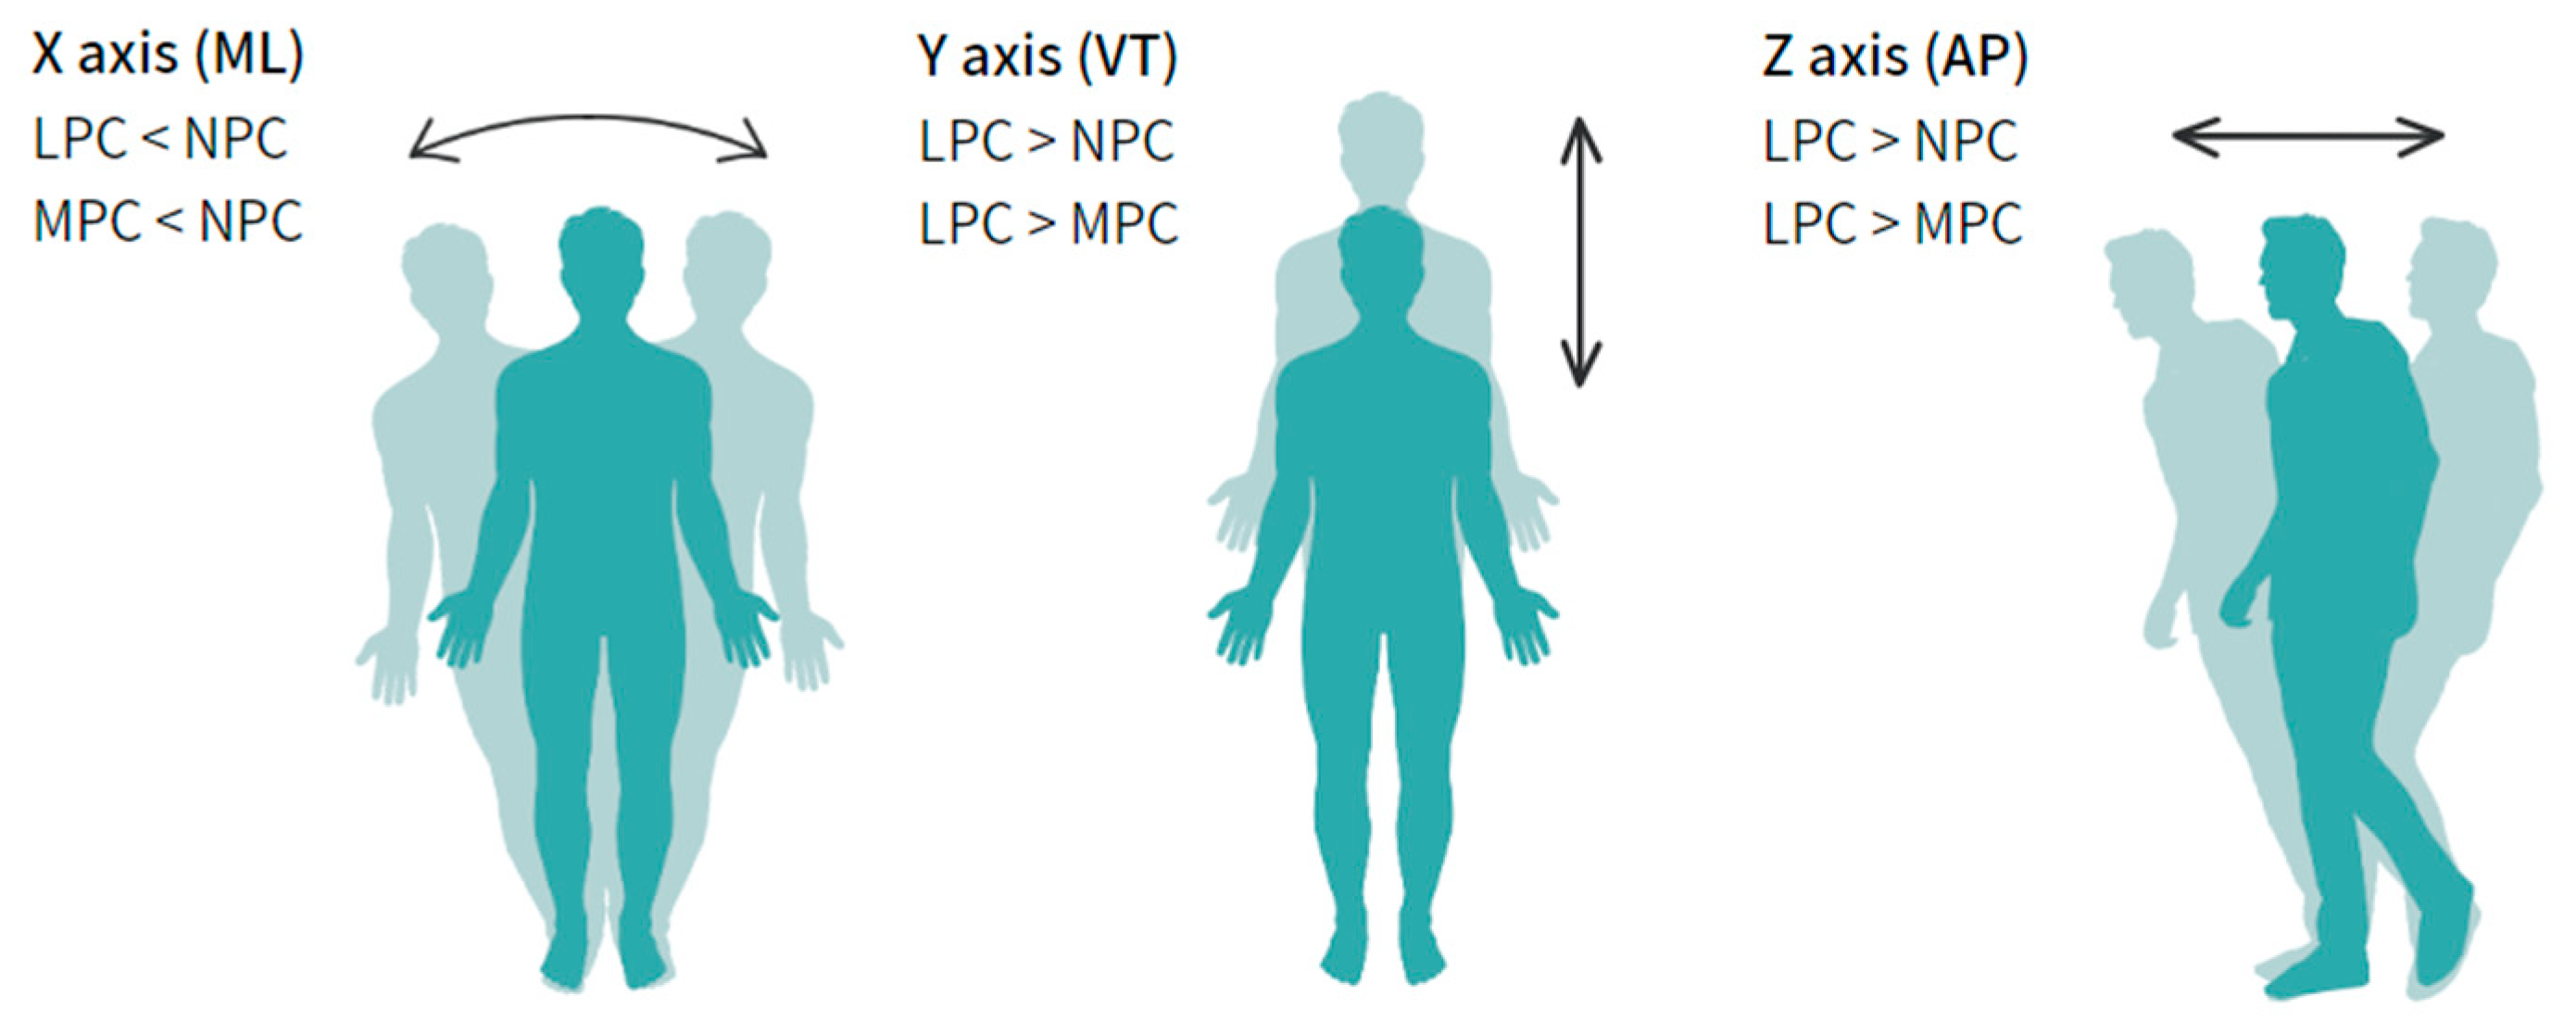
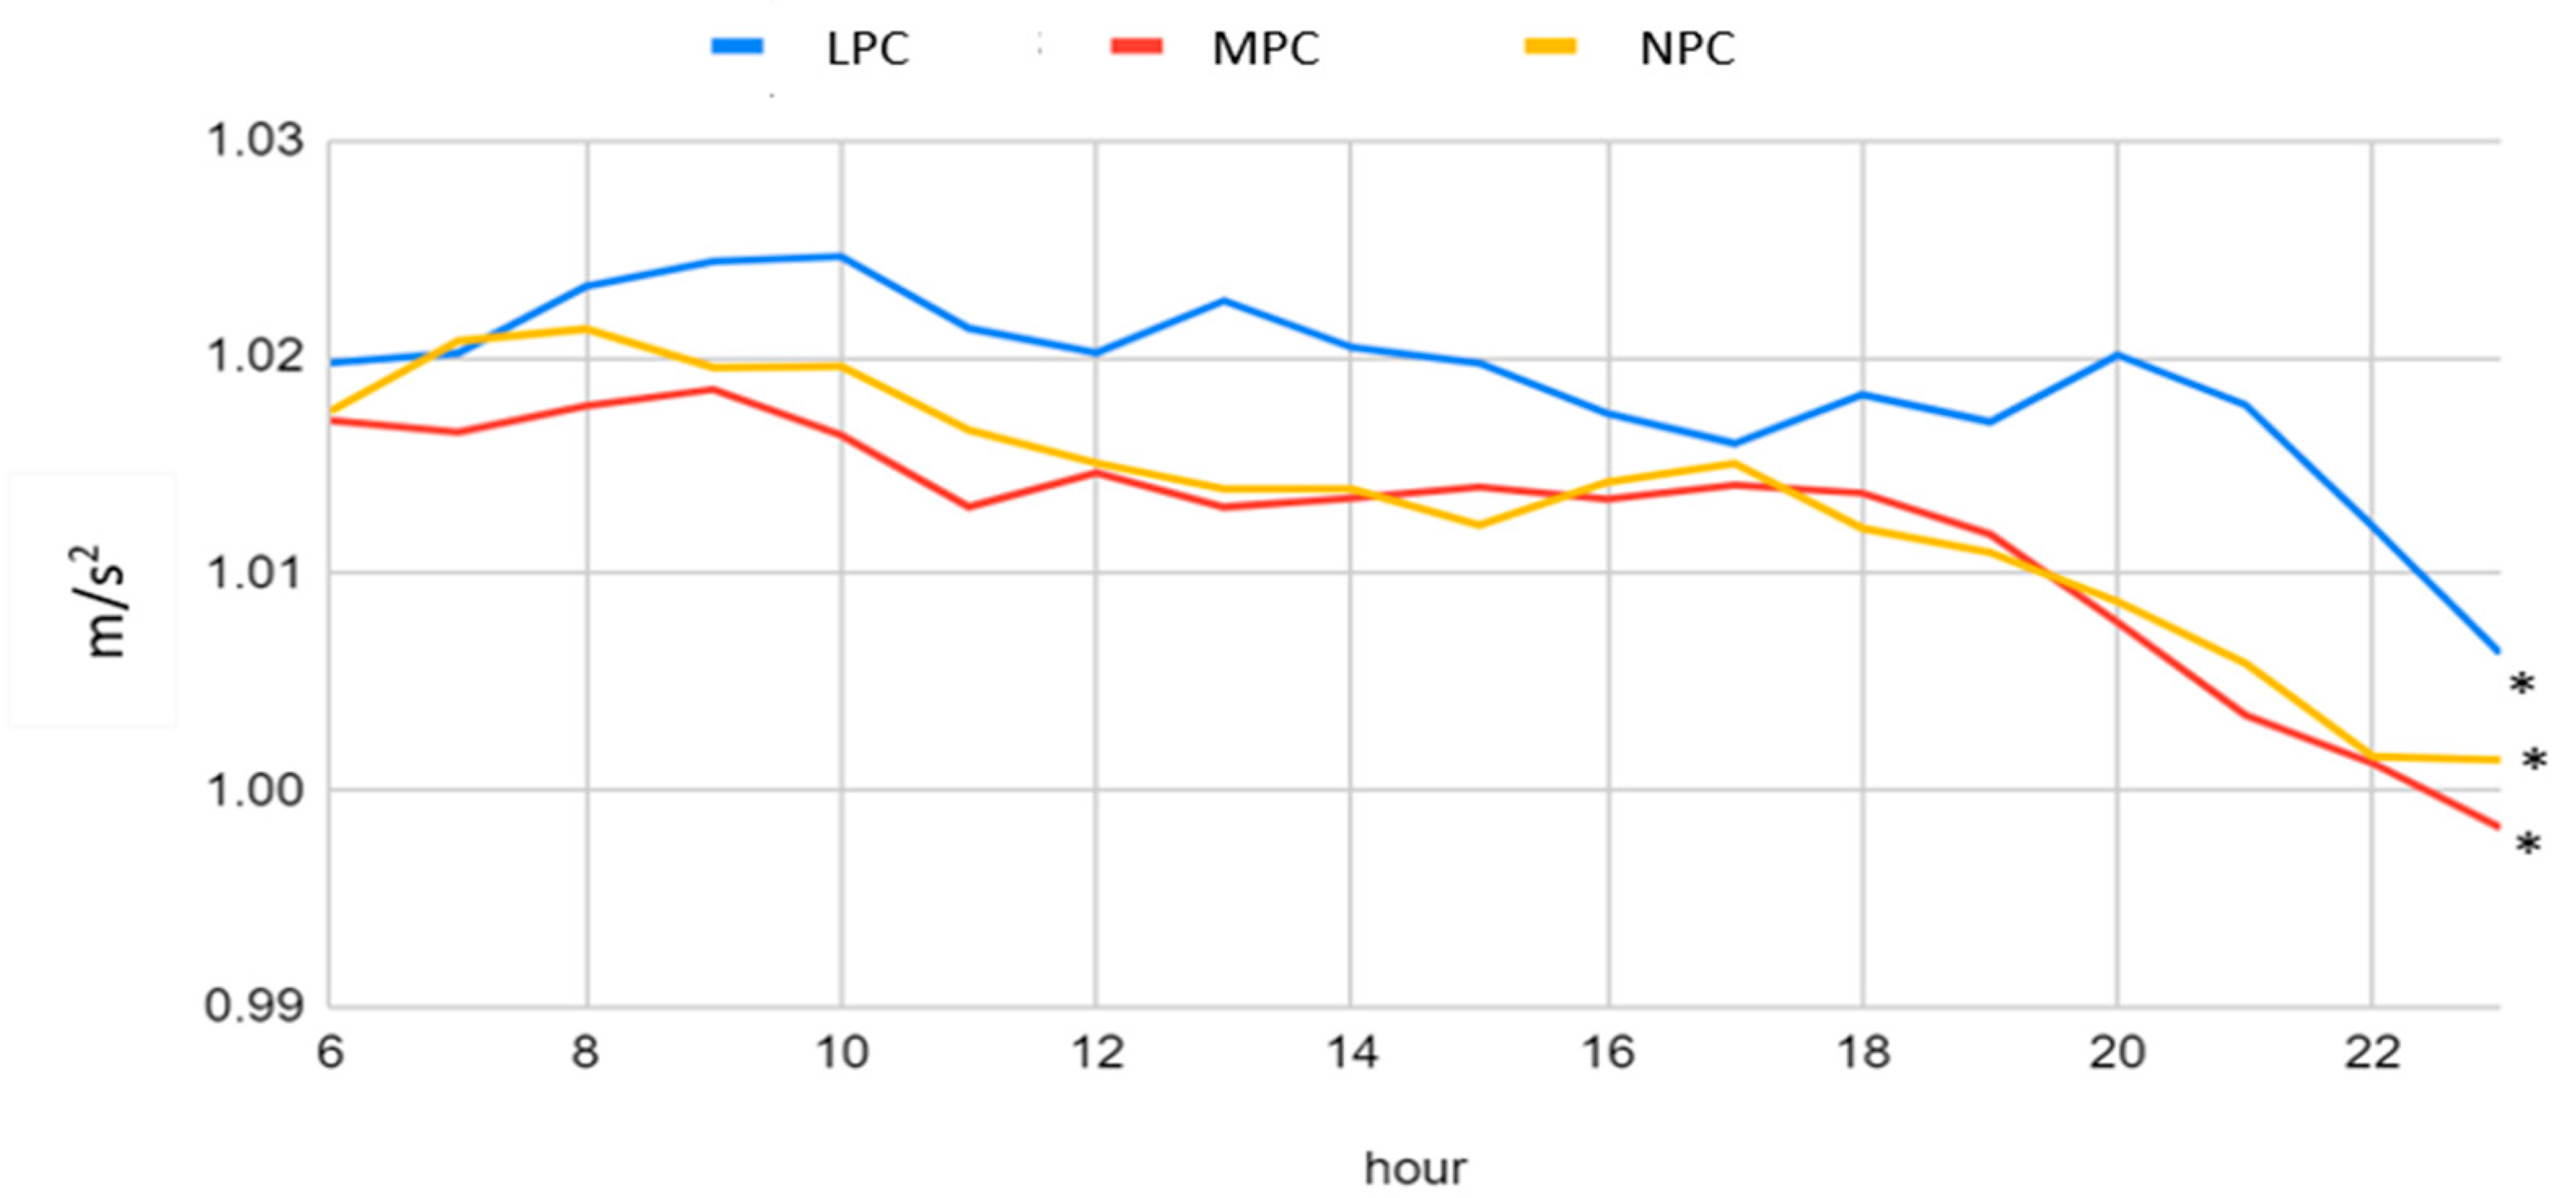
3.2. Acceleration Patterns of the Three Physical Capacity Categories
4. Discussion
5. Conclusions
Study Limitations
Author Contributions
Funding
Institutional Review Board Statement
Informed Consent Statement
Data Availability Statement
Conflicts of Interest
Appendix A

| Timestamp | Accelerometer X | Accelerometer Y | Accelerometer Z | |
|---|---|---|---|---|
| 0 | 12/08/2020 10:55:00.000 | 0.008 | −0.898 | 0.395 |
| 1 | 12/08/2020 10:55:00.010 | 0.031 | −0.906 | 0.387 |
| 2 | 12/08/2020 10:55:00.020 | 0.043 | −0.902 | 0.363 |
| 3 | 12/08/2020 10:55:00.030 | 0.039 | −0.883 | 0.328 |
| 4 | 12/08/2020 10:55:00.040 | 0.051 | −0.887 | 0.328 |
| 5 | 12/08/2020 10:55:00.050 | 0.039 | −0.883 | 0.309 |
References
- Sinclair, A.; Saeedi, P.; Kaundal, A.; Karuranga, S.; Malanda, B.; Williams, R. Diabetes and global ageing among 65–99-year-old adults: Findings from the International Diabetes Federation Diabetes Atlas, 9th edition. Diabetes Res. Clin. Pract. 2020, 162, 108078. [Google Scholar] [CrossRef] [PubMed]
- Wong, E.; Backholer, K.; Gearon, E.; Harding, J.; Freak-Poli, R.; Stevenson, C.; Peeters, A. Diabetes and risk of physical disability in adults: A systematic review and meta-analysis. Lancet Diabetes Endocrinol. 2013, 1, 106–114. [Google Scholar] [CrossRef]
- Park, S.W.; Goodpaster, B.H.; Lee, J.S.; Kuller, L.H.; Boudreau, R.; de Rekeneire, N.; Harris, T.B.; Kritchevsky, S.; Tylavsky, F.A.; Nevitt, M.; et al. Excessive loss of skeletal muscle mass in older adults with type 2 diabetes. Diabetes Care 2009, 32, 1993–1997. [Google Scholar] [CrossRef]
- Morley, J.E.; Malmstrom, T.K.; Rodriguez-Mañas, L.; Sinclair, A.J. Frailty, sarcopenia and diabetes. J. Am. Med. Dir. Assoc. 2014, 15, 853–859. [Google Scholar] [CrossRef] [PubMed]
- Sayer, A.A.; Syddall, H.E.; Martin, H.J.; Dennison, E.M.; Anderson, F.H.; Cooper, C. Falls, sarcopenia, and growth in early life: Findings from the Hertfordshire cohort study. Am. J. Epidemiol. 2006, 164, 665–671. [Google Scholar] [CrossRef] [PubMed]
- Ahmad, E.; Sargeant, J.A.; Yates, T.; Webb, D.R.; Davies, M.J. Type 2 diabetes and impaired physical function: A growing problem. Diabetology 2022, 3, 30–45. [Google Scholar] [CrossRef]
- Volpato, S.; Maraldi, C.; Fellin, R. Type 2 diabetes and risk for functional decline and disability in older persons. Curr. Diabetes Rev. 2010, 6, 134–143. [Google Scholar] [CrossRef]
- Morley, J.E.; Vellas, B.; van Kan, G.A.; Anker, S.D.; Bauer, J.M.; Bernabei, R.; Cesari, M.; Chumlea, W.; Doehner, W.; Evans, J.; et al. Frailty consensus: A call to action. J. Am. Med. Dir. Assoc. 2013, 14, 392–397. [Google Scholar] [CrossRef]
- ElSayed, N.A.; Aleppo, G.; Aroda, V.R.; Bannuru, R.R.; Brown, F.M.; Bruemmer, D.; Collins, B.S.; Hilliard, M.E.; Isaacs, D.; Johnson, E.L.; et al. 13. Older Adults: Standards of Care in Diabetes—2023. Diabetes Care 2023, 46 (Suppl. S1), S216–S229. [Google Scholar] [CrossRef]
- Yu, L.; Zhao, Y.; Wang, H.; Sun, T.-L.; Murphy, T.E.; Tsui, K.-L. Assessing elderly’s functional balance and mobility via analyzing data from waist-mounted tri-axial wearable accelerometers in timed up and go tests. BMC Med. Inform. Decis. Mak. 2021, 21, 108. [Google Scholar] [CrossRef]
- Kang, D.W.; Choi, J.S.; Lee, J.W.; Chung, S.C.; Park, S.J.; Tack, G.R. Real-time elderly activity monitoring system based on a tri-axial accelerometer. Disabil. Rehabil. Assist. Technol. 2010, 5, 247–253. [Google Scholar] [CrossRef]
- O’Sullivan, M.; Blake, C.; Cunningham, C.; Boyle, G.; Finucane, C. Correlation of accelerometry with clinical balance tests in older fallers and non-fallers. Age Ageing 2009, 38, 308–313. [Google Scholar] [CrossRef]
- Shahzad, A.; Ko, S.; Lee, S.; Lee, J.-A.; Kim, K. Quantitative Assessment of Balance Impairment for Fall-Risk Estimation Using Wearable Triaxial Accelerometer. IEEE Sens. J. 2017, 17, 6743–6751. [Google Scholar] [CrossRef]
- Jarchi, D.; Pope, J.; Lee, T.K.M.; Tamjidi, L.; Mirzaei, A.; Sanei, S. A Review on Accelerometry-Based Gait Analysis and Emerging Clinical Applications. IEEE Rev. Biomed. Eng. 2018, 11, 177–194. [Google Scholar] [CrossRef]
- Bachlin, M.; Plotnik, M.; Roggen, D.; Maidan, I.; Hausdorff, J.M.; Giladi, N.; Troster, G. Wearable assistant for Parkinson’s disease patients with the freezing of gait symptom. IEEE Trans. Inf. Technol. Biomed. 2010, 14, 436–446. [Google Scholar] [CrossRef] [PubMed]
- Gupta, A.S.; Luddy, A.C.; Khan, N.C.; Reiling, S.; Thornton, J.K. Real-life Wrist Movement Patterns Capture Motor Impairment in Individuals with Ataxia-Telangiectasia. Cerebellum 2022, 22, 261–271. [Google Scholar] [CrossRef] [PubMed]
- Weiss, A.; Herman, T.; Giladi, N.; Hausdorff, J.M. Objective assessment of fall risk in Parkinson’s disease using a body-fixed sensor worn for 3 days. PLoS ONE 2014, 9, e96675. [Google Scholar] [CrossRef] [PubMed]
- Chigateri, N.G.; Kerse, N.; Wheeler, L.; MacDonald, B.; Klenk, J. Validation of an accelerometer for measurement of activity in frail older people. Gait Posture 2018, 66, 114–117. [Google Scholar] [CrossRef]
- Bagalà, F.; Becker, C.; Cappello, A.; Chiari, L.; Aminian, K.; Hausdorff, J.M.; Zijlstra, W.; Klenk, J. Evaluation of accelerometer-based fall detection algorithms on real-world falls. PLoS ONE 2012, 7, e37062. [Google Scholar] [CrossRef]
- Sucerquia, A.; López, J.D.; Vargas-Bonilla, J.F. Real-Life/Real-Time Elderly Fall Detection with a Triaxial Accelerometer. Sensors 2018, 18, 1101. [Google Scholar] [CrossRef]
- Bet, P.; Castro, P.C.; Ponti, M.A. Foreseeing future falls with accelerometer features in active community-dwelling older persons with no recent history of falls. Exp. Gerontol. 2021, 143, 111139. [Google Scholar] [CrossRef] [PubMed]
- Leirós-Rodríguez, R.; García-Soidán, J.L.; Romo-Pérez, V. Analyzing the use of accelerometers as a method of early diagnosis of alterations in balance in elderly people: A systematic review. Sensors 2019, 19, 3883. [Google Scholar] [CrossRef] [PubMed]
- Weng, W.-X.; Lo, S.-C. Fall detection based on tilt angle and acceleration variations. In Proceedings of the 2016 IEEE Trustcom/BigDataSE/ISPA, Tianjin, China, 23–26 August 2016; IEEE: Piscataway, NJ, USA; pp. 1712–1717. [CrossRef]
- Montesinos, L.; Castaldo, R.; Pecchia, L. Wearable Inertial Sensors for Fall Risk Assessment and Prediction in Older Adults: A Systematic Review and Meta-Analysis. IEEE Trans. Neural Syst. Rehabil. Eng. 2018, 26, 573–582. [Google Scholar] [CrossRef] [PubMed]
- Menz, H.B.; Lord, S.R.; Fitzpatrick, R.C. Age-related differences in walking stability. Age Ageing 2003, 32, 137–142. [Google Scholar] [CrossRef] [PubMed]
- Rodríguez-Mañas, L.; Bayer, A.J.; Kelly, M.; Zeyfang, A.; Izquierdo, M.; Laosa, O.; Hardman, T.C.; Sinclair, A.J. An evaluation of the effectiveness of a multi-modal intervention in frail and pre-frail older people with type 2 diabetes—The MID-Frail study: Study protocol for a randomised controlled trial. Trials 2014, 15, 34. [Google Scholar] [CrossRef]
- Pahor, M.; Guralnik, J.M.; Ambrosius, W.T.; Blair, S.; Bonds, D.E.; Church, T.S.; Espeland, M.A.; Fielding, R.A.; Gill, T.M.; Groessl, E.J.; et al. Effect of structured physical activity on prevention of major mobility disability in older adults: The LIFE study randomized clinical trial. JAMA 2014, 311, 2387–2396. [Google Scholar] [CrossRef] [PubMed]
- Roberts, H.C.; Denison, H.J.; Martin, H.J.; Patel, H.P.; Syddall, H.; Cooper, C.; Sayer, A.A. A review of the measurement of grip strength in clinical and epidemiological studies: Towards a standardised approach. Age Ageing 2011, 40, 423–429. [Google Scholar] [CrossRef]
- Cooper, R.; Kuh, D.; Hardy, R.; Mortality Review Group; FALCon and HALCyon Study Teams. Objectively measured physical capability levels and mortality: Systematic review and meta-analysis. BMJ 2010, 341, c4467. [Google Scholar] [CrossRef]
- Jones, C.J.; Rikli, R.E.; Beam, W.C. A 30-s chair-stand test as a measure of lower body strength in community-residing older adults. Res. Q. Exerc. Sport 1999, 70, 113–119. [Google Scholar] [CrossRef]
- Cheng, Y.-Y.; Wei, S.-H.; Chen, P.-Y.; Tsai, M.-W.; Cheng, I.-C.; Liu, D.-H.; Kao, C.-L. Can sit-to-stand lower limb muscle power predict fall status? Gait Posture 2014, 40, 403–407. [Google Scholar] [CrossRef]
- Rikli, R.E.; Jones, C.J. Functional Fitness Normative Scores for Community-Residing Older Adults, Ages 60–94. J. Aging Phys. Act. 1999, 7, 162–181. [Google Scholar] [CrossRef]
- Rikli, R.E.; Jones, C.J. Development and validation of criterion-referenced clinically relevant fitness standards for maintaining physical independence in later years. Gerontologist 2013, 53, 255–267. [Google Scholar] [CrossRef] [PubMed]
- ATS Committee on Proficiency Standards for Clinical Pulmonary Function Laboratories. ATS statement: Guidelines for the six-minute walk test. Am. J. Respir. Crit. Care Med. 2002, 166, 111–117. [Google Scholar] [CrossRef]
- Hamilton, D.M.; Haennel, R.G. Validity and reliability of the 6-min walk test in a cardiac rehabilitation population. J. Cardiopulm. Rehabil. 2000, 20, 156–164. [Google Scholar] [CrossRef]
- Boxer, R.; Kleppinger, A.; Ahmad, A.; Annis, K.; Hager, D.; Kenny, A. The 6-min walk is associated with frailty and predicts mortality in older adults with heart failure. Congest. Heart Fail. 2010, 16, 208–213. [Google Scholar] [CrossRef]
- Fritz, S.; Lusardi, M. White paper: “walking speed: The sixth vital sign”. J. Geriatr. Phys. Ther. 2009, 32, 46–49. [Google Scholar] [CrossRef]
- Studenski, S.; Perera, S.; Patel, K.; Rosano, C.; Faulkner, K.; Inzitari, M.; Brach, J.; Chandler, J.; Cawthon, P.; Connor, E.B.; et al. Gait speed and survival in older adults. JAMA 2011, 305, 50–58. [Google Scholar] [CrossRef]
- Van Kan, G.A.; Rolland, Y.; Andrieu, S.; Bauer, J.; Beauchet, O.; Bonnefoy, M.; Cesari, M.; Donini, L.; Gillette-Guyonnet, S.; Inzitari, M.; et al. Gait speed at usual pace as a predictor of adverse outcomes in community-dwelling older people an International Academy on Nutrition and Aging (IANA) Task Force. J. Nutr. Health Aging 2009, 13, 881–889. [Google Scholar] [CrossRef]
- Podsiadlo, D.; Richardson, S. The timed “Up & Go”: A test of basic functional mobility for frail elderly persons. J. Am. Geriatr. Soc. 1991, 39, 142–148. [Google Scholar] [CrossRef] [PubMed]
- Shumway-Cook, A.; Brauer, S.; Woollacott, M. Predicting the probability for falls in community-dwelling older adults using the Timed Up & Go Test. Phys. Ther. 2000, 80, 896–903. [Google Scholar] [CrossRef]
- Berg, K.O.; Wood-Dauphinee, S.L.; Williams, J.I.; Maki, B. Measuring balance in the elderly: Validation of an instrument. Can. J. Public Health 1992, 83 (Suppl. S2), S7–S11. [Google Scholar]
- Park, S.-H. Tools for assessing fall risk in the elderly: A systematic review and meta-analysis. Aging Clin. Exp. Res. 2018, 30, 1–16. [Google Scholar] [CrossRef]
- Dite, W.; Temple, V.A. A clinical test of stepping and change of direction to identify multiple falling older adults. Arch. Phys. Med. Rehabil. 2002, 83, 1566–1571. [Google Scholar] [CrossRef] [PubMed]
- Fried, L.P.; Tangen, C.M.; Walston, J.; Newman, A.B.; Hirsch, C.; Gottdiener, J.; Seeman, T.; Tracy, R.; Kop, W.J.; Burke, G.; et al. Frailty in older adults: Evidence for a phenotype. J. Gerontol. A Biol. Sci. Med. Sci. 2001, 56, M146–M156. [Google Scholar] [CrossRef] [PubMed]
- Pols, M.A.; Peeters, P.H.M.; Bueno-De-Mesquita, H.B.; Ocke, M.C.; Wentink, C.A.; Kemper, H.C.G.; Collette, H.J.A. Validity and repeatability of a modified Baecke questionnaire on physical activity. Int. J. Epidemiol. 1995, 24, 381–388. [Google Scholar] [CrossRef] [PubMed]
- Natovich, R.; Gayus, N.; Azmon, M.; Michal, H.; Twito, O.G.; Yair, T.; Achiron, R.N.; Kraviz, N.; Mordenfeld, N.; Cukierman-Yaffe, T. Supporting a comprehensive and coordinated evaluation of the elderly with diabetes by integrating cognitive and physical assessment in the evaluation process. Diabetes Metab. Res. Rev. 2018, 34, e3030. [Google Scholar] [CrossRef] [PubMed]
- Toraman, A.; Yildirim, N.U. The falling risk and physical fitness in older people. Arch. Gerontol. Geriatr. 2010, 51, 222–226. [Google Scholar] [CrossRef] [PubMed]
- Zhao, Y.; Chung, P.-K. Differences in functional fitness among older adults with and without risk of falling. Asian Nurs. Res. Korean Soc. Nurs. Sci. 2016, 10, 51–55. [Google Scholar] [CrossRef]
- Beck, Y.; Herman, T.; Brozgol, M.; Giladi, N.; Mirelman, A.; Hausdorff, J.M. SPARC: A new approach to quantifying gait smoothness in patients with Parkinson’s disease. J. Neuroeng. Rehabil. 2018, 15, 49. [Google Scholar] [CrossRef]
- Sucerquia, A.; López, J.D.; Vargas-Bonilla, J.F. Sisfall: A fall and movement dataset. Sensors 2017, 17, 198. [Google Scholar] [CrossRef]
- Zheng, J.; Zhang, G.; Wu, T. Design of automatic fall detector for elderly based on triaxial accelerometer. In Proceedings of the 2009 3rd International Conference on Bioinformatics and Biomedical Engineering, Beijing, China, 11–13 June 2009; IEEE: Piscataway, NJ, USA, 2009; pp. 1–4. [Google Scholar] [CrossRef]
- Doheny, E.P.; Greene, B.R.; Foran, T.; Cunningham, C.; Fan, C.W.; Kenny, R.A. Diurnal variations in the outcomes of instrumented gait and quiet standing balance assessments and their association with falls history. Physiol. Meas. 2012, 33, 361–373. [Google Scholar] [CrossRef]
- Weiss, A.; Brozgol, M.; Dorfman, M.; Herman, T.; Shema, S.; Giladi, N.; Hausdorff, J.M. Does the evaluation of gait quality during daily life provide insight into fall risk? A novel approach using 3-day accelerometer recordings. Neurorehabilit. Neural Repair 2013, 27, 742–752. [Google Scholar] [CrossRef] [PubMed]
| Total | LPC (n = 20) | MPC (n = 38) | NPC (n = 45) | p-Value of the Model (KW) | |
|---|---|---|---|---|---|
| Gender: Male | 61 (59.2%) | 10 (50%) | 23 (61%) | 28 (62%) | 0.615 |
| Age | 71.5 ± 6.9 | 71.9 ± 7.4 | 71.4 ± 6.7 | 71.3 ± 7.2 | 0.974 |
| Education (years) | 15.4 ± 3.6 | 13.9 ± 2.6 | 15.3 ± 3.4 | 16.2 ± 3.9 | 0.108 |
| Weight (Kg) | 80.4 ± 15.5 | 79.9 ± 15.5 | 83.7 ± 16.5 | 77.9 ± 14.5 | 0.190 |
| Height (cm) | 168.7 ± 9 | 164.4 ± 7.5 | 169.9 ± 9.8 | 169.4 ± 865 | 0.057 |
| BMI | 28.2 ± 4.6 | 29.3 ± 4.7 | 29 ± 5.4 | 27 ± 3.7 | 0.070 |
| WC (cm) | 105.7 ± 11.5 | 109.9 ± 12.8 | 106.1 ± 12.4 | 103.7 ± 9.9 | 0.170 |
| Falls | 24(23%) | 5(26.3%) | 12(30.6%) | 7(15.6%) | 0.260 |
| Smoking | 10 (9.2%) | 4 (17.7%) | 2 (5.3%) | 4 (9.3%) | 0.340 |
| Diabetes duration (years) | 17.1 ± 10.4 | 21.2 ± 8.9 | 19.4 ± 11.2 | 12.9 ± 9.1 | 0.0014 |
| Diabetes complication | 96 (93.2%) | 19 (95%) | 36 (94.7%) | 41 (91.1%) | 0.760 |
| Severe hypo | 18(17.4%) | 5(25%) | 7(18.4%) | 6(13.33%) | 0.510 |
| Insulin (%) | 89 (86.4%) | 19 (95%) | 30 (79%) | 40 (89%) | 0.170 |
| A1C (%) | 7.1 ± 1.1 | 7.5 ± 1.2 | 7.1 ± 0.9 | 6.9 ± 1.2 | 0.057 |
| Glucose Level (mg/dl) | 142.7 ± 45.6 | 159.5 ± 53.7 | 141.7 ± 42.2 | 135.7 ± 42.5 | <0.001 |
| TBR (%) | 1.2 ± 10.8 | 0.9 ± 9.3 | 0.9 ± 9.5 | 1.6 ± 12.6 | <0.001 |
| TIR (%) | 81.9 ± 38.5 | 71.5 ± 45.1 | 82.5 ± 38 | 86.4 ± 34.3 | <0.001 |
| TAR (%) | 13.9 ± 34.6 | 20.9 ± 40.7 | 14.4 ± 35.1 | 10 ± 30 | <0.001 |
| TAHR (%) | 2.9 ± 17 | 6.6 ± 24.9 | 2.2 ± 14.7 | 2 ± 14 | <0.001 |
| Total | LPC (n = 20) | MPC (n = 38) | NPC (n = 45) | p-Value of the Model (KW) | |
|---|---|---|---|---|---|
| PA questionnaire—Total score | 5.3 ± 1.8 | 4.5 ± 1.7 | 5.3 ± 1.7 | 5.8 ± 1.7 | 0.012 |
| GRIP, dominant hand (KG) | 24.9 ± 9 | 18.7 ± 8.3 | 25.7 ± 8.2 | 28 ± 9.5 | <0.001 |
| BERG total score | 53.9 ± 4.9 | 50.3 ± 7.3 | 54.6 ± 4.6 | 55.1 ± 2.6 | <0.001 |
| FSST (s) | 10.8 ±3.4 | 14.4 ± 4.8 | 11.4 ± 1.7 | 8.5 ± 1.7 | <0.001 |
| 6MWT (m) | 495.8 ± 111.2 | 376.3 ± 95.1 | 485.2 ± 9 | 557.9 ± 8 | <0.001 |
| STS (reps) | 13.9 ± 1.5 | 13.7 ± 1.2 | 13.9 ± 1.5 | 13.9 ± 1.7 | 0.74 |
| TUG (s) | 9.2 ± 3.3 | 12.6 ± 5.1 | 9.1 ± 2.3 | 7.6 ± 1.5 | <0.001 |
| 10MWT (s) | 8 ± 1.9 | 9.4 ± 1.9 | 7.9 ± 1.6 | 7.5 ± 1.6 | <0.001 |
| OLS (s) | 17.8 ± 10.3 | 9.1 ± 8.5 | 17.9 ± 9.6 | 21.1 ± 9.7 | <0.001 |
| 3360 turn test (s) | 5.7 ± 1.8 | 7.4 ± 2.2 | 5.9 ± 1.2 | 4.7 ± 1.2 | <0.001 |
| Pre-frail (%) | 35 | 10.5 | 0 | ||
| Frail (%) | 25 | 0 | 0 | ||
| Steps (daily mean) | 4772 ± 2691 | 2535 ± 1411 | 4327 ± 2646 | 4610 ± 1979 | <0.001 |
| Sedentary (%) | 82.2 ± 7 | 85.1 ± 6.8 | 81.9 ± 7.1 | 81 ± 6.8 | 0.120 |
| LPA (%) | 16.6 ± 6.4 | 14.4 ± 6.5 | 16.8 ± 6.6 | 17.4 ± 6.1 | 0.247 |
| MVPA (%) | 1.2 ± 1.3 | 0.4 ± 0.6 * | 1.2 ± 1.3 | 1.5 ± 1.3 | <0.001 |
| LPC (n = 20) | MPC (n = 38) | NPC (n = 45) | LPC (n = 20) | p-Value of the Model (KW) | Total Median |
|---|---|---|---|---|---|
| X(m/s2) | 0.102 (0.57) | 0.082 (0.63) | 0.109 (0.61) | <0.001 | 0.096 (0.61) |
| Y (m/s2) | −0.473 (0.76) | −0.418 (0.79) | −0.438 (0.79) | <0.001 | −0.438 (0.78) |
| Z (m/s2) | 0.234 (1.06) | 0.141 (1.06) | 0.172 (1.04) | <0.001 | 0.174 (1.06) |
| RMS (m/s2) | 1.017 (0.04) | 1.009 (0.04) | 1.011 (0.04) | <0.001 | 1.012 (0.04) |
| Tilt (°) | 1.157(0.52) | 1.132 (0.49) | 1.152 (0.52) | <0.001 | 1.145 (0.51) |
Disclaimer/Publisher’s Note: The statements, opinions and data contained in all publications are solely those of the individual author(s) and contributor(s) and not of MDPI and/or the editor(s). MDPI and/or the editor(s) disclaim responsibility for any injury to people or property resulting from any ideas, methods, instructions or products referred to in the content. |
© 2023 by the authors. Licensee MDPI, Basel, Switzerland. This article is an open access article distributed under the terms and conditions of the Creative Commons Attribution (CC BY) license (https://creativecommons.org/licenses/by/4.0/).
Share and Cite
Yahalom-Peri, T.; Bogina, V.; Basson-Shleymovich, Y.; Azmon, M.; Kuflik, T.; Kodesh, E.; Volpato, S.; Cukierman-Yaffe, T. Characterizing Movement Patterns of Older Individuals with T2D in Free-Living Environments Using Wearable Accelerometers. J. Clin. Med. 2023, 12, 7404. https://doi.org/10.3390/jcm12237404
Yahalom-Peri T, Bogina V, Basson-Shleymovich Y, Azmon M, Kuflik T, Kodesh E, Volpato S, Cukierman-Yaffe T. Characterizing Movement Patterns of Older Individuals with T2D in Free-Living Environments Using Wearable Accelerometers. Journal of Clinical Medicine. 2023; 12(23):7404. https://doi.org/10.3390/jcm12237404
Chicago/Turabian StyleYahalom-Peri, Tal, Veronika Bogina, Yamit Basson-Shleymovich, Michal Azmon, Tsvi Kuflik, Einat Kodesh, Stefano Volpato, and Tali Cukierman-Yaffe. 2023. "Characterizing Movement Patterns of Older Individuals with T2D in Free-Living Environments Using Wearable Accelerometers" Journal of Clinical Medicine 12, no. 23: 7404. https://doi.org/10.3390/jcm12237404