
Videolaryngoscopy versus Fiberoptic Bronchoscopy for Awake Tracheal Intubation: A Systematic Review and Meta-Analysis of Randomized Controlled Trials

 , ,
, ,
Abstract
1. Introduction
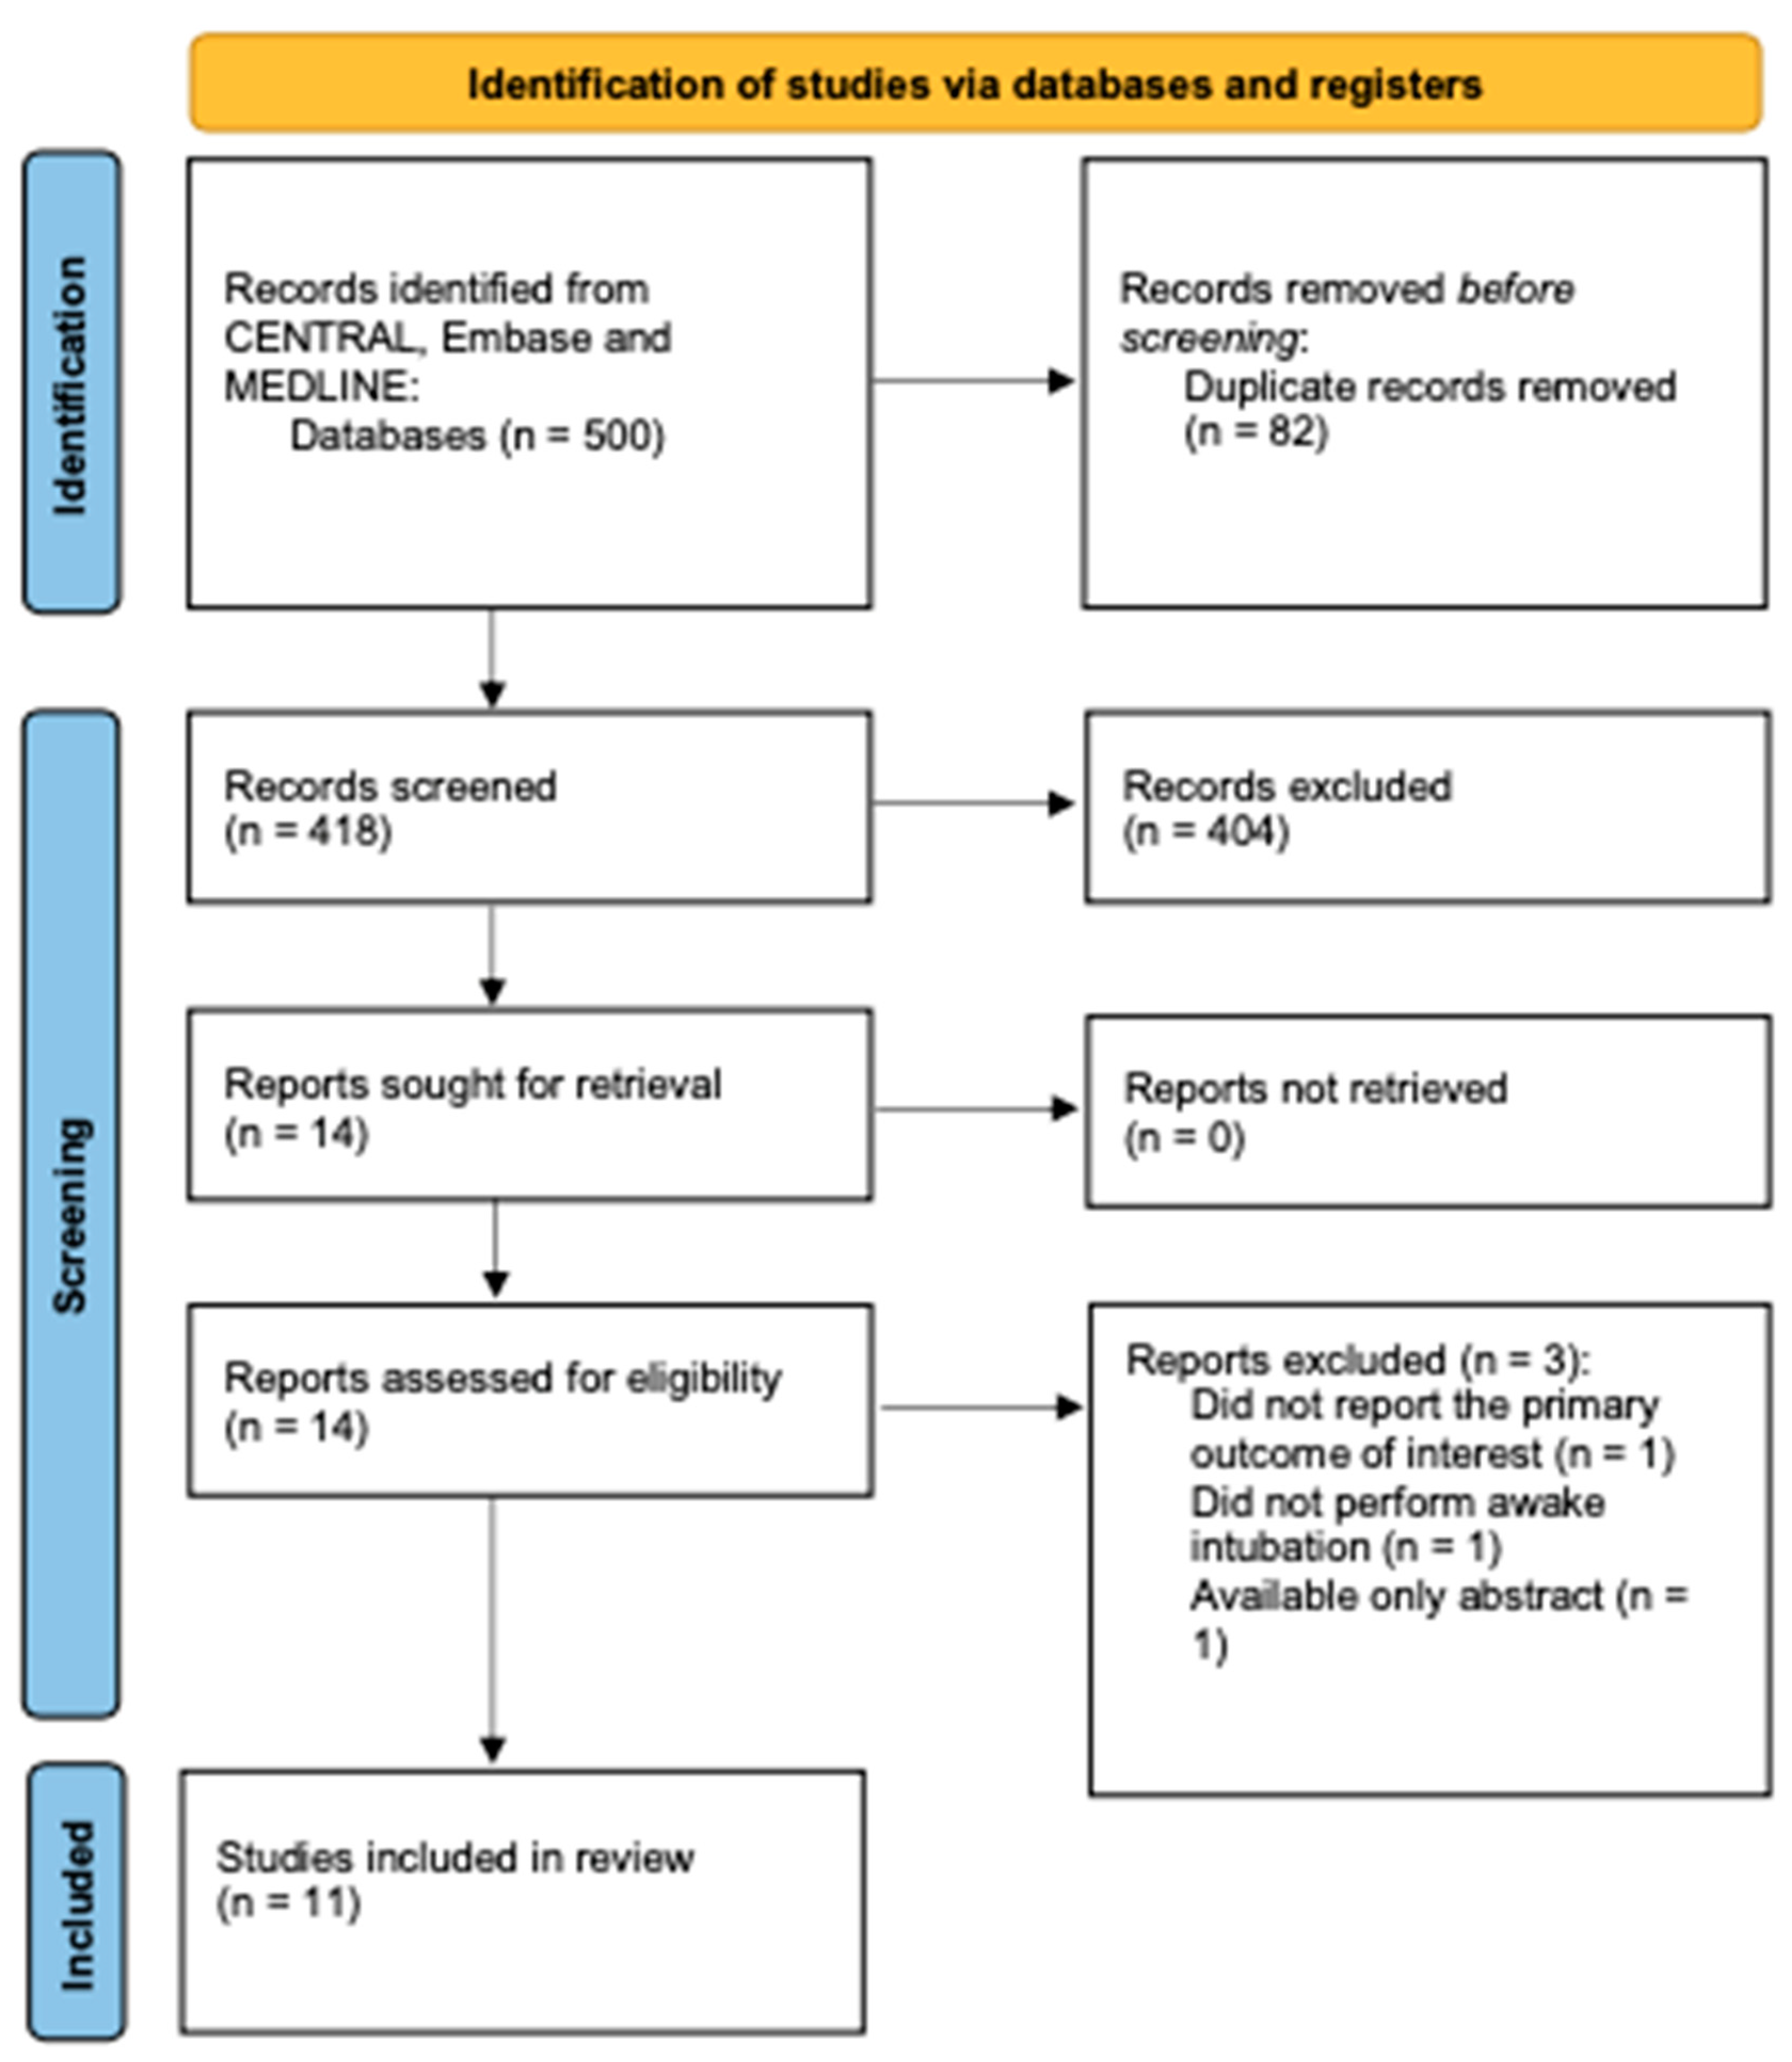
2. Methods
2.1. Search Strategy
2.2. Data Extraction and Quality Assessment
2.3. Outcome Measures
2.4. Quantitative Analysis
3. Results
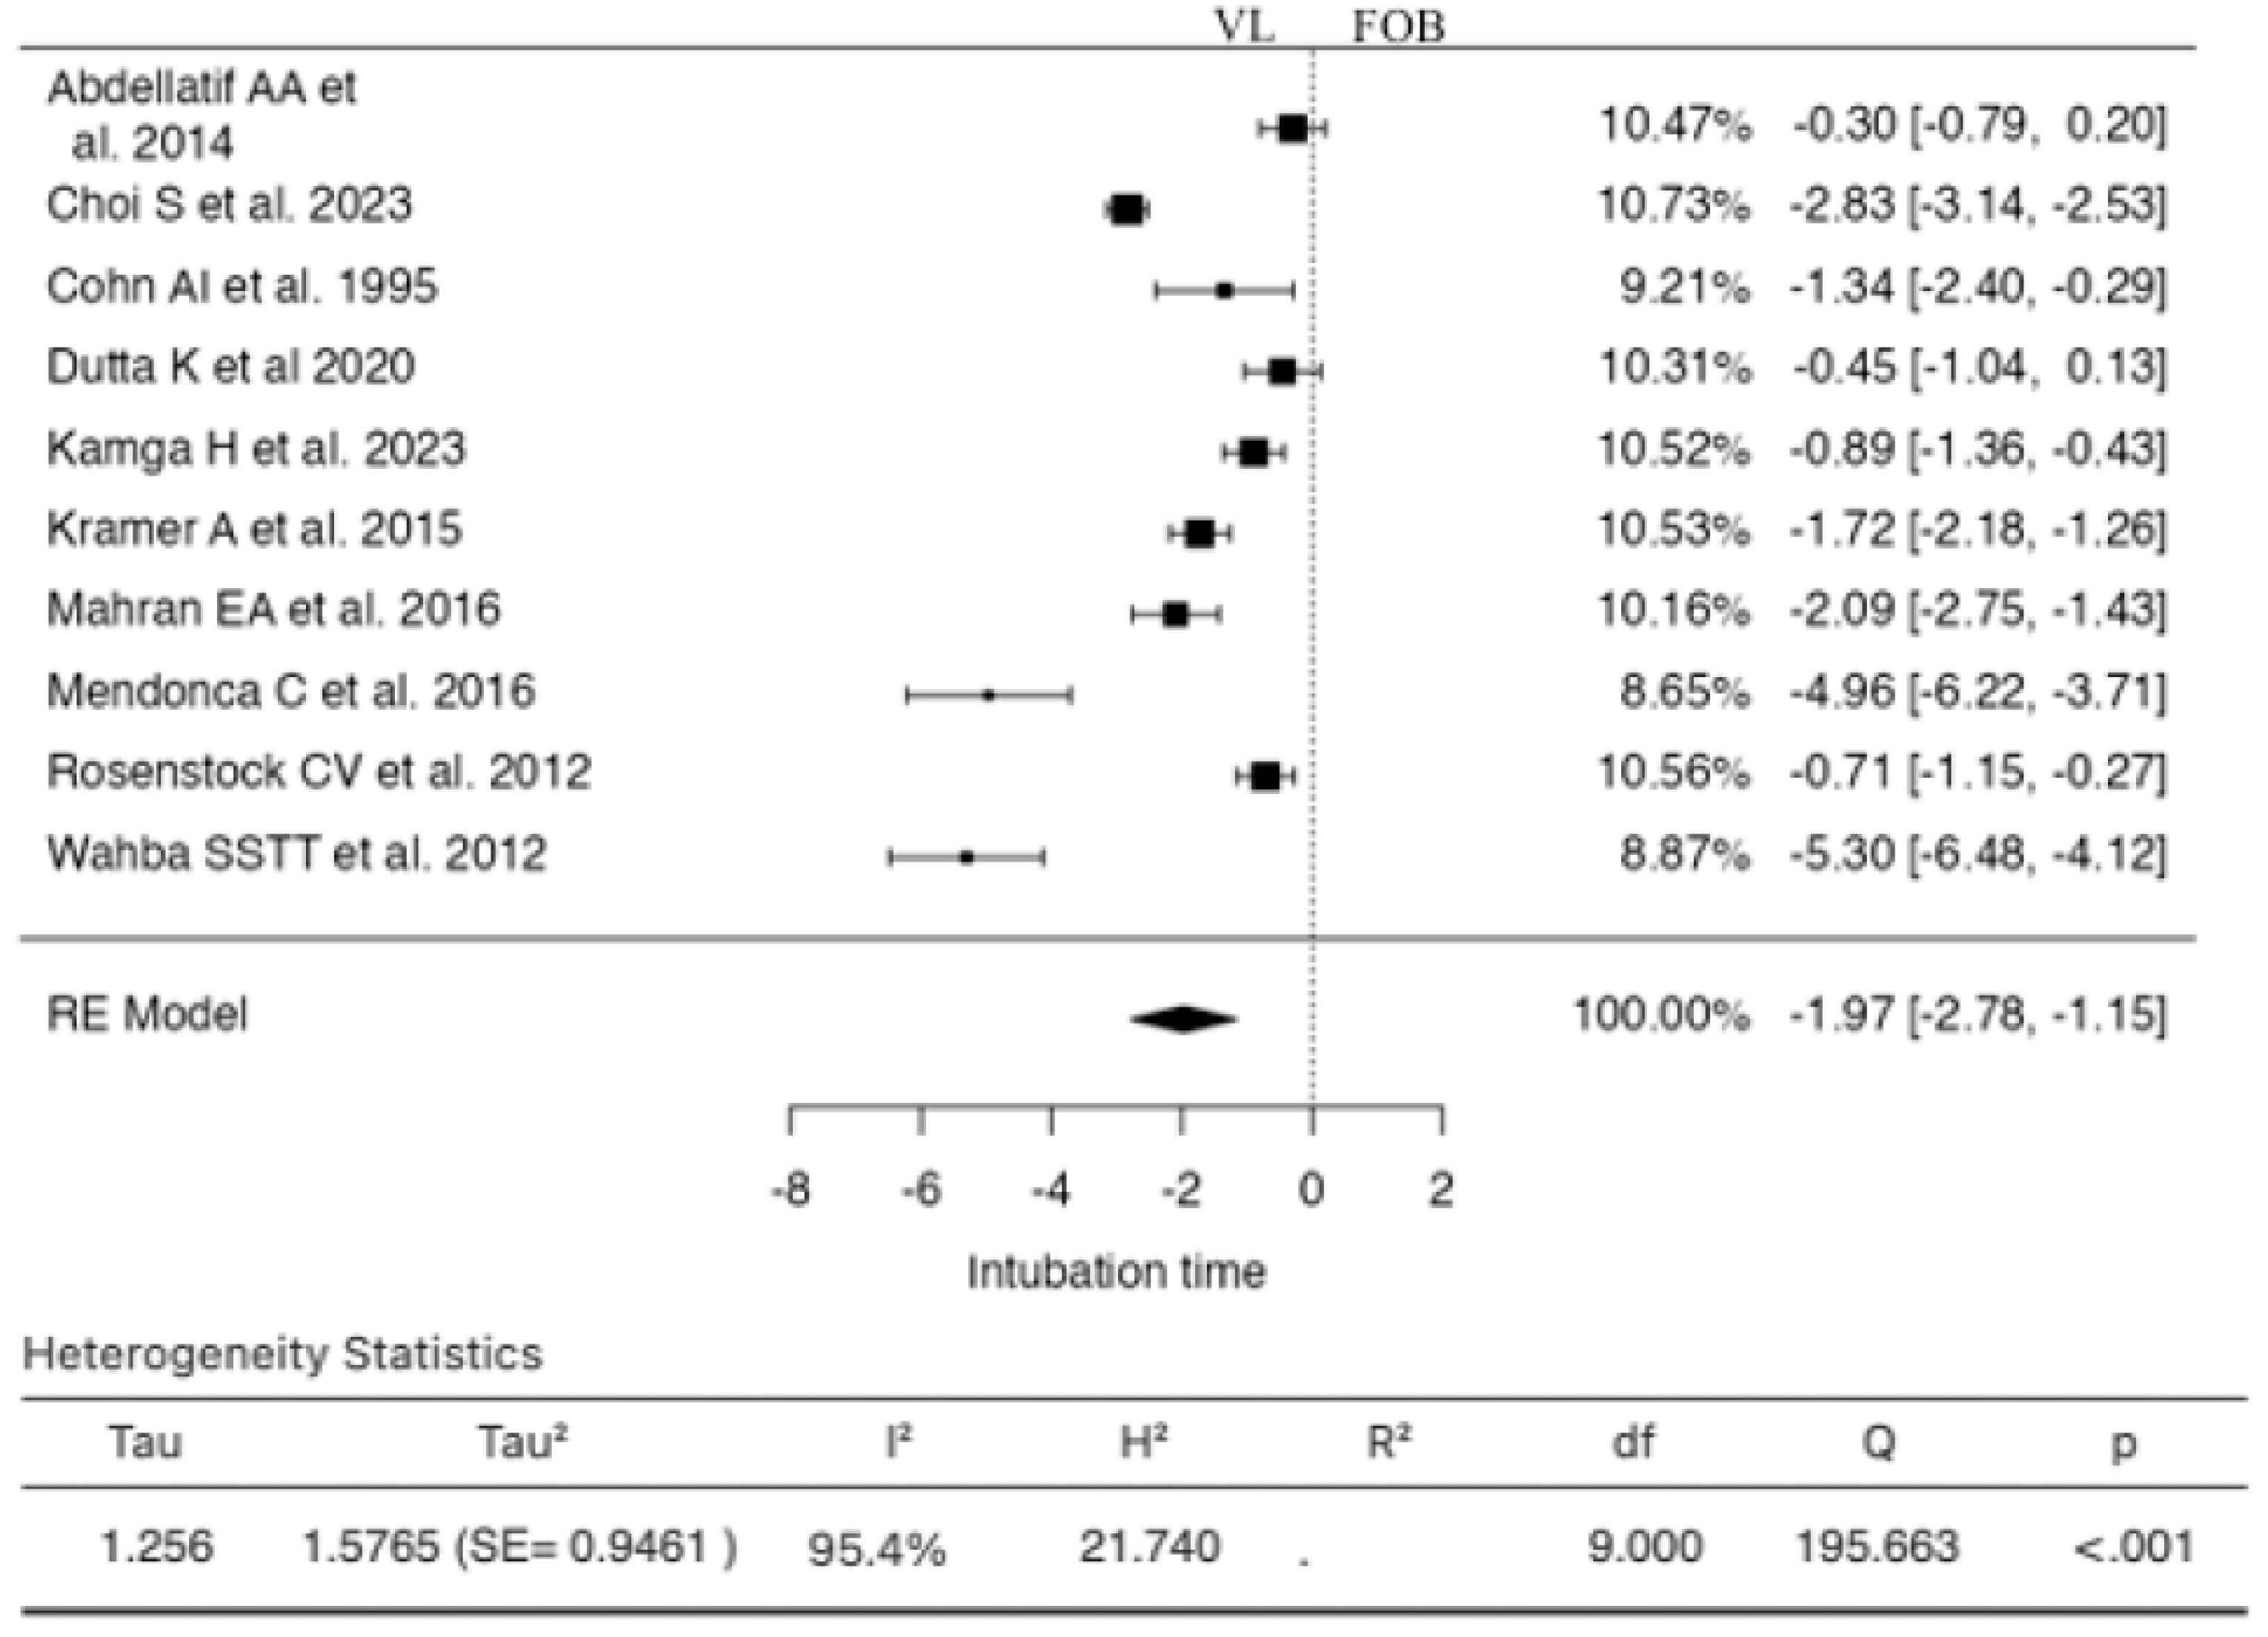
3.1. Duration of Intubation (Time)
3.2. Duration of Intubation (Time) with Glidescope
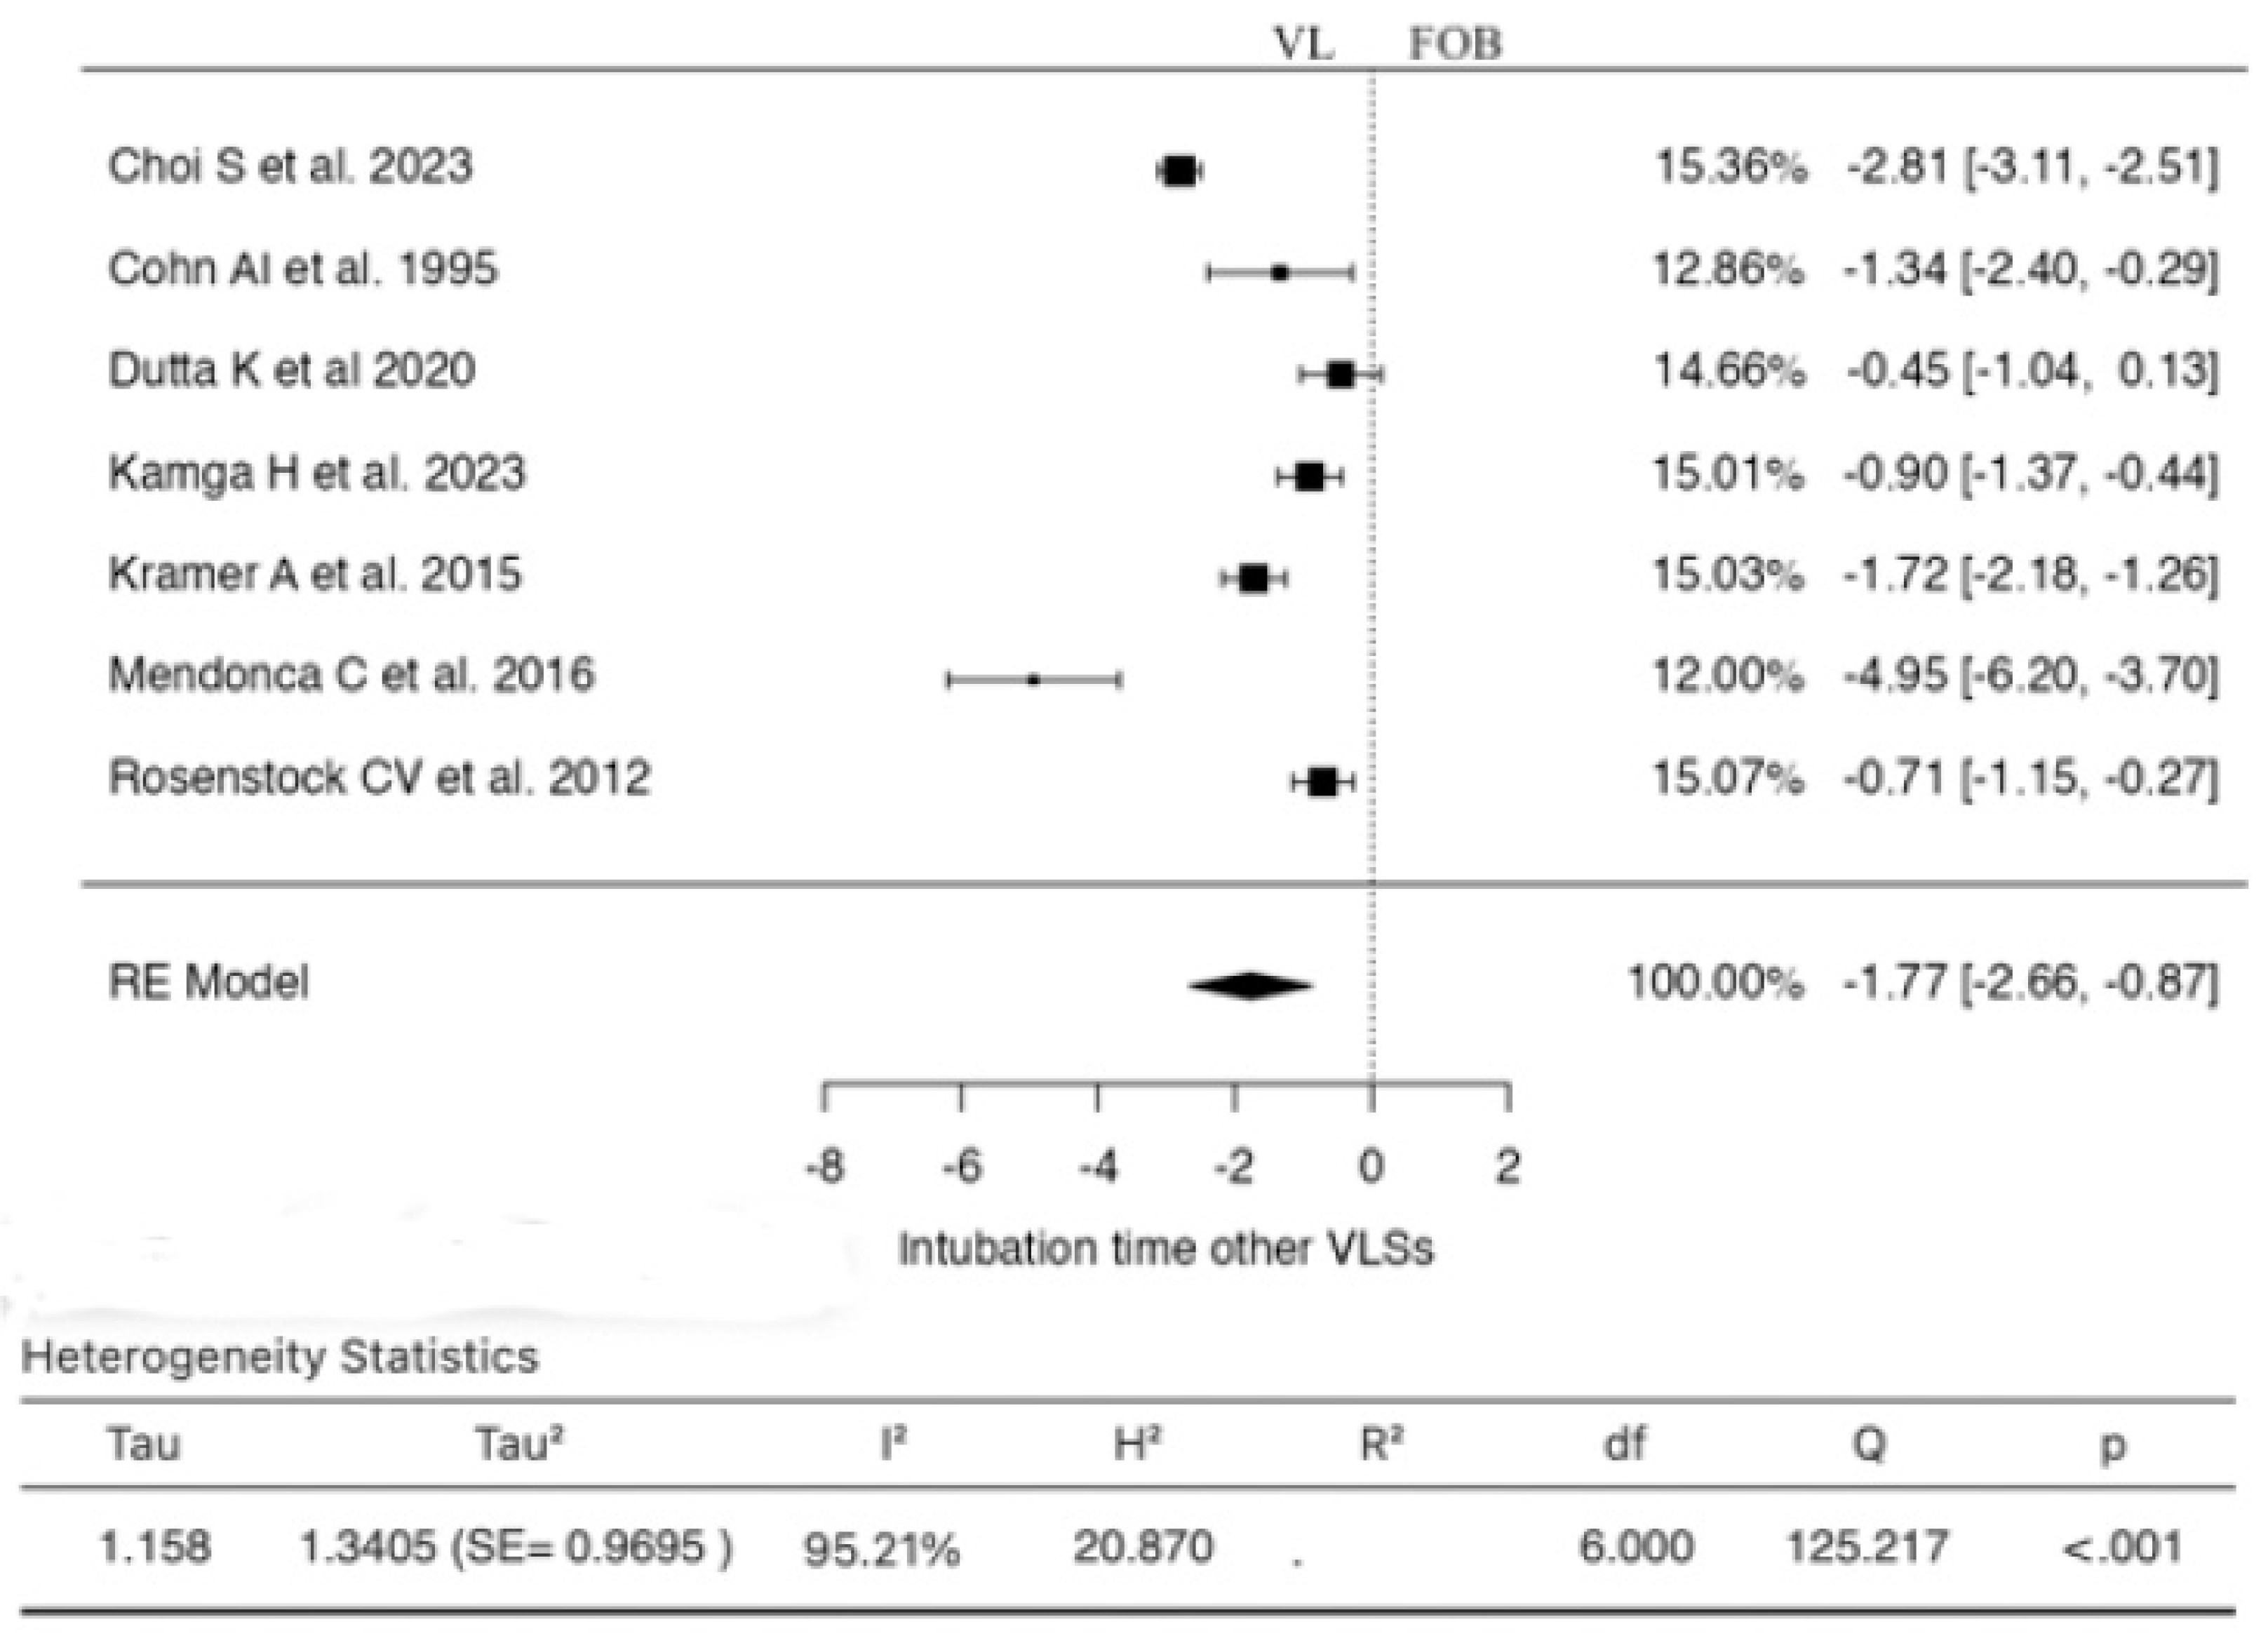
3.3. Duration of Intubation (Time) with Others VLSs
3.4. Failed Intubation
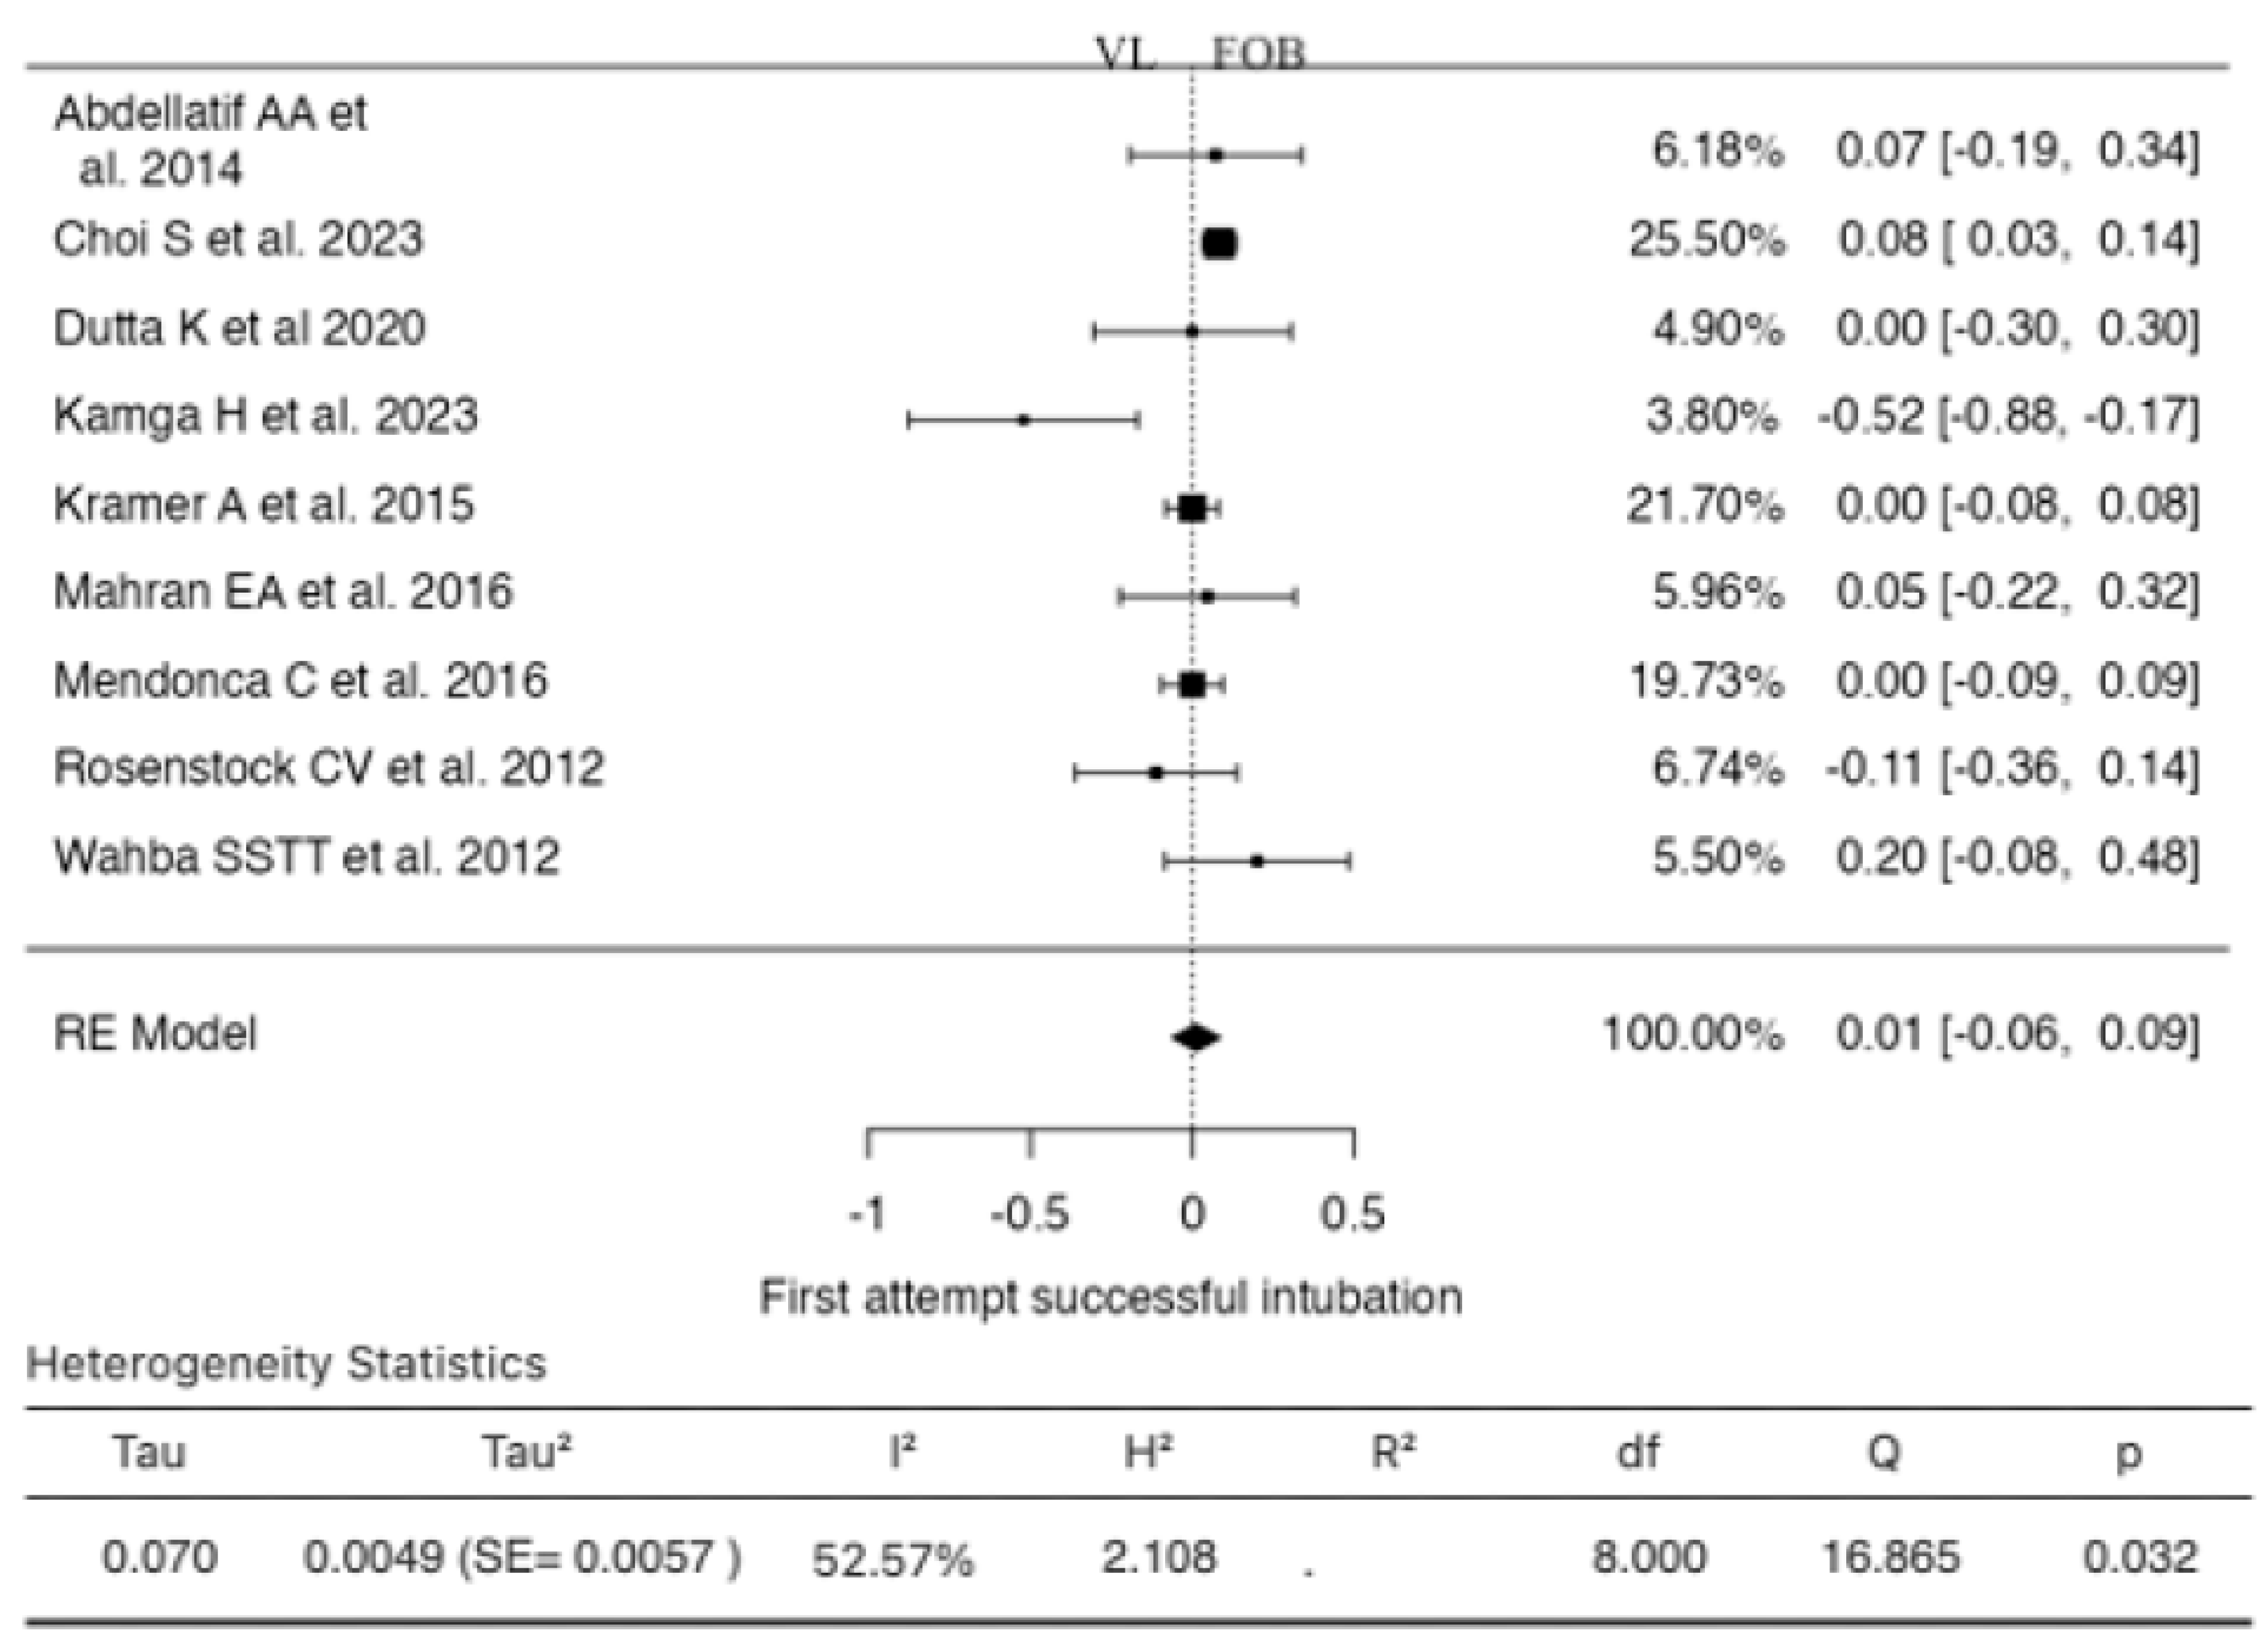
3.5. First Attempt Successful Intubation
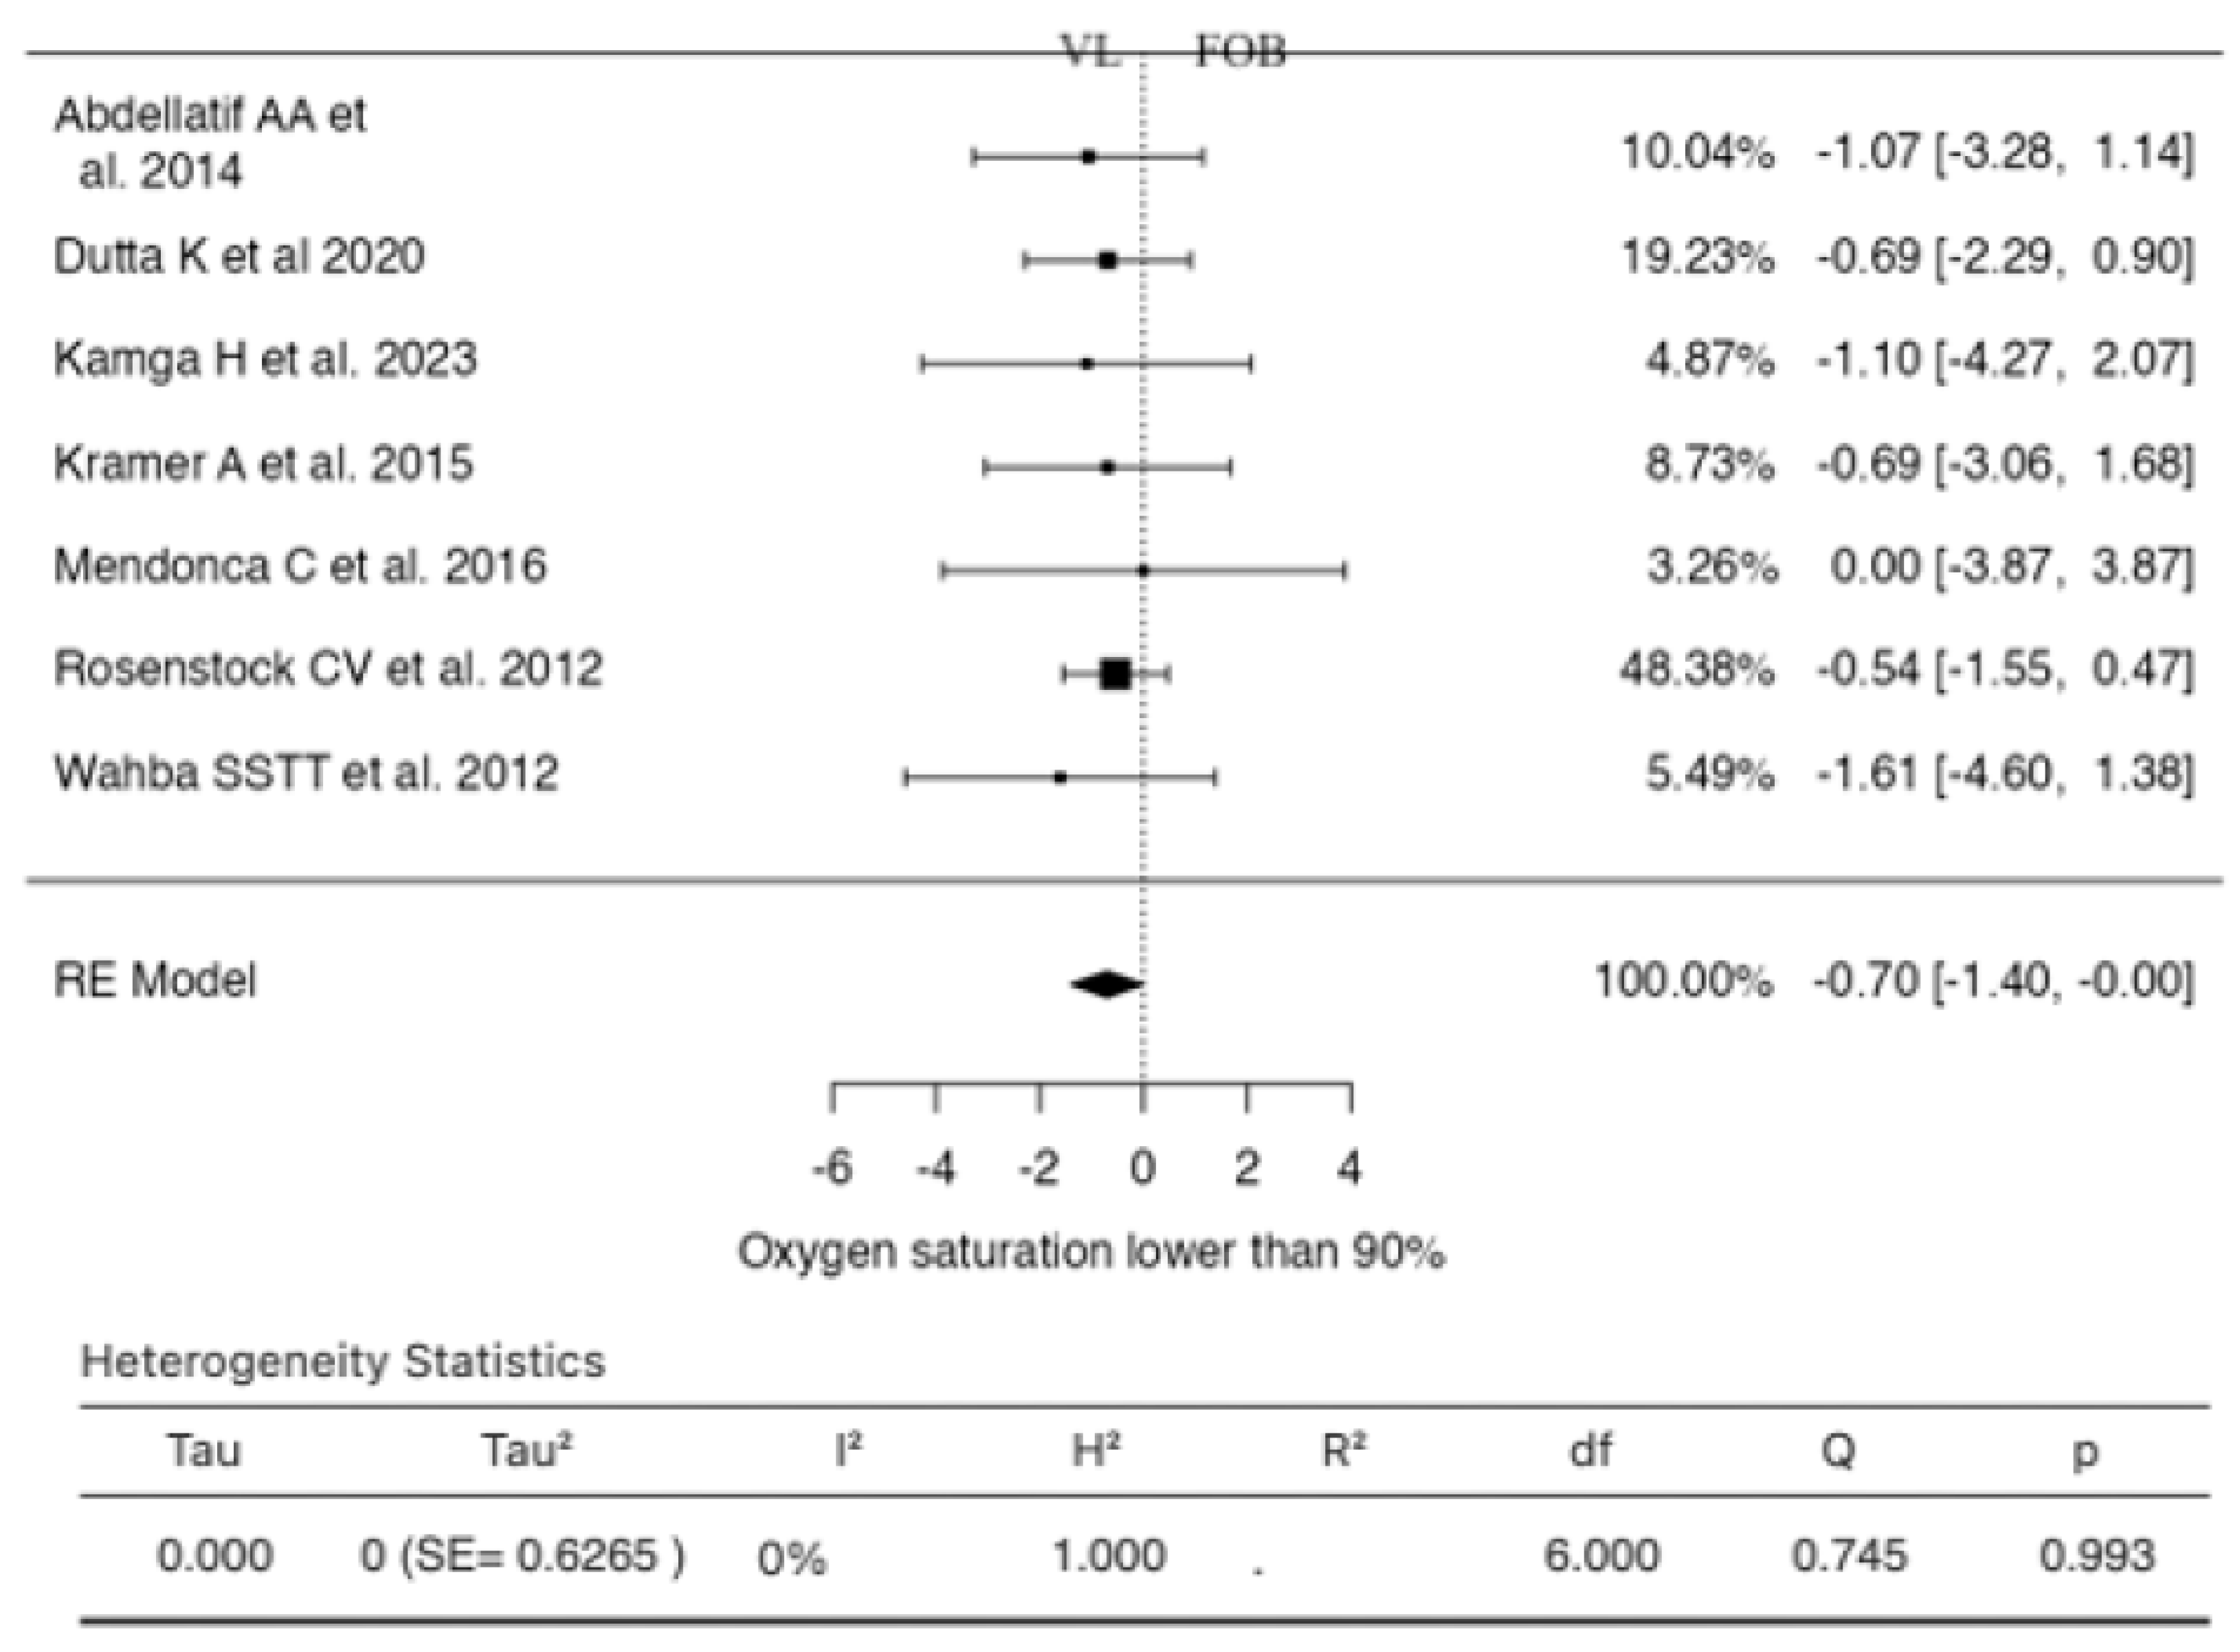
3.6. Oxygen Saturation Lower Than 90%
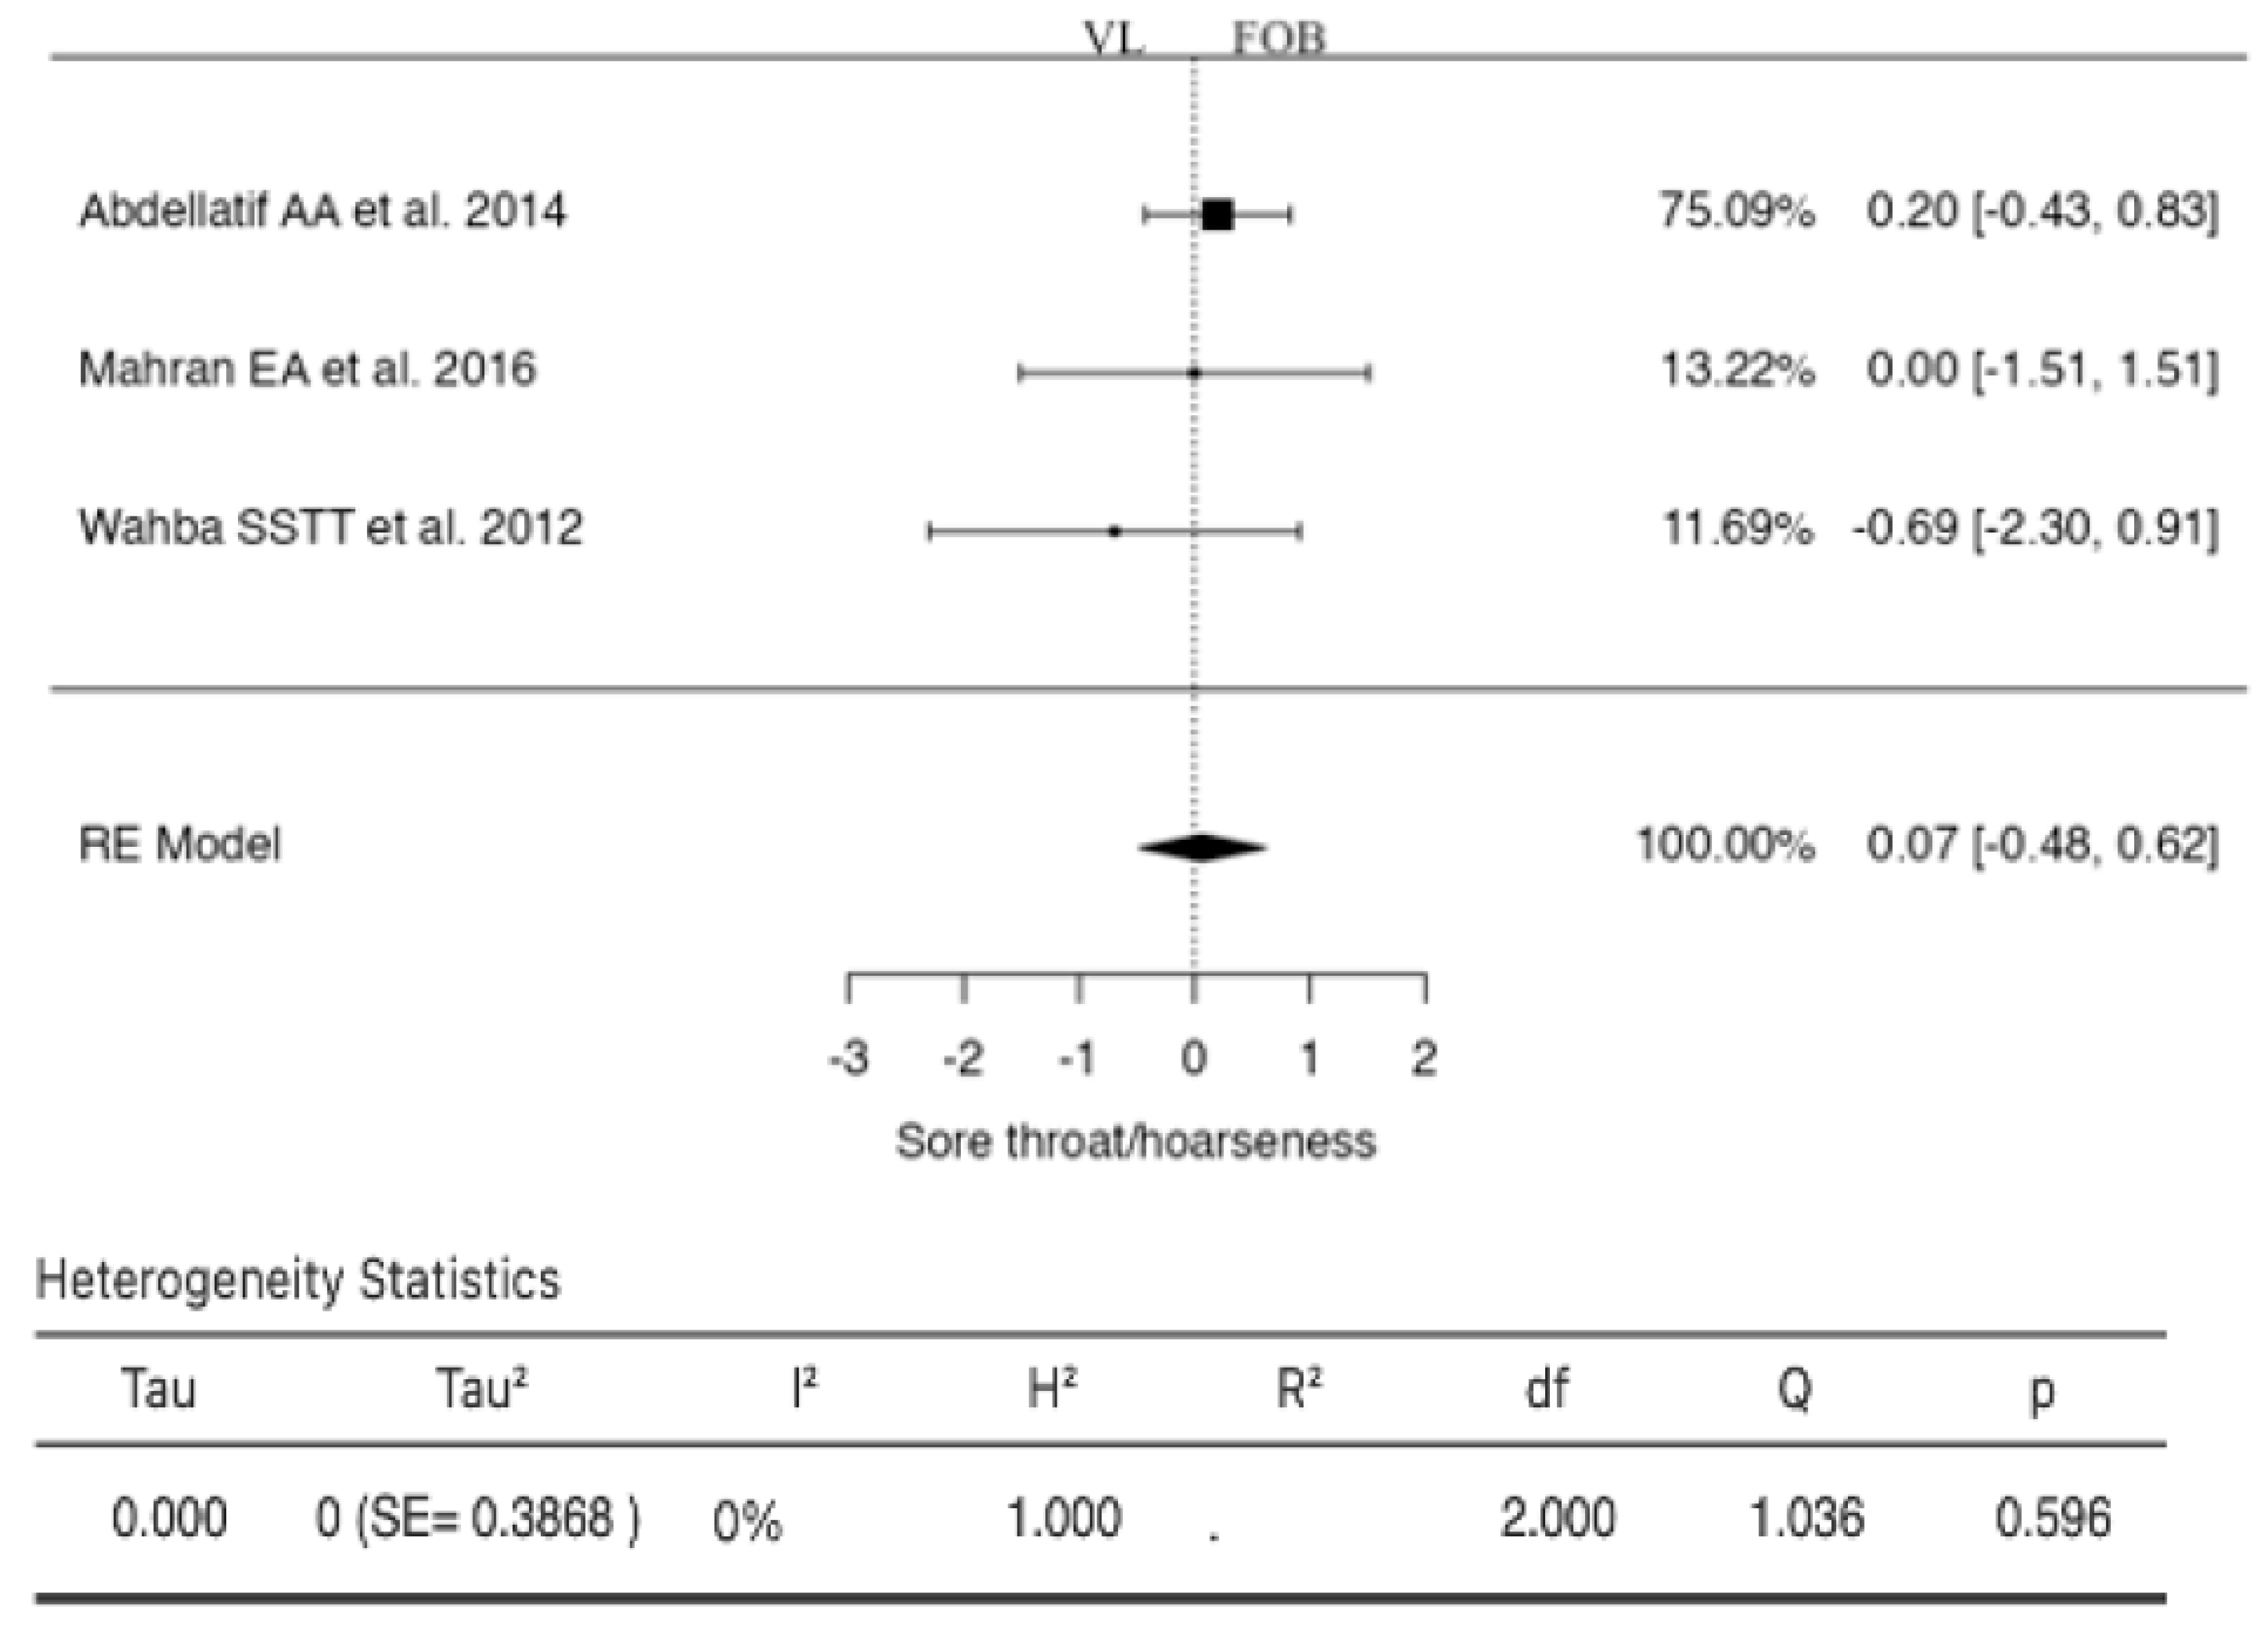
3.7. Sore Throat/Hoarseness
3.8. Patient-Reported Satisfaction
3.9. Sedation with and without Target on Ramsay Score
3.10. Airway Anticipated to Be Normal
3.11. Airway Anticipated to Be Difficult
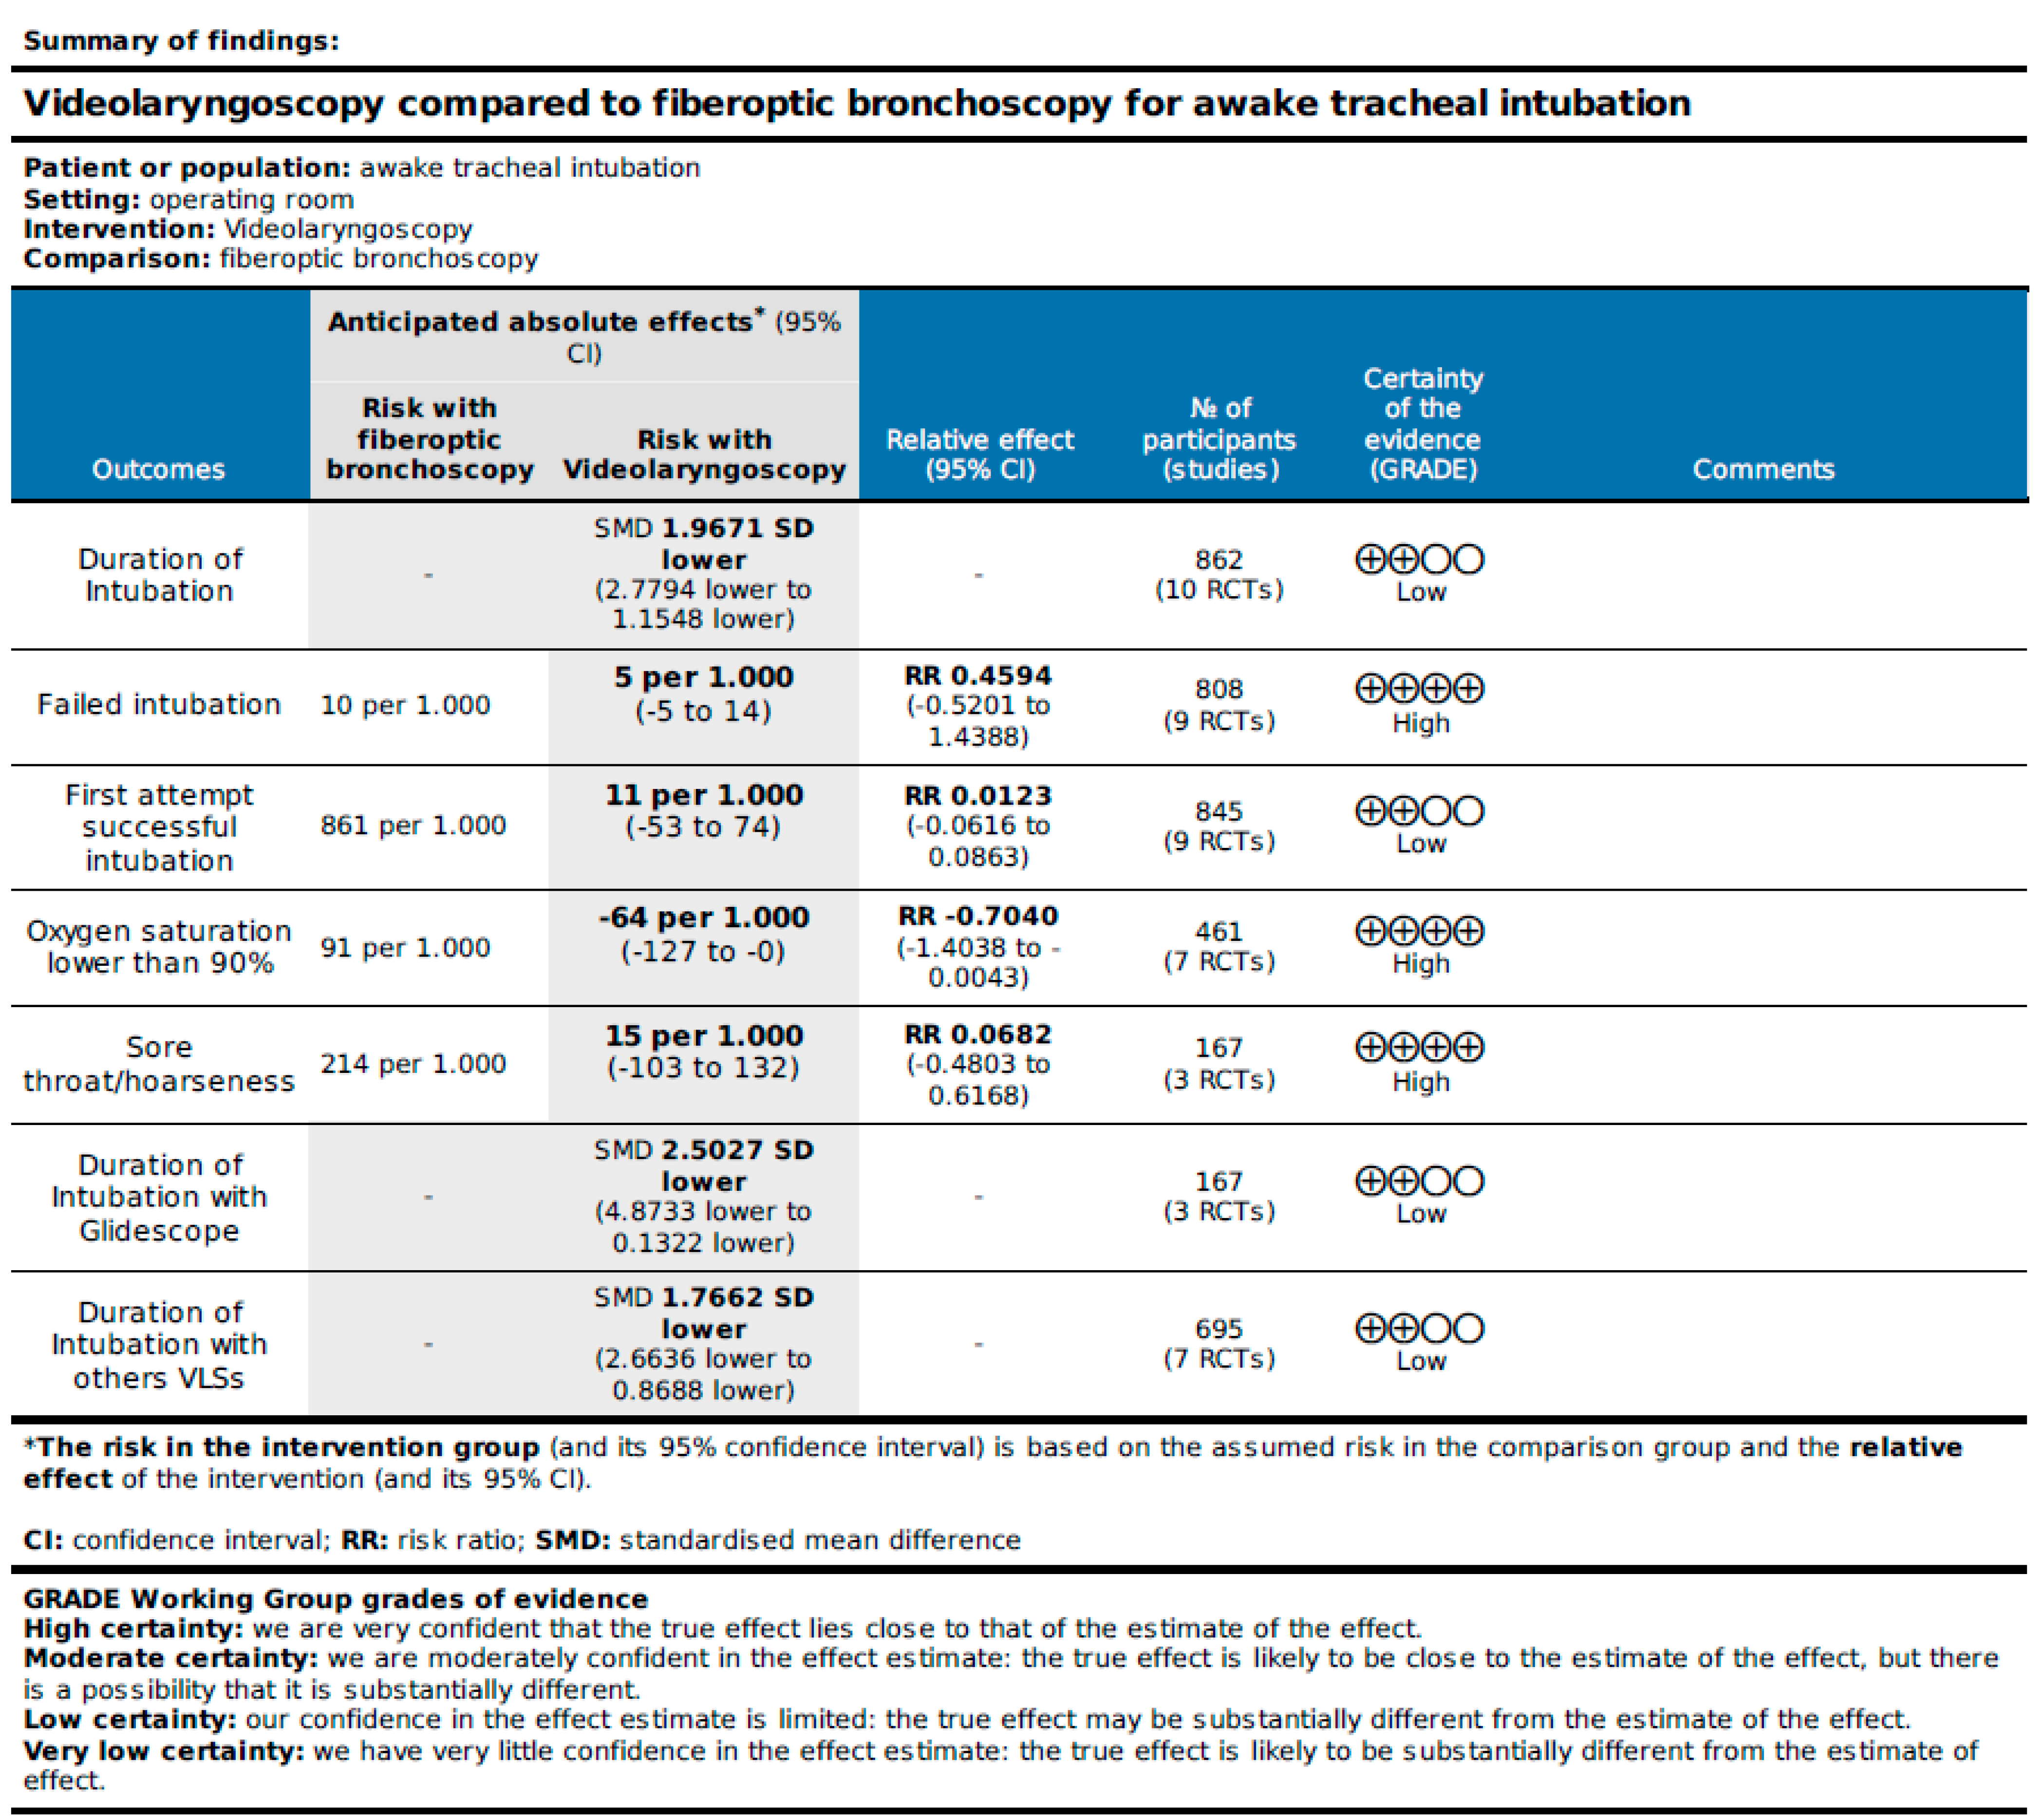
3.12. Certainty of the Evidence Assessment
3.13. Trial Sequential Analysis
4. Discussion
5. Conclusions
Supplementary Materials
Author Contributions
Funding
Institutional Review Board Statement
Informed Consent Statement
Data Availability Statement
Conflicts of Interest
References
- Apfelbaum, J.L.; Hagberg, C.A.; Connis, R.T.; Abdelmalak, B.B.; Agarkar, M.; Dutton, R.P.; Fiadjoe, J.E.; Greif, R.; Klock, P.A.; Mercier, D.; et al. 2022 American Society of Anesthesiologists Practice Guidelines for Management of the Difficult Airway. Anesthesiology 2022, 136, 31–81. [Google Scholar] [CrossRef] [PubMed]
- Ahmad, I.; El-Boghdadly, K.; Bhagrath, R.; Hodzovic, I.; McNarry, A.F.; Mir, F.; O’Sullivan, E.P.; Patel, A.; Stacey, M.; Vaughan, D. Difficult Airway Society guidelines for awake tracheal intubation (ATI) in adults. Anaesthesia 2020, 75, 509–528. [Google Scholar] [CrossRef]
- Law, J.A.; Morris, I.R.; Brousseau, P.A.; de la Ronde, S.; Milne, A.D. The incidence, success rate, and complications of awake tracheal intubation in 1,554 patients over 12 years: An historical cohort study. Can. J. Anaesth. 2015, 62, 736–744. [Google Scholar] [CrossRef]
- Joseph, T.T.; Gal, J.S.; DeMaria, S., Jr.; Lin, H.M.; Levine, A.I.; Hyman, J.B. A Retrospective Study of Success, Failure, and Time Needed to Perform Awake Intubation. Anesthesiology 2016, 125, 105–114. [Google Scholar] [CrossRef] [PubMed]
- El-Boghdadly, K.; Onwochei, D.N.; Cuddihy, J.; Ahmad, I. A prospective cohort study of awake fibreoptic intubation practice at a tertiary centre. Anaesthesia 2017, 72, 694–703. [Google Scholar] [CrossRef] [PubMed]
- Cook, T.M. Strategies for the prevention of airway complications—A narrative review. Anaesthesia 2018, 73, 93–111. [Google Scholar] [CrossRef] [PubMed]
- Fiadjoe, J.E.; Litman, R.S. Difficult tracheal intubation: Looking to the past to determine the future. Anesthesiology 2012, 116, 1181–1182. [Google Scholar] [CrossRef]
- Rose, D.K.; Cohen, M.M. The airway: Problems and predictions in 18,500 patients. Can. J. Anaesth. 1994, 41 Pt 1, 372–383. [Google Scholar] [CrossRef] [PubMed]
- Fitzgerald, E.; Hodzovic, I.; Smith, A.F. ‘From darkness into light’: Time to make awake intubation with videolaryngoscopy the primary technique for an anticipated difficult airway? Anaesthesia 2015, 70, 387–392. [Google Scholar] [CrossRef]
- Heidegger, T.; Gerig, H.J.; Ulrich, B.; Schnider, T.W. Structure and process quality illustrated by fibreoptic intubation: Analysis of 1612 cases. Anaesthesia 2003, 58, 734–739. [Google Scholar] [CrossRef]
- Ho, A.M.; Chung, D.C.; To, E.W.; Karmakar, M.K. Total airway obstruction during local anesthesia in a non-sedated patient with a compromised airway. Can. J. Anaesth. 2004, 51, 838–841. [Google Scholar] [CrossRef]
- Ovassapian, A.; Yelich, S.J.; Dykes, M.H.; Brunner, E.E. Fiberoptic nasotracheal intubation--incidence and causes of failure. Anesth. Analg. 1983, 62, 692–695. [Google Scholar] [CrossRef]
- Ahmad, I.; Bailey, C.R. Time to abandon awake fibreoptic intubation? Anaesthesia 2016, 71, 12–16. [Google Scholar] [CrossRef]
- Vargas, M.; Pastore, A.; Aloj, F.; Laffey, J.G.; Servillo, G. A comparison of videolaryngoscopes for tracheal intubation in predicted difficult airway: A feasibility study. BMC Anesthesiol. 2017, 17, 25. [Google Scholar] [CrossRef]
- Vargas, M.; Servillo, G.; Buonanno, P.; Iacovazzo, C.; Marra, A.; Putensen-Himmer, G.; Ehrentraut, S.; Ball, L.; Patroniti, N.; Pelosi, P.; et al. Video vs. direct laryngoscopy for adult surgical and intensive care unit patients requiring tracheal intubation: A systematic review and meta-analysis of randomized controlled trials. Eur. Rev. Med. Pharmacol. Sci. 2021, 25, 7734–7749. [Google Scholar]
- Merola, R.; Mancino, D.; Vargas, M. Videolaryngoscopy versus direct laryngoscopy: A bibliometric analysis. Br. J. Anaesth. 2024, 132, 166–168. [Google Scholar] [CrossRef]
- Lewis, S.R.; Butler, A.R.; Parker, J.; Cook, T.M.; Smith, A.F. Videolaryngoscopy versus direct laryngoscopy for adult patients requiring tracheal intubation. Cochrane Database Syst. Rev. 2016, 11, CD011136. [Google Scholar]
- Falcetta, S.; Pecora, L.; Orsetti, G.; Gentili, P.; Rossi, A.; Gabbanelli, V.; Adrario, E.; Donati, A.; Pelaia, P. The Bonfils fiberscope: A clinical evaluation of its learning curve and efficacy in difficult airway management. Minerva Anestesiol. 2012, 78, 176–184. [Google Scholar]
- Page, M.J.; McKenzie, J.E.; Bossuyt, P.M.; Boutron, I.; Hoffmann, T.C.; Mulrow, C.D.; Shamseer, L.; Tetzlaff, J.M.; Akl, E.A.; Brennan, S.E.; et al. The PRISMA 2020 statement: An updated guideline for reporting systematic reviews. BMJ 2021, 372, n71. [Google Scholar] [CrossRef]
- Abdellatif, A.A.; Ali, M.A. GlideScope videolaryngoscope versus flexible fiberoptic bronchoscope for awake intubation of morbidly obese patient with predicted difficult intubation. Middle East. J. Anaesthesiol. 2014, 22, 385–392. [Google Scholar]
- Choi, S.; Yoo, H.K.; Shin, K.W.; Kim, Y.J.; Yoon, H.K.; Park, H.P.; Oh, H. Videolaryngoscopy vs. flexible fibrescopy for tracheal intubation in patients with cervical spine immobilisation: A randomised controlled trial. Anaesthesia 2023, 78, 970–978. [Google Scholar] [CrossRef] [PubMed]
- Cohn, A.I.; Zornow, M.H. Awake endotracheal intubation in patients with cervical spine disease: A comparison of the Bullard laryngoscope and the fiberoptic bronchoscope. Anesth. Analg. 1995, 81, 1283–1286. [Google Scholar] [PubMed]
- Dutta, K.; Sriganesh, K.; Chakrabarti, D.; Pruthi, N.; Reddy, M. Cervical Spine Movement During Awake Orotracheal Intubation With Fiberoptic Scope and McGrath Videolaryngoscope in Patients Undergoing Surgery for Cervical Spine Instability: A Randomized Control Trial. J. Neurosurg. Anesthesiol. 2020, 32, 249–255. [Google Scholar] [CrossRef] [PubMed]
- Kamga, H.; Frugier, A.; Boutros, M.; Bourges, J.; Doublet, T.; Parienti, J.J. Flexible nasal bronchoscopy vs. Airtraq® videolaryngoscopy for awake tracheal intubation: A randomised controlled non-inferiority study. Anaesthesia 2023, 78, 963–969. [Google Scholar] [CrossRef] [PubMed]
- Kramer, A.; Müller, D.; Pförtner, R.; Mohr, C.; Groeben, H. Fibreoptic vs videolaryngoscopic (C-MAC(®) D-BLADE) nasal awake intubation under local anaesthesia. Anaesthesia 2015, 70, 400–406. [Google Scholar] [CrossRef] [PubMed]
- Mahran, E.A.; Hassan, M.E. Comparative randomised study of GlideScope® video laryngoscope versus flexible fibre-optic bronchoscope for awake nasal intubation of oropharyngeal cancer patients with anticipated difficult intubation. Indian J. Anaesth. 2016, 60, 936–938. [Google Scholar] [CrossRef] [PubMed]
- Mendonca, C.; Mesbah, A.; Velayudhan, A.; Danha, R. A randomised clinical trial comparing the flexible fibrescope and the Pentax Airway Scope (AWS)(®) for awake oral tracheal intubation. Anaesthesia 2016, 71, 908–914. [Google Scholar] [CrossRef] [PubMed]
- Moore, A.; El-Bahrawy, A.; El-Mouallem, E.; Lattermann, R.; Hatzakorzian, R.; LiPishan, W.; Schricker, T. Videolaryngoscopy or fibreoptic bronchoscopy for awake intubation of bariatric patients with predicted difficult airways—A randomised, controlled trial. Anaesthesia 2017, 72, 538–539. [Google Scholar] [CrossRef] [PubMed]
- Rosenstock, C.V.; Thøgersen, B.; Afshari, A.; Christensen, A.L.; Eriksen, C.; Gätke, M.R. Awake fiberoptic or awake video laryngoscopic tracheal intubation in patients with anticipated difficult airway management: A randomized clinical trial. Anesthesiology 2012, 116, 1210–1216. [Google Scholar] [CrossRef]
- Wahba, S.S.T.T.; Saeed, A.M. Comparative study of awake endotracheal intubation with Glidescope video laryngoscope vs. flexible fiber optic bronchoscope in patients with traumatic cervical spine injury. Egypt. J. Anaesth. 2012, 28, 257–260. [Google Scholar] [CrossRef]
- Alhomary, M.; Ramadan, E.; Curran, E.; Walsh, S.R. Videolaryngoscopy vs. fibreoptic bronchoscopy for awake tracheal intubation: A systematic review and meta-analysis. Anaesthesia 2018, 73, 1151–1161. [Google Scholar] [CrossRef] [PubMed]
- Jiang, J.; Ma, D.X.; Li, B.; Wu, A.S.; Xue, F.S. Videolaryngoscopy versus fiberoptic bronchoscope for awake intubation—A systematic review and meta-analysis of randomized controlled trials. Ther. Clin. Risk Manag. 2018, 14, 1955–1963. [Google Scholar] [CrossRef] [PubMed]


| Study | Type of VLS Device | Sample Size | Type of Surgery | Inclusion Criteria | Exclusion Criteria | Experience of Operator | Sedation | Intubation |
|---|---|---|---|---|---|---|---|---|
| Abdellatif AA et al., 2014 [20] | Glidescope | VL: 31 FOB: 32 | Laparoscopic bariatric | BMI ≥ 40, EGRI ≥ 4 | Age < 18 or >60, ASA class ≥ 4, severe mental illness, mouth opening < 15 mm, poor dentition, controindications to drugs used during procedure, patient refusal | Two anaesthetists with experience of more than 100 successful tracheal intubations using both devices | Premedication with glycopyrrolate; topical anaesthesia with lidocaine; remifentanil TCI (target Ramsay score of 3) | Oral |
| Choi S et al., 2023 [21] | AceScope | VL: 166 FOB: 164 | Elective cervical spine surgery | Patients aged 20–80 years scheduled for elective cervical spine surgery under general anaesthesia | Upper airway lesion (tumour; polyp; trauma; abscess; inflammation; or foreign body), history of upper airway surgery or radiotherapy, high risk of pulmonary aspiration, coagulopathy, or ASA class > 3 | Five consultant anaesthetists with a collective history of more than 30 successful tracheal intubations using both devices | Propofol TCI | Oral |
| Cohn AI et al., 1995 [22] | Bullard | VL: 8 FOB: 9 | Cervical spine | Adults, ASA class I–III, scheduled for neurosurgical correction of a cervical spine problem | Not declared | Senior trainees or consultant anaesthetists with experience in at least 10 successful tracheal intubations using both devices | Fentanyl, midazolam, and droperidol; topical anaesthesia with lidocaine | Oral |
| Dutta K et al., 2020 [23] | McGrath | VL: 23 FOB: 23 | Elective cervical spine surgery | Patients aged 18–65 years and ASA class I–II. | Oropharyngeal pathology, mouth opening < 2.5 cm, emergency surgery, pregnancy, or refusal of consent | One anesthesiologist who has adequate experience in performing intubations with both these techniques (>25 intubations) | Premedication with glycopyrrolate; fentanyl; lidocaine for bilateral superior laryngeal block and trans-tracheal administration; the oropharynx was anesthetized with lidocaine spray | Oral |
| Kamga H et al., 2023 [24] | Airtraq | VL: 39 FOB: 39 | Elective | Age ≥ 18, required awake tracheal intubation | Mouth opening < 16 mm, surgery involved the mouth or nose | Expert consultant anaesthetists with experience in at least 10 flexible bronchoscopy awake tracheal intubations without supervision or trainees under the supervision of an expert consultant | Remifentanil TCI (Ramsay score of 2); local anaesthesia with licocaine of the upper airway was performed with a combination of topical airway anaesthesia, superior laryngeal nerve blockade, and a tracheal block | Oral |
| Kramer A et al., 2015 [25] | C-MAC D-BLADE | VL: 50 FOB: 50 | Oral and maxillofacial | Age > 18, mouth opening > 13 mm, with at least one criterion for an anticipated difficult intubation (a modified Mallampati score of 4; an inter-incisor distance < 2.5 cm; a documented history of a difficult intubation; or an obstacle for a standard intubation like tumour or swelling). | Dental abscesses, ASA class ≥ 4 | Nine anaesthetists with at least 1 year of experience in oral and maxillofacial anaesthesia and experience of successful tracheal intubations using C-MAC and FOB > 20 and 50 times, respectively | Midazolam and remifentanil; topical anaesthesia with lidocaine | Nasal |
| Mahran EA et al., 2016 [26] | Glidescope | VL: 27 FOB: 27 | Oropharyngeal cancer | Age ≥ 20 or ≤60, ASA class I–II, Mallampati Score II–III | Patient refusal, restricted mouth opening, bleeding tendency, or any contraindication to nasal intubation | Two anaesthetists experienced with both devices | Premedication with glycopyrrolate; phenylephrine nasal drops; remifentanil infusion (Ramsay score of 3); topical anaesthesia with lidocaine | Nasal |
| Mendonca C et al., 2016 [27] | Pentax AWS | VL: 20 FOB: 20 | Elective | Adults, high Mallampati score, limited neck extension, limited jaw protrusion, requirement to maintain the cervical spine in the neutral position during intubation | Required nasal intubation, age < 18, pregnancy, mouth opening < 25 mm | Consultant anaesthetist experienced in head and neck surgery and with experience of successful tracheal intubations using Pentax AWS and FOB > 30 and 100 times, respectively | Premedication with glycopyrrolate; midazolam and remifentanil infusion (Ramsay score of 2–3); topical anaesthesia with lidocaine | Oral |
| Moore A et al., 2017 [28] | Glidescope | VL: 5 FOB: 6 | Bariatric | SARI ≥ 4 | Not declared | Four anaesthetists with experience of more than 40 successful tracheal intubations using both devices | Premedication with glycopyrrolate; midazolam and remifentanil infusion; topical anaesthesia with lidocaine | Oral |
| Rosenstock CV et al., 2012 [29] | McGrath | VL: 41 FOB: 43 | Gynecologic, abdominal, urologic, ENT | Adults, ASA class I–III, anticipated difficult laryngoscopy or intubation, SARI ≥ 4 | Age ≤ 18, ASA class IV–V, mouth opening < 15 mm, poor dentaition, surgeon request of nasal intubation, contraindication for transtracheal injection | Six anaesthetists experienced in difficult airway management and both airway devices | Premedication with glycopyrrolate; remifentanil infusion and a bolus of remifentanil or propofol (Ramsay score of 2–4); topical anaesthesia with lidocaine; trans-tracheal injection | Oral |
| Wahba SSTT et al., 2012 [30] | Glidescope | VL: 25 FOB: 25 | Cervical spine | Adults, ASA class I–III | BMI ≥ 35, obstructive airway disease, cardiovascular disease, apparent difficult airway, patient refusal | Consultant anaesthetist with experience of more than 100 successful tracheal intubations using both devices | Premedication with glycopyrrolate; midazolam and remifentanil infusion; topical anaesthesia with lidocaine | Oral |
| Study ID | D1 | D2 | D3 | D4 | D5 | Overall |
|---|---|---|---|---|---|---|
| Abdellatif AA et al., 2014 [20] | - | + | + | + | - | - |
| Choi S et al., 2023 [21] | + | + | + | + | + | + |
| Dutta K et al., 2020 [23] | + | + | + | + | + | + |
| Kamga H et al., 2023 [24] | + | + | + | + | + | + |
| Kramer A et al., 2015 [25] | + | + | + | + | - | + |
| Mahran EA et al., 2016 [26] | + | + | + | + | - | + |
| Mendonca C et al., 2016 [27] | - | + | + | + | + | + |
| Rosenstock CV et al., 2012 [29] | + | + | + | + | - | + |
| Wahba SSTT et al., 2012 [30] | - | - | + | + | - | - |
Disclaimer/Publisher’s Note: The statements, opinions and data contained in all publications are solely those of the individual author(s) and contributor(s) and not of MDPI and/or the editor(s). MDPI and/or the editor(s) disclaim responsibility for any injury to people or property resulting from any ideas, methods, instructions or products referred to in the content. |
© 2024 by the authors. Licensee MDPI, Basel, Switzerland. This article is an open access article distributed under the terms and conditions of the Creative Commons Attribution (CC BY) license (https://creativecommons.org/licenses/by/4.0/).
Share and Cite
Merola, R.; Vargas, M.; Marra, A.; Buonanno, P.; Coviello, A.; Servillo, G.; Iacovazzo, C. Videolaryngoscopy versus Fiberoptic Bronchoscopy for Awake Tracheal Intubation: A Systematic Review and Meta-Analysis of Randomized Controlled Trials. J. Clin. Med. 2024, 13, 3186. https://doi.org/10.3390/jcm13113186
Merola R, Vargas M, Marra A, Buonanno P, Coviello A, Servillo G, Iacovazzo C. Videolaryngoscopy versus Fiberoptic Bronchoscopy for Awake Tracheal Intubation: A Systematic Review and Meta-Analysis of Randomized Controlled Trials. Journal of Clinical Medicine. 2024; 13(11):3186. https://doi.org/10.3390/jcm13113186
Chicago/Turabian StyleMerola, Raffaele, Maria Vargas, Annachiara Marra, Pasquale Buonanno, Antonio Coviello, Giuseppe Servillo, and Carmine Iacovazzo. 2024. "Videolaryngoscopy versus Fiberoptic Bronchoscopy for Awake Tracheal Intubation: A Systematic Review and Meta-Analysis of Randomized Controlled Trials" Journal of Clinical Medicine 13, no. 11: 3186. https://doi.org/10.3390/jcm13113186
APA StyleMerola, R., Vargas, M., Marra, A., Buonanno, P., Coviello, A., Servillo, G., & Iacovazzo, C. (2024). Videolaryngoscopy versus Fiberoptic Bronchoscopy for Awake Tracheal Intubation: A Systematic Review and Meta-Analysis of Randomized Controlled Trials. Journal of Clinical Medicine, 13(11), 3186. https://doi.org/10.3390/jcm13113186