
Retrospective Evaluation of Cryopreserved Human Umbilical Cord Tissue Allografts in the Supplementation of Cartilage Defects Associated with Hip Osteoarthritis

 ,
,
Abstract
:1. Introduction
2. Materials and Methods
2.1. Study Design
2.2. Study Population
2.3. Allograft Application
2.4. Questionnaire Composition
2.5. Statistical Analysis
3. Results
4. Discussion
5. Conclusions
Author Contributions
Funding
Institutional Review Board Statement
Informed Consent Statement
Data Availability Statement
Acknowledgments
Conflicts of Interest
References
- Lespasio, M.J.; Sultan, A.A.; Piuzzi, N.S.; Khlopas, A.; Husni, M.E.; Muschler, G.F.; Mont, M.A. Hip Osteoarthritis: A Primer. Perm. J. 2018, 22, 17–84. [Google Scholar] [CrossRef] [PubMed]
- Hutton, C.W. Osteoarthritis: The cause not result of joint failure? Ann. Rheum. Dis. 1989, 48, 958–961. [Google Scholar] [CrossRef] [PubMed]
- Murphy, N.J.; Eyles, J.P.; Hunter, D.J. Hip Osteoarthritis: Etiopathogenesis and Implications for Management. Adv. Ther. 2016, 33, 1921–1946. [Google Scholar] [CrossRef] [PubMed]
- Prieto-Alhambra, D.; Judge, A.; Javaid, M.K.; Cooper, C.; Diez-Perez, A.; Arden, N.K. Incidence and risk factors for clinically diagnosed knee, hip and hand osteoarthritis: Influences of age, gender and osteoarthritis affecting other joints. Ann. Rheum. Dis. 2014, 73, 1659–1664. [Google Scholar] [CrossRef] [PubMed]
- Bennell, K. Physiotherapy management of hip osteoarthritis. J. Physiother. 2013, 59, 145–157. [Google Scholar] [CrossRef] [PubMed]
- Kolasinski, S.L.; Neogi, T.; Hochberg, M.C.; Oatis, C.; Guyatt, G.; Block, J.; Callahan, L.; Copenhaver, C.; Dodge, C.; Felson, D.; et al. 2019 American College of Rheumatology/Arthritis Foundation Guideline for the Management of Osteoarthritis of the Hand, Hip, and Knee. Arthritis Care Res. 2020, 72, 149–162. [Google Scholar] [CrossRef] [PubMed]
- Hochberg, M.C.; Altman, R.D.; April, K.T.; Benkhalti, M.; Guyatt, G.; McGowan, J.; Towheed, T.; Welch, V.; Wells, G.; Tugwell, P. American College of Rheumatology 2012 recommendations for the use of nonpharmacologic and pharmacologic therapies in osteoarthritis of the hand, hip, and knee. Arthritis Care Res. 2012, 64, 465–474. [Google Scholar] [CrossRef]
- Rampal, S.; Jaiman, A.; Tokgöz, M.A.; Arumugam, G.; Sivananthan, S.; Singh, R.S.J.; Zazali, S.B.; Mohaddes, M. A review of the efficacy of intraarticular hip injection for patients with hip osteoarthritis: To inject or not to inject in hip osteoarthritis? Jt. Dis. Relat. Surg. 2022, 33, 255–262. [Google Scholar] [CrossRef] [PubMed]
- Katz, J.N.; Arant, K.R.; Loeser, R.F. Diagnosis and Treatment of Hip and Knee Osteoarthritis: A Review. JAMA 2021, 325, 568–578. [Google Scholar] [CrossRef]
- Slavkovic, N.; Vukasinovic, Z.; Bascarevic, Z.; Vukomanovic, B. Total hip arthroplasty. Srp. Arh. Celok. Lek. 2012, 140, 379–384. [Google Scholar] [CrossRef]
- Memtsoudis, S.G.; Besculides, M.C.; Gaber, L.; Liu, S.; Della Valle, A.G. Risk factors for pulmonary embolism after hip and knee arthroplasty: A population-based study. Int. Orthop. 2009, 33, 1739–1745. [Google Scholar] [CrossRef]
- Santana, D.C.; Emara, A.K.; Orr, M.N.; Klika, A.K.; Higuera, C.A.; Krebs, V.E.; Molloy, R.M.; Piuzzi, N.S. An Update on Venous Thromboembolism Rates and Prophylaxis in Hip and Knee Arthroplasty in 2020. Medicina 2020, 56, 416. [Google Scholar] [CrossRef] [PubMed]
- Robinson, J.C.; Pozen, A.; Tseng, S.; Bozic, K.J. Variability in costs associated with total hip and knee replacement implants. J. Bone Jt. Surg. 2012, 94, 1693–1698. [Google Scholar] [CrossRef]
- Vissers, M.M.; Bussmann, J.B.; Verhaar, J.A.; Arends, L.R.; Furlan, A.D.; Reijman, M. Recovery of Physical Functioning After Total Hip Arthroplasty: Systematic Review and Meta-Analysis of the Literature. Phys. Ther. 2011, 91, 615–629. [Google Scholar] [CrossRef]
- Gupta, A.; El-Amin, S.F.; Levy, H.J.; Sze-Tu, R.; Ibim, S.E.; Maffulli, N. Umbilical cord-derived Wharton’s jelly for regenerative medicine applications. J. Orthop. Surg. Res. 2020, 15, 49. [Google Scholar] [CrossRef]
- Sobolewski, K.; Bańkowski, E.; Chyczewski, L.; Jaworski, S. Collagen and Glycosaminoglycans of Wharton’s Jelly. Neonatology 1997, 71, 11–21. [Google Scholar] [CrossRef] [PubMed]
- Davis, J.M.; Sheinkop, M.B.; Barrett, T.C. Evaluation of the Efficacy of Cryopreserved Human Umbilical Cord Tissue Allografts to Augment Functional and Pain Outcome Measures in Patients with Knee Osteoarthritis: An Observational Data Collection Study. Physiologia 2022, 2, 109–120. [Google Scholar] [CrossRef]
- Lai, A.; Tamea, C.; Shou, J.; Okafor, A.; Sparks, J.; Dodd, R.; Woods, C.; Lambert, N.; Schulte, O.; Barrett, T. Safety and Efficacy of Wharton’s Jelly Connective Tissue Allograft for Rotator Cuff Tears: Findings from a Retrospective Observational Study. Biomedicines 2024, 12, 710. [Google Scholar] [CrossRef] [PubMed]
- Lai, A.; Shou, J.; Traina, S.A.; Barrett, T. The Durability and Efficacy of Cryopreserved Human Umbilical Cord Tissue Allograft for the Supplementation of Cartilage Defects Associated with the Sacroiliac Joint: A Case Series. Reports 2023, 6, 12. [Google Scholar] [CrossRef]
- Hmamouchi, I.; Allali, F.; Tahiri, L.; Khazzani, H.; El Mansouri, L.; Alla, S.A.O.; Abouqal, R.; Hajjaj-Hassouni, N. Clinically important improvement in the WOMAC and predictor factors for response to non-specific non-steroidal anti-inflammatory drugs in osteoarthritic patients: A prospective study. BMC Res. Notes 2012, 5, 58. [Google Scholar] [CrossRef]
- Rossato, M.S.; Brilli, E.; Ferri, N.; Giordano, G.; Tarantino, G. Observational study on the benefit of a nutritional supplement, supporting immune functionality and energy metabolism, on chronic fatigue associated with the SARS-CoV-2 post-infection progress. Clin. Nutr. ESPEN 2021, 46, 510–518. [Google Scholar] [CrossRef]
- Nanda, A.; Mohapatra, B.B.; Mahapatra, A.P.K. Multiple comparison test by Tukey’s honestly significant difference (HSD): Do the confident level control type I error. Int. J. Stat. Appl. Math. 2021, 6, 59–65. [Google Scholar] [CrossRef]
- Gad, S.C. 3.13-Statistical Methods in Toxicology. In Comprehensive Toxicology, 2nd ed.; McQueen, C.A., Ed.; Elsevier: Amsterdam, The Netherlands, 2010; pp. 183–197. ISBN 9780080468846. [Google Scholar] [CrossRef]
- Kvam, A.K.; Wisløff, F.; Fayers, P.M. Minimal important differences and response shift in health-related quality of life; a longitudinal study in patients with multiple myeloma. Health Qual. Life Outcomes 2010, 8, 79. [Google Scholar] [CrossRef]
- Boffa, A.; Andriolo, L.; Franceschini, M.; Di Martino, A.; Asunis, E.; Grassi, A.; Zaffagnini, S.; Filardo, G. Minimal clinically important difference and patient acceptable symptom state in patients with knee osteoarthritis treated with PRP injection. Orthop. J. Sports Med. 2021, 9, 23259671211026242. [Google Scholar] [CrossRef]
- Chesworth, B.M.; Mahomed, N.N.; Bourne, R.B.; Davis, A.M. Willingness to go through surgery again validated the WOMAC clinically important difference from THR/TKR surgery. J. Clin. Epidemiol. 2008, 61, 907–918. [Google Scholar] [CrossRef] [PubMed]
- Maredupaka, S.; Meshram, P.; Chatte, M.; Kim, W.H.; Kim, T.K. Minimal clinically important difference of commonly used patient-reported outcome measures in total knee arthroplasty: Review of terminologies, methods and proposed values. Knee Surg. Relat. Res. 2020, 32, 1–12. [Google Scholar] [CrossRef] [PubMed]
- Bańkowski, E.; Sobolewski, K.; Romanowicz, L.; Chyczewski, L.; Jaworski, S. Collagen and glycosaminoglycans of Wharton’s jelly and their alterations in EPH-gestosis. Eur. J. Obstet. Gynecol. Reprod. Biol. 1996, 66, 109–117. [Google Scholar] [CrossRef]
- Gogiel, T.; Bańkowski, E.; Jaworski, S. Proteoglycans of Wharton’s jelly. Int. J. Biochem. Cell Biol. 2003, 35, 1461–1469. [Google Scholar] [CrossRef]
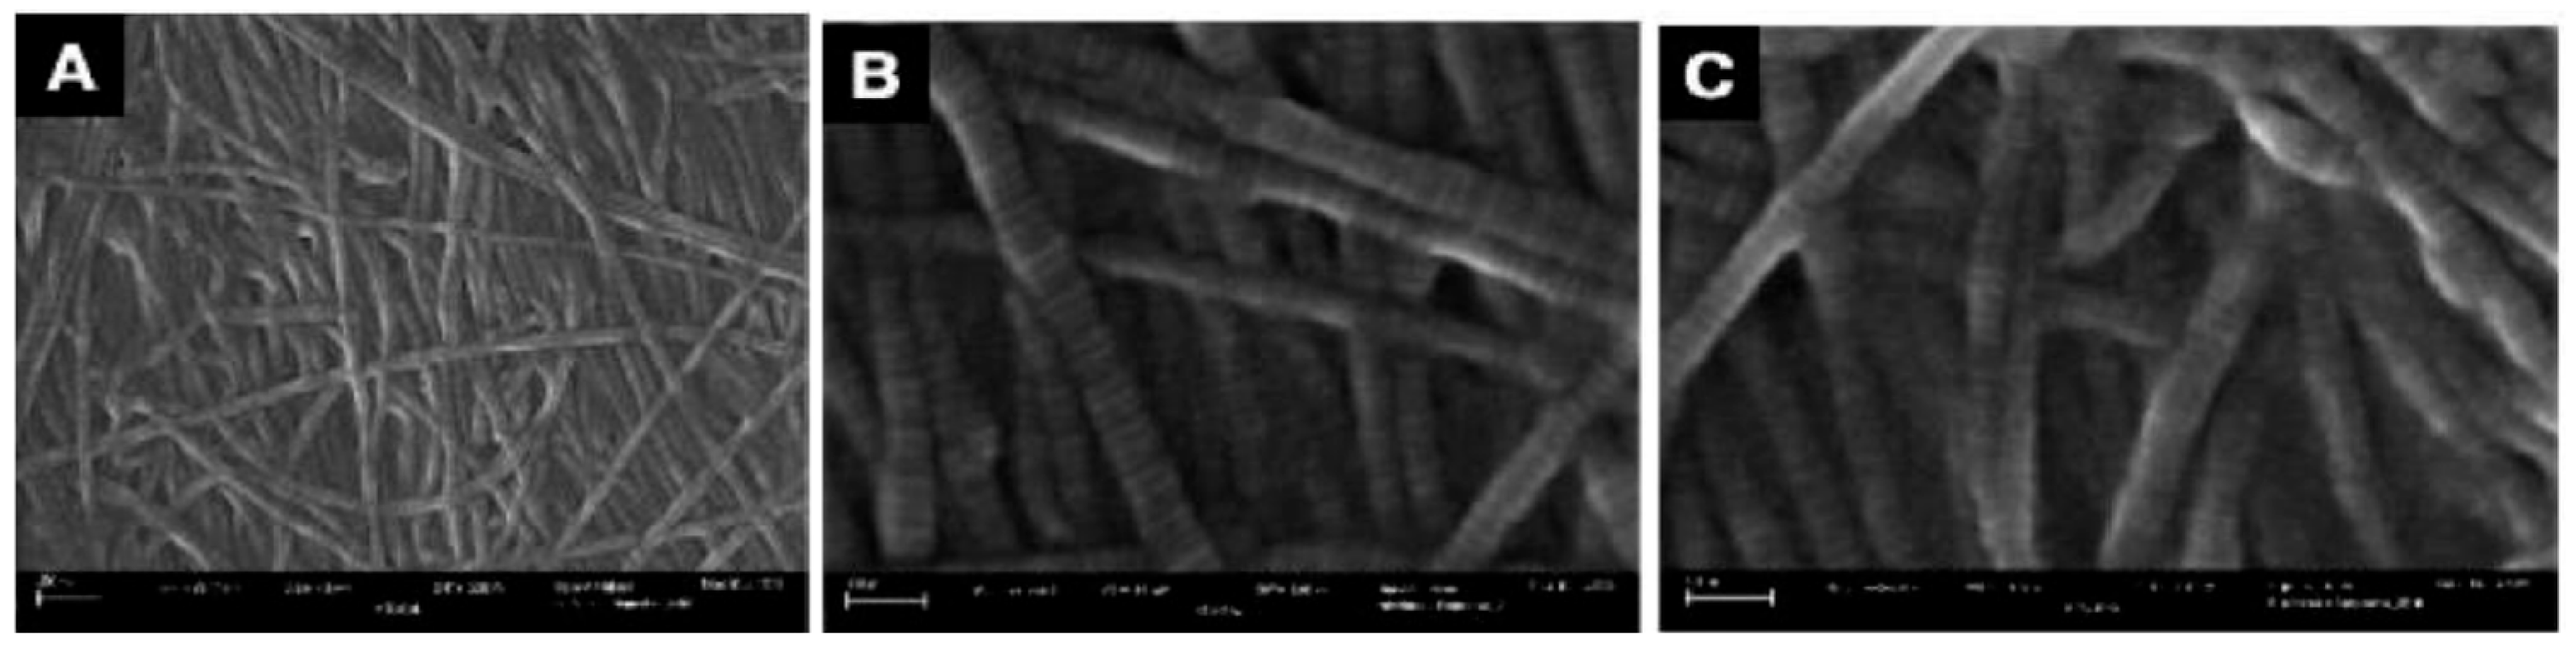
- Davis, J.M.; Purita, J.R.; Shou, J.; Barrett, T.C. Three-Dimensional Electron Microscopy of Human Umbilical Cord Tissue Allograft Pre and Post Processing: A Literature Comparison. J. Biomed. Res. Environ. Sci. 2022, 3, 934–940. [Google Scholar] [CrossRef]
- Changoor, A.; Nelea, M.; Méthot, S.; Tran-Khanh, N.; Chevrier, A.; Restrepo, A.; Shive, M.; Hoemann, C. Buschmann Structural characteristics of the collagen network in human normal, degraded and repair articular cartilages observed in polarized light and scanning electron microscopies. Osteoarthr. Cartil. 2011, 19, 1458–1468. [Google Scholar] [CrossRef]


| Characteristic | N | N = 69 1 |
|---|---|---|
| Age in Years | 69 | 74.5 (6.4) 65.0 91.0 |
| Missing | 0 | |
| BMI in kg/m2 | 44 | 28.8 (5.4) 20.7 50.5 |
| Missing | 25 | |
| Gender | 69 | |
| Female | 33 (48%) | |
| Male | 36 (52%) |
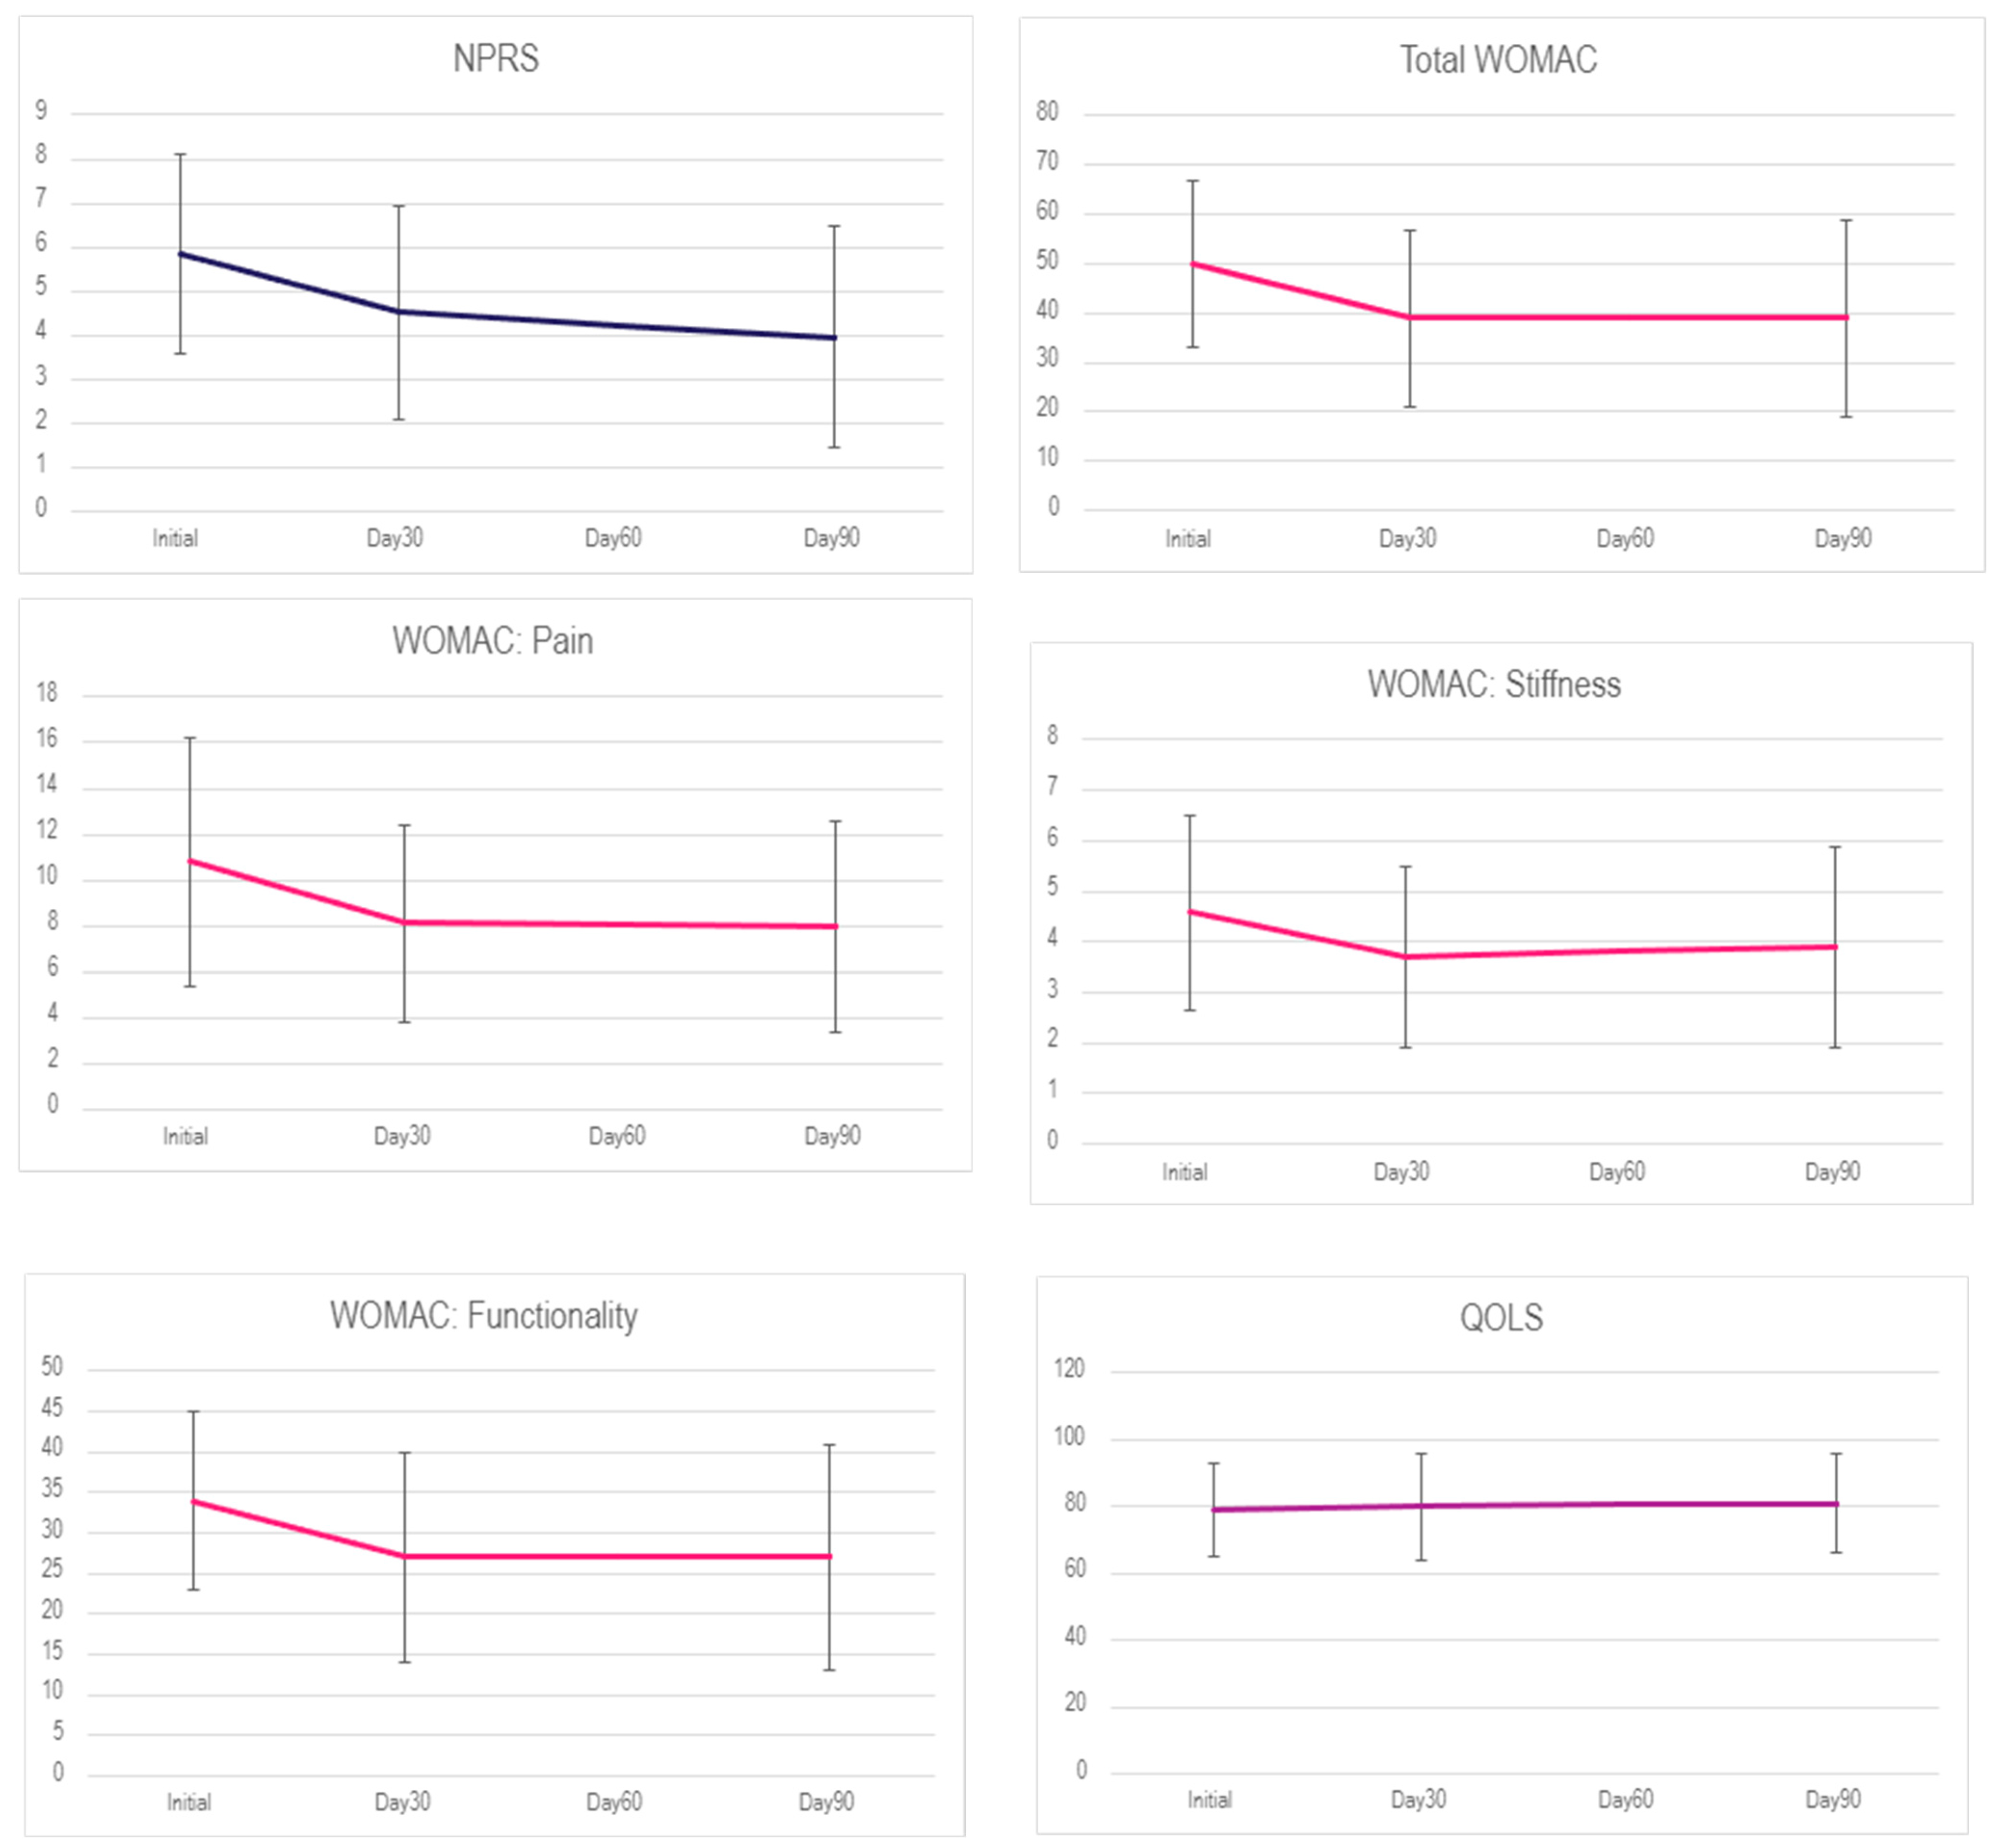
| Interval | N | NPRS 1 | N | WOMAC 1 | N | Pain 1 | N | Stiffness 1 | N | Functionality 1 | N | QOLS 1 |
|---|---|---|---|---|---|---|---|---|---|---|---|---|
| Initial | 61 | 5.85 (2.28) | 69 | 50 (17) | 69 | 10.8 (5.4) | 69 | 4.58 (1.91) | 69 | 34 (11) | 63 | 79 (14) |
| Day 30 | 58 | 4.52 (2.43) | 69 | 39 (18) | 69 | 8.1 (4.3) | 69 | 3.71 (1.78) | 69 | 27 (13) | 62 | 80 (16) |
| Day 90 | 59 | 3.95 (2.51) | 69 | 39 (20) | 69 | 8.0 (4.6) | 69 | 3.89 (1.98) | 69 | 27 (14) | 62 | 81 (15) |
| Interval | N | NPRS 1 | N | WOMAC 1 | N | Pain 1 | N | Stiffness 1 | N | Functionality 1 | N | QOLS 1 |
|---|---|---|---|---|---|---|---|---|---|---|---|---|
| Initial | 13 | 7 (1.63) | 13 | 47.3 (21.9) | 13 | 9.3 (5) | 13 | 4.23 (2.24) | 13 | 33.8 (15.4) | 11 | 82.3 (18.7) |
| Day 30 | 11 | 4.55 (2.11) | 13 | 43.2 (21.4) | 13 | 8.38 (4.89) | 13 | 3.92 (1.85) | 13 | 30.8 (15.2) | 12 | 72.5 (15.4) |
| Day 120 | 12 | 3.58 (1.92) | 13 | 37.6 (19.7) | 13 | 7.7 (4) | 13 | 3.23 (1.83) | 13 | 26.7 (14.5) | 9 | 82.7 (15.9) |
| Day 180 | 11 | 3.9 (2.12) | 13 | 41 (19.5) | 13 | 8 (4.29) | 13 | 3.85 (1.68) | 13 | 29 (13.9) | 9 | 77 (17.77) |
| Scales | Interval | Difference | 95% CI (LWR, UPR) | p-Value |
|---|---|---|---|---|
| NPRS | Day 30—Initial | −1.335 | −2.38, −0.29 | 0.008 |
| Day 90—Initial | −1.903 | −2.94, −0.86 | 0.00 | |
| Day 90—Day 30 | −0.568 | −1.62, 0.48 | 0.411 | |
| WOMAC | Day 30—Initial | −10.913 | −18.31, −3.51 | 0.002 |
| Day 90—Initial | −11.159 | −18.56, −3.76 | 0.001 | |
| Day 90—Day 30 | −0.246 | −7.65, 7.15 | 0.997 | |
| Pain | Day 30—Initial | −2.739 | −4.65, −0.83 | 0.002 |
| Day 90—Initial | −2.841 | −4.75, −0.93 | 0.002 | |
| Day 90—Day 30 | −0.101 | −2.01, 1.81 | 0.991 | |
| Stiffness | Day 30—Initial | −0.87 | −1.63, −0.11 | 0.021 |
| Day 90—Initial | −0.681 | −1.44, 0.08 | 0.09 | |
| Day 90—Day 30 | 0.188 | −0.57, 0.95 | 0.829 | |
| Functionality | Day 30—Initial | −7.304 | −12.45, −2.16 | 0.003 |
| Day 90—Initial | −7.638 | −12.78, −2.49 | 0.002 | |
| Day 90—Day 30 | −0.333 | −5.48, 4.81 | 0.987 | |
| QOLS | Day 30—Initial | 0.669 | −5.82, 7.16 | 0.968 |
| Day 90—Initial | 1.621 | −4.87, 8.11 | 0.826 | |
| Day 90—Day 30 | 0.952 | −5.56, 7.47 | 0.936 |
| Covariates | NPRS | WOMAC | Pain | Stiffness | Functionality | QOLS |
|---|---|---|---|---|---|---|
| Age | 0.149 | 0.863 | 0.932 | 0.321 | 0.849 | 0.439 |
| Gender | 0.659 | 0.330 | 0.781 | 0.252 | 0.303 | 0.762 |
| BMI | 0.300 | 0.262 | 0.276 | 0.709 | 0.340 | 0.319 |
| Scales | N | Not Better, N = 10 1 | Slightly Better, N = 35 1 | Better, N = 8 1 | Much Better, N = 4 1 |
|---|---|---|---|---|---|
| WOMAC | 57 | 1 (16) −36 27 | 11 (16) −25 48 | 11 (12) −2 34 | 23 (15) 2 39 |
| Pain | 57 | 0.2 (3.3) −6.0 7.0 | 2.7 (3.3) −6.0 9.0 | 2.1 (2.3) −2.0 5.0 | 6.2 (1.5) 5.0 8.0 |
| Stiffness | 57 | −0.60 (2.17) −4.00 2.00 | 1.03 (1.84) −4.00 5.00 | 0.63 (1.19) −1.00 3.00 | 2.50 (3.51) −1.00 6.00 |
| Functionality | 57 | 1 (12) −26 19 | 7 (11) −18 35 | 8 (9) 0 26 | 14 (14) −5 28 |
| QOLS | 47 | 3 (11) −11 23 | −5 (14) −46 29 | −2 (3) −6 2 | −4 (13) −23 9 |
| Characteristic | N | Single Application, 1 N = 56 | Double Application, 1 N = 13 | 2 p-Value |
|---|---|---|---|---|
| NPRS | 55 | 1.76 (2.25) −5.00 7.00 | 0.00 (1.94) −4.00 2.00 | 0.021 |
| WOMAC | 69 | 13 (16) −36 56 | 1 (19) −32 29 | 0.068 |
| Pain | 69 | 3.1 (4.3) −6.0 23.0 | 0.2 (4.1) −6.0 7.0 | 0.033 |
| Stiffness | 69 | 0.80 (2.06) −4.00 6.00 | −0.08 (2.02) −4.00 2.00 | 0.3 |
| Functionality | 69 | 9 (12) −26 43 | 1 (13) −22 20 | 0.083 |
| QOLS | 57 | −3 (13) −23 47 | 5 (12) −14 29 | 0.03 |
| Age in Years | 69 | 74.4 (5.8) 65.0 91.0 | 75.0 (8.7) 65.0 91.0 | >0.9 |
| BMI in kg/m2 | 47 | 28.3 (5.6) 20.7 50.5 | 28.1 (6.4) 15.7 38.1 | 0.6 |
| Characteristic | N | Single application, 1 N = 56 | Double application, 1 N = 13 | 2 p-value |
| Name | WOMAC | Pain | Stiffness | Functionality | QOLS |
|---|---|---|---|---|---|
| AUC | 0.71 | 0.75 | 0.68 | 0.69 | 0.68 |
| Sensitivity | 0.83 | 0.57 | 0.89 | 0.83 | 0.47 |
| Specificity | 0.70 | 0.80 | 0.50 | 0.60 | 0.86 |
| Youden’s Index | 0.53 | 0.37 | 0.39 | 0.43 | 0.32 |
| Scales | MCIDAUC | MCp_total | % of Exceed MCIDAUC | % At Least One Unit Improved |
|---|---|---|---|---|
| WOMAC | 11.14 | 11.16 | 44.9 | 78.3 |
| Pain | 2.71 | 2.84 | 46.4 | 76.8 |
| Stiffness | 1.03 | 0.68 | 26.1 | 53.6 |
| Functionality | 7.40 | 7.64 | 43.5 | 76.8 |
| QOLS | −5.40 | −2.66 | 28.9 | 55.9 |
Disclaimer/Publisher’s Note: The statements, opinions and data contained in all publications are solely those of the individual author(s) and contributor(s) and not of MDPI and/or the editor(s). MDPI and/or the editor(s) disclaim responsibility for any injury to people or property resulting from any ideas, methods, instructions or products referred to in the content. |
© 2024 by the authors. Licensee MDPI, Basel, Switzerland. This article is an open access article distributed under the terms and conditions of the Creative Commons Attribution (CC BY) license (https://creativecommons.org/licenses/by/4.0/).
Share and Cite
Lai, A.; Tamea, C.; Shou, J.; Okafor, A.; Sparks, J.; Dodd, R.; Lambert, N.; Woods, C.; Schulte, O.; Kovar, S.; et al. Retrospective Evaluation of Cryopreserved Human Umbilical Cord Tissue Allografts in the Supplementation of Cartilage Defects Associated with Hip Osteoarthritis. J. Clin. Med. 2024, 13, 4040. https://doi.org/10.3390/jcm13144040
Lai A, Tamea C, Shou J, Okafor A, Sparks J, Dodd R, Lambert N, Woods C, Schulte O, Kovar S, et al. Retrospective Evaluation of Cryopreserved Human Umbilical Cord Tissue Allografts in the Supplementation of Cartilage Defects Associated with Hip Osteoarthritis. Journal of Clinical Medicine. 2024; 13(14):4040. https://doi.org/10.3390/jcm13144040
Chicago/Turabian StyleLai, Albert, Conrad Tamea, John Shou, Anthony Okafor, Jay Sparks, Renee Dodd, Naomi Lambert, Crislyn Woods, Orion Schulte, Sarah Kovar, and et al. 2024. "Retrospective Evaluation of Cryopreserved Human Umbilical Cord Tissue Allografts in the Supplementation of Cartilage Defects Associated with Hip Osteoarthritis" Journal of Clinical Medicine 13, no. 14: 4040. https://doi.org/10.3390/jcm13144040