
Polyuria in COVID-19 Patients Undergoing Extracorporeal Membrane Oxygenation

 , ,
, ,
Abstract
:1. Introduction
2. Materials and Methods
2.1. Study Design
2.2. Statistical Analysis
2.3. Technical Characteristics
3. Results
3.1. Patients’ Characteristics
3.2. Statistical Results
3.3. Technical Results
4. Discussion
5. Future Directions and Limitations
6. Conclusions
Author Contributions
Funding
Institutional Review Board Statement
Informed Consent Statement
Data Availability Statement
Conflicts of Interest
List of Abbreviations
| ARDS | acute respiratory distress syndrome |
| ADH | antidiuretic hormone |
| COVID-19 | coronavirus disease 2019 |
| ELSO | Extracorporeal Life Support Organization |
| ICU | intensive care unit |
| NPU | non-polyuric |
| PCR | polymerase chain reaction |
| PU | polyuric |
| SARS-CoV-2 | severe acute respiratory syndrome coronavirus 2 |
| VA ECMO | veno-atrial extracorporeal membrane oxygenation |
| VV ECMO | veno-venous extracorporeal membrane oxygenation |
Appendix A

| Group | Parameters | Day −2 | Day 0 | Day 1 | Day 2 | Day 3 | Day 4 | Day 5 | Day 6 | Day 7 | p-Value # | p-Value * |
|---|---|---|---|---|---|---|---|---|---|---|---|---|
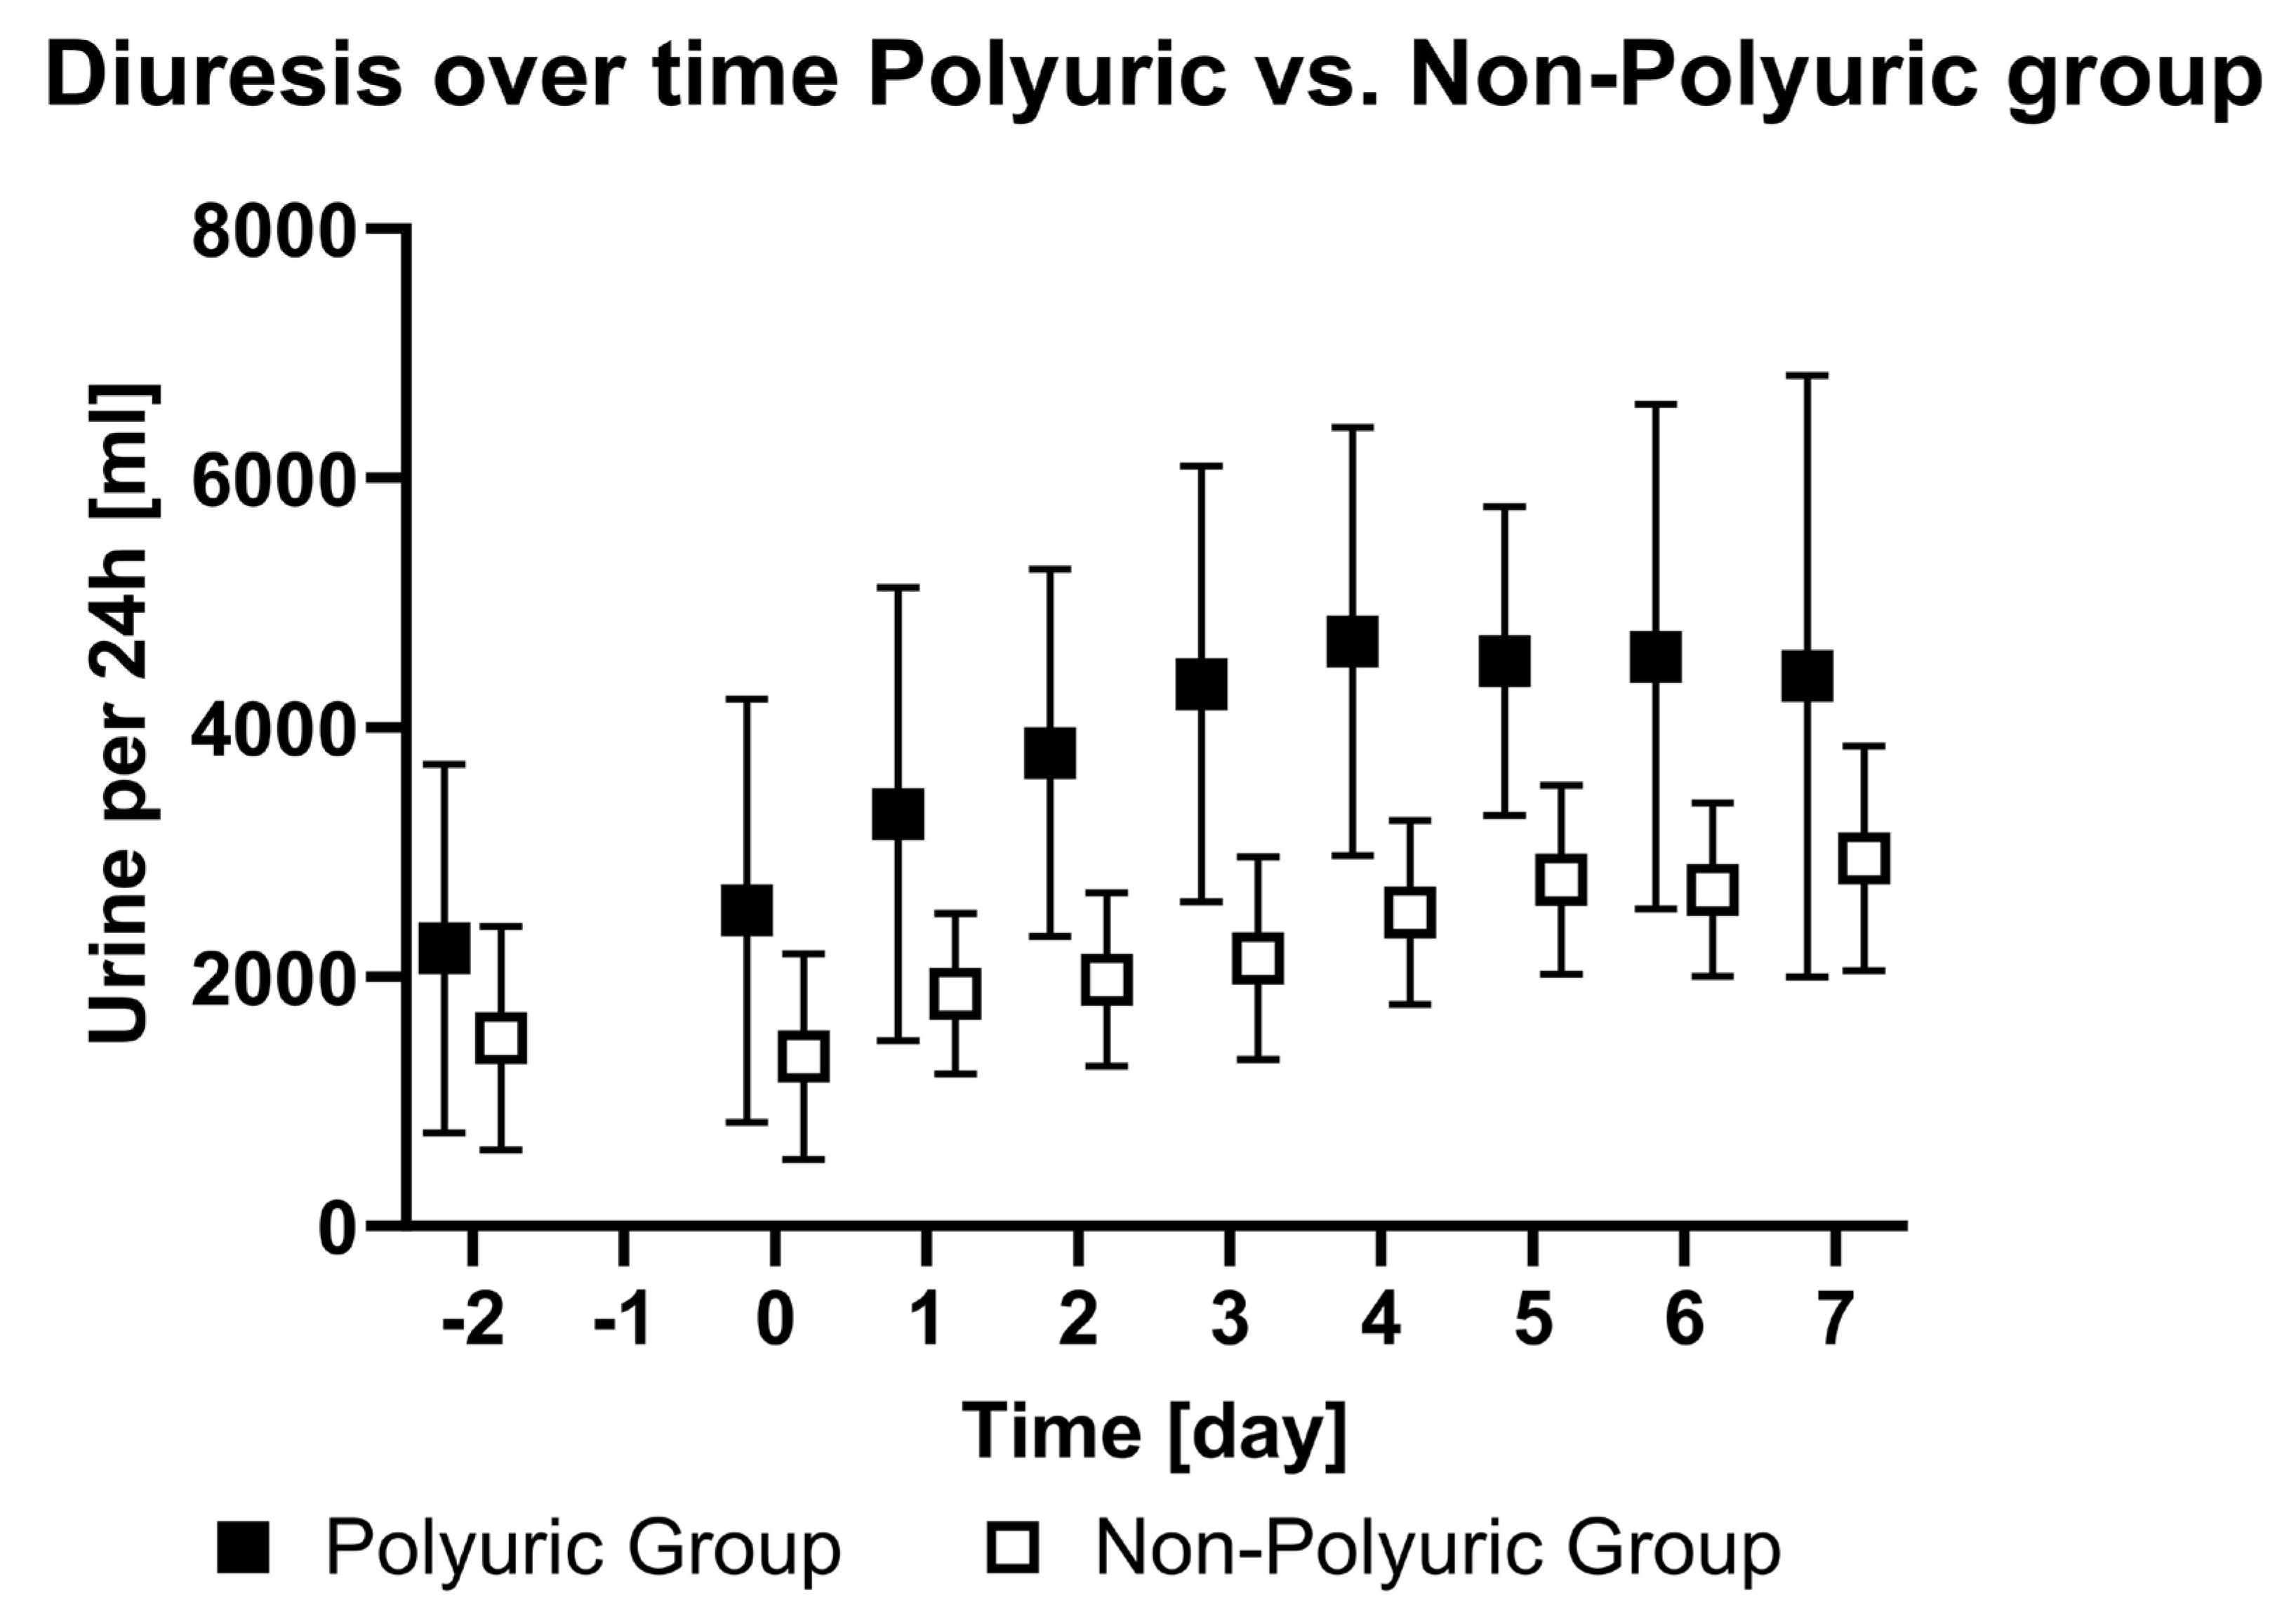
| PU | Diuresis [mL/24 h] | 2225 ± 1443 | 2605 ± 1640 | 3303 ± 1789 | 3793 ± 1451 | 4347 ± 1722 | 4689 ± 1693 | 4529 ± 1220 | 4566 ± 1993 | 4411 ± 2377 | <0.01 | - |
| NPU | Diuresis [mL/24 h] | 1504 ± 872 | 1358 ± 814 | 1864 ± 631 | 1977 ± 684 | 2148 ± 799 | 2514 ± 725 | 2777 ± 748 | 2698 ± 683 | 2947 ± 886 | ||
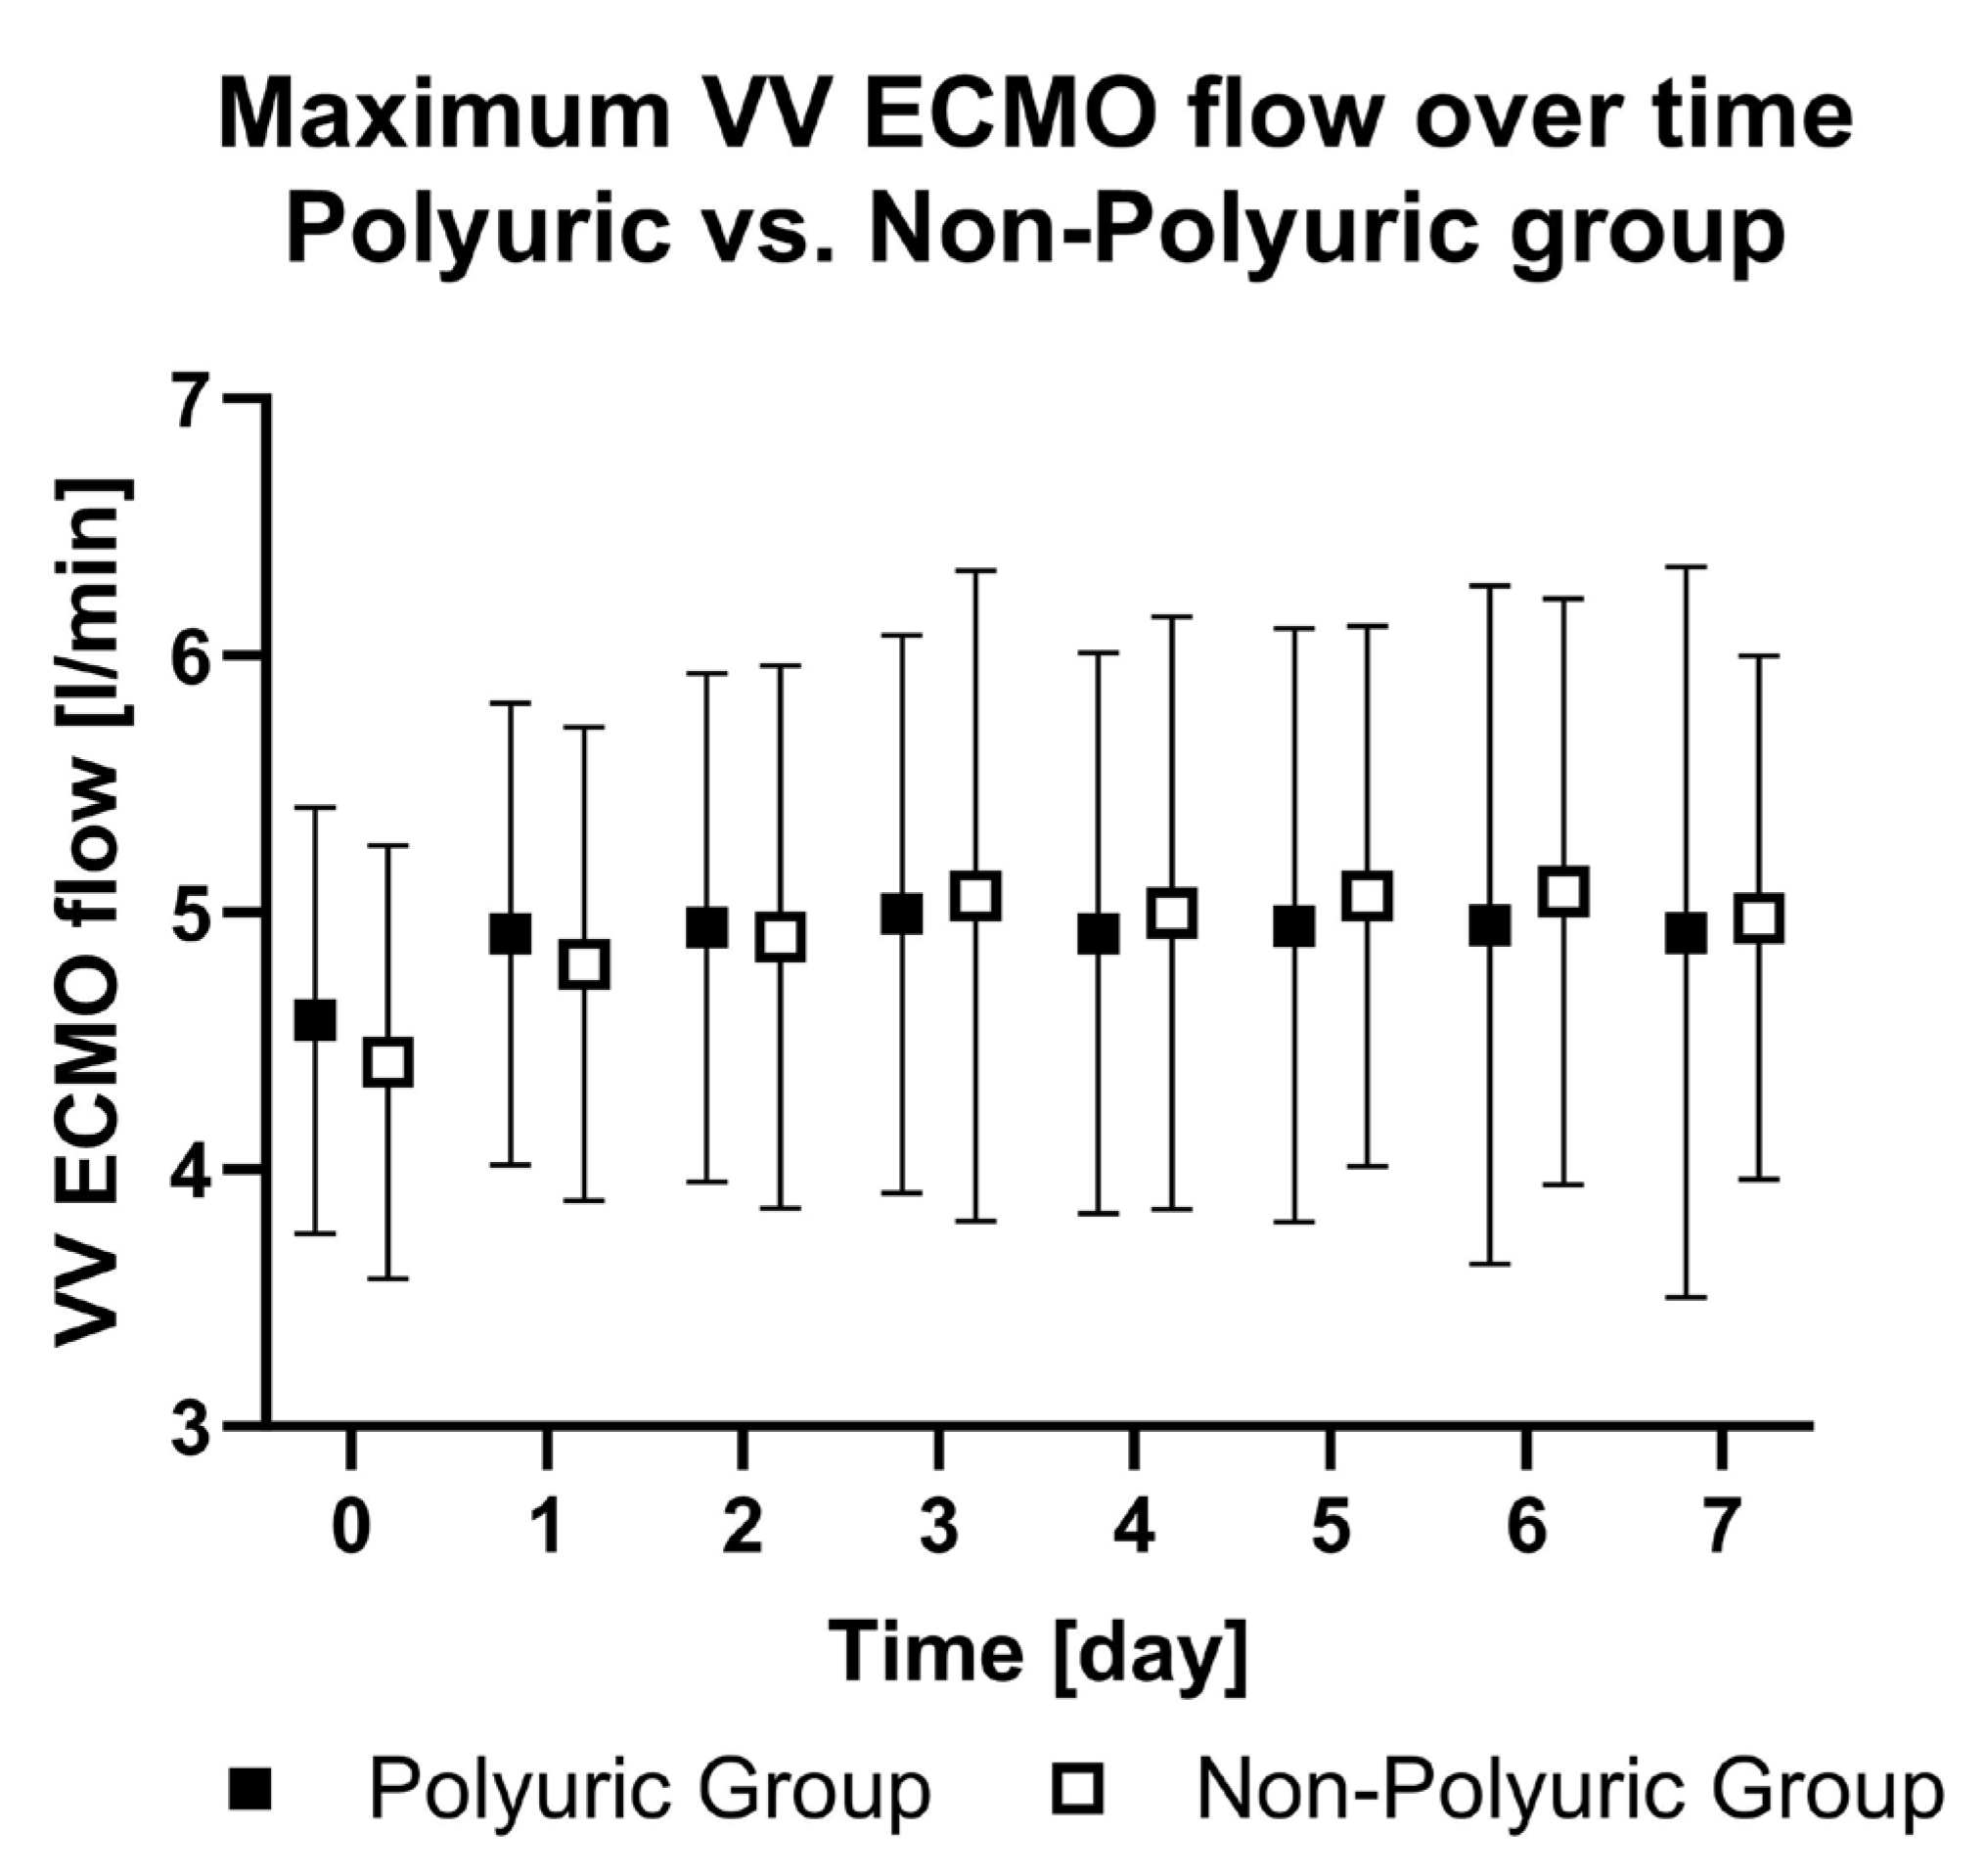
| PU | ECMO flow rate [L/min] | - | 4.6 ± 0.8 | 4.9 ± 0.9 | 4.9 ± 1.0 | 5.0 ± 1.1 | 4.9 ± 1.1 | 4.9 ± 1.1 | 5.0 ± 1.3 | 4.9 ± 1.4 | - | 0.82 |
| NPU | ECMO flow rate [L/min] | - | 4.4 ± 0.8 | 4.8 ± 0.9 | 4.9 ± 1.0 | 5.1 ± 1.2 | 5.0 ± 1.1 | 5.1 ± 1.0 | 5.1 ± 1.1 | 5.0 ± 1.0 | ||
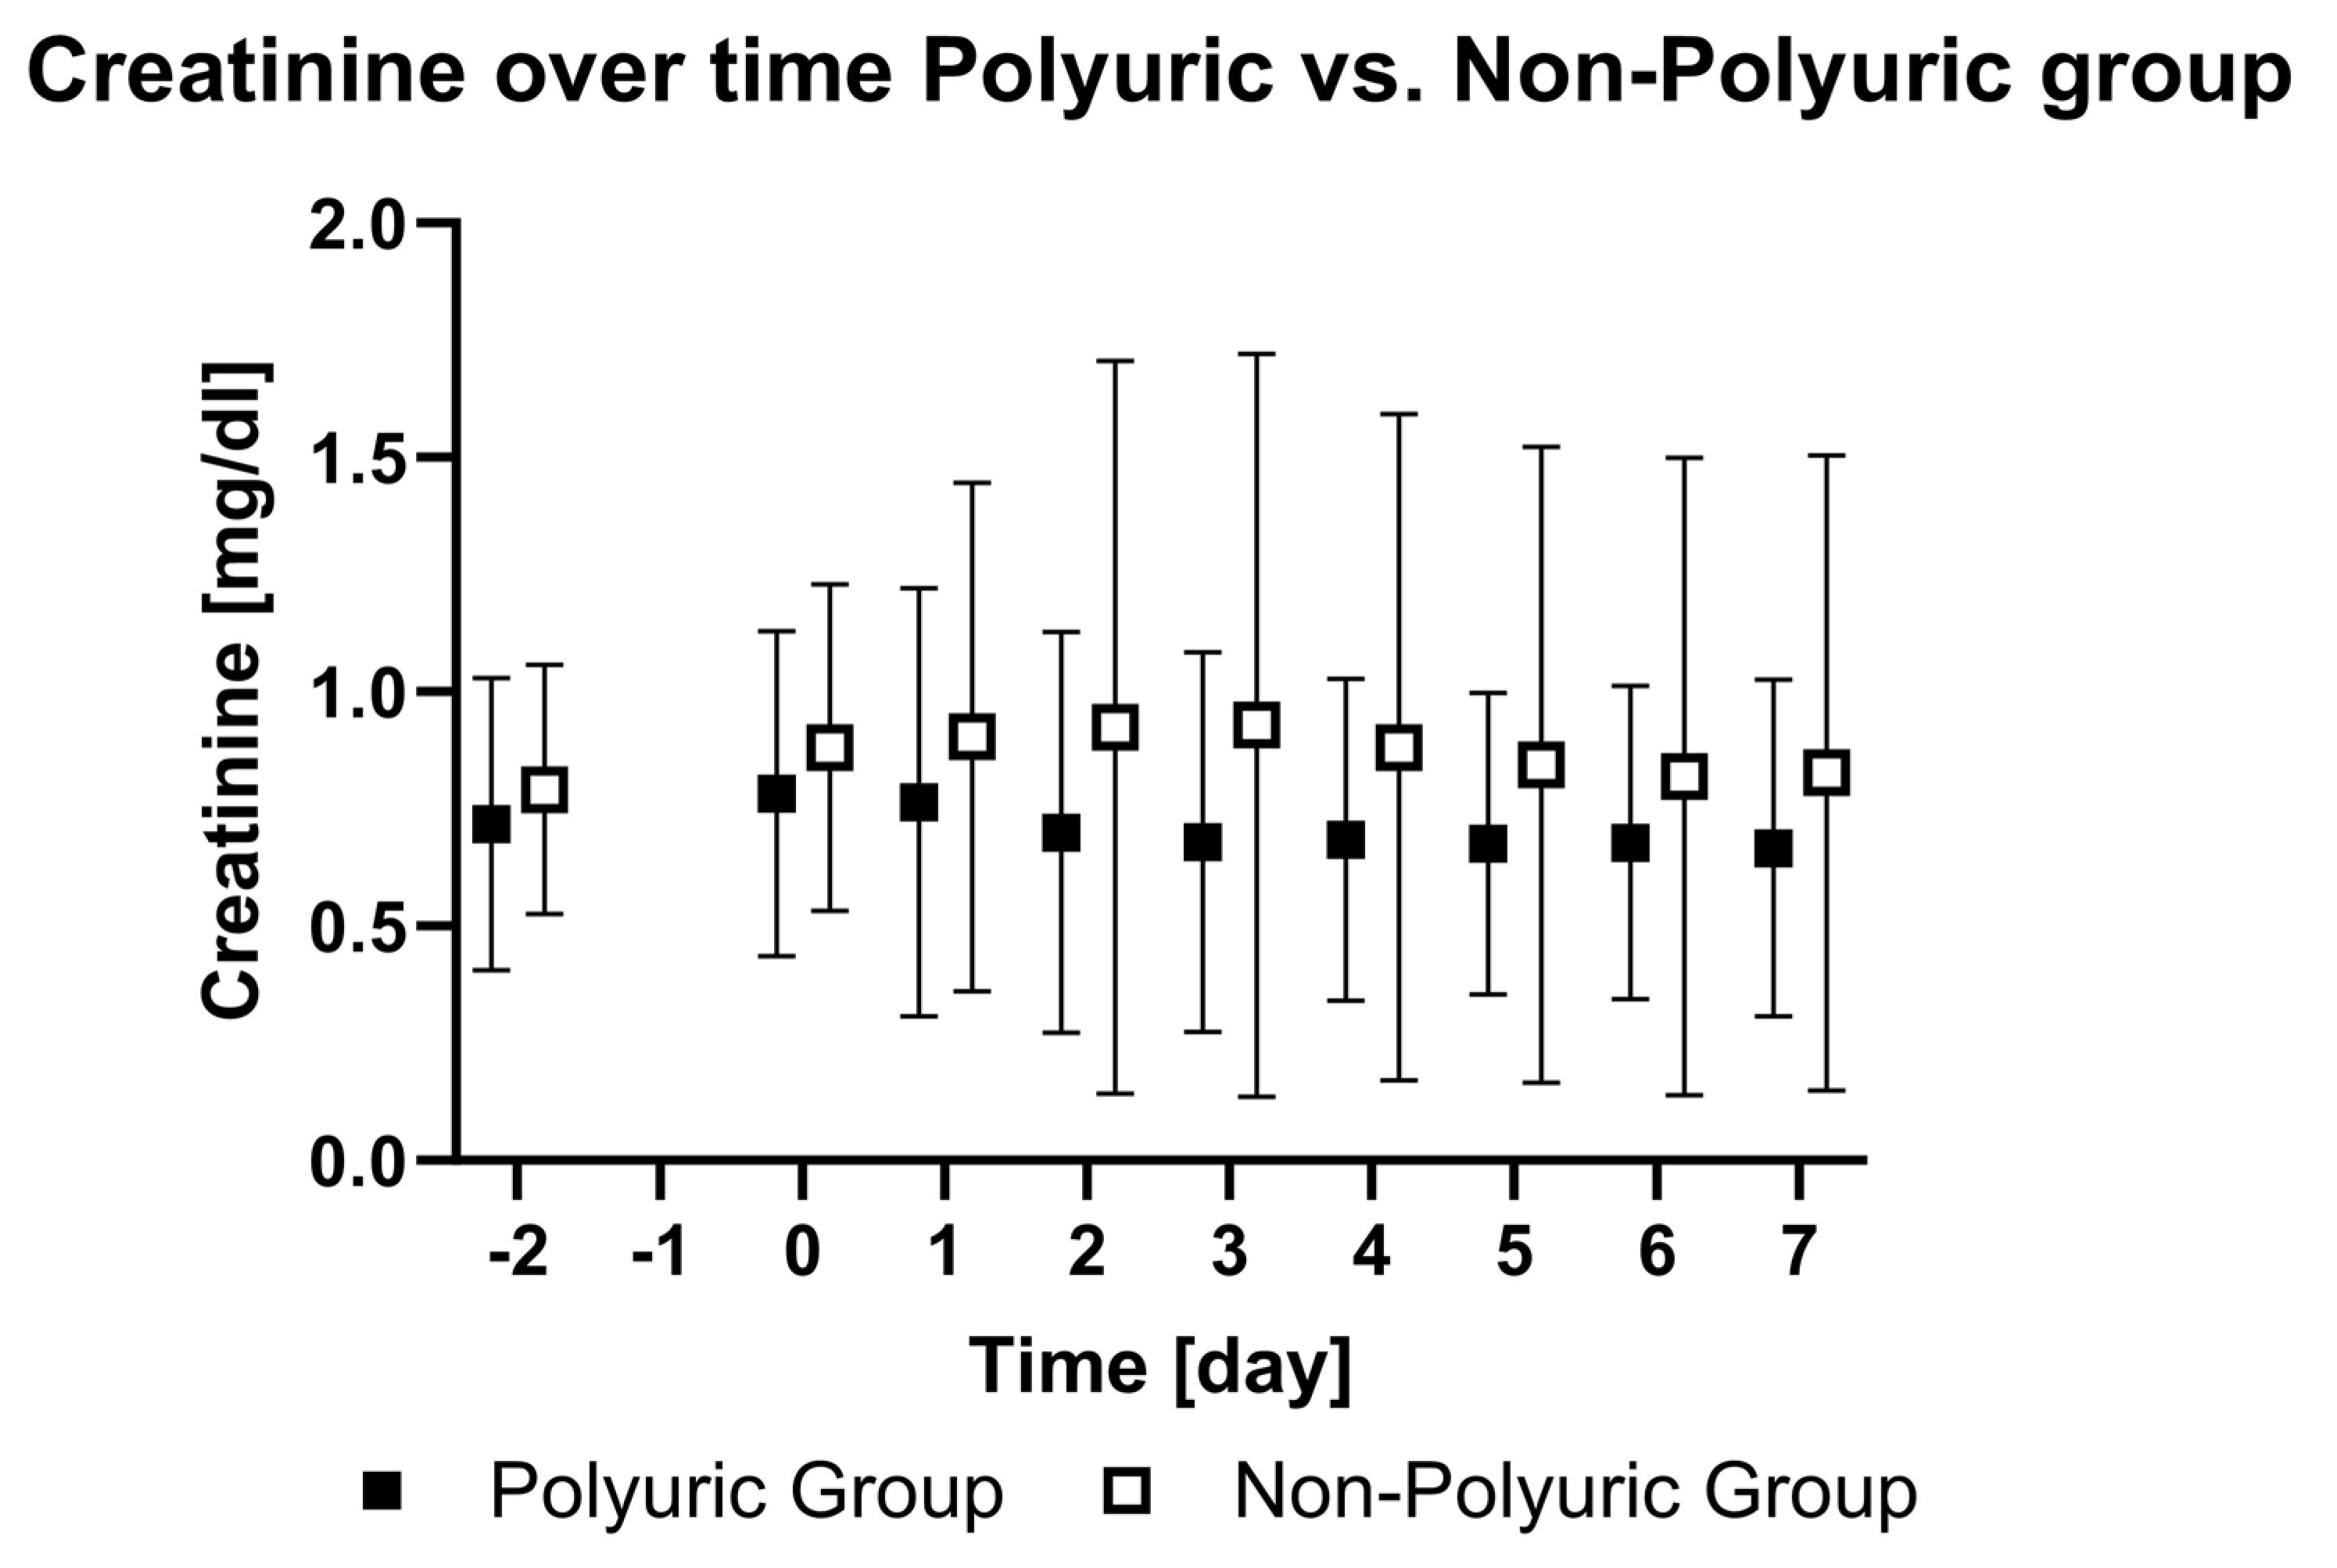
| PU | Creatinine [mg/dL] | 0.72 ± 0.3 | 0.78 ± 0.34 | 0.76 ± 0.45 | 0.7 ± 0.42 | 0.68 ± 0.4 | 0.68 ± 0.34 | 0.7 ± 0.32 | 0.68 ± 0.33 | 0.67 ± 0.35 | - | <0.01 |
| NPU | Creatinine [mg/dL] | 0.79 ± 0.26 | 0.88 ± 0.34 | 0.9 ± 0.53 | 0.92 ± 0.77 | 0.93 ± 0.78 | 0.88 ± 0.7 | 0.84 ± 0.67 | 0.82 ± 0.67 | 0.83 ± 0.67 | ||
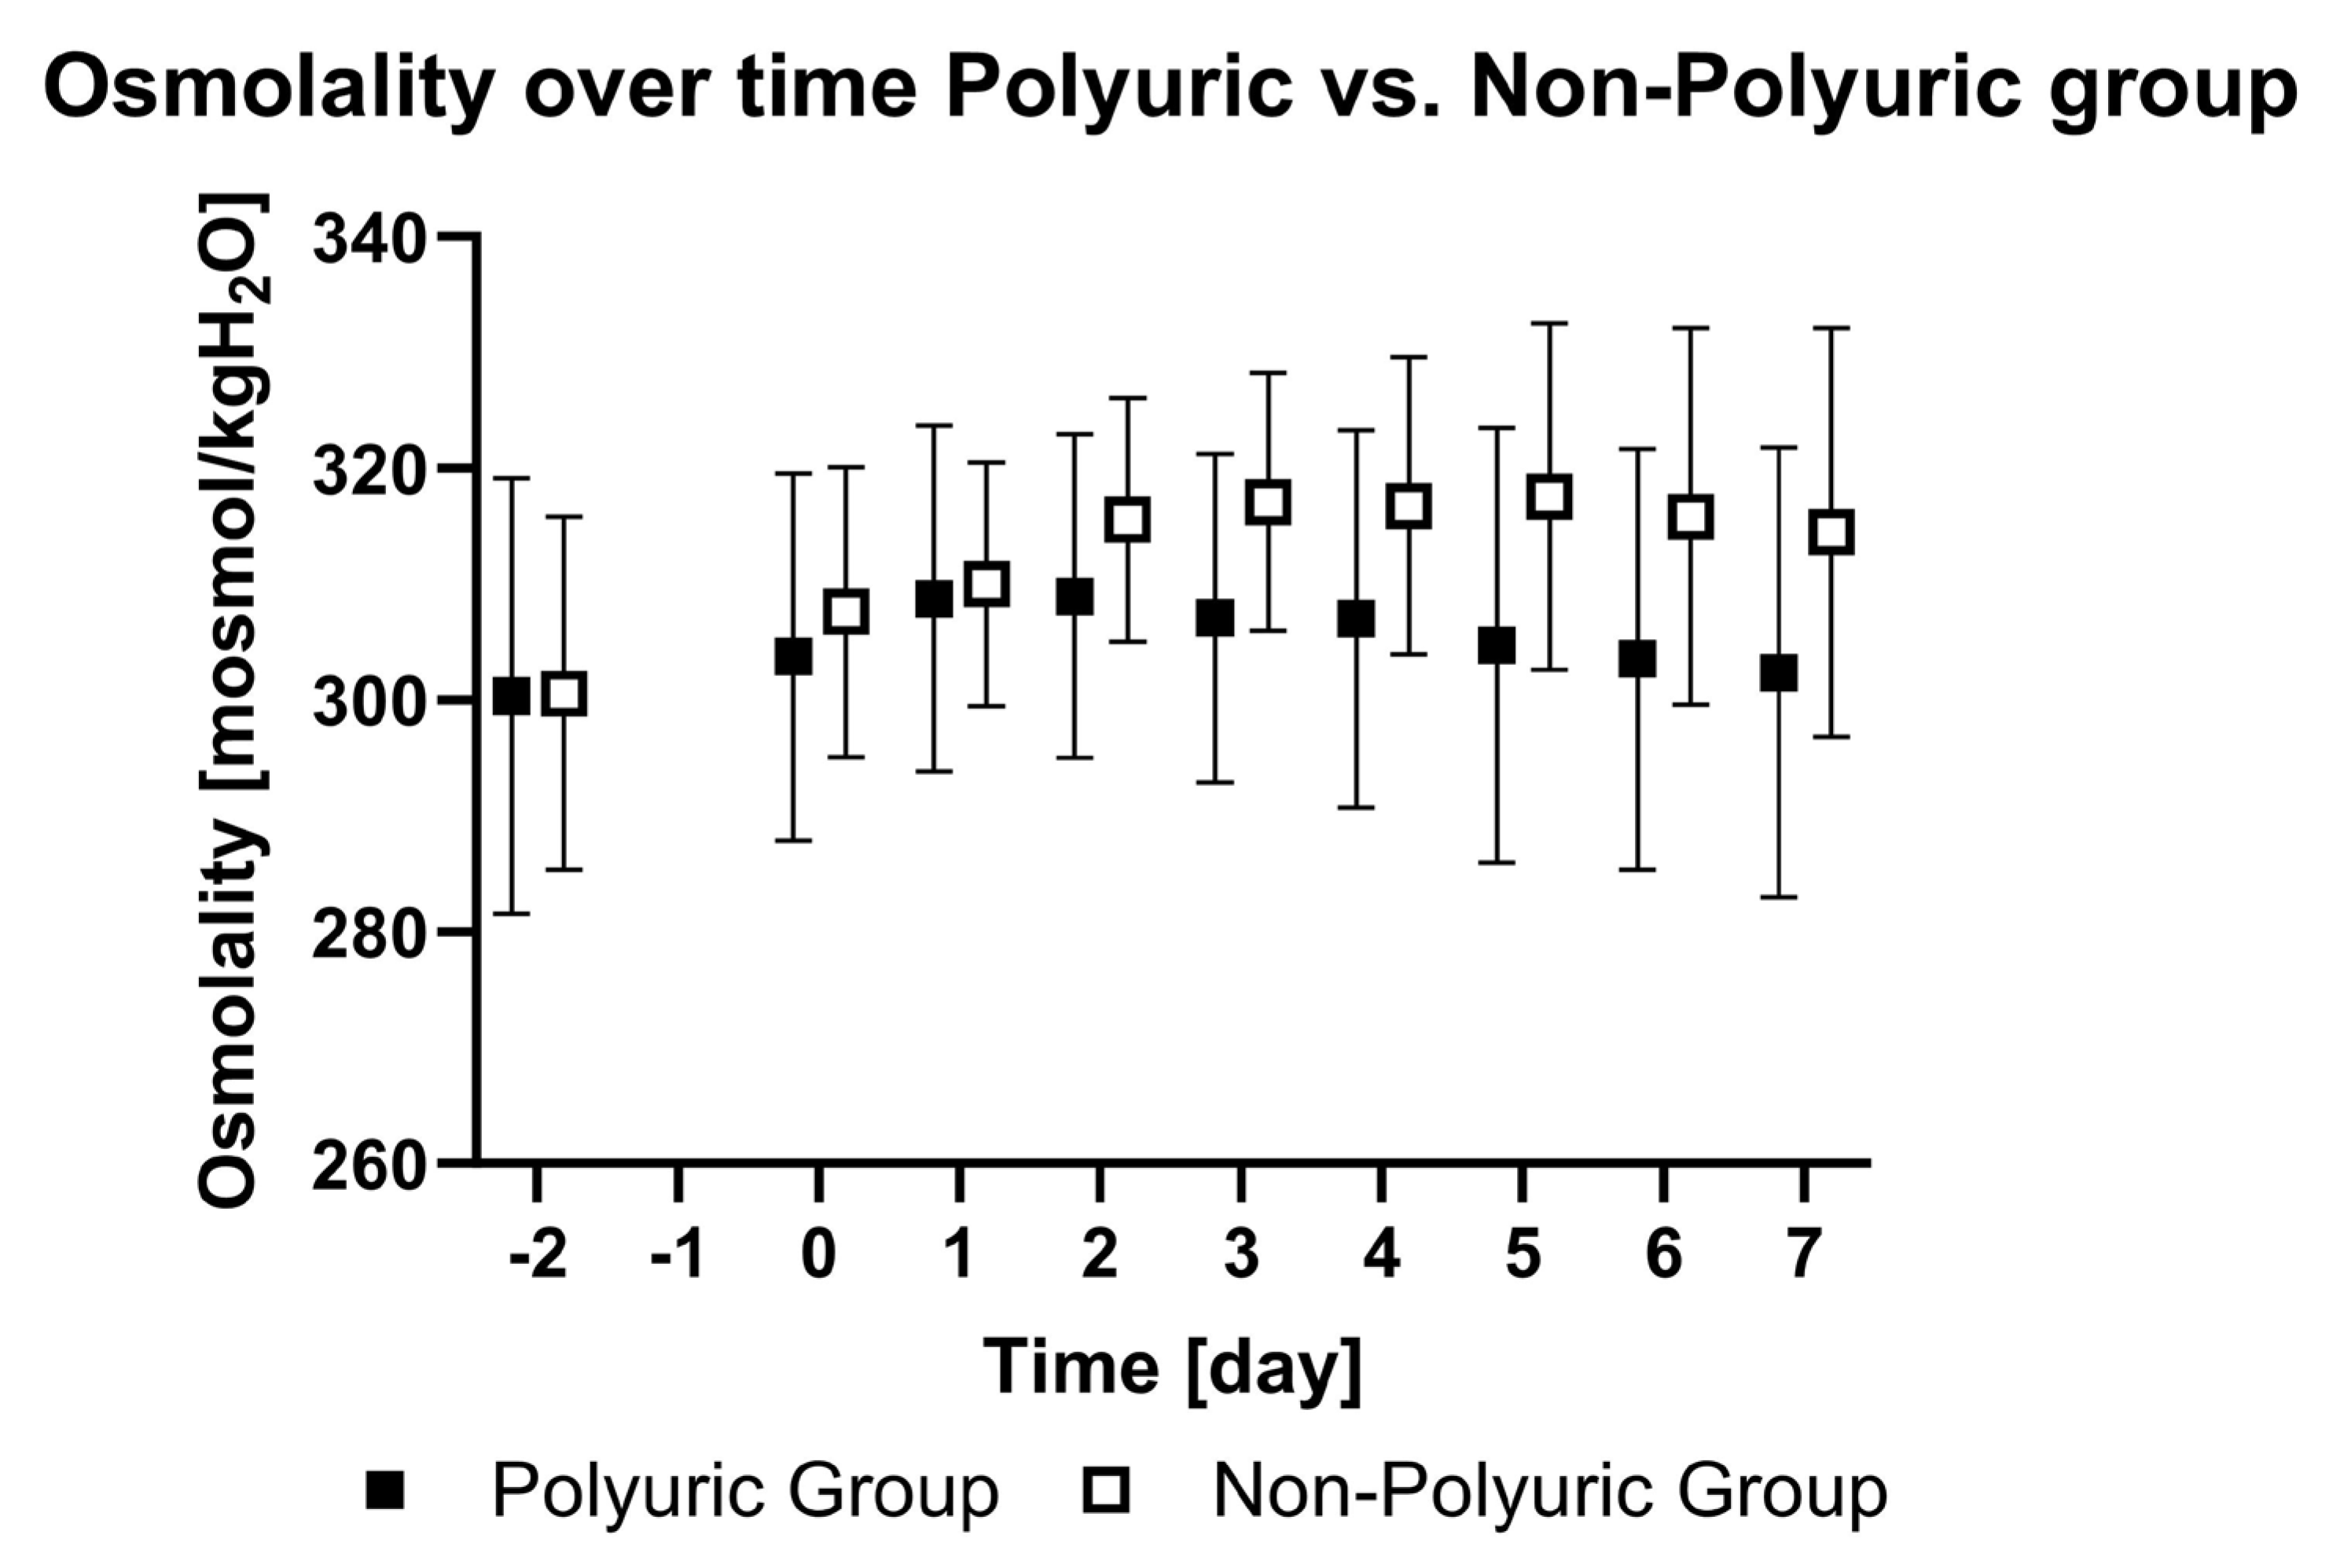
| PU | Plasma osmolality [mosmol/kgH2O] | 300 ± 18 | 304 ± 16 | 309 ± 15 | 309 ± 14 | 307 ± 14 | 307 ± 16 | 305 ± 19 | 303 ± 18 | 302 ± 19 | <0.01 | <0.01 |
| NPU | Plasma osmolality [mosmol/kgH2O] | 300 ± 15 | 308 ± 12 | 310 ± 10 | 316 ± 10 | 317 ± 11 | 317 ± 13 | 318 ± 15 | 316 ± 16 | 315 ± 17 |
| Group | Parameters | Day −2 | Day 0 | Day 1 | Day 2 | Day 3 | Day 4 | Day 5 | Day 6 | Day 7 | p-Value # | p-Value * |
|---|---|---|---|---|---|---|---|---|---|---|---|---|
| PU | Urea [mg/dL] | 44 ± 28 | 45 ± 21 | 50 ± 30 | 48 ± 33 | 46 ± 34 | 44 ± 34 | 44 ± 32 | 42 ± 30 | 42 ± 29 | 0.62 | <0.01 |
| NPU | Urea [mg/dL] | 48 ± 27 | 53 ± 25 | 57 ± 24 | 58 ± 26 | 60 ± 30 | 61 ± 32 | 60 ± 34 | 60 ± 36 | 61 ± 38 | ||
| PU | Sodium [mmol/L] | 143 ± 8 | 145 ± 7 | 146 ± 6 | 147 ± 5 | 146 ± 5 | 146 ± 6 | 145 ± 7 | 144 ± 7 | 144 ± 8 | <0.01 | <0.01 |
| NPU | Sodium [mmol/L] | 142 ± 6 | 148 ± 5 | 146 ± 5 | 148 ± 4 | 149 ± 4 | 149 ± 5 | 149 ± 5 | 149 ± 6 | 148 ± 6 | ||
| PU | Lactate [mg/dL] | 13 ± 3 | 14 ± 8 | 13 ± 5 | 11 ± 4 | 10 ± 4 | 9 ± 3 | 8 ± 2 | 9 ± 3 | 8 ± 3 | - | <0.01 |
| NPU | Lactate [mg/dL] | 15 ± 4 | 17 ± 7 | 14 ± 5 | 12 ± 3 | 12 ± 4 | 10 ± 4 | 10 ± 3 | 9 ± 3 | 9 ± 3 | ||
| PU | Procalcitonin [ng/mL] | 0.56 ± 0.7 | 0.86 ± 1.23 | 1.0 ± 1.3 | 0.79 ± 1.02 | 0.86 ± 1.3 | 0.79 ± 1.1 | 0.6 ± 0.75 | 0.47 ± 0.49 | 0.45 ± 0.42 | - | 0.41 |
| NPU | Procalcitonin [ng/mL] | 0.58 ± 0.79 | 0.92 ± 0.92 | 1.46 ± 2.06 | 1.08 ± 1.52 | 2.28 ± 8.66 | 0.59 ± 0.61 | 0.49 ± 0.51 | 0.5 ± 0.77 | 0.44 ± 0.59 | ||
| PU | Fluid intake [mL/24 h] | 3296 ± 1551 | 3816 ± 2445 | 4402 ± 1846 | 4429 ± 1495 | 4684 ± 2086 | 5002 ± 1718 | 4938 ± 1748 | 5064 ± 2208 | 5375 ± 2346 | - | <0.01 |
| NPU | Fluid intake [mL/24 h] | 2385 ± 1275 | 2964 ± 1605 | 3407 ± 1049 | 2985 ± 929 | 3355 ± 922 | 3065 ± 786 | 3036 ± 800 | 3291 ± 1034 | 3443 ± 1183 | - | - |
| PU | Fluid balance [mL/24 h] | 604 ± 920 | 821 ± 1333 | 331 ± 1447 | 23 ± 1126 | −565 ± 1528 | −276 ± 1178 | −201 ± 1334 | −128 ± 1438 | 153 ± 1343 | - | 0.01 |
| NPU | Fluid balance [mL/24 h] | 307 ± 1032 | 1161 ± 1175 | 863 ± 1117 | 261 ± 1088 | 327 ± 979 | 90 ± 1175 | −195 ± 1019 | 75 ± 1112 | −202 ± 1368 | - | - |
References
- Brodie, D.; Bacchetta, M. Extracorporeal Membrane Oxygenation for ARDS in Adults. N. Engl. J. Med. 2011, 365, 1905–1914. [Google Scholar] [CrossRef] [PubMed]
- Tonna, J.E.; Boonstra, P.S.; MacLaren, G.; Paden, M.; Brodie, D.; Anders, M.; Hoskote, A.; Ramanathan, K.; Hyslop, R.; Fanning, J.J.; et al. Extracorporeal Life Support Organization Registry International Report 2022: 100,000 Survivors. ASAIO J. 2024, 70, 131–143. [Google Scholar] [CrossRef]
- Friedrichson, B.; Kloka, J.A.; Neef, V.; Mutlak, H.; Old, O.; Zacharowski, K.; Piekarski, F. Extracorporeal Membrane Oxygenation in Coronavirus Disease 2019: A Nationwide Cohort Analysis of 4279 Runs from Germany. Eur. J. Anaesthesiol. 2022, 39, 445–451. [Google Scholar] [CrossRef]
- Zangrillo, A.; Landoni, G.; Biondi-Zoccai, G.; Greco, M.; Greco, T.; Frati, G.; Patroniti, N.; Antonelli, M.; Pesenti, A.; Pappalardo, F. A Meta-Analysis of Complications and Mortality of Extracorporeal Membrane Oxygenation. Crit. Care Resusc. 2013, 15, 172–178. [Google Scholar] [CrossRef] [PubMed]
- Rosen, R.J.; Stevens, J.S.; Canetta, P.A.; Siddall, E. Polyuria Due to Pressure Natriuresis in Venoarterial Extracorporeal Membrane Oxygenation. ASAIO J. 2022, 68, e124–e127. [Google Scholar] [CrossRef] [PubMed]
- Yamaguchi, S.; Sawamura, A.; Nakaguro, M.; Shimoyama, Y.; Morimoto, R.; Kato, H.; Arao, Y.; Oishi, H.; Haga, T.; Kuwayama, T.; et al. Giant Cell Myocarditis with Central Diabetes Insipidus: A Case Report. J. Cardiol. Cases 2020, 21, 8–11. [Google Scholar] [CrossRef] [PubMed]
- Herity, L.B.; Baker, C.; Kim, C.; Lowe, D.K.; Cahoon, W.D. Delayed Onset of Central Diabetes Insipidus with Ketamine Sedation: A Report of 2 Cases. J. Pharm. Pract. 2021, 34, 314–318. [Google Scholar] [CrossRef] [PubMed]
- Sheikh, A.B.; Javaid, M.A.; Sheikh, A.A.E.; Shekhar, R. Central Adrenal Insufficiency and Diabetes Insipidus as Potential Endocrine Manifestations of COVID-19 Infection: A Case Report. Pan Afr. Med. J. 2021, 38, 222. [Google Scholar] [PubMed]
- Yavari, A.; Sharifan, Z.; Larijani, B.; Mosadegh Khah, A. Central Diabetes Insipidus Secondary to COVID-19 Infection: A Case Report. BMC Endocr. Disord. 2022, 22, 134. [Google Scholar] [CrossRef] [PubMed]
- Statlender, L.; Fishman, G.; Hellerman, M.; Kagan, I.; Bendavid, I.; Gorfil, D.; Kaptzon, S.; Singer, P. Transient Diabetes Insipidus in Critically Ill COVID19 Patients. J. Crit. Care 2023, 74, 154211. [Google Scholar] [CrossRef] [PubMed]
- Goldman, L.; Schafer, A.I. (Eds.) Goldman-Cecil Medicine, 26th ed.; Elsevier: Philadelphia, PA, USA, 2020; Volume 1, ISBN 978-0-323-76018-8. [Google Scholar]
- Yu, A.S.L. (Ed.) Brenner & Rector’s the Kidney, 11th ed.; Elsevier: Philadelphia, PA, USA, 2020; ISBN 978-0-323-53265-5. [Google Scholar]
- Lundholm, M.D.; Poku, C.; Emanuele, N.; Emanuele, M.A.; Lopez, N. SARS-CoV-2 (COVID-19) and the Endocrine System. J. Endocr. Soc. 2020, 4, bvaa144. [Google Scholar] [CrossRef] [PubMed]
- Hilton, J.; Boyer, N.; Nadim, M.K.; Forni, L.G.; Kellum, J.A. COVID-19 and Acute Kidney Injury. Crit. Care Clin. 2022, 38, 473–489. [Google Scholar] [CrossRef] [PubMed]
- Kloka, J.A.; Blum, L.V.; Old, O.; Zacharowski, K.; Friedrichson, B. Characteristics and Mortality of 561,379 Hospitalized COVID-19 Patients in Germany until December 2021 Based on Real-Life Data. Sci. Rep. 2022, 12, 11116. [Google Scholar] [CrossRef] [PubMed]
- Melmed, S.; Auchus, R.J.; Goldfine, A.B.; Koenig, R.J.; Rosen, C.J. (Eds.) Williams Textbook of Endocrinology, 14th ed.; Elsevier: Philadelphia, PA, USA, 2020; ISBN 978-0-323-55596-8. [Google Scholar]
- Christ-Crain, M.; Morgenthaler, N.G.; Fenske, W. Copeptin as a Biomarker and a Diagnostic Tool in the Evaluation of Patients with Polyuria–Polydipsia and Hyponatremia. Best Pract. Res. Clin. Endocrinol. Metab. 2016, 30, 235–247. [Google Scholar] [CrossRef] [PubMed]
- Shekar, K.; Fraser, J.F.; Smith, M.T.; Roberts, J.A. Pharmacokinetic Changes in Patients Receiving Extracorporeal Membrane Oxygenation. J. Crit. Care 2012, 27, 741.e9–741.e18. [Google Scholar] [CrossRef] [PubMed]

| Characteristics | Females n (%) | Males n (%) | Age [years] | Weight [kg] |
|---|---|---|---|---|
| Total patients | 14 (21) | 54 (79) | 52 ± 12 | 95 ± 18 |
| PU | 5 (14) | 30 (86) | 49 ± 13 | 94 ± 19 |
| NPU | 9 (27) | 24 (73) | 54 ± 10 | 95 ± 15 |
| Cannulation Site | Femoral Right and Left (Vf − Vf) | Femoral Right and Internal Jugular Right (Vf − Vj) | Internal Jugular Right and Femoral Left (Vf − Vj) |
|---|---|---|---|
| All patients n (%) | 50 (73.5) | 16 (23.5) | 2 (3) |
| PU | 28 (80) | 7 (20) | 0 |
| NPU | 22 (66.7) | 9 (27.3) | 2 (6) |
Disclaimer/Publisher’s Note: The statements, opinions and data contained in all publications are solely those of the individual author(s) and contributor(s) and not of MDPI and/or the editor(s). MDPI and/or the editor(s) disclaim responsibility for any injury to people or property resulting from any ideas, methods, instructions or products referred to in the content. |
© 2024 by the authors. Licensee MDPI, Basel, Switzerland. This article is an open access article distributed under the terms and conditions of the Creative Commons Attribution (CC BY) license (https://creativecommons.org/licenses/by/4.0/).
Share and Cite
Rausch, J.; Steinbicker, A.U.; Friedrichson, B.; Flinspach, A.N.; Zacharowski, K.; Adam, E.H.; Piekarski, F. Polyuria in COVID-19 Patients Undergoing Extracorporeal Membrane Oxygenation. J. Clin. Med. 2024, 13, 4081. https://doi.org/10.3390/jcm13144081
Rausch J, Steinbicker AU, Friedrichson B, Flinspach AN, Zacharowski K, Adam EH, Piekarski F. Polyuria in COVID-19 Patients Undergoing Extracorporeal Membrane Oxygenation. Journal of Clinical Medicine. 2024; 13(14):4081. https://doi.org/10.3390/jcm13144081
Chicago/Turabian StyleRausch, Johannes, Andrea U. Steinbicker, Benjamin Friedrichson, Armin N. Flinspach, Kai Zacharowski, Elisabeth H. Adam, and Florian Piekarski. 2024. "Polyuria in COVID-19 Patients Undergoing Extracorporeal Membrane Oxygenation" Journal of Clinical Medicine 13, no. 14: 4081. https://doi.org/10.3390/jcm13144081