Abstract
Background: This cohort study was conducted to devise an approximation formula for predicting the glomerular filtration rate (GFR) after 1 year using annual medical examination data from the general population. Methods: Consecutive annual medical examination data were obtained for 41,337 inhabitants. Machine learning with the random forest method was used to assess the importance of each clinical parameter in terms of its association with estimated GFR (eGFR) after 1 year. An approximation formula was developed by multiple linear regression analysis based on the four most important clinical parameters. The relationship between the GFR after 1 year approximated by our formula and the eGFR after 1 year was analyzed using Pearson’s correlation coefficient. Results: The following approximation formula was obtained by multiple linear regression analysis: approximate GFR after 1 year (mL/min/1.73 m2) = −0.054 × age + 0.162 × hemoglobin − 0.085 × uric acid + 0.849 × eGFR + 11.5. The approximate GFR after 1 year was significantly and strongly correlated with the eGFR at that time (r = 0.884; p < 0.001). Conclusions: An approximation formula including age, hemoglobin, uric acid, and eGFR may be useful for predicting GFR after 1 year among members of the general population.
1. Introduction
Chronic kidney disease (CKD) is one of the most common diseases worldwide; its incidence and prevalence continue to increase each year [1]. CKD progression is associated with increased risks of mortality and cardiovascular events [2,3]. Therefore, early identification of individuals with a high risk of renal function decline is important for early interventions to prevent CKD progression.
Numerous factors have been reported to be associated with renal function decline, namely male sex, age, smoking, body mass index (BMI), systolic blood pressure (SBP), diastolic blood pressure (DBP), hemoglobin, uric acid, triglyceride, high-density lipoprotein cholesterol (HDL-C), low-density lipoprotein cholesterol (LDL-C), hemoglobin A1c, urinary protein, and estimated glomerular filtration rate (eGFR) (Table 1) [4,5,6,7,8,9,10,11,12,13,14,15,16,17,18,19,20,21,22]. In the previous studies that investigated the factors associated with renal function decline, the clinical outcomes examined were a decline in eGFR, progression of CKD, and progression to end-stage renal disease [4,5,6,7,8,9,10,11,12,13,14,15,16,17,18,19,20,21,22]. However, an approximation formula for the prediction of future renal function derived from risk factors associated with renal function decline has not yet been established. Therefore, in this study, we developed an approximation formula for predicting the GFR after 1 year using annual medical examination data from the general population of Japan.

Table 1.
Studies that investigated the factors associated with renal function decline.
2. Methods
2.1. Ethical Approval
This study was approved by the ethics committee of the Omiya Medical Association on 1 April 2016 (approval number: 2016001) and performed in accordance with ethical principles outlined in the Declaration of Helsinki. The ethics board waived the requirement for informed consent because of the retrospective nature of the study. Therefore, information regarding this study was displayed on notice boards in relevant institutions to inform all participants of their right to opt out.
2.2. Study Participants
We collected annual medical examination data of residents in Saitama City, Japan, from 2011 to 2019. All examinations were performed at primary care clinics and community hospitals in Saitama City. The inclusion criteria were age ≥20 years and participation in an annual medical examination for ≥2 consecutive years from 2011. The exclusion criteria were hemodialysis, peritoneal dialysis, and renal transplantation.
2.3. Study Design
This investigation was a retrospective population-based cohort study that utilized annual medical examination data for residents in Saitama City, Japan. Consecutive annual medical examination data from 2011 to 2019 were obtained by retrospective review of a medical database provided by Saitama City. The importance of each clinical parameter in terms of its association with the eGFR after 1 year was assessed by machine learning using the random forest method. An approximation formula for predicting GFR after 1 year was developed by multiple linear regression analysis based on the four most important clinical parameters. The relationship between the GFR after 1 year approximated by our formula and the eGFR after 1 year was analyzed using Pearson’s correlation coefficient. Agreement between the approximate GFR after 1 year and the eGFR after 1 year was analyzed using Bland–Altman analysis.
2.4. Laboratory Methods
Blood and urine parameters were measured by commercial or hospital laboratories. eGFR was calculated using a modified version of the Modification of Diet in Renal Disease formula from the Japanese Society of Nephrology: eGFR (mL/min/1.73 m2) = 194 × age−0.287 × serum creatinine−1.094 (multiplied by 0.739 for women) [23]. Blood pressure was measured with the participant in a sitting position at rest, using an automated upper arm cuff. Annual changes in clinical parameters were determined by subtracting the values from the values after 1 year.
2.5. Statistical Analyses
Data processing, machine learning implementation, and statistical analyses were performed using the KNIME Analytics Platform version 4.7.1 (KNIME, Zurich, Switzerland). We selected the clinical parameters that were available in the annual medical examination dataset of residents in Saitama City and were reported to be associated with renal function decline in previous reports. The final dataset included the following 14 variables: male sex, age, smoking, BMI, SBP, DBP, hemoglobin, uric acid, triglyceride, HDL-C, LDL-C, hemoglobin A1c, urinary protein, and eGFR; all variables were reportedly associated with renal function decline in previous studies (Table 1) [4,5,6,7,8,9,10,11,12,13,14,15,16,17,18,19,20,21,22]. Urinary protein was expressed in a semi-quantitative manner—grade 1, −; grade 2, ±; grade 3, 1+; grade 4, 2+; grade 5, ≥3+—because urinalysis was performed with a urine dipstick test in annual medical examination. Data were expressed as means ± standard deviations for continuous variables, and as counts and percentages for categorical variables. Data were normalized and divided into a training set and test set. We used 80% of the data for training and the remaining 20% to validate the results. Afterward, the importance of each parameter was assessed using a machine learning-based random forest method, sorted in descending order, and illustrated using a bar chart. Next, test data were applied to the prediction model and the accuracy of the model was evaluated (Figure 1). The first dataset included 14 independent variables: sex, age, smoking history, BMI, SBP, DBP, hemoglobin, uric acid, triglyceride, HDL-C, LDL-C, hemoglobin A1c, urinary protein, and eGFR. The second dataset included 14 independent variables: sex, age, annual change in smoking history, annual change in BMI, annual change in SBP, annual change in DBP, annual change in hemoglobin, annual change in uric acid, annual change in triglyceride, annual change in HDL-C, annual change in LDL-C, annual change in hemoglobin A1c, annual change in urinary protein, and eGFR. Annual changes in sex, age, and eGFR were not used as independent variables because sex cannot be changed, the annual change in age was 1 year for all participants, and annual change in eGFR was the dependent variable. Based on a previous report that showed that four-variable and eight-variable equations are similar with respect to predictive accuracy [24], the four most important parameters in terms of associations with eGFR after 1 year, according to the random forest method, were included in multiple linear regression analysis. Data were divided into a training set and test set. We used 80% of the data for training and the remaining 20% to validate the results. Next, an approximation formula was established by multiple linear regression analysis using the forced entry method. After test data were applied to the approximation formula, missing values were excluded and the accuracy of the formula was evaluated (Figure 2). We performed two sets of multiple linear regression analyses: one focused on clinical parameters and the other focused on annual changes in clinical parameters. Correlation between the approximate GFR after 1 year and the eGFR after 1 year was evaluated using Pearson’s correlation coefficient. Agreement between the approximate GFR after 1 year and the eGFR after 1 year was assessed using Bland–Altman analysis. p values < 0.05 were considered statistically significant.
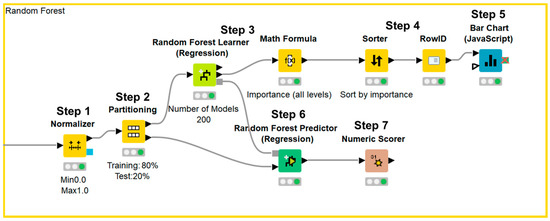
Figure 1.
KNIME workflow for random forest method.
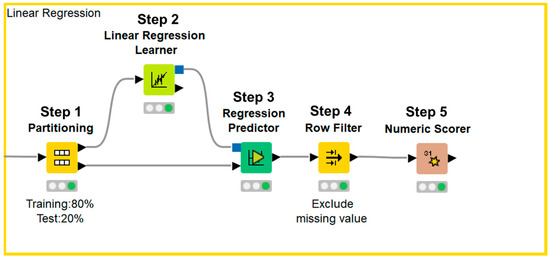
Figure 2.
KNIME workflow for multiple linear regression analysis.
Data were normalized (Step 1) and divided into a training set and test set (Step 2). Afterward, the importance of each parameter was assessed using the random forest method (Step 3), sorted in descending order (Step 4), and illustrated using a bar chart (Step 5). Next, test data were applied to the prediction model (Step 6) and the accuracy of the model was evaluated (Step 7).
Data were divided into a training set and test set (Step 1). Next, an approximation formula was established by multiple linear regression analysis using the forced entry method (Step 2). After test data were applied to the approximation formula (Step 3), missing values were excluded (Step 4) and the accuracy of the formula was evaluated (Step 5).
3. Results
3.1. Participant Characteristics
The baseline characteristics of the study participants are summarized in Table 2. In total, 349,050 records were obtained for 41,337 participants (16,918 men, 24,419 women; mean age: 64.0 ± 6.9 years; BMI: 22.8 ± 3.2 kg/m2). Four thousand five hundred and sixty-one participants (11.0%) had a past or current history of smoking. The mean SBP and DBP were 128.2 ± 16.2 mmHg and 76.3 ± 10.6 mmHg, respectively. The mean hemoglobin level was 13.8 ± 1.3 g/dL, the mean uric acid level was 5.2 ± 1.3 mg/dL, the mean triglyceride level was 108.9 ± 68.0 mg/dL, the mean HDL-C level was 63.8 ± 15.8 mg/dL, the mean LDL-C level was 126.2 ± 30.0 mg/dL, and the mean hemoglobin A1c level was 5.9 ± 0.6%. Urinary protein grades were −, 86.0%; ±, 8.8%; 1+, 4.0%; 2+, 1.0%; and ≥3+, 0.2%. Figure 3 shows the eGFR trend during the study period. The mean eGFR at baseline was 74.3 ± 14.2 mL/min/1.73 m2, and eGFR gradually declined during the study period.
Table 2.
Baseline participant characteristics.
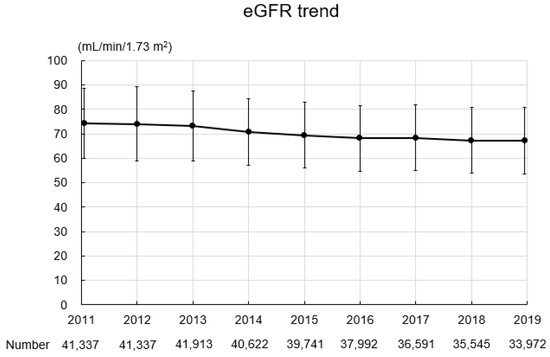
Figure 3.
eGFR trend during the study period. Abbreviation: eGFR, estimated glomerular filtration rate.
3.2. Importance of Clinical Parameters in Terms of Associations with eGFR after 1 Year
Figure 4 shows the importance of each parameter in terms of its association with the eGFR after 1 year. We performed multiple linear regression analysis using the four most important parameters according to the random forest method. This analysis revealed that age (coefficient (β) = −0.054, p < 0.001), hemoglobin (β = 0.162, p < 0.001), uric acid (β = −0.085, p < 0.001), and eGFR (β = 0.849, p < 0.001) were independently correlated with the eGFR after 1 year (Table 3 (A)).
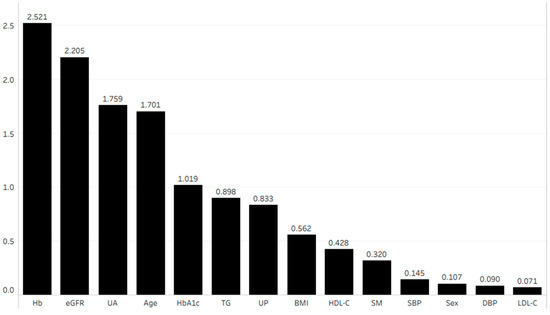
Figure 4.
Importance of each parameter in terms of its association with eGFR after 1 year. Abbreviations: BMI, body mass index; DBP, diastolic blood pressure; eGFR, estimated glomerular filtration rate; Hb, hemoglobin; HbA1c, hemoglobin A1c; HDL-C, high-density lipoprotein cholesterol; LDL-C, low-density lipoprotein cholesterol; SBP, systolic blood pressure; SM, smoking history; TG, triglyceride; UA, uric acid; UP, urinary protein.
Table 3.
Multiple linear regression analysis of variables correlated with the eGFR after 1 year.
We also performed multiple linear regression analysis using the four most important annual changes in parameters according to the random forest method. This analysis revealed that age (β = −0.050, p < 0.001), annual change in hemoglobin (β = −0.398, p < 0.001), annual change in uric acid (β = −3.205, p < 0.001), and eGFR (β = 0.864, p < 0.001) were independently correlated with the eGFR after 1 year (Table 3 (B)).
3.3. Formula for Approximation of GFR after 1 Year
An approximation formula was developed using variables that showed a significant correlation with the eGFR after 1 year according to multiple linear regression analysis. We developed two formulas: one focused on clinical parameters and the other focused on annual changes in clinical parameters.
Approximate GFR after 1 year (mL/min/1.73 m2) = −0.054 × age + 0.162 × hemoglobin − 0.085 × uric acid + 0.849 × eGFR + 11.5
Approximate GFR after 1 year (mL/min/1.73 m2) = − 0.050 × age − 0.398 × annual change in hemoglobin − 3.205 × annual change in uric acid + 0.864 × eGFR + 11.9
3.4. Correlation between the Approximate GFR after 1 Year and the eGFR after 1 Year
The approximate GFR after 1 year calculated by our formula with clinical parameters (Formula (1)) was significantly and strongly correlated with the eGFR at that time (r = 0.884; p < 0.001). The approximate GFR after 1 year calculated by our formula with annual changes in clinical parameters (Formula (2)) was also significantly and strongly correlated with the eGFR at that time (r = 0.894; p < 0.001).
3.5. Agreement between the Approximate GFR after 1 Year and the eGFR after 1 Year
Bland–Altman analysis showed a moderate agreement between approximate GFR after 1 year calculated by our formula with clinical parameters and eGFR at that time. In total, 97.7% of the points were included within the mean difference ± 1.96 standard deviation (0.0 ± 12.8) (Figure 5). This analysis also showed a moderate agreement between approximate GFR after 1 year calculated by our formula with annual changes in clinical parameters and eGFR at that time. In total, 97.6% of the points were included within the mean difference ± 1.96 standard deviation (0.0 ± 12.1).
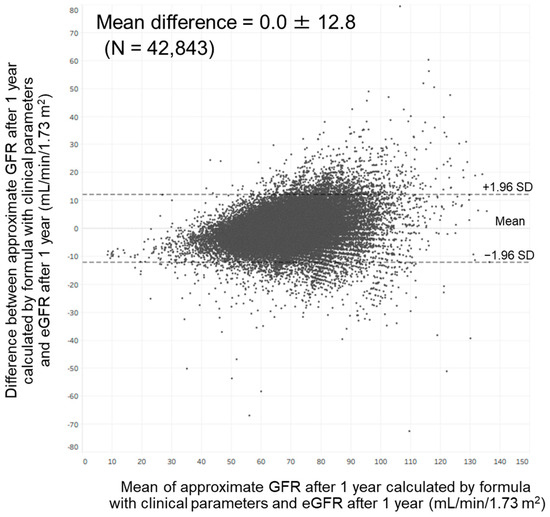
Figure 5.
Bland–Altman plot comparing approximate GFR after 1 year calculated by our formula with clinical parameters and estimated GFR after 1 year. Abbreviations: eGFR, estimated glomerular filtration rate; GFR, glomerular filtration rate; SD: standard deviation.
4. Discussion
In the present study, we found that age, hemoglobin, uric acid, and eGFR were associated with the eGFR after 1 year among members of the general population in Japan. We also found that age, annual change in hemoglobin, annual change in uric acid, and eGFR were associated with the eGFR after 1 year in this population. These findings enabled us to develop an approximation formula for predicting GFR after 1 year; the approximate GFR calculated by this formula was strongly correlated with the eGFR after 1 year. However, as shown in Figure 5, variation between approximate GFR after 1 year and eGFR after 1 year became greater as eGFR after 1 year became higher. It has been reported that variation between GFR measured by inulin clearance and eGFR calculated by the Modification of Diet in Renal Disease formula became greater as the GFR became higher [23]. These findings suggest that the development of an approximation formula for predicting the GFR after 1 year might be challenging among members of the general population.
A higher serum uric acid concentration is reportedly associated with a more rapid decline in creatinine clearance among patients with CKD G1-4 [25]. An observational study showed that an increased serum uric acid concentration was associated with a higher incidence of end-stage kidney disease among patients with CKD G3-4 [26]. Several observational studies involving members of the general population showed that a change in the serum uric acid concentration was negatively associated with a change in the eGFR [15,27]. In the present study, the eGFR after 1 year was negatively associated with the serum uric acid concentration and the annual change in serum uric acid concentration among members of the general population. These results suggest that the serum uric acid concentration is negatively associated with changes in renal function in the population both with and without CKD.
There is evidence that the eGFR declines more rapidly as the hemoglobin concentration decreases among patients with CKD G2-5 [13]. In an observational study, a decreased hemoglobin concentration was associated with a higher incidence of end-stage kidney disease among patients with CKD G4-5 [28]. Several observational studies of healthy individuals showed that a lower hemoglobin concentration was associated with more rapid eGFR decline [12,29]. In the present study, the hemoglobin concentration was positively associated with the eGFR after 1 year among members of the general population. These findings suggest that the hemoglobin concentration is positively associated with changes in renal function in the population both with and without CKD. However, the present study also showed that the annual change in hemoglobin concentration was negatively associated with the eGFR after 1 year. Mild renal dysfunction is suspected to enhance renal erythropoietin production in early-stage CKD [30]. A longitudinal cohort study revealed that eGFR decline was associated with an increase in hemoglobin concentration among individuals with normal or mildly decreased renal function [31]. In the present study, the change in hemoglobin concentration was inversely correlated with the eGFR after 1 year among members of the general population with preserved renal function, consistent with the previous findings [31]. Further studies are needed to elucidate the pathogenesis involved in the inverse relationship between the change in renal function and the change in hemoglobin concentration among members of the general population.
In living kidney donors, the GFR declines with increasing age [32]. An observational study involving the general population indicated that eGFR decreased as age increased [22]. In the present study, age was negatively associated with the eGFR after 1 year among members of the general population. These findings suggest that age is negatively associated with changes in renal function in the population both with and without CKD.
In the general population, there is evidence that eGFR decline accelerates as eGFR decreases [33]. In the present study, eGFR was positively associated with the eGFR after 1 year among members of the general population. These results suggest that current renal function data are essential for predicting subsequent changes in renal function among members of the general population.
A large population-based cohort study involving 120,727 individuals in Japan reported that the prevalences of CKD G3 and G4-5 were 21.35% and 0.01%, respectively [33]. In the present study, the prevalences of CKD G3, G4, and G5 were 14.6%, 0.1%, and 0.0%, respectively, which was similar to the result of previous study [33].
This study had two main advantages. First, it was a large-scale cohort study involving approximately 40,000 individuals in the general population, and it analyzed clinical parameters associated with the eGFR after 1 year. We confirmed that age, hemoglobin, uric acid, and eGFR are associated with a future change in eGFR, as reported in a population with CKD. The results of our study can facilitate further research to identify clinical factors associated with future change in eGFR among members of the general population. Second, to our knowledge, this is the first study to develop an approximation formula for predicting GFR after 1 year using clinical parameters associated with the eGFR after 1 year. The approximation formula derived from age, hemoglobin, uric acid, and eGFR may be useful in the prediction of GFR after 1 year among members of the general population.
This study also had some limitations. First, its retrospective design might have led to some reporting and selection biases. Second, all participants were residents of Japan, which might reduce the generalizability of the findings. Additional prospective studies involving multiethnic populations are needed to confirm our findings. Third, we used a two-point method to calculate the annual changes in clinical parameters including hemoglobin and uric acid, which may have introduced larger variability because it does not contain any information between the two points [34]. Fourth, we used the random forest method as a machine learning algorithm because it is superior with respect to high accuracy, good performance with many variables, and resistance to a large amount of learning data [35]. However, the conclusion can hardly be stronger than the stringency of the data which entered the machine learning algorithm. Fifth, in the present study, we developed an approximation formula for predicting GFR after 1 year using eGFR after 1 year calculated by the Modification of Diet in Renal Disease formula as a reference standard. However, it has been shown that variation between GFR measured by inulin clearance and eGFR calculated by the Modification of Diet in Renal Disease formula was greater in the population without CKD [23]. The possibility remains that our formula may not accurately approximate GFR after 1 year among members of the general population. Sixth, in the present study, we did not analyze the clinical parameters associated with the annual change in eGFR. Therefore, further studies are required to assess the accuracy of the approximation formula derived from clinical parameters associated with the annual change in eGFR, in comparison with that of the approximation formula derived from clinical parameters associated with the eGFR after 1 year.
In conclusion, age, hemoglobin, uric acid, and eGFR were associated with the eGFR after 1 year among members of the general population in Japan. An approximation formula including age, hemoglobin, uric acid, and eGFR may be useful for predicting GFR after 1 year in the general population. However, there was a non-negligible discrepancy between the approximate GFR after 1 year and the eGFR after 1 year. This study provides the foundation for additional research to develop an approximation formula for predicting GFR in the general population.
Author Contributions
K.N. and Y.K. conceived the study and established the study design. F.M., H.S., T.T., T.Y. and M.M. collected the data. T.S., K.S. and Z.Z. analyzed the data. K.H. and T.K. wrote the first draft of the manuscript. K.I. and S.O. made critical revisions to the manuscript. Y.M. approved the final version of the manuscript. All authors have read and agreed to the published version of the manuscript.
Funding
This research received no external funding.
Institutional Review Board Statement
This study was approved by the ethics committee of the Omiya Medical Association on 1 April 2016 (approval number: 2016001) and performed in accordance with ethical principles outlined in the Declaration of Helsinki.
Informed Consent Statement
The ethics board waived the requirement for informed consent because of the retrospective nature of the study. Therefore, information regarding this study was displayed on notice boards in relevant institutions to inform all participants of their right to opt out.
Data Availability Statement
Datasets used in the current study are available from the corresponding author on reasonable request.
Acknowledgments
We thank the Saitama City National Health Insurance and Pension Division for providing the medical examination data used in the present study.
Conflicts of Interest
The author Keiji Nakayama was employed by the company Nakayama Clinic, the author Fujiko Morita was employed by the company Morita Clinic, the author Hajime Satomura was employed by the company Satomura Clinic, the author Takahisa Tanaka was employed by the company Tanaka Diabetes Clinic Omiya, the author Toru Yoshioka was employe by the company Toru Yoshioka, the author Masahiko Matsumoto was employed by the company Matsumoto Clinic, the author Yuichi Kimura was employed by the companies LIMNO Co., Ltd and BioICT Co., Ltd, the authors Koji Sasaki and Zhiying Zhang have been employed by the company Azest, Inc. The remaining authors declare that the research was conducted in the absence of any commercial or financial relationships that could be construed as a potential conflict of interest.
References
- Kovesdy, C.P. Epidemiology of chronic kidney disease: An update 2022. Kidney Int. Suppl. 2022, 12, 7–11. [Google Scholar] [CrossRef] [PubMed]
- Tellez-Plaza, M.; Orozco-Beltran, D.; Gil-Guillen, V.; Pita-Fernandez, S.; Navarro-Perez, J.; Pallares, V.; Valls, F.; Fernandez, A.; Perez-Navarro, A.M.; Sanchis, C.; et al. Renal function and attributable risk of death and cardiovascular hospitalization in patients with cardiovascular risk factors from a registry-based cohort: The Estudio Cardiovascular Valencia-risk study. J. Hypertens. 2016, 34, 2266–2273. [Google Scholar] [CrossRef] [PubMed]
- Tanaka, K.; Watanabe, T.; Takeuchi, A.; Ohashi, Y.; Nitta, K.; Akizawa, T.; Matsuo, S.; Imai, E.; Makino, H.; Hishida, A.; et al. Cardiovascular events and death in Japanese patients with chronic kidney disease. Kidney Int. 2017, 91, 227–234. [Google Scholar] [CrossRef] [PubMed]
- Swartling, O.; Rydell, H.; Stendahl, M.; Segelmark, M.; Trolle Lagerros, Y.; Evans, M. CKD Progression and Mortality Among Men and Women: A Nationwide Study in Sweden. Am. J. Kidney Dis. 2021, 78, 190–199.e1. [Google Scholar] [CrossRef]
- Chesnaye, N.C.; Dekker, F.W.; Evans, M.; Caskey, F.J.; Torino, C.; Postorino, M.; Szymczak, M.; Ramspek, C.L.; Drechsler, C.; Wanner, C.; et al. Renal function decline in older men and women with advanced chronic kidney disease-results from the EQUAL study. Nephrol. Dial. Transplant. 2021, 36, 1656–1663. [Google Scholar] [CrossRef] [PubMed]
- Rule, A.D.; Amer, H.; Cornell, L.D.; Taler, S.J.; Cosio, F.G.; Kremers, W.K.; Textor, S.C.; Stegall, M.D. The association between age and nephrosclerosis on renal biopsy among healthy adults. Ann. Int. Med. 2010, 152, 561–567. [Google Scholar] [CrossRef] [PubMed]
- Choi, H.S.; Han, K.D.; Oh, T.R.; Kim, C.S.; Bae, E.H.; Ma, S.K.; Kim, S.W. Smoking and risk of incident end-stage kidney disease in general population: A Nationwide Population-based Cohort Study from Korea. Sci. Rep. 2019, 9, 19511. [Google Scholar] [CrossRef] [PubMed]
- Ito, J.; Fukagawa, M. Slope of the estimated glomerular filtration rate and its associated factors among individuals with chronic kidney disease in the general Japanese population. Clin. Exp. Nephrol. 2024, 28, 522–530. [Google Scholar] [CrossRef]
- Hung, C.C.; Yu, P.H.; Niu, S.W.; Kuo, I.C.; Lee, J.J.; Shen, F.C.; Chang, J.M.; Hwang, S.J. Association between Body Mass Index and Renal Outcomes Modified by Chronic Kidney Disease and Anemia: The Obesity Paradox for Renal Outcomes. J. Clin. Med. 2022, 11, 2787. [Google Scholar] [CrossRef]
- Lee, K.P.; Kim, Y.S.; Yoon, S.A.; Han, K.; Kim, Y.O. Association between Blood Pressure and Renal Progression in Korean Adults with Normal Renal Function. J. Korean Med. Sci. 2020, 35, e312. [Google Scholar] [CrossRef]
- Lee, J.Y.; Park, J.T.; Joo, Y.S.; Lee, C.; Yun, H.R.; Yoo, T.H.; Kang, S.W.; Choi, K.H.; Ahn, C.; Oh, K.H.; et al. Association of Blood Pressure With the Progression of CKD: Findings from KNOW-CKD Study. Am. J. Kidney Dis. 2021, 78, 236–245. [Google Scholar] [CrossRef] [PubMed]
- Yang, C.; Meng, Q.; Wang, H.; Wang, Y.; Su, Z.; Liu, L.; Liu, W.; Kong, G.; Zhang, L.; Zhao, Y.; et al. Anemia and Kidney Function Decline among the Middle-Aged and Elderly in China: A Population-Based National Longitudinal Study. Biomed. Res. Int. 2020, 2020, 2303541. [Google Scholar] [CrossRef]
- Pan, W.; Han, Y.; Hu, H.; He, Y. Association between hemoglobin and chronic kidney disease progression: A secondary analysis of a prospective cohort study in Japanese patients. BMC Nephrol. 2022, 23, 295. [Google Scholar] [CrossRef]
- Tseng, W.C.; Chen, Y.T.; Lin, Y.P.; Ou, S.M.; Yang, C.Y.; Lin, C.H.; Tarng, D.C.; Taiwan Geriatric Kidney Disease Research, G. Hyperuricemia Predicts an Early Decline in Renal Function among Older People: A Community-Based Cohort Study. Sci. Rep. 2019, 9, 980. [Google Scholar] [CrossRef] [PubMed]
- Xiong, J.; Zheng, X.; Luo, J.; Luo, X.; Zhang, Y.; Xu, L.; Wang, Y. A follow-up study to explore factors associated with rapid kidney function decline and new-onset kidney disease among Chinese elderly population. Geriatr. Gerontol. Int. 2022, 22, 968–975. [Google Scholar] [CrossRef]
- Zhang, X.; Wang, B.; Yang, J.; Wang, J.; Yu, Y.; Jiang, C.; Xie, L.; Song, Y.; Zhong, B.; Li, Y.; et al. Serum Lipids and Risk of Rapid Renal Function Decline in Treated Hypertensive Adults with Normal Renal Function. Am. J. Hypertens. 2019, 32, 393–401. [Google Scholar] [CrossRef]
- Rahman, M.; Yang, W.; Akkina, S.; Alper, A.; Anderson, A.H.; Appel, L.J.; He, J.; Raj, D.S.; Schelling, J.; Strauss, L.; et al. Relation of serum lipids and lipoproteins with progression of CKD: The CRIC study. Clin. J. Am. Soc. Nephrol. 2014, 9, 1190–1198. [Google Scholar] [CrossRef]
- de Goeij, M.C.; Rotmans, J.I.; Matthijssen, X.; de Jager, D.J.; Dekker, F.W.; Halbesma, N.; Group, P.-S. Lipid levels and renal function decline in pre-dialysis patients. Nephron Extra 2015, 5, 19–29. [Google Scholar] [CrossRef] [PubMed]
- Jiang, G.; Luk, A.O.Y.; Tam, C.H.T.; Xie, F.; Carstensen, B.; Lau, E.S.H.; Lim, C.K.P.; Lee, H.M.; Ng, A.C.W.; Ng, M.C.Y.; et al. Progression of diabetic kidney disease and trajectory of kidney function decline in Chinese patients with Type 2 diabetes. Kidney Int. 2019, 95, 178–187. [Google Scholar] [CrossRef]
- Moriya, T.; Hayashi, A.; Matsubara, M.; Suzuki, A.; Ouchi, M. Glucose control, diabetic retinopathy, and hemodialysis induction in subjects with normo-microalbuminuric type 2 diabetic patients with normal renal function followed for 15 years. J. Diabetes Complicat. 2022, 36, 108080. [Google Scholar] [CrossRef]
- Su, W.Y.; Wu, P.Y.; Huang, J.C.; Chen, S.C.; Chang, J.M. Increased Proteinuria is Associated with Increased Aortic Arch Calcification, Cardio-Thoracic Ratio, Rapid Renal Progression and Increased Overall and Cardiovascular Mortality in Chronic Kidney Disease. Int. J. Med. Sci. 2020, 17, 1102–1111. [Google Scholar] [CrossRef]
- Baba, M.; Shimbo, T.; Horio, M.; Ando, M.; Yasuda, Y.; Komatsu, Y.; Masuda, K.; Matsuo, S.; Maruyama, S. Longitudinal Study of the Decline in Renal Function in Healthy Subjects. PLoS ONE 2015, 10, e0129036. [Google Scholar] [CrossRef] [PubMed]
- Matsuo, S.; Imai, E.; Horio, M.; Yasuda, Y.; Tomita, K.; Nitta, K.; Yamagata, K.; Tomino, Y.; Yokoyama, H.; Hishida, A.; et al. Revised equations for estimated GFR from serum creatinine in Japan. Am. J. Kidney Dis. 2009, 53, 982–992. [Google Scholar] [CrossRef] [PubMed]
- Tangri, N.; Grams, M.E.; Levey, A.S.; Coresh, J.; Appel, L.J.; Astor, B.C.; Chodick, G.; Collins, A.J.; Djurdjev, O.; Elley, C.R.; et al. Multinational Assessment of Accuracy of Equations for Predicting Risk of Kidney Failure: A Meta-analysis. JAMA 2016, 315, 164–174. [Google Scholar] [CrossRef]
- Ohno, I.; Hosoya, T.; Gomi, H.; Ichida, K.; Okabe, H.; Hikita, M. Serum uric acid and renal prognosis in patients with IgA nephropathy. Nephron 2001, 87, 333–339. [Google Scholar] [CrossRef]
- Uchida, S.; Chang, W.X.; Ota, T.; Tamura, Y.; Shiraishi, T.; Kumagai, T.; Shibata, S.; Fujigaki, Y.; Hosoyamada, M.; Kaneko, K.; et al. Targeting Uric Acid and the Inhibition of Progression to End-Stage Renal Disease—A Propensity Score Analysis. PLoS ONE 2015, 10, e0145506. [Google Scholar] [CrossRef]
- Iseki, K.; Iseki, C.; Kinjo, K. Changes in serum uric acid have a reciprocal effect on eGFR change: A 10-year follow-up study of community-based screening in Okinawa, Japan. Hypertens. Res. 2013, 36, 650–654. [Google Scholar] [CrossRef] [PubMed]
- Yamamoto, T.; Miyazaki, M.; Nakayama, M.; Yamada, G.; Matsushima, M.; Sato, M.; Sato, T.; Taguma, Y.; Sato, H.; Ito, S. Impact of hemoglobin levels on renal and non-renal clinical outcomes differs by chronic kidney disease stages: The Gonryo study. Clin. Exp. Nephrol. 2016, 20, 595–602. [Google Scholar] [CrossRef] [PubMed]
- Lee, Y.T.; Chiu, H.C.; Su, H.M.; Yang, J.F.; Voon, W.C.; Lin, T.H.; Lai, W.T.; Sheu, S.H. Lower hemoglobin concentrations and subsequent decline in kidney function in an apparently healthy population aged 60 year and older. Clin. Chim. Acta 2008, 389, 25–30. [Google Scholar] [CrossRef]
- Oh, S.W.; Baek, S.H.; Kim, Y.C.; Goo, H.S.; Chin, H.J.; Na, K.Y.; Chae, D.W.; Kim, S. Higher hemoglobin level is associated with subtle declines in renal function and presence of cardiorenal risk factors in early CKD stages. Nephrol. Dial. Transplant. 2012, 27, 267–275. [Google Scholar] [CrossRef][Green Version]
- Shin, N.; Kim, H.; Kim, H.J.; Han, M.; Lee, S.; Jo, H.; Hyuk, H.; Chin, H.J. A mild decrease of renal function is related to increased hemoglobin level during 5-year follow-up period. Korean J. Int. Med. 2014, 29, 341–351. [Google Scholar] [CrossRef]
- Poggio, E.D.; Rule, A.D.; Tanchanco, R.; Arrigain, S.; Butler, R.S.; Srinivas, T.; Stephany, B.R.; Meyer, K.H.; Nurko, S.; Fatica, R.A.; et al. Demographic and clinical characteristics associated with glomerular filtration rates in living kidney donors. Kidney Int. 2009, 75, 1079–1087. [Google Scholar] [CrossRef]
- Imai, E.; Horio, M.; Yamagata, K.; Iseki, K.; Hara, S.; Ura, N.; Kiyohara, Y.; Makino, H.; Hishida, A.; Matsuo, S. Slower decline of glomerular filtration rate in the Japanese general population: A longitudinal 10-year follow-up study. Hypertens. Res. 2008, 31, 433–441. [Google Scholar] [CrossRef]
- Fay, M.P.; Tiwari, R.C.; Feuer, E.J.; Zou, Z. Estimating average annual percent change for disease rates without assuming constant change. Biometrics 2006, 62, 847–854. [Google Scholar] [CrossRef]
- Dineva, K.; Atanasova, T. Systematic Look at Machine Learning Algorithms–Advantages, Disadvantages and Practical Applications. In Proceedings of the 20th International Multidisciplinary Scientific GeoConference SGEM 2020, Albena, Bulgaria, 16–25 August 2020; pp. 317–324. [Google Scholar]


Disclaimer/Publisher’s Note: The statements, opinions and data contained in all publications are solely those of the individual author(s) and contributor(s) and not of MDPI and/or the editor(s). MDPI and/or the editor(s) disclaim responsibility for any injury to people or property resulting from any ideas, methods, instructions or products referred to in the content. |
© 2024 by the authors. Licensee MDPI, Basel, Switzerland. This article is an open access article distributed under the terms and conditions of the Creative Commons Attribution (CC BY) license (https://creativecommons.org/licenses/by/4.0/).