
Factors to Describe the Outcome Characteristics of a CI Recipient
 and
and
Abstract
1. Introduction
2. Materials and Methods
2.1. Research Participants and Classification
2.2. Audiometric Test Procedures
2.3. Questionnaires
2.4. Analysis
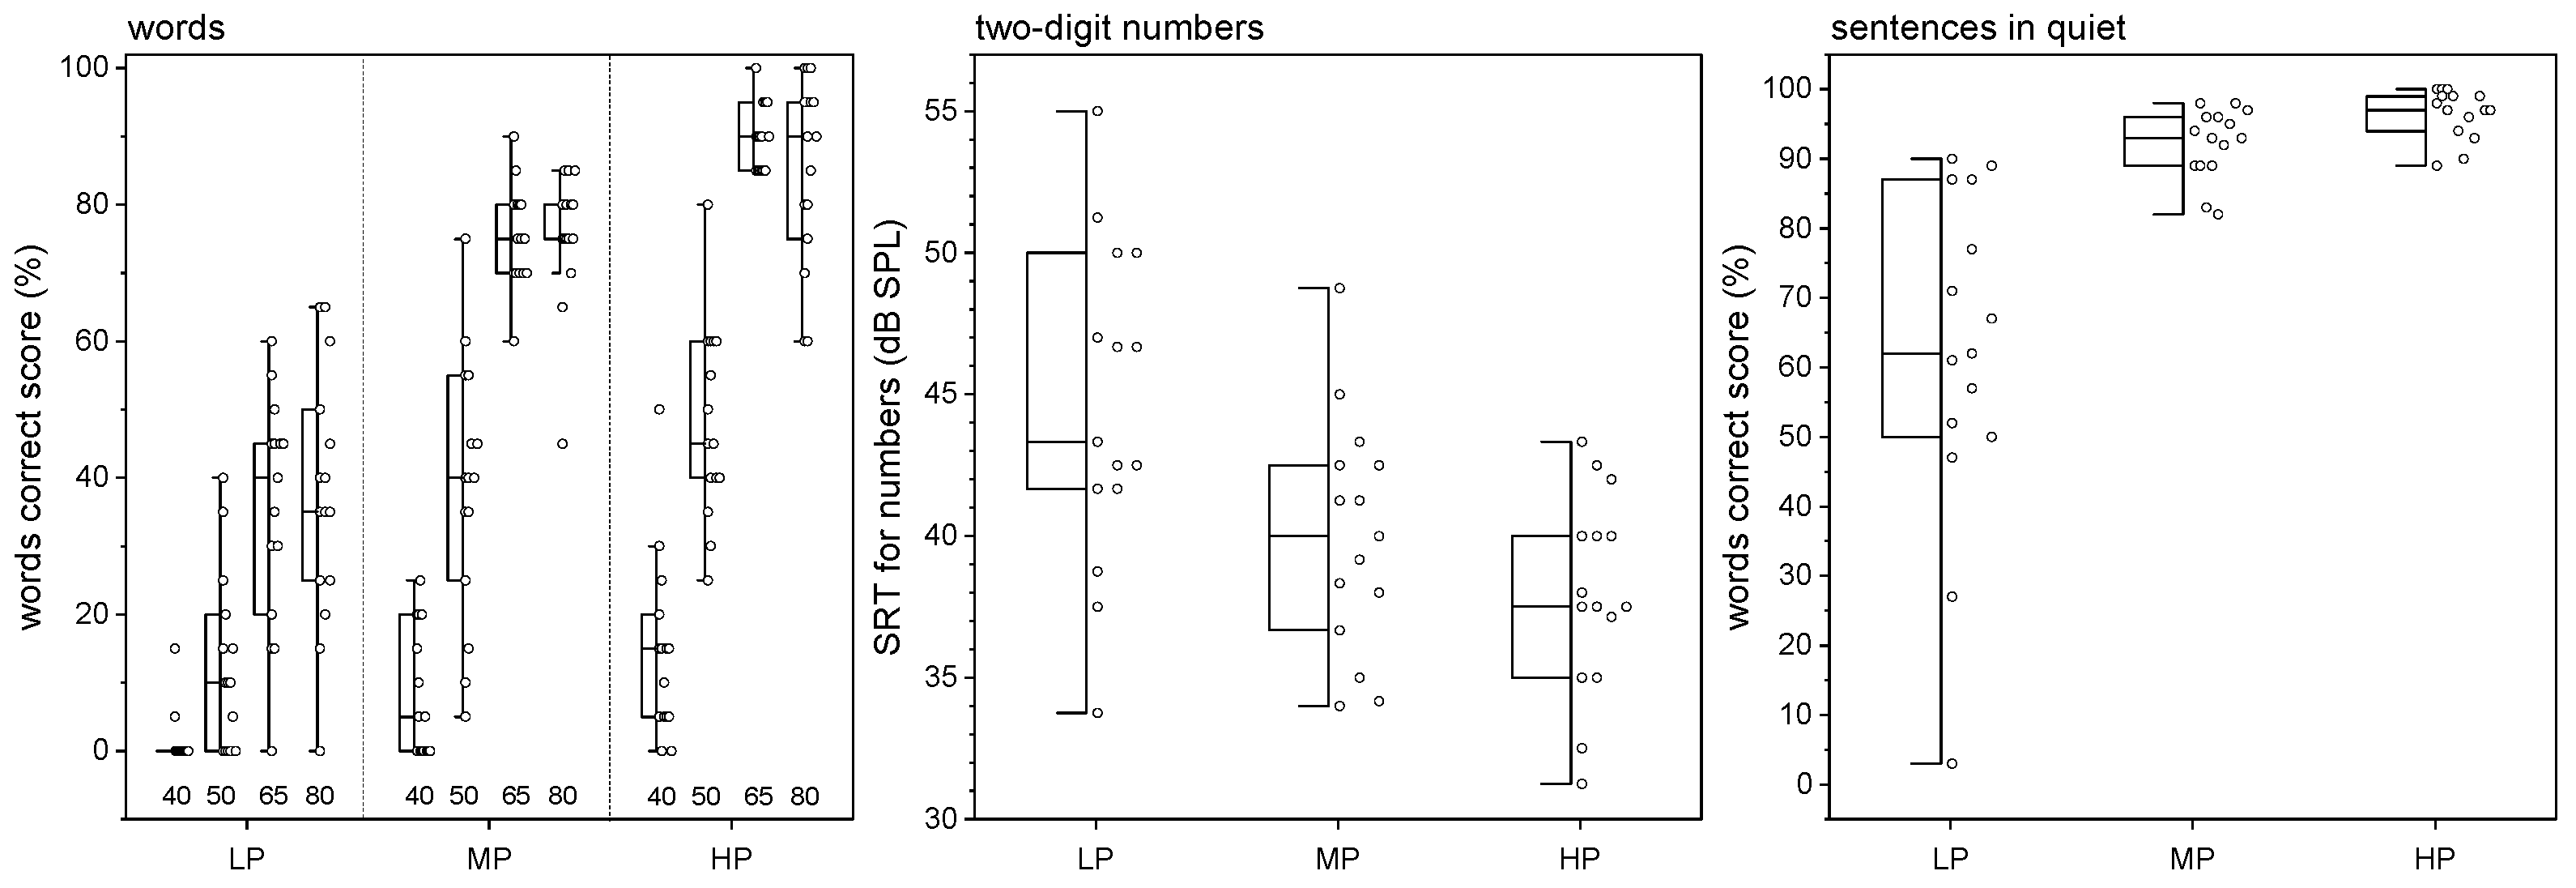
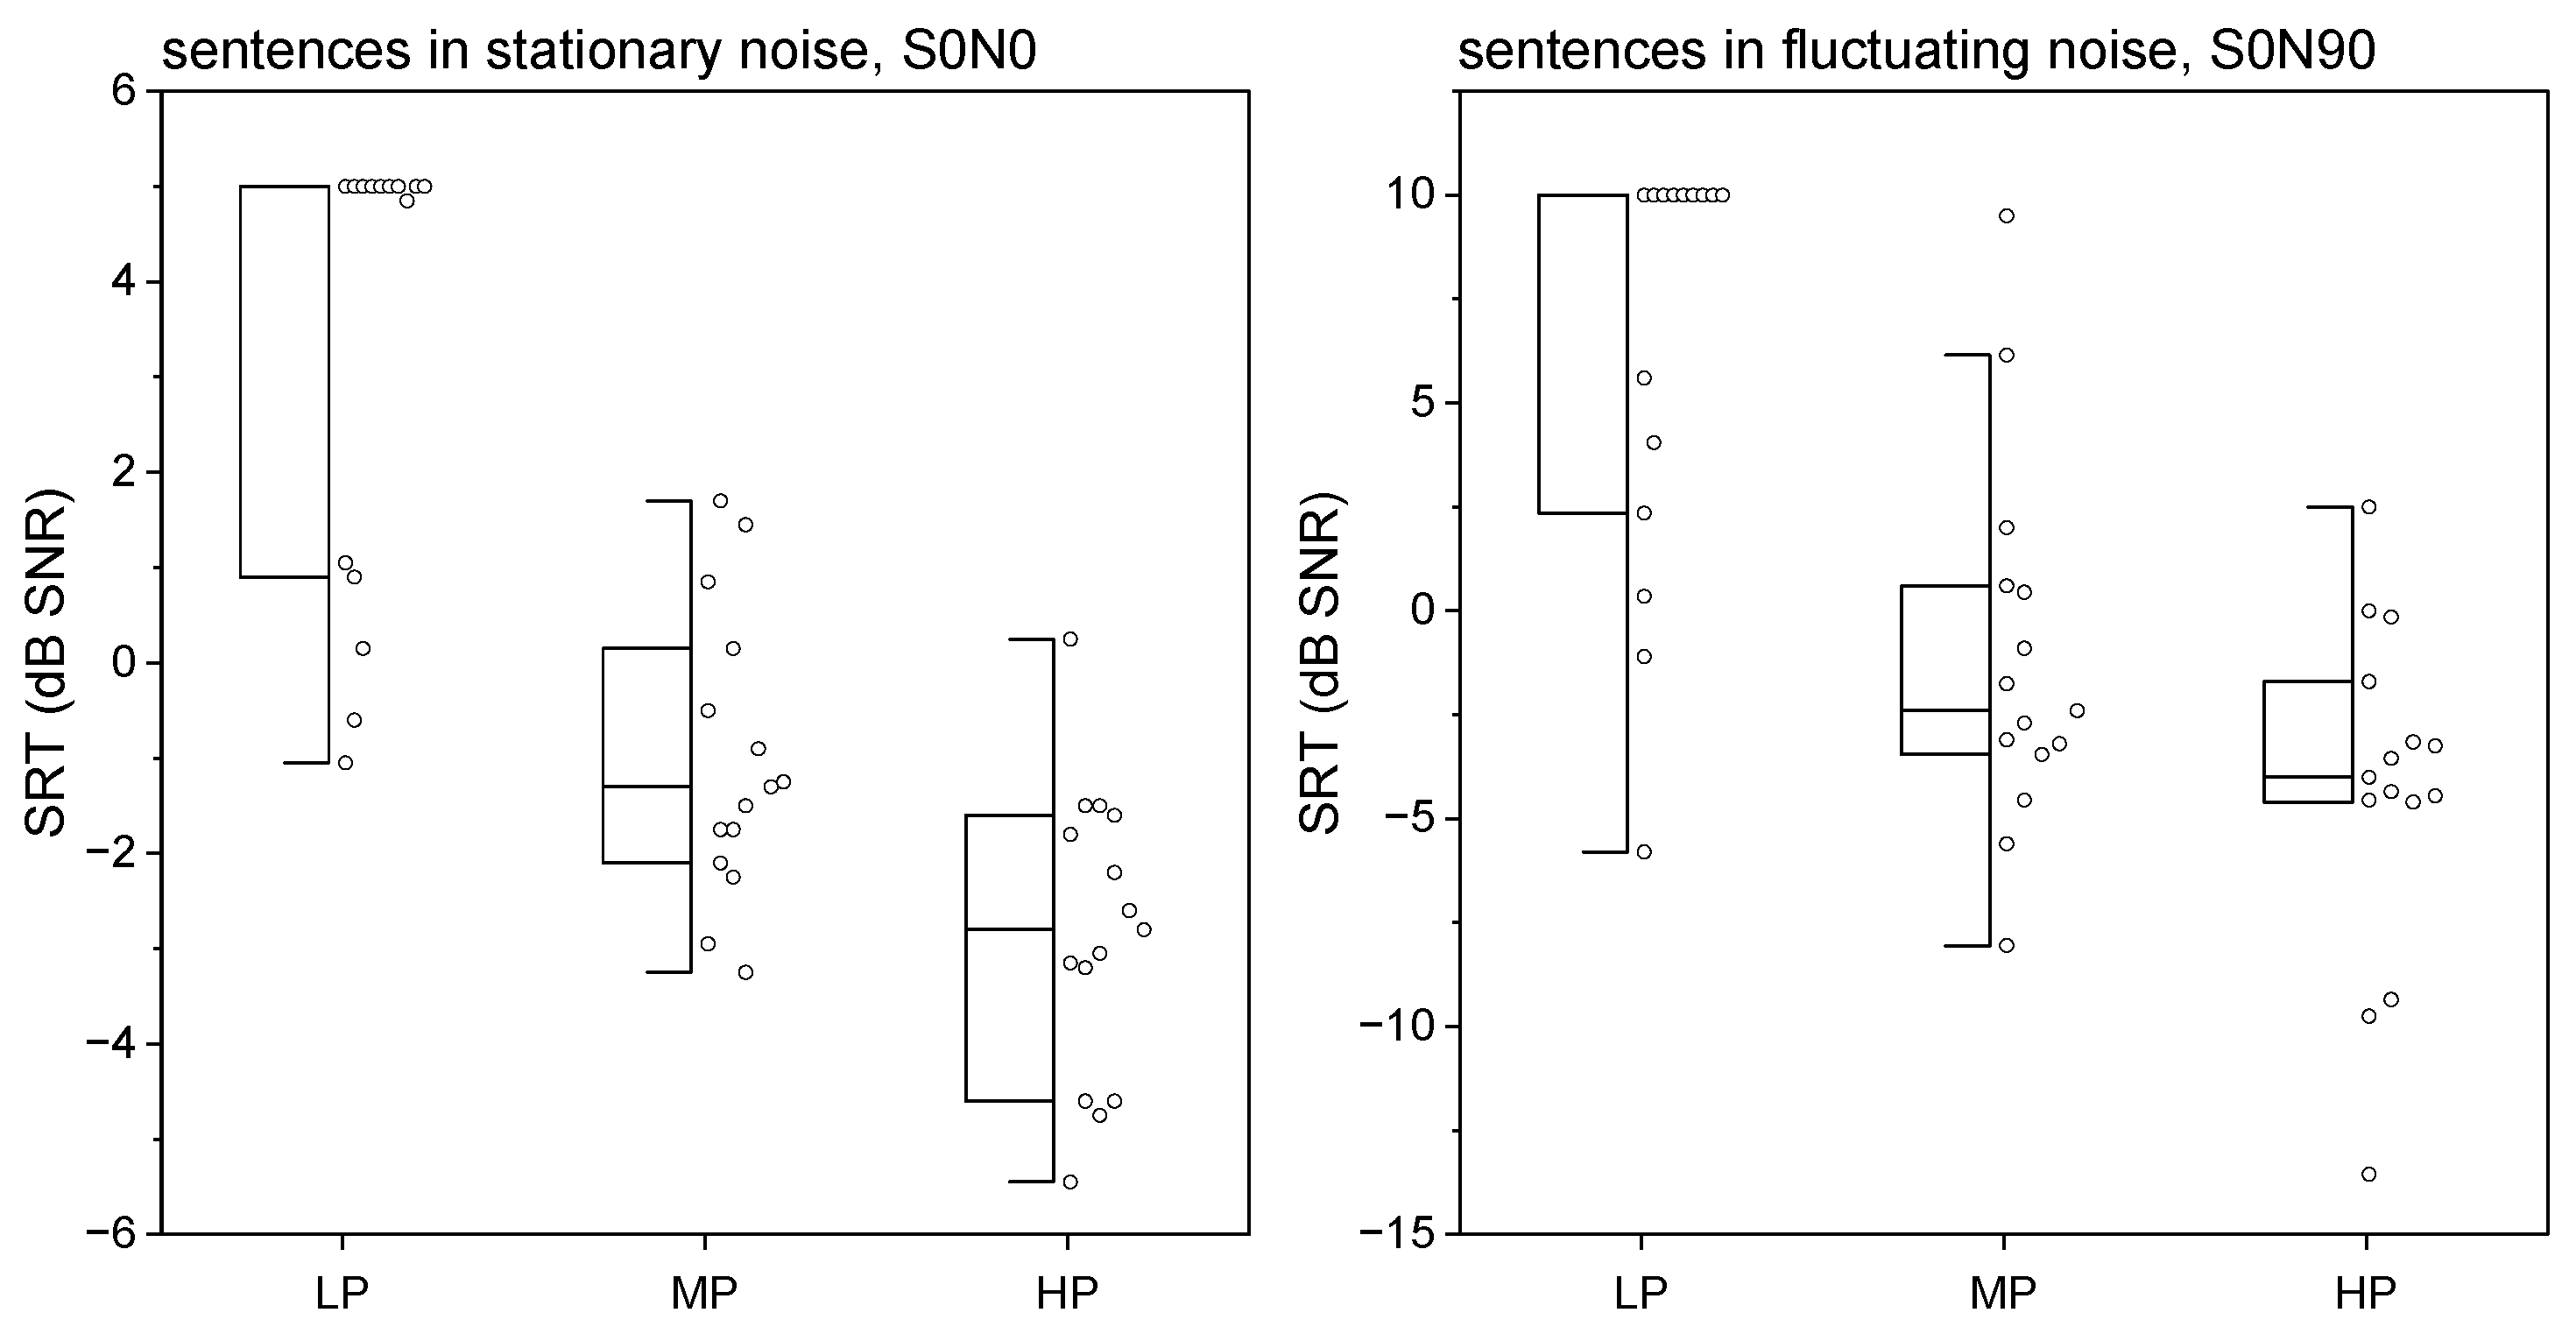
3. Results
4. Discussion
4.1. 1st Component—Supra-Threshold Speech Recognition
4.2. 2nd Component—Audibility
4.3. 3rd Component—Patient-Reported Outcome
4.4. Limitations of the Study
5. Conclusions
Author Contributions
Funding
Institutional Review Board Statement
Informed Consent Statement
Data Availability Statement
Acknowledgments
Conflicts of Interest
References
- Clark, G. (Ed.) Cochlear Implants. Fundamentals and Applications; Springer: New York, NY, USA, 2003. [Google Scholar] [CrossRef]
- Lehnhardt, E.; Battmer, R.D.; Nakahodo, K.; Laszig, R. Cochlear implants. HNO 1986, 34, 271–279. [Google Scholar] [PubMed]
- Dhanasingh, A.; Hochmair, I. Thirty Years of Translational Research Behind MED-EL. Acta Oto-Laryngol. 2021, 141. [Google Scholar] [CrossRef] [PubMed]
- NICE. Cochlear implants for children and adults with severe to profound deafness. NICE Technol. Apprais. Guid. 2019, 166, 1–41. [Google Scholar]
- Van Der Straaten, T.F.K.; Briaire, J.J.; Vickers, D.; Boermans, P.P.B.M.; Frijns, J.H.M. Selection Criteria for Cochlear Implantation in the United Kingdom and Flanders: Toward a Less Restrictive Standard. Ear Hear. 2021, 42, 68–75. [Google Scholar] [CrossRef]
- Lailach, S.; Neudert, M.; Zahnert, T. Update Cochlea-Implantation: Indikationsstellung und Operation. Laryngo-Rhino-Otol. 2021, 100, 652–672. [Google Scholar] [CrossRef]
- Laszig, R.; Lehnhardt, E. Cochlear implant. Ein elektronische Hörprothese. Dt. Ärztebl. 1987, 45, 3033–3038. [Google Scholar]
- Battmer, R.D.; Lehnhardt, E. Clark implantable auditory prosthesis. Prerequisites and technic; report on the cochlear implant project of the ENT clinic of the Medical School in Hannover. Fortschritte Der Med. 1985, 103, 397–400. [Google Scholar]
- Battmer, R.D.; Lehnhardt, E.; Laszig, R. The promontory test and electrocochleography with reference to indications for cochlear implant. HNO 1986, 34, 139–142. [Google Scholar]
- Burian, K.; Hochmair-Desoyer, I.J.; Eisenwort, B. The Vienna cochlear implant program. Otolaryngol. Clin. N. Am. 1986, 19, 313–328. [Google Scholar] [CrossRef]
- Franke-Trieger, A.; Lailach, S.; Shetty, J.; Murrmann, K.; Zahnert, T.; Neudert, M. Word Recognition with a Cochlear Implant in Relation to Prediction and Electrode Position. J. Clin. Med. 2023, 13, 183. [Google Scholar] [CrossRef]
- Holden, L.K.; Finley, C.C.; Firszt, J.B.; Holden, T.A.; Brenner, C.; Potts, L.G.; Gotter, B.D.; Vanderhoof, S.S.; Mispagel, K.; Heydebrand, G.; et al. Factors affecting open-set word recognition in adults with cochlear implants. Ear Hear. 2013, 34, 342–360. [Google Scholar] [CrossRef] [PubMed]
- Büchner, A.; Schwebs, M.; Lenarz, T. Speech understanding and listening effort in cochlear implant users—Microphone beamformers lead to significant improvements in noisy environments. Cochlear Implant. Int. 2020, 21, 1–8. [Google Scholar] [CrossRef] [PubMed]
- Thangavelu, K.; Nitzge, M.; Weiß, R.M.; Mueller-Mazzotta, J.; Stuck, B.A.; Reimann, K. Role of cochlear reserve in adults with cochlear implants following post-lingual hearing loss. Eur. Arch. Oto-Rhino-Laryngol. 2022, 280, 1063–1071. [Google Scholar] [CrossRef] [PubMed]
- Rauch, A.K.; Metzner, T.; Aschendorff, A.; Arndt, S.; Speck, I.; Laszig, R.; Beck, R.L. Speech processor upgrade increases speech comprehension in patients with cochlear implants. Hno 2019, 67, 778–785. [Google Scholar] [CrossRef] [PubMed]
- Wimmer, W.; Weder, S.; Caversaccio, M.; Kompis, M. Speech intelligibility in noise with a pinna effect imitating cochlear implant processor. Otol. Neurotol. 2016, 37, 19–23. [Google Scholar] [CrossRef]
- Beyer, A.; Rieck, J.-H.; Mewes, A.; Dambon, J.A.; Hey, M. Erweiterte präoperative sprachaudiometrische Diagnostik im Rahmen der Cochleaimplantatversorgung. HNO 2023, 71, 779–786. [Google Scholar] [CrossRef] [PubMed]
- Hoppe, U.; Hast, A.; Hornung, J.; Hocke, T. Evolving a Model for Cochlear Implant Outcome. J. Clin. Med. 2023, 12, 6215. [Google Scholar] [CrossRef]
- Blamey, P.; Artieres, F.; Başkent, D.; Bergeron, F.; Beynon, A.; Burke, E.; Dillier, N.; Dowell, R.; Fraysse, B.; Gallégo, S.; et al. Factors affecting auditory performance of postlinguistically deaf adults using cochlear implants: An update with 2251 patients. Audiol. Neurotol. 2012, 18, 36–47. [Google Scholar] [CrossRef] [PubMed]
- Moberly, A.C.; Bates, C.; Harris, M.S.; Pisoni, D.B. The Enigma of Poor Performance by Adults With Cochlear Implants. Otol. Neurotol. 2016, 37, 1522–1528. [Google Scholar] [CrossRef]
- Hoppe, U.; Hocke, T.; Hast, A.; Iro, H. Cochlear Implantation in Candidates with Moderate-to-Severe Hearing Loss and Poor Speech Perception. Laryngoscope 2021, 131, E940–E945. [Google Scholar] [CrossRef]
- Goudey, B.; Plant, K.; Kiral, I.; Jimeno-Yepes, A.; Swan, A.; Gambhir, M.; Büchner, A.; Kludt, E.; Eikelboom, R.H.; Sucher, C.; et al. A MultiCenter Analysis of Factors Associated with Hearing Outcome for 2735 Adults with Cochlear Implants. Trends Hear. 2021, 25. [Google Scholar] [CrossRef]
- Rieck, J.H.; Beyer, A.; Mewes, A.; Caliebe, A.; Hey, M. Extended Preoperative Audiometry for Outcome Prediction and Risk Analysis in Patients Receiving Cochlear Implants. J. Clin. Med. 2023, 12, 3262. [Google Scholar] [CrossRef] [PubMed]
- Hoth, S.; Müller-Deile, J. Audiologische Rehabilitation von Kochleaimplantat-Trägern. HNO 2009, 57, 635–648. [Google Scholar] [CrossRef] [PubMed]
- Maier, H.; Baumann, U.; Baumgartner, W.-D.; Beutner, D.; Caversaccio, M.D.; Keintzel, T.; Kompis, M.; Lenarz, T.; Magele, A.; Mewes, T.; et al. Minimal Reporting Standards for Active Middle Ear Hearing Implants. Audiol. Neurotol. 2018, 23, 105–115. [Google Scholar] [CrossRef]
- Beutner, D.; Adano; Delb, W.; Frenzel, H.; Hoppe, U.; Hüttenbrink, K.B.; Mlynski, R.; Limberger, A.; Schönweiler, R.; Schwab, B.; et al. Guideline “Implantable hearing aids”—Short version: German S2k guideline of the Working Group of German-speaking Audiologists, Neurootologists and Otologists (ADANO), of the German Society of Oto-Rhino-Laryngology, Head and Neck Surgery (DGHNO) in collabo. HNO 2018, 66, 654–659. [Google Scholar] [CrossRef] [PubMed]
- Busch, T.; Vanpoucke, F.; van Wieringen, A. Auditory environment across the life span of cochlear implant users: Insights from data logging. J. Speech Lang. Hear. Res. 2017, 60, 1362–1377. [Google Scholar] [CrossRef]
- Oberhoffner, T.; Hoppe, U.; Hey, M.; Hecker, D.; Bagus, H.; Voigt, P.; Schicktanz, S.; Braun, A.; Hocke, T. Multicentric analysis of the use behavior of cochlear implant users. Laryngo-Rhino-Otol. 2018, 97, 313–320. [Google Scholar] [CrossRef]
- Hey, M.; Hocke, T.; Ambrosch, P. Speech audiometry and data logging in CI patients: Implications for adequate test levels. HNO 2018, 66, S22–S27. [Google Scholar] [CrossRef]
- Wu, Y.H.; Stangl, E.; Zhang, X.; Bentler, R.A. Construct validity of the ecological momentary assessment in audiology research. J. Am. Acad. Audiol. 2015, 26, 872–884. [Google Scholar] [CrossRef]
- Xu, D.; Yapanel, U.; Gray, S. Reliability of the LENATM Language Environment Analysis System in Young Children’s Natural Home Environment. 2009. Available online: https://www.lena.org/wp-content/uploads/2016/07/LTR-05-2_Reliability.pdf (accessed on 30 June 2016).
- Schvartz-Leyzac, K.C.; Conrad, C.A.; Zwolan, T.A. Datalogging Statistics and Speech Recognition during the First Year of Use in Adult Cochlear Implant Recipients. Otol. Neurotol. 2019, 40, E686–E693. [Google Scholar] [CrossRef]
- Hey, M.; Böhnke, B.; Mewes, A.; Munder, P.; Mauger, S.J.; Hocke, T. Speech comprehension across multiple CI processor generations: Scene dependent signal processing. Laryngoscope Investig. Otolaryngol. 2021, 6, 807–815. [Google Scholar] [CrossRef]
- Dziemba, O.C.; Merz, S.; Hocke, T. Evaluative audiometry after cochlear implant provision. HNO 2023, 72, 56–62. [Google Scholar] [CrossRef]
- Mauger, S.J.; Warren, C.D.; Knight, M.R.; Goorevich, M.; Nel, E. Clinical evaluation of the Nucleus 6 cochlear implant system: Performance improvements with SmartSound iQ. Int. J. Audiol. 2014, 53, 564–576. [Google Scholar] [CrossRef] [PubMed]
- Rader, T.; Doms, P.; Adel, Y.; Weissgerber, T.; Strieth, S.; Baumann, U. A method for determining precise electrical hearing thresholds in cochlear implant users. Int. J. Audiol. 2018, 57, 502–509. [Google Scholar] [CrossRef]
- Wagener, K.; Kühnel, V.; and Kollmeier, B. Entwicklung und Evaluation eines Satztests in deutscher Sprache I–III: Design, Optimierung und Evaluation des Oldenburger Satztests. Z. Für Audiol. /Audiol. Acoust. 1999, 38, 4–15. [Google Scholar]
- Kollmeier, B.; Warzybok, A.; Hochmuth, S.; Zokoll, M.A.; Uslar, V.; Brand, T.; Wagener, K.C. The multilingual matrix test: Principles, applications, and comparison across languages: A review. Int. J. Audiol. 2015, 54, 3–16. [Google Scholar] [CrossRef]
- Meister, H. Speech comprehension and cognitive performance in acoustically difficult situations. HNO 2019, 68, 171–176. [Google Scholar] [CrossRef]
- Rahne, T.; Wagner, T.M.; Kopsch, A.C.; Plontke, S.K.; Wagner, L. Influence of Age on Speech Recognition in Noise and Hearing Effort in Listeners with Age-Related Hearing Loss. J. Clin. Med. 2023, 12, 6133. [Google Scholar] [CrossRef] [PubMed]
- Keidser, G.; Naylor, G.; Brungart, D.S.; Caduff, A.; Campos, J.; Carlile, S.; Carpenter, M.G.; Grimm, G.; Hohmann, V.; Holube, I.; et al. The Quest for Ecological Validity in Hearing Science: What It Is, Why It Matters, and How to Advance It. Ear Hear. 2020, 41, 5S–19S. [Google Scholar] [CrossRef] [PubMed]
- Holube, I.; von Gablenz, P.; Bitzer, J. Ecological Momentary Assessment in Hearing Research: Current State, Challenges, and Future Directions. Ear Hear. 2020, 41, 79S–90S. [Google Scholar] [CrossRef]
- Volleth, N.; Hast, A.; Lehmann, E.K.; Hoppe, U. Subjektive Hörverbesserung durch Cochleaimplantatversorgung. HNO 2018, 66, 613–620. [Google Scholar] [CrossRef]
- Tolisano, A.M.; Pillion, E.M.; Dirks, C.E.; Ryan, M.T.; Bernstein, J.G.W. Quality of Life Impact of Cochlear Implantation for Single-Sided Deafness: Assessing the Interrelationship of Objective and Subjective Measures. Otol. Neurotol. 2023, 44, E125–E132. [Google Scholar] [CrossRef] [PubMed]
- Plesch, J.; Ernst, B.P.; Strieth, S.; Rader, T. A psychoacoustic application for the adjustment of electrical hearing thresholds in cochlear implant patients. PLoS ONE 2019, 14, e0223625. [Google Scholar] [CrossRef] [PubMed]
- Weissgerber, T.; Löschner, M.; Stöver, T.; Baumann, U. Outcome Prediction of Speech Perception in Quiet and in Noise for Cochlear Implant Candidates Based on Pre-Operative Measures. J. Clin. Med. 2024, 13, 994. [Google Scholar] [CrossRef]
- Lenarz, M.; Sönmez, H.; Joseph, G.; Büchner, A.; Lenarz, T. Long-term performance of cochlear implants in postlingually deafened adults. Otolaryngol.-Head Neck Surg. 2012, 147, 112–118. [Google Scholar] [CrossRef]
- Krueger, B.; Joseph, G.; Rost, U.; Strau-Schier, A.; Lenarz, T.; Buechner, A. Performance Groups in Adult Cochlear Implant Users. Otol. Neurotol. 2008, 29, 509–512. [Google Scholar] [CrossRef] [PubMed]
- ISO 8253-2; Acoustics—Audiometric Test Methods—Part 2: Sound Field Audiometry with Pure-Tone and Narrow-Band Test Signals. International Organization for Standardization: Geneva, Switzerland, 2010. [CrossRef]
- Hahlbrock, K. Speech audiometry and new word-tests. Arch. Für Ohren- Nasen- Und Kehlkopfheilkd 1953, 162, 394–431. [Google Scholar] [CrossRef]
- Brand, T.; Kollmeier, B. Efficient adaptive procedures for threshold and concurrent slope estimates for psychophysics and speech intelligibility tests. J. Acoust. Soc. Am. 2002, 111, 2801–2810. [Google Scholar] [CrossRef] [PubMed]
- Hey, M.; Hocke, T.; Hedderich, J.; Müller-Deile, J. Investigation of a matrix sentence test in noise: Reproducibility and discrimination function in cochlear implant patients. Int. J. Audiol. 2014, 53, 895–902. [Google Scholar] [CrossRef] [PubMed]
- Deutsche Gesellschaft für Hals-Nasen-Ohren-Heilkunde Kopf- und Hals-Chirurgie e.V. (DGHNO-KHC). S2k-Leitlinie Cochlea-Implantat Versorgung. 2020. Available online: https://www.awmf.org/uploads/tx_szleitlinien/017-071l_S2k_Cochlea-Implantat-Versorgung-zentral-auditorische-Implantate_2020-12.pdf (accessed on 3 May 2024).
- Rader, T.; Fastl, H.; Baumann, U. Speech perception with combined electric-acoustic stimulation and bilateral cochlear implants in a multisource noise field. Ear Hear. 2013, 34, 324–332. [Google Scholar] [CrossRef]
- Dreschler, W.A.; Verschuure, H.; Ludvigsen, C.; Westermann, S. ICRA Noises: Artificial Noise Signals with Speech-like Spectral and Temporal Properties for Hearing Instrument Assessment. Int. J. Audiol. 2001, 40, 148–157. [Google Scholar] [CrossRef]
- Hey, M.; Mewes, A.; Hocke, T. Speech comprehension in noise—Considerations for ecologically valid assessment of communication skills ability with cochlear implants. HNO 2023, 71, 26–34. [Google Scholar] [CrossRef]
- Gatehouse, S.; Noble, I. The Speech, Spatial and Qualities of Hearing Scale (SSQ). Int. J. Audiol. 2004, 43, 85–99. [Google Scholar] [CrossRef]
- Kießling, J.; Grugel, L.; Meister, H.; Meis, M. Übertragung der Fragebögen SADL, ECHO und Übertragung der Fragebögen SADL, ECHO und SSQ ins Deutsche und deren Evaluation. ZfA 2011, 49, 6–16. [Google Scholar]
- Singh, G.; Kathleen Pichora-Fuller, M. Older adults’ performance on the speech, spatial, and qualities of hearing scale (SSQ): Test-retest reliability and a comparison of interview and self-administration methods. Int. J. Audiol. 2010, 49, 733–740. [Google Scholar] [CrossRef] [PubMed]
- Schulte, M.; Meis, M.; Wagener, K. Der Höranstrengungs-Fragebogen. 18. Jahrestag. Der Dtsch. Ges. Für Audiol. 2015, 4, 7.3. [Google Scholar]
- Klopp, E. Explorative Faktorenanalyse. 2010. Available online: https://psycharchives.org/en/item/8bd2d5e7-0941-4198-ab23-e94e19e47223 (accessed on 3 May 2024).
- Winkler, A.; Holube, I. Test-Retest-Reliabilität des Freiburger Einsilbertests. HNO 2016, 64, 564–571. [Google Scholar] [CrossRef] [PubMed]
- Browning, L.M.; Nie, Y.; Rout, A.; Heiner, M. Audiologists’ preferences in programming cochlear implants: A preliminary report. Cochlear Implant. Int. 2020, 21, 179–191. [Google Scholar] [CrossRef] [PubMed]
- Busby, P.A.; Arora, K. Effects of threshold adjustment on speech perception in nucleus cochlear implant recipients. Ear Hear. 2016, 37, 303–311. [Google Scholar] [CrossRef]
- De Graaff, F.; Lissenberg-Witte, B.I.; Kaandorp, M.W.; Merkus, P.; Goverts, S.T.; Kramer, S.E.; Smits, C. Relationship between Speech Recognition in Quiet and Noise and Fitting Parameters, Impedances and ECAP Thresholds in Adult Cochlear Implant Users. Ear Hear. 2020, 41, 935–947. [Google Scholar] [CrossRef]
- Hinderink, J.B.; Krabbe, P.F.M.; Van Den Broek, P. Development and application of a health-related quality-of-life instrument for adults with cochlear implants: The Nijmegen Cochlear Implant Questionnaire. Otolaryngol.-Head Neck Surg. 2000, 123, 756–765. [Google Scholar] [CrossRef] [PubMed]
- McRackan, T.R.; Bauschard, M.; Hatch, J.L.; Franko-Tobin, E.; Droghini, H.R.; Nguyen, S.A.; Dubno, J.R. Meta-analysis of quality-of-life improvement after cochlear implantation and associations with speech recognition abilities. Laryngoscope 2018, 128, 982–990. [Google Scholar] [CrossRef] [PubMed]
- Capretta, N.R.; Moberly, A.C. Does quality of life depend on speech recognition performance for adult cochlear implant users? Laryngoscope 2016, 126, 699–706. [Google Scholar] [CrossRef] [PubMed]
- Ovari, A.; Hühnlein, L.; Nguyen-Dalinger, D.; Strüder, D.F.; Külkens, C.; Niclaus, O.; Meyer, J.E. Functional Outcomes and Quality of Life after Cochlear Implantation in Patients with Long-Term Deafness. J. Clin. Med. 2022, 11, 5156. [Google Scholar] [CrossRef]
- Weissgerber, T.; Rader, T.; Baumann, U. Effectiveness of directional microphones in bilateral/bimodal cochlear implant users-impact of spatial and temporal noise characteristics. Otol. Neurotol. 2017, 38, e551–e557. [Google Scholar] [CrossRef]
- Müller, A.; Hocke, T.; Mir-Salim, P. Intraoperative findings on ECAP-measurement: Normal or special case? Int. J. Audiol. 2015, 54, 257–264. [Google Scholar] [CrossRef]
- Hoppe, U.; Hocke, T.; Hast, A.; Iro, H. Maximum preimplantation monosyllabic score as predictor of cochlear implant outcome. HNO 2019, 67, 62–68. [Google Scholar] [CrossRef]


| Study Population | LP Group | MP Group | HP Group | |
|---|---|---|---|---|
| Group Size | 45 | 15 | 15 | 15 |
| Age (years) | 61.4 ± 12.6 | 55.7 ± 12.9 | 63.7 ± 14.0 | 64.8 ± 9.3 |
| Time after CI surgery (years) | 6.2 ± 4.1 | 7.0 ± 5.3 | 4.8 ± 1.6 | 6.9 ± 4.3 |
| Use time of CI per day (h) | 13.7 ± 3.0 | 13.0 ± 3.7 | 13.4 ± 2.5 | 14.7 ± 2.7 |
| Hearing solution | ||||
| binaural (right) | 14 | 4 | 5 | 5 |
| binaural (left) | 9 | 4 | 1 | 4 |
| bimodal (right) | 14 | 5 | 5 | 4 |
| bimodal (left) | 4 | 0 | 2 | 2 |
| monaural (right) | 2 | 1 | 1 | 0 |
| monaural (left) | 2 | 1 | 1 | 0 |
| Speech processor | ||||
| CP1100 | 2 | 1 | 0 | 1 |
| CP1000 | 37 | 13 | 13 | 11 |
| CP1000 Hybrid | 2 | 0 | 0 | 2 |
| CP910 | 3 | 1 | 2 | 0 |
| CP910 Hybrid | 1 | 0 | 0 | 1 |
| Cochlear implant | ||||
| CIx32 | 33 | 9 | 14 | 10 |
| CIx12 | 4 | 2 | 0 | 2 |
| CI24RE(CA) | 8 | 4 | 1 | 3 |
| 1st Component | 2nd Component | 3rd Component | |
|---|---|---|---|
| SRT for numbers | −0.24 | −0.75 | −0.17 |
| Words 40 dB SPL | 0.22 | 0.68 | 0.05 |
| Words 50 dB SPL | 0.47 | 0.86 | 0.05 |
| Words 65 dB SPL | 0.82 | 0.45 | 0.20 |
| Words 80 dB SPL | 0.88 | 0.26 | 0.25 |
| Sentences in quiet | 0.81 | 0.32 | 0.27 |
| SRT in stationary noise (S0N0) | −0.79 | −0.41 | −0.19 |
| SRT in fluctuating noise (S0NCI) | −0.81 | −0.22 | −0.13 |
| Questionnaire ‘SSQ’ | 0.14 | 0.10 | 0.98 |
| Questionnaire ‘listening effort’ | −0.21 | −0.07 | −0.53 |
Disclaimer/Publisher’s Note: The statements, opinions and data contained in all publications are solely those of the individual author(s) and contributor(s) and not of MDPI and/or the editor(s). MDPI and/or the editor(s) disclaim responsibility for any injury to people or property resulting from any ideas, methods, instructions or products referred to in the content. |
© 2024 by the authors. Licensee MDPI, Basel, Switzerland. This article is an open access article distributed under the terms and conditions of the Creative Commons Attribution (CC BY) license (https://creativecommons.org/licenses/by/4.0/).
Share and Cite
Hey, M.; Kogel, K.; Dambon, J.; Mewes, A.; Jürgens, T.; Hocke, T. Factors to Describe the Outcome Characteristics of a CI Recipient. J. Clin. Med. 2024, 13, 4436. https://doi.org/10.3390/jcm13154436
Hey M, Kogel K, Dambon J, Mewes A, Jürgens T, Hocke T. Factors to Describe the Outcome Characteristics of a CI Recipient. Journal of Clinical Medicine. 2024; 13(15):4436. https://doi.org/10.3390/jcm13154436
Chicago/Turabian StyleHey, Matthias, Kevyn Kogel, Jan Dambon, Alexander Mewes, Tim Jürgens, and Thomas Hocke. 2024. "Factors to Describe the Outcome Characteristics of a CI Recipient" Journal of Clinical Medicine 13, no. 15: 4436. https://doi.org/10.3390/jcm13154436
APA StyleHey, M., Kogel, K., Dambon, J., Mewes, A., Jürgens, T., & Hocke, T. (2024). Factors to Describe the Outcome Characteristics of a CI Recipient. Journal of Clinical Medicine, 13(15), 4436. https://doi.org/10.3390/jcm13154436