

Sex-Related Differences in Life Expectancy Compared to General Population after Surgery for Ascending Aortic Aneurysm

 , ,
, ,  , , , and
Abstract
:1. Introduction
2. Methods
2.1. Study Design
2.2. Endpoints
2.3. Statistical Analyses
3. Results
3.1. Matched Sample
3.2. Relative Survival
4. Discussion
4.1. Relative Survival after Ascending Aortic Aneurysm Surgery
4.2. Sex as a Risk Factor for Long-Term Mortality
4.3. Limitations
5. Conclusions
Supplementary Materials
Author Contributions
Funding
Institutional Review Board Statement
Informed Consent Statement
Data Availability Statement
Conflicts of Interest
References
- Almendárez, M.; Álvarez-Velasco, R.; Avanzas, P.; Alperi, A.; Gutiérrez, L.; Ledesma, D.; Martínez, J.; Hernández-Vaquero, D.; Lorca, R.; Arboine, L.; et al. STEMI in women. Life expectancy recovery after primary percutaneous coronary intervention. Rev. Espanola Cardiol. 2023, 76, 1003–1012. [Google Scholar] [CrossRef]
- Eifert, S.; Pfannmüller, B.; Garbade, J.; Vollroth, M.; Misfeld, M.; Borger, M.; Mohr, F.W.; Seeburger, J. Gender differences in mitral valve surgery. Thorac. Cardiovasc. Surg. 2013, 61, 042–046. [Google Scholar] [CrossRef]
- Gauci, S.; Cartledge, S.; Redfern, J.; Gallagher, R.; Huxley, R.; Lee, C.M.Y.; Vassallo, A.; O’neil, A. Biology, Bias, or Both? The Contribution of Sex and Gender to the Disparity in Cardiovascular Outcomes Between Women and Men. Curr. Atheroscler. Rep. 2022, 24, 701–708. [Google Scholar] [CrossRef] [PubMed]
- Hernandez-Vaquero, D.; Rodriguez-Caulo, E.; Vigil-Escalera, C.; Blanco-Herrera, O.; Berastegui, E.; Arias-Dachary, J.; Souaf, S.; Parody, G.; Laguna, G.; Adsuar, A.; et al. Differences in life expectancy between men and women after aortic valve replacement. Eur. J. Cardio-Thoracic Surg. 2021, 60, 681–688. [Google Scholar] [CrossRef] [PubMed]
- Sampson, U.K.; Norman, P.E.; Fowkes, F.G.R.; Aboyans, V.; Song, Y.; Harrell, F.E.H., Jr.; Forouzanfar, M.H.; Naghavi, M.; Denenberg, J.O.; McDermott, M.M.; et al. Global and regional burden of aortic dissection and aneurysms: Mortality trends in 21 world regions, 1990 to 2010. Glob. Heart 2014, 9, 171–180.e10. [Google Scholar] [CrossRef] [PubMed]
- McClure, R.S.; Brogly, S.B.; Lajkosz, K.; Payne, D.; Hall, S.F.; Johnson, A.P. Epidemiology and management of thoracic aortic dissections and thoracic aortic aneurysms in Ontario, Canada: A population-based study. J. Thorac. Cardiovasc. Surg. 2018, 155, 2254–2264.e4. [Google Scholar] [CrossRef] [PubMed]
- Crosier, R.; Laporte, M.A.L.; Unni, R.R.; Coutinho, T. Female-Specific Considerations in Aortic Health and Disease. CJC Open 2024, 6, 391. [Google Scholar] [CrossRef]
- Beller, C.J.; Farag, M.; Wannaku, S.; Seppelt, P.; Arif, R.; Ruhparwar, A.; Karck, M.; Weymann, A.; Kallenbach, K. Gender-Specific Differences in Outcome of Ascending Aortic Aneurysm Surgery. PLoS ONE 2015, 10, e0124461. [Google Scholar] [CrossRef] [PubMed]
- Chung, J.; Stevens, L.-M.; Ouzounian, M.; El-Hamamsy, I.; Bouhout, I.; Dagenais, F.; Cartier, A.; Peterson, M.D.; Boodhwani, M.; Guo, M.H.; et al. Sex-Related Differences in Patients Undergoing Thoracic Aortic Surgery: Evidence from the Canadian Thoracic Aortic Collaborative. Circulation 2019, 139, 1177–1184. [Google Scholar] [CrossRef]
- Voigt, K.R.; Gökalp, A.L.; Papageorgiou, G.; Bogers, A.J.; Takkenberg, J.J.; Mokhles, M.M.; Bekkers, J.A. Male-Female Differences in Ascending Aortic Aneurysm Surgery: 25-Year Single Center Results. Semin. Thorac. Cardiovasc. Surg. 2023, 35, 300–308. [Google Scholar] [CrossRef]
- Chung, J.C.-Y.; Bhatt, N.; Stevens, L.-M.; Nedadur, R.; Ibrahim, M.; Liblik, K.; Chu, M.W.A.; Ouzounian, M. Trends in sex-specific differences following aortic arch repair: Results from the Canadian Thoracic Aortic Collaborative. Ann. Cardiothorac. Surg. 2023, 12, 558. [Google Scholar] [CrossRef] [PubMed]
- Al-Tawil, M.; Friedrich, C.; Broll, A.; Salem, M.; Schoettler, J.; de Silva, N.; Kolat, P.; Schoeneich, F.; Haneya, A. Sex-based disparities in ascending aortic aneurysm surgery outcomes: A comprehensive analysis of 1148 consecutive patients with propensity-score matching. J. Cardiothorac. Surg. 2024, 19, 331. [Google Scholar] [CrossRef] [PubMed]
- Hernandez-Vaquero, D.; Silva, J.; Escalera, A.; Álvarez-Cabo, R.; Morales, C.; Díaz, R.; Avanzas, P.; Moris, C.; Pascual, I. Life Expectancy after Surgery for Ascending Aortic Aneurysm. J. Clin. Med. 2020, 9, 615. [Google Scholar] [CrossRef] [PubMed]
- Tablas de Mortalidad Por Año, Sexo, Edad y Funciones. Available online: https://www.ine.es/jaxiT3/Tabla.htm?t=27153&L=0 (accessed on 20 July 2023).
- Garcia-Garcia, H.M.; McFadden, E.P.; Farb, A.; Mehran, R.; Stone, G.W.; Spertus, J.; Onuma, Y.; Morel, M.-A.; van Es, G.-A.; Zuckerman, B.; et al. Standardized end point definitions for coronary intervention trials: The academic research consortium-2 consensus document. Circulation 2018, 137, 2635–2650. [Google Scholar] [CrossRef] [PubMed]
- Deb, S.; Austin, P.C.; Tu, J.V.; Ko, D.T.; Mazer, C.D.; Kiss, A.; Fremes, S.E. A Review of Propensity-Score Methods and Their Use in Cardiovascular Research. Can. J. Cardiol. 2016, 32, 259–265. [Google Scholar] [CrossRef]
- Seppä, K.; Hakulinen, T.; Pokhrel, A. Choosing the net survival method for cancer survival estimation. Eur. J. Cancer 2015, 51, 1123–1129. [Google Scholar] [CrossRef] [PubMed]
- Mariotto, A.B.; Noone, A.-M.; Howlader, N.; Cho, H.; Keel, G.E.; Garshell, J.; Woloshin, S.; Schwartz, L.M. Cancer Survival: An Overview of Measures, Uses, and Interpretation. JNCI Monogr. 2014, 2014, 145–186. [Google Scholar] [CrossRef]
- Dickman, P.W.; Coviello, E. Estimating and Modeling Relative Survival. Stata J. 2015, 15, 186–215. [Google Scholar] [CrossRef]
- Austin, P.C. An Introduction to Propensity Score Methods for Reducing the Effects of Confounding in Observational Studies. Multivar. Behav. Res. 2011, 46, 399. [Google Scholar] [CrossRef]
- Jann, B. 2017 London Stata Users Group Meeting. Kmatch: Kernel Matching with Automatic Bandwidth Selection|Stata 2017. Available online: https://www.stata.com/meeting/uk17/ (accessed on 20 July 2023).
- Glaser, N.; Jackson, V.; Eriksson, P.; Sartipy, U.; Franco-Cereceda, A. Relative survival after aortic valve surgery in patients with bicuspid aortic valves. Heart 2021, 107, 1167–1172. [Google Scholar] [CrossRef]
- Baart, S.J.; van Domburg, R.T.; Janssen-Heijnen, M.L.; Deckers, J.W.; Akkerhuis, K.M.; Daemen, J.; van Geuns, R.-J.; Boersma, E.; Kardys, I. Impact of Relative Conditional Survival Estimates on Patient Prognosis After Percutaneous Coronary Intervention. Circ. Cardiovasc. Qual. Outcomes 2017, 10, 6. [Google Scholar] [CrossRef] [PubMed]
- Kontis, V.; E Bennett, J.; Mathers, C.D.; Li, G.; Foreman, K.; Ezzati, M. Future life expectancy in 35 industrialised countries: Projections with a Bayesian model ensemble. Lancet 2017, 389, 1323–1335. [Google Scholar] [CrossRef] [PubMed]


| Variable | Male (n = 506) | Female (n = 232) | p | SD |
|---|---|---|---|---|
| Baseline Characteristics | ||||
| Age (years) | 65.4 ± 12.4 | 65 ± 14.5 | 0.710 | −0.02 |
| Body mass index (kg/m2) | 28.2 ± 4.2 | 28.1 ± 5.2 | 0.814 | −0.02 |
| Hypertension | 342 (67.6) | 150 (64.7) | 0.433 | −0.05 |
| Diabetes mellitus | 57 (11.3) | 20 (8.6) | 0.274 | −0.11 |
| Dyslipidemia | 179 (35.4) | 62 (26.7) | 0.021 | −0.16 |
| TIA/Stroke | 26 (5.1) | 2 (0.9) | 0.005 | −0.25 |
| Myocardial infarction | 14 (2.8) | 2 (0.9) | 0.102 | −0.15 |
| Peripheral vascular disease | 16 (3.2) | 10 (4.3) | 0.438 | 0.08 |
| Chronic kidney disease | 112 (22.1) | 80 (34.5) | <0.001 | 0.25 |
| COPD | 96 (19) | 12 (5.2) | <0.001 | −0.41 |
| Atrial fibrillation | 107 (21.1) | 42 (18.1) | 0.348 | −0.12 |
| Pulmonary hypertension | 116 (22.9) | 59 (25.4) | 0.516 | 0.09 |
| EuroScore II | 3.6 ± 3. 9 | 3.8 ± 3.1 | 0.491 | 0.06 |
| NYHA functional class ≥ II | 408 (80.6) | 194 (83.6) | 0.331 | 0.04 |
| LVEF (%) | 58.2 ± 38.8 | 55.5 ± 9.6 | 0.308 | −0.02 |
| Severe aortic stenosis | 153 (30.2) | 80 (34.5) | 0.212 | 0.14 |
| Severe aortic regurgitation | 164 (32.4) | 68 (29.3) | 0.4 | −0.08 |
| Bicuspid aortic valve | 212 (41.9) | 84 (36.2) | 0.14 | −0.10 |
| Ascending aorta diameter (mm) | 50.7 ± 8.1 | 51.4 ± 9.1 | 0.278 | 0.07 |
| Body surface area (m2) | 1.9 ± 0.2 | 1.7 ± 0.2 | 0.005 | −1.34 |
| Ascending aorta diameter/BSA (mm/m2) | 26.6 ± 0.2 | 30.6 ± 0.4 | >0.001 | 0.66 |
| Procedural Characteristics | ||||
| Type of surgery | 0.310 | 0.07 | ||
| 52 (10.3) | 34 (14.7) | ||
| 262 (51.8) | 124 (53.5) | ||
| 47 (9.3) | 10 (4.3) | ||
| 110 (21.7) | 30 (12.9) | ||
| 15 (3) | 8 (3.4) | ||
| 16 (3.1) | 14 (6) | ||
| 4 (0.8) | 12 (5.2) | ||
| Mechanical aortic prosthesis | 118 (23.3) | 54 (23.3) | 0.9895 | −0.04 |
| Prosthetic tube size | 0.404 | −0.04 | ||
| 38 (7.5) | 37 (15.9) | ||
| 123 (24.3) | 86 (37.1) | ||
| 246 (48.6) | 94 (40.5) | ||
| 79 (15.6) | 12 (5.2) | ||
| 18(3.6) | 3 (1.3) | ||
| 2 (0.4) | 0 | ||
| Circulatory arrest | 44 (8.7) | 40 (17.2) | <0.001 | 0.24 |
| Cross-clamping time (min) | 115.5 ± 53.6 | 105.1 ± 48.6 | 0.011 | −0.20 |
| Cardiopulmonary bypass time (min) | 142.4 ± 62.4 | 132.2 ± 56 | 0.034 | −0.18 |
| Univariate Analysis | Multivariable Analysis | ||||||
|---|---|---|---|---|---|---|---|
| Variable | HR | 95% CI | p | Variable | HR | 95% CI | p |
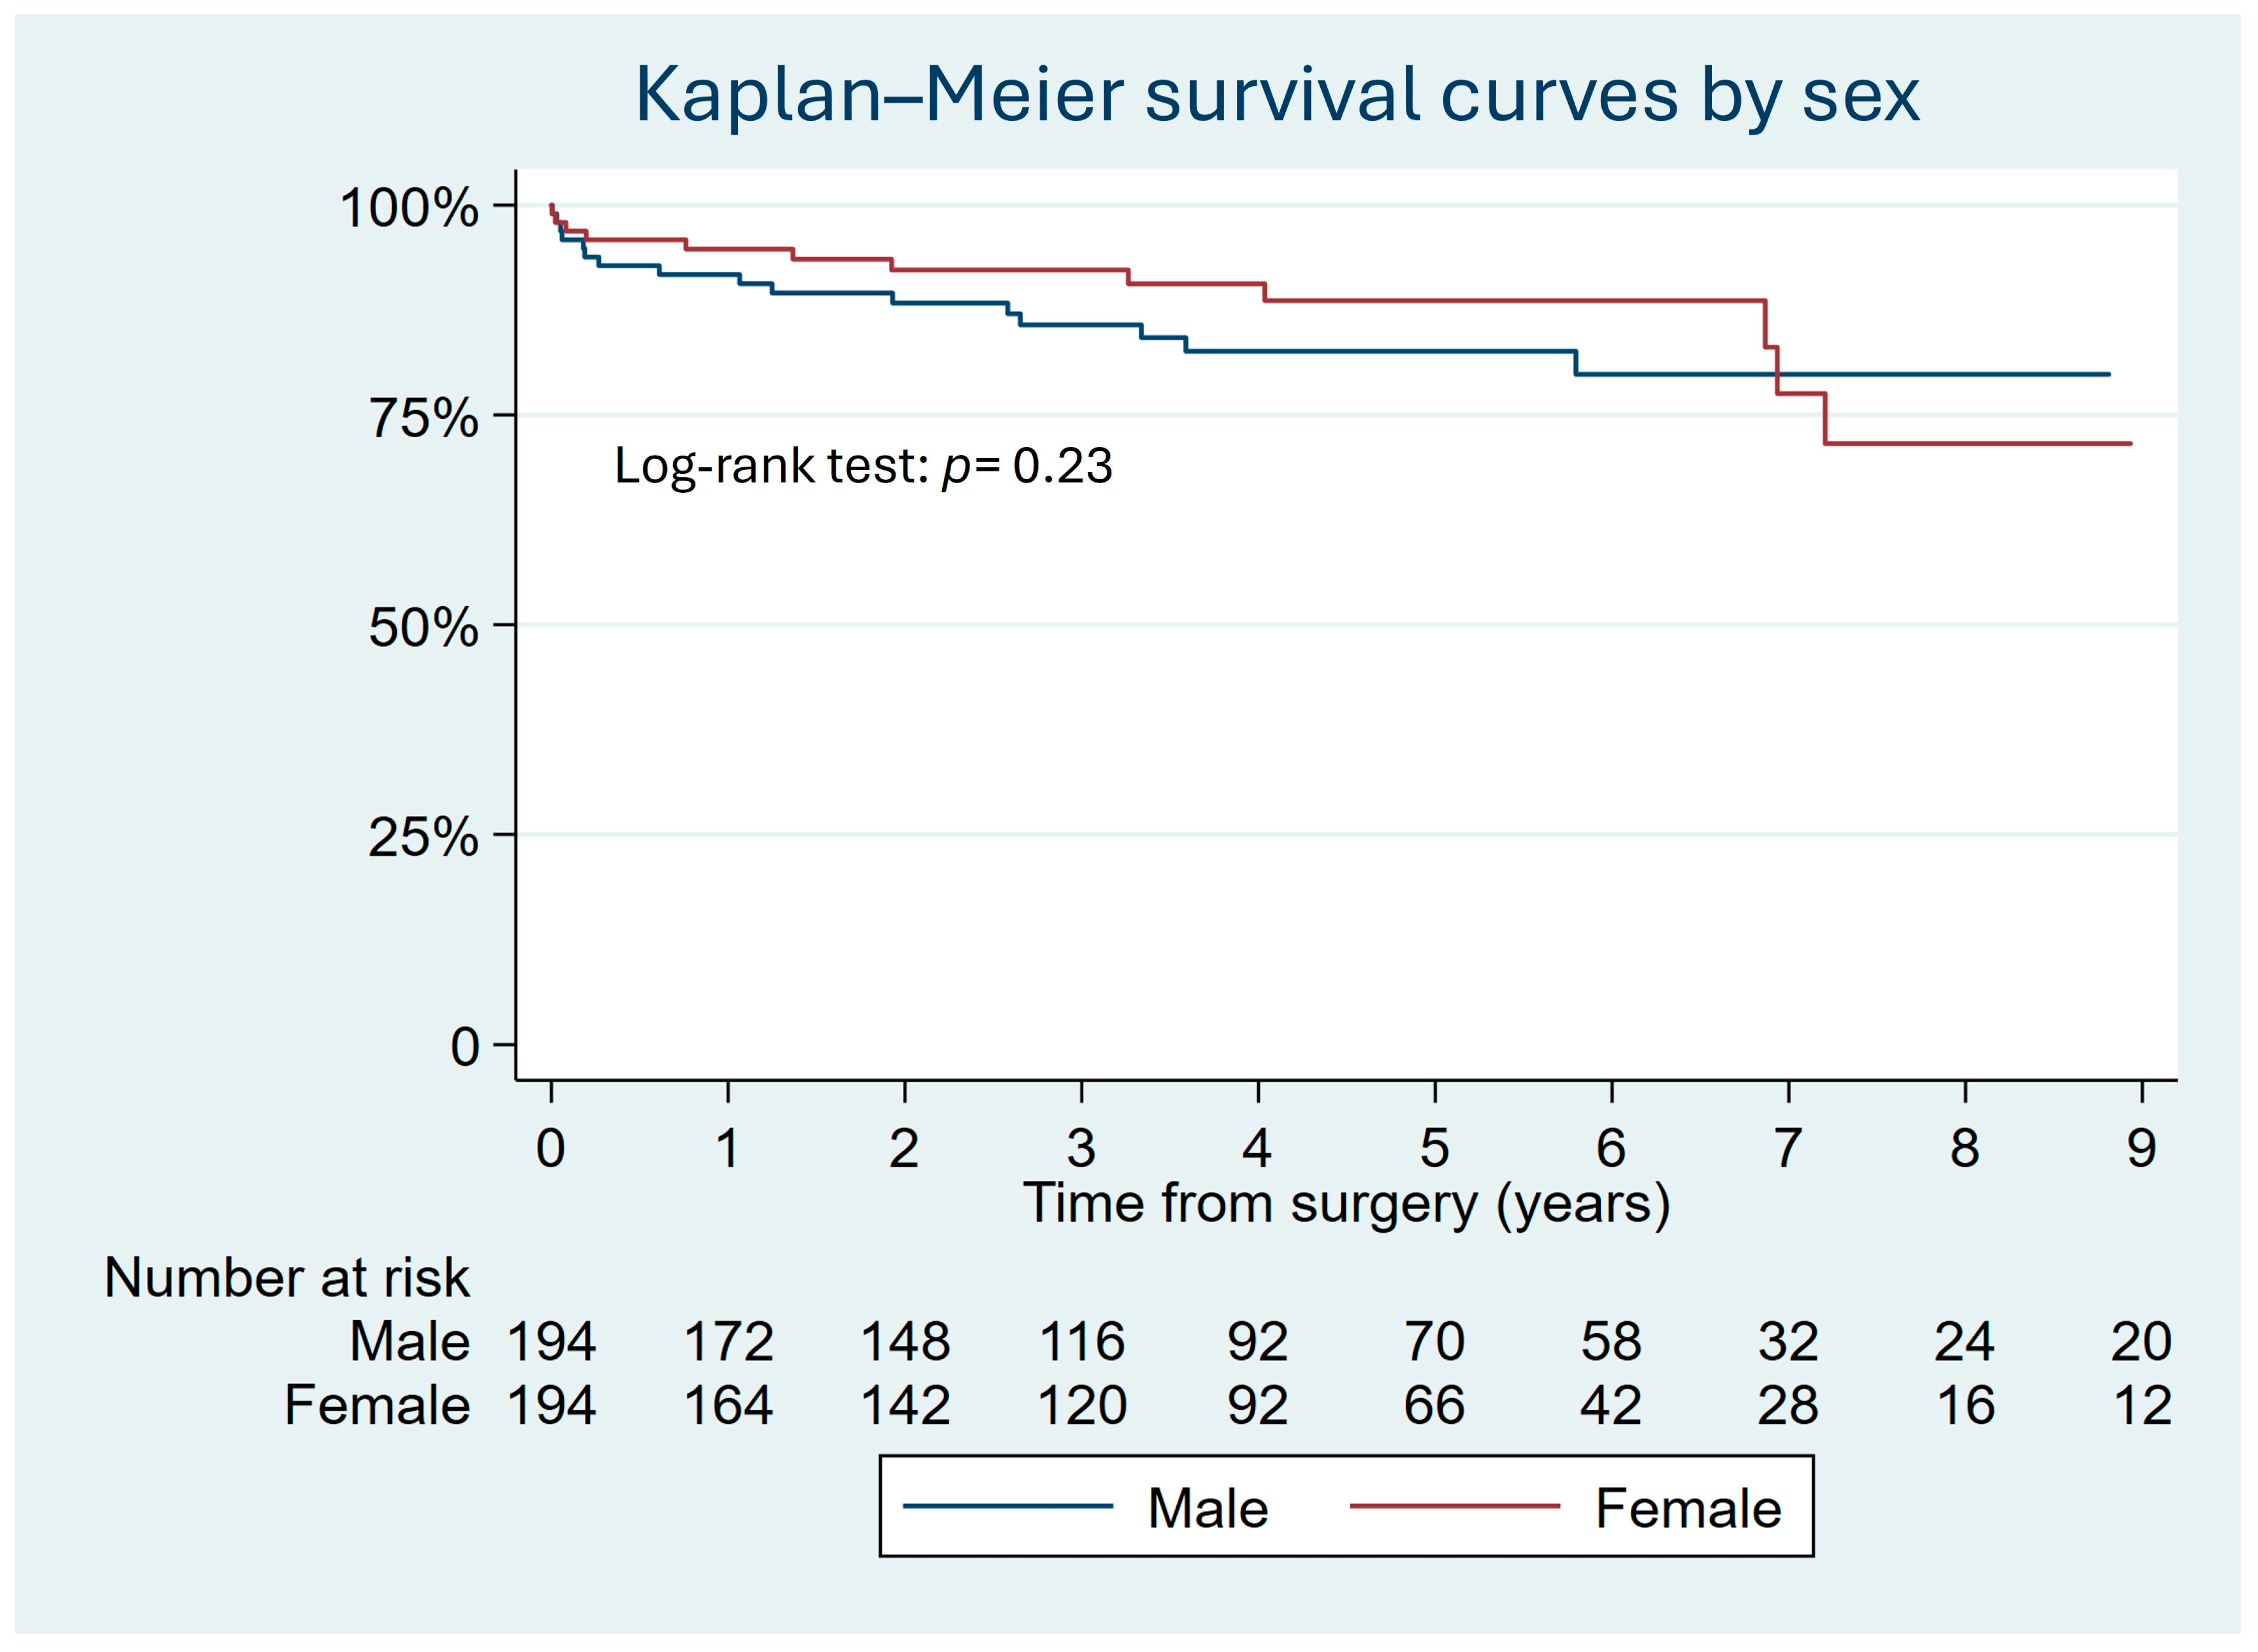
| Sex | 0.78 | 0.52–1.17 | 0.230 | Sex | 0.68 | 0.43–1.07 | 0.092 |
| Age | 1.04 | 1.02–1.05 | <0.001 | Age | 0.99 | 0.98–1.02 | 0.981 |
| Hypertension | 1.1 | 0.76–1.59 | 0.606 | Stroke/TIA | 1.64 | 0.75–3.58 | 0.213 |
| Diabetes | 1.28 | 0.77–2.12 | 0.327 | CKD | 2.46 | 1.56–3.89 | <0.001 |
| Dyslipidemia | 0.89 | 0.62–1.31 | 0.567 | Atrial fibrillation | 2.04 | 1.32–3.18 | 0.001 |
| Stroke/TIA | 2.44 | 1.28–4.68 | 0.007 | Pulmonary hypertension | 1.05 | 0.63–1.76 | 0.842 |
| Myocardial infarction | 1.41 | 0.52–3.82 | 0.498 | EuroScore II | 1.07 | 1.03–1.11 | <0.001 |
| PVD | 0.31 | 0.07–1.2 | 0.105 | Ascending aorta diameter | 1.03 | 1.01–1.06 | 0.005 |
| CKD | 2.76 | 1.95–3.91 | <0.001 | Arch replacement | 2.08 | 0.37–11.5 | 0.404 |
| COPD | 1.62 | 1.06–2.48 | 0.025 | Circulatory arrest | 0.93 | 0.17–5.02 | 0.938 |
| Atrial fibrillation | 2.21 | 1.54–3.19 | <0.001 | ||||
| Pulmonary hypertension | 1.47 | 0.99–2.2 | 0.06 | ||||
| EuroScore II | 1.08 | 1.05–1.11 | <0.001 | ||||
| NYHA ≥ 2 | 1.35 | 0.82–2.24 | 0.236 | ||||
| LVEF | 1.01 | 0.99–1.01 | 0.165 | ||||
| Severe aortic stenosis | 1.17 | 0.81–1.69 | 0.391 | ||||
| Severe aortic regurgitation | 1.02 | 0.7–1.48 | 0.915 | ||||
| Bicuspid valve | 0.75 | 0.52–1.08 | 0.120 | ||||
| Ascending aorta diameter | 1.05 | 1.03–1.07 | <0.001 | ||||
| Arch replacement | 1.91 | 1.12–3.25 | 0.017 | ||||
| Circulatory arrest | 1.62 | 0.95–2.74 | 0.075 | ||||
| Cross-clamping time | 1.01 | 0.99–1.01 | 0.108 | ||||
| Cardiopulmonary bypass time | 1.01 | 1.00–1.06 | 0.108 | ||||
| Variable Matched | Male (n = 196) | Female (n = 196) | p | SD |
|---|---|---|---|---|
| Baseline Characteristics | ||||
| Age (years) | 64.2 ± 14.2 | 64.4 ± 14.7 | 0.933 | 0.01 |
| Body mass index (kg/m2) | 28.1 ± 4.5 | 28.1 ± 5 | 0.982 | 0.01 |
| Hypertension | 126 (64.3) | 130 (66.3) | 0.671 | 0.04 |
| Diabetes mellitus | 16 (8.2) | 16 (8.2) | 1 | 0 |
| Dyslipidemia | 54 (27.6) | 52 (26.5) | 0.820 | −0.02 |
| TIA/Stroke | 0 | 2 (1.02) | 0.156 | 0.06 |
| Myocardial infarction | 2 (1) | 2 (1) | 1 | 0 |
| Peripheral vascular disease | 6 (3.1) | 6 (3.1) | 1 | 0 |
| Chronic kidney disease | 56 (28.6) | 58(29.6) | 0.824 | 0.02 |
| COPD | 10 (5.1) | 12 (6.12) | 0.667 | 0.03 |
| Atrial fibrillation | 30 (15.3) | 36 (18.4) | 0.418 | 0.08 |
| Pulmonary hypertension | 52 (26.5) | 50 (25.5) | 0.818 | −0.02 |
| EuroScore II | 3.7 ± 3.8 | 3.8 ± 3.1 | 0.781 | 0.02 |
| NYHA functional class ≥ II | 168 (85.7) | 166 (84.7) | 0.776 | −0.02 |
| LVEF (%) | 55.5 ± 10.6 | 55.9 ± 9.2 | 0.736 | 0.03 |
| Severe aortic stenosis | 74 (37.8) | 68 (34.7) | 0.528 | −0.07 |
| Severe aortic regurgitation | 54 (27.6) | 62 (31.6) | 0.376 | 0.09 |
| Bicuspid aortic valve | 82 (41.8) | 78 (39.8) | 0.681 | −0.04 |
| Ascending aorta diameter (mm) | 50.2 ± 7.8 | 50.9 ± 9.2 | 0.421 | 0.07 |
| Procedural characteristics | ||||
| Type of surgery | 0.778 | 0 | ||
| 18 (9.2) | 24 (12.2) | ||
| 108 (55.1) | 110 (56.1) | ||
| 12 (6.1) | 10 (5.1) | ||
| 42 (21.4) | 30 (15.3) | ||
| 8 (4.1) | 6 (3.1) | ||
| 6 (3.1) | 8 (4.1) | ||
| 2 (1) | 8 (4.1) | ||
| Mechanical aortic prosthesis | 60 (30.6) | 50 (25.1) | 0.802 | −0.01 |
| Prosthetic tube size | 0.974 | −0.02 | ||
| 12 (6.1) | 28 (14.3) | ||
| 56 (25.9) | 78 (39.8) | ||
| 96 (49) | 76 (38.8) | ||
| 24 (12.2) | 8 (5.1) | ||
| 8 (4.1) | 4 (2) | ||
| Circulatory arrest | 20 (10.2) | 22 (12.2) | 0.522 | 0.06 |
| Cross-clamping time (min) | 108.8 ± 49.9 | 109.2 ± 49.2 | 0.984 | 0.01 |
| Cardiopulmonary bypass time (min) | 133.4 ± 55.8 | 135.1 ± 58 | 0.771 | 0.3 |
| Matched Variable | Male (n = 196) | Female (n = 196) | p |
|---|---|---|---|
| Hospitalization and 30-day outcomes | |||
| Permanent Pacemaker | 6 (3.1) | 14 (7.2) | 0.07 |
| New Onset Atrial Fibrillation | 28 (14.4) | 34 (17.5) | 0.41 |
| Reintervention | 26 (13.2) | 16 (8.2) | 0.1 |
| Deaths | 8 (4.1) | 10 (5.1) | 0.63 |
| Follow-up | |||
| NYHA ≤ II | 164 (97.6) | 166 (98.8) | 0.78 |
| LVEF | 63.7 ± 10.2 | 59.2 ± 9.9 | 0.37 |
| Readmission | 12 (6.4) | 4 (2.1) | 0.04 |
| Reintervention | 20 (10.5) | 12 (6.3) | 0.14 |
| Deaths | 30 (15.3) | 28 (14.3) | 0.78 |
| Observed Survival, Expected Survival, and Relative Survival of All Men | |||
| Observed Survival | Expected Survival | Relative Survival | |
| First year | 92.3% (95% CI 90–94.3%) | 97.4% | 94.7% (95% CI 92–96.8%) |
| Second year | 89.2% (95% CI 86.1–91.7%) | 94.9% | 99.3% (95% CI 97–100.7%) |
| Third year | 87.2% (95% CI 83.8–89.9%) | 92.2% | 100.6% (95% CI 98.3–101.8%) |
| Fourth year | 84.1% (95% CI 80.3–88.7%) | 90.8% | 99.5% (95% CI 96.5–101.2%) |
| Fifth year | 82.6% (95% CI 78.5–86%) | 86.3% | 101.6% (95% CI 98.5–102.8%) |
| Sixth year | 80.6% (95% CI 76.1–84.4%) | 83.2% | 101.2% (95% CI 97.3–102.8%) |
| Seventh year | 79.4% (95% CI 74.6–83.4%) | 80% | 102.4% (95% CI 97.8–103.6%) |
| Eighth year | 76.1% (95% CI 70.3–80.9%) | 76.9% | 99.7% (95% CI 92.9–102.4%) |
| Men Who Survived the first 30 days. | |||
| First year | 97.8 (95% CI 96–98.8%) | 97.5% | 100.3% (95% CI 98.5–101.3%) |
| Second year | 94.5% (95% CI 91.9–96.3%) | 94.9% | 99.3% (95% CI 96.9–10.7%) |
| Third year | 92.9% (95% CI 90–95%) | 92.2% | 101.1% (95% CI 99–102.1%) |
| Fourth year | 90.2% (95% CI 86.7–92.8%) | 89.4% | 100.2% (95% CI 97.3–101.7%) |
| Fifth year | 88.5% (95% CI 84.6–91.5%) | 86.4% | 101.6% (95% CI 98.4–102.8%) |
| Sixth year | 86.4% (95% CI 81.9–89.8%) | 83.3% | 101.2% (95% CI 97.2–102.8%) |
| Seventh year | 85% (95% CI 80.2–88.8%) | 80.1% | 102.4% (95% CI 97.7–103.6%) |
| Eighth year | 81.4% (95% CI 75.3–86.1%) | 77% | 99.6% (95% CI 92.6–102.3%) |
| Observed survival, expected survival, and relative survival of all women | |||
| Observed survival | Expected Survival | Relative Survival | |
| First year | 93.7% (95% CI 89.6–96.2) | 98.7% | 95% (95% CI 90.8–97.5%) |
| Second year | 92.7% (95% CI 88.4–95.5%) | 97% | 100.6% (95% CI 97.4–101.4%) |
| Third year | 91.5% (95% CI 86.9–94.6%) | 95.4% | 100.3% (95% CI 96.6–101.3%) |
| Fourth year | 90.1 (95% CI 85–93.6%) | 94% | 100% (95% CI 95.4–101.1%) |
| Fifth year | 88.3% (95% CI 82.5–92.3%) | 92.6% | 99.5% (95% CI 93.7–100.1%) |
| Sixth year | 88.3% (95% CI 82.5–92.3%) | 91.2% | 101.6% (95% CI 101.6–101.6%) |
| Seventh year | 85% (95% CI 77.2–90.3%) | 90% | 97.5% (95% CI 86.9–100.4%) |
| Eighth year | 75.8% (95% CI 63.7–84.4%) | 88.5% | 90.66% (95% CI 74.9–97.4%) |
| Women Who Survived the first 30 days. | |||
| First year | 99% (95% CI 96.1–99.8) | 98.8% | 100.3% (95% CI 97.4–101%) |
| Second year | 96.8% (95% CI 93.1–98.6%) | 97.1% | 99.5% (95% CI 95.8–100.9%) |
| Third year | 96.8% (95% CI 93.1–95.6%) | 95.5% | 101.7% (95% CI 101.7–101.7%) |
| Fourth year | 95.3% (95% CI 90.7–97.6%) | 94% | 99.9% (95% CI 95.2–101.1%) |
| Fifth year | 93.3% (95% CI 87.6–96.4%) | 92.7% | 99.4% (95% CI 93.4–101%) |
| Sixth year | 93.3% (95% CI 87.6–96.4%) | 91.2% | 101.6% (95% CI 101.6–101.6%) |
| Seventh year | 85.9% (95% CI 75.5–92.1%) | 90% | 93.3% (95% CI 81.2–98.2%) |
| Eighth year | 85.9% (95% CI 75.5–92.1%) | 88.6% | 101.6% (95% CI 101.5–101.7%) |
Disclaimer/Publisher’s Note: The statements, opinions and data contained in all publications are solely those of the individual author(s) and contributor(s) and not of MDPI and/or the editor(s). MDPI and/or the editor(s) disclaim responsibility for any injury to people or property resulting from any ideas, methods, instructions or products referred to in the content. |
© 2024 by the authors. Licensee MDPI, Basel, Switzerland. This article is an open access article distributed under the terms and conditions of the Creative Commons Attribution (CC BY) license (https://creativecommons.org/licenses/by/4.0/).
Share and Cite
Almendárez, M.; Formica, F.; Gutierrez Sáenz de Santamaría, J.; Avanzas, P.; Escalera, A.; Alvarez-Velasco, R.; Pascual, I.; Silva, J.; Díaz, R.; Alperi, A.; et al. Sex-Related Differences in Life Expectancy Compared to General Population after Surgery for Ascending Aortic Aneurysm. J. Clin. Med. 2024, 13, 4554. https://doi.org/10.3390/jcm13154554
Almendárez M, Formica F, Gutierrez Sáenz de Santamaría J, Avanzas P, Escalera A, Alvarez-Velasco R, Pascual I, Silva J, Díaz R, Alperi A, et al. Sex-Related Differences in Life Expectancy Compared to General Population after Surgery for Ascending Aortic Aneurysm. Journal of Clinical Medicine. 2024; 13(15):4554. https://doi.org/10.3390/jcm13154554
Chicago/Turabian StyleAlmendárez, Marcel, Francesco Formica, Jorge Gutierrez Sáenz de Santamaría, Pablo Avanzas, Alain Escalera, Rut Alvarez-Velasco, Isaac Pascual, Jacobo Silva, Rocío Díaz, Alberto Alperi, and et al. 2024. "Sex-Related Differences in Life Expectancy Compared to General Population after Surgery for Ascending Aortic Aneurysm" Journal of Clinical Medicine 13, no. 15: 4554. https://doi.org/10.3390/jcm13154554