

Stage-Specific Plasma Metabolomic Profiles in Colorectal Cancer

 , and
, and
Abstract
1. Introduction
2. Materials and Methods
2.1. Study Design
2.2. Sample Preparation for Metabolome Analysis
2.3. CE-TOFMS Equipment
2.4. CE-TOFMS Conditions for Cationic Metabolite Analysis
2.5. CE-TOFMS Conditions for Anionic Metabolite Analysis
2.6. LC-MS/MS Conditions for Polyamine Analysis
2.7. Data Analysis
3. Results
4. Discussion
5. Conclusions
Author Contributions
Funding
Institutional Review Board Statement
Informed Consent Statement
Data Availability Statement
Conflicts of Interest
Appendix A


| Characteristics | Training | Validation | p-Value | |
|---|---|---|---|---|
| Age (Mean ± SD) | 68.07 ± 11.88 | 68.23 ± 11.83 | 0.951 a | |
| Age (<med/≥med) | Stages I–III | 51/45 | 44/52 | 0.312 b |
| Stage IV | 4/4 | 5/3 | 0.614 b | |
| Sex (M/F) | 75/53 | 70/55 | 0.757 b | |
| Stages I–III | 54/42 | 51/45 | 0.664 b | |
| Stage IV | 4/4 | 4/4 | >0.9999 b | |
| Stage (n) | ||||
| Polyp | 22 | 21 | 0.9997 b (0.9987) c | |
| I | 27 | 27 | ||
| II | 33 | 34 | ||
| III | 36 | 35 | ||
| IV | 8 | 8 | ||
| Metabolites | Stage | Training | Validation | p-Value a |
|---|---|---|---|---|
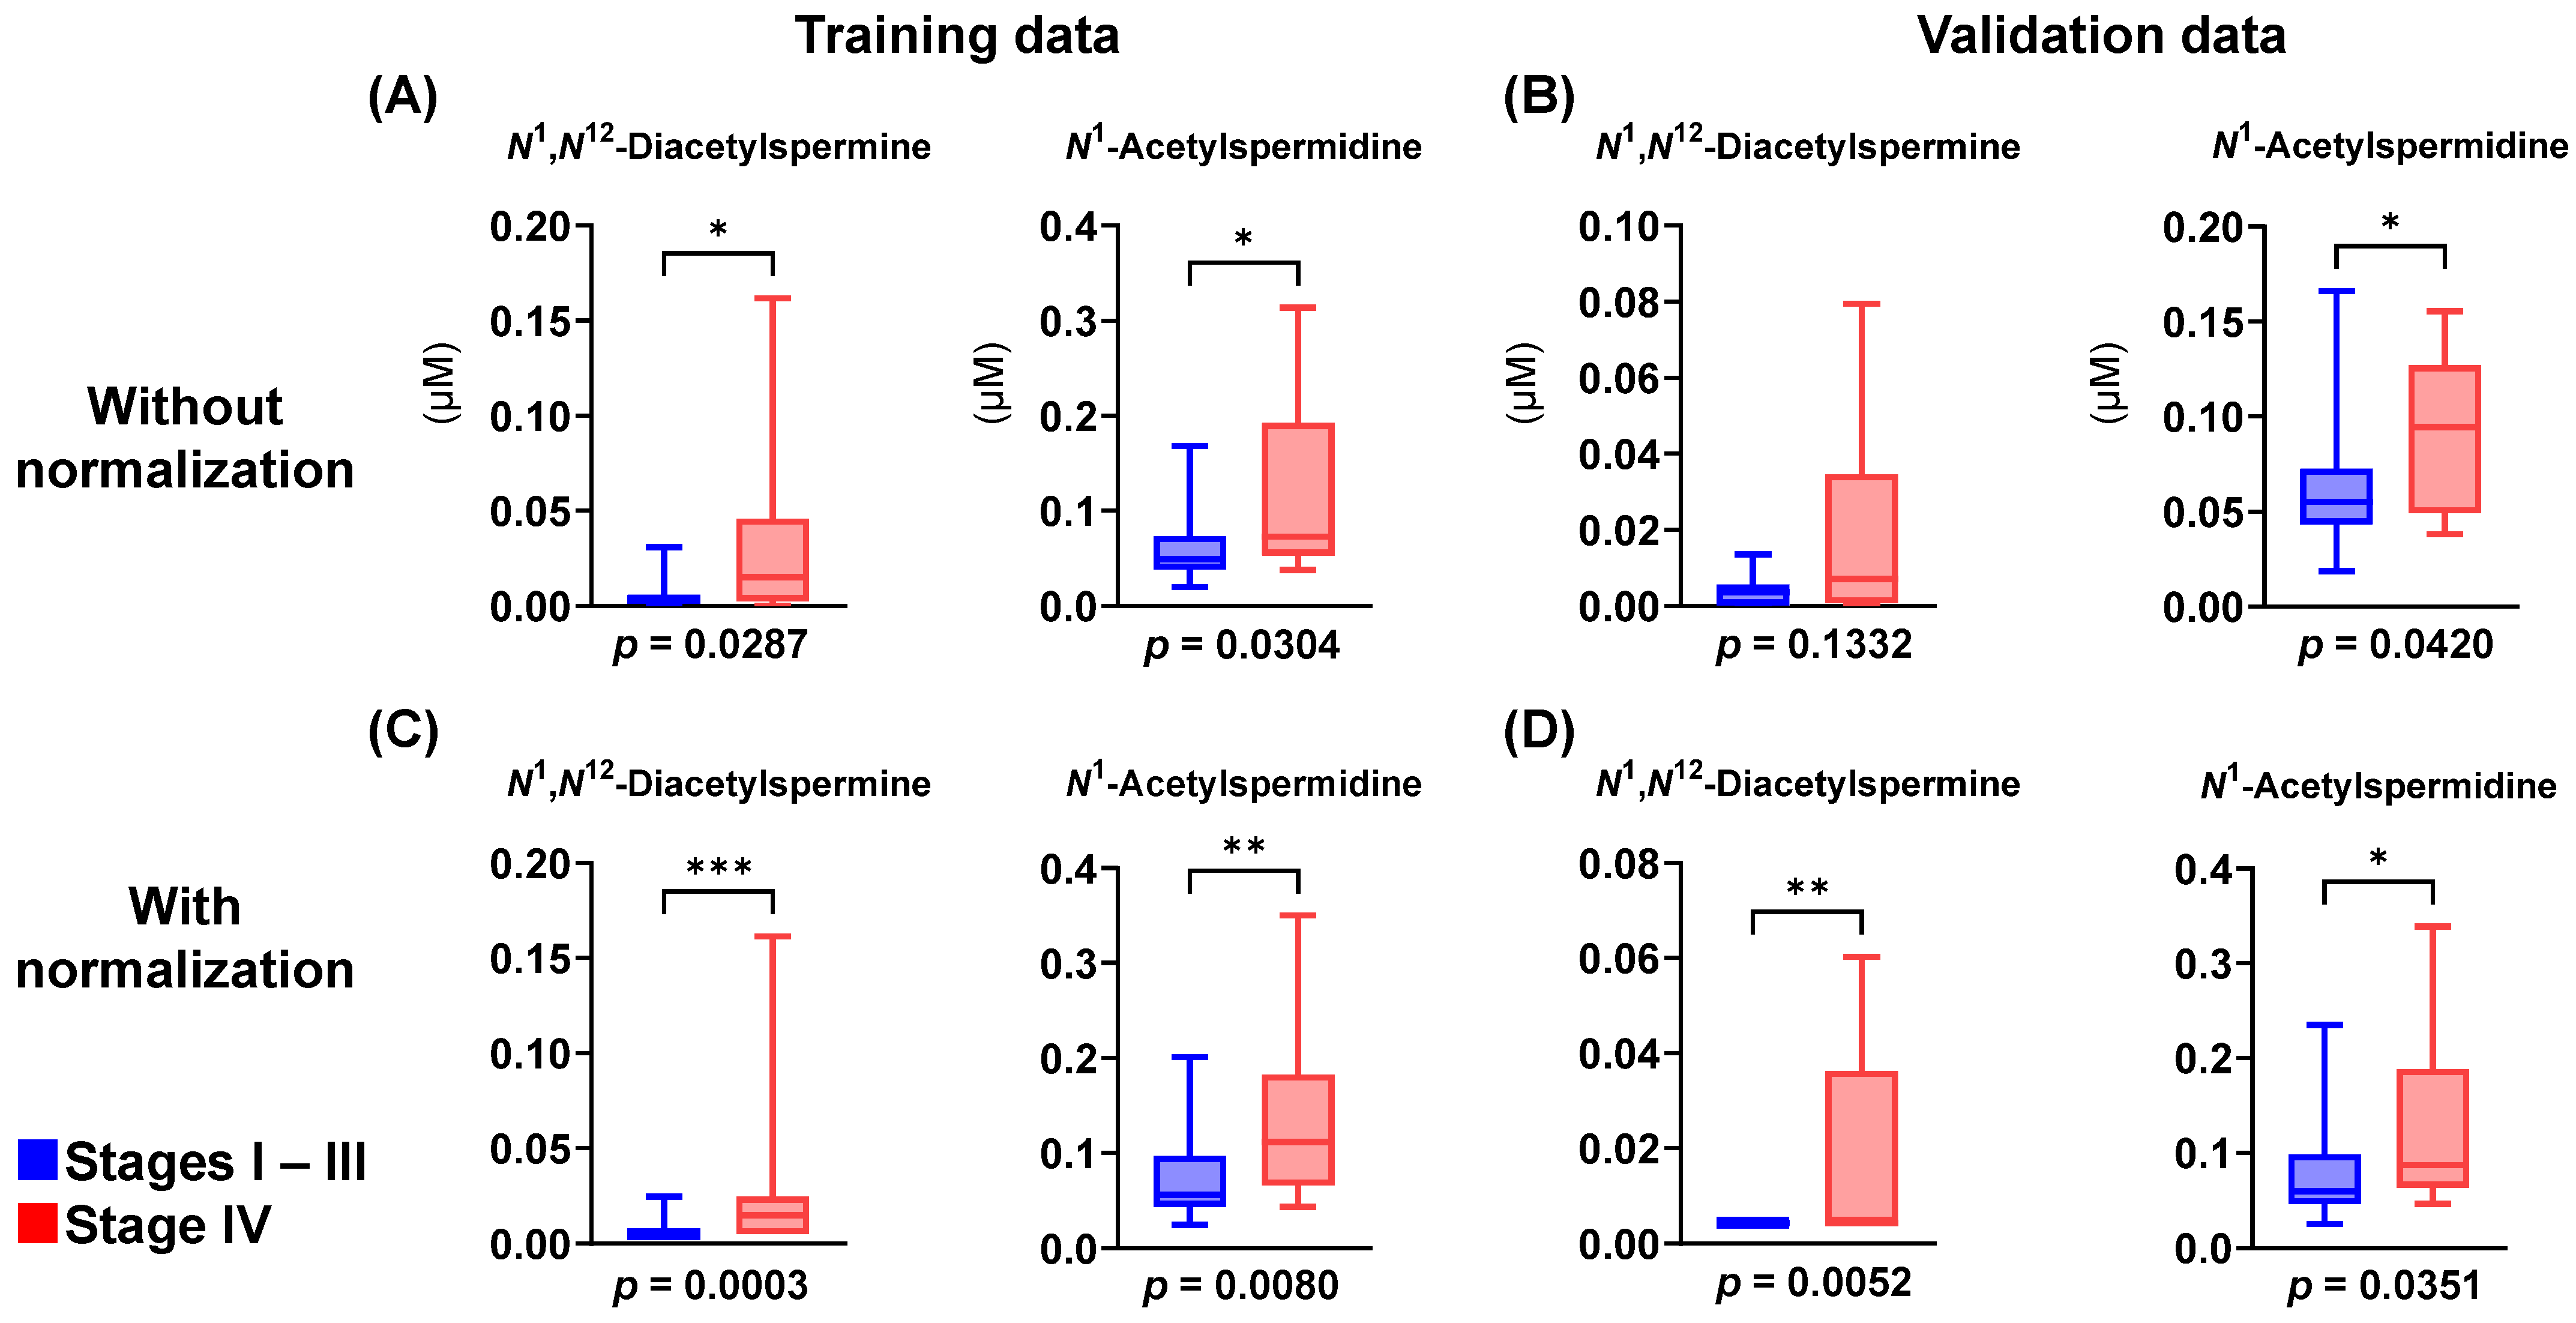
| N1,N12-Diacetylspermine | Polyp | 0.00197 ± 0.00383 | 0.00183 ± 0.00168 | 0.292 |
| Stage I–III | 0.00467 ± 0.00551 | 0.00393 ± 0.00334 | 0.982 | |
| Stage IV | 0.0344 ± 0.0543 | 0.0187 ± 0.00999 | 0.504 | |
| N1-Acetylspermidine | Polyp | 0.0545 ± 0.0345 | 0.0588 ± 0.024 | 0.272 |
| Stages I–III | 0.00467 ± 0.00551 | 0.00393 ± 0.00334 | 0.982 | |
| Stage IV | 0.118 ± 0.0972 | 0.0912 ± 0.0414 | >0.9999 | |
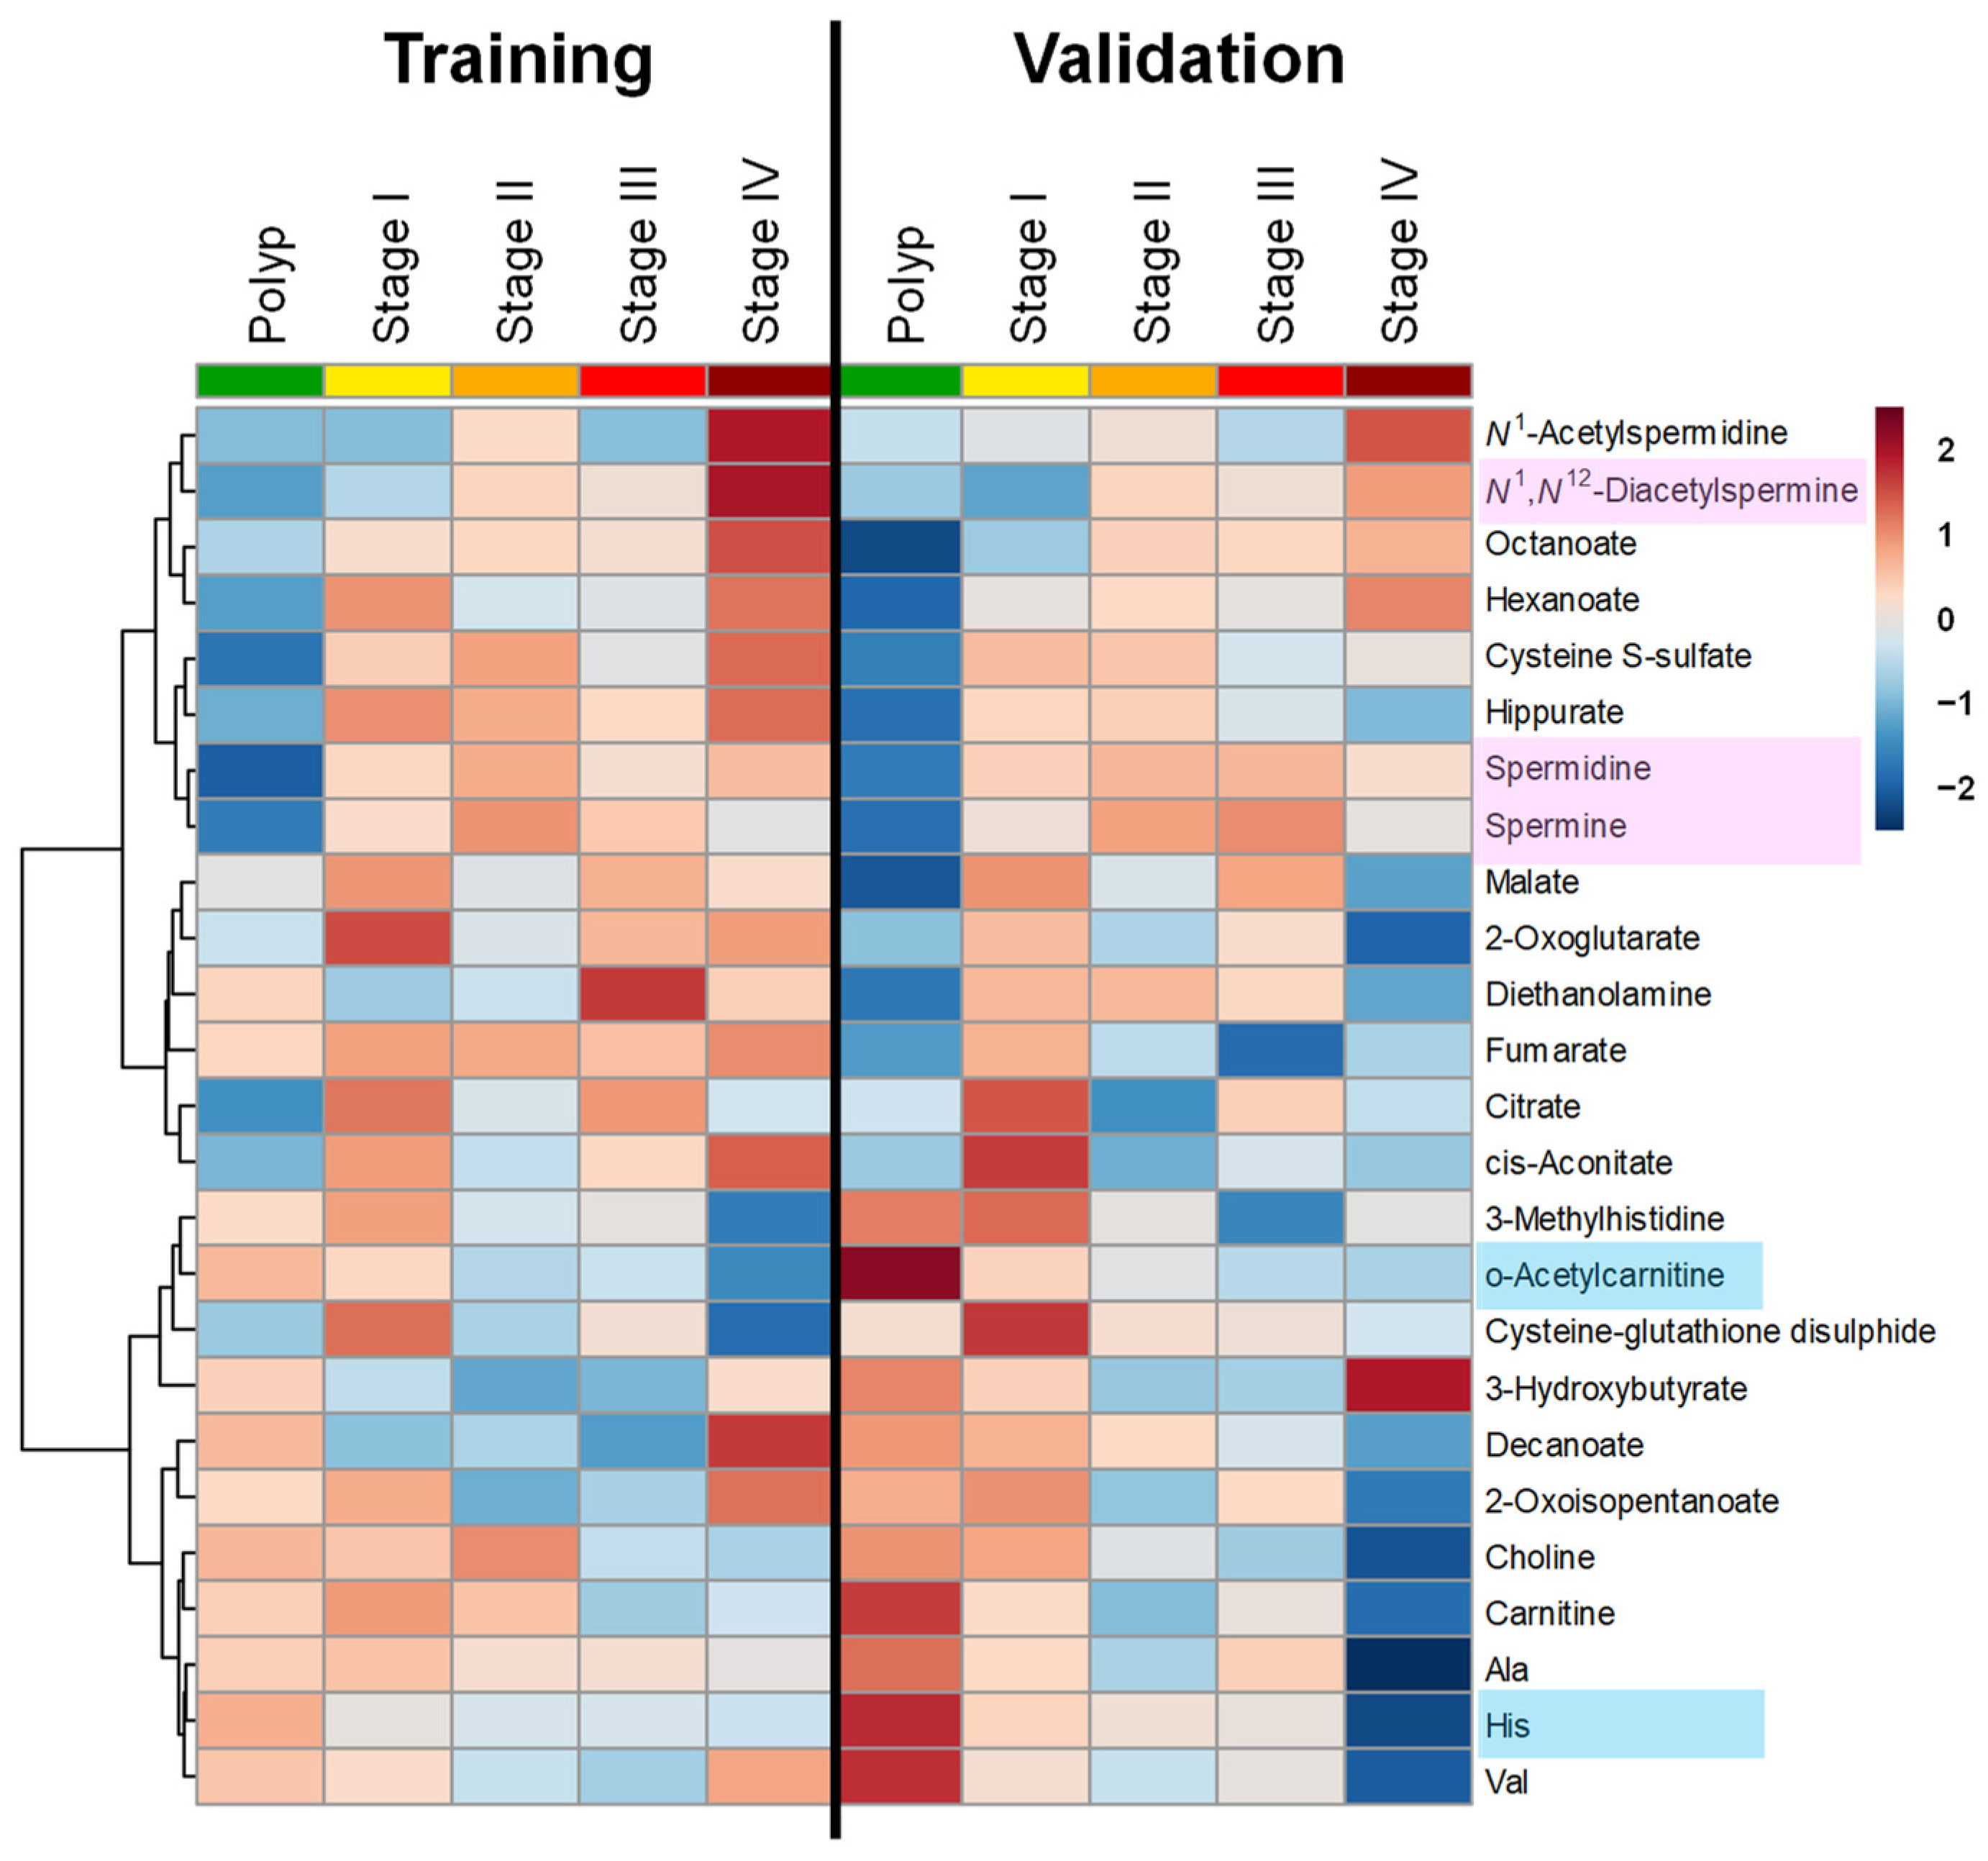
| His | Polyp | 77.24 ± 15.19 | 87.44 ± 15.59 | 0.0101 |
| Stages I–III | 69.62 ± 14.31 | 71.99 ± 13.97 | 0.233 | |
| Stage IV | 67.12 ± 7.587 | 55.05 ± 14.75 | 0.0379 |
References
- Bray, F.; Laversanne, M.; Sung, H.; Ferlay, J.; Siegel, R.L.; Soerjomataram, I.; Jemal, A. Global cancer statistics 2022: GLOBOCAN estimates of incidence and mortality worldwide for 36 cancers in 185 countries. CA Cancer J. Clin. 2024, 74, 229–263. [Google Scholar] [CrossRef]
- Ilyas, M.I.M. Epidemiology of stage IV colorectal cancer: Trends in the incidence, prevalence, age distribution, and impact on life span. Clin. Colon Rectal Surg. 2024, 37, 57–61. [Google Scholar] [CrossRef]
- Sung, H.; Ferlay, J.; Siegel, R.L.; Laversanne, M.; Soerjomataram, I.; Jemal, A.; Bray, F. Global cancer statistics 2020: GLOBOCAN estimates of incidence and mortality worldwide for 36 cancers in 185 countries. CA Cancer J. Clin. 2021, 71, 209–249. [Google Scholar] [CrossRef] [PubMed]
- Uzun, A.K.; Güveli, T.K.; Özülker, F.; Özülker, T. The efficacy of 18 F-FDG PET/CT in detecting colorectal cancer recurrences. Eur. Arch. Med. Res. 2021, 37, 3602. [Google Scholar] [CrossRef]
- Locker, G.Y.; Hamilton, S.; Harris, J.; Jessup, J.M.; Kemeny, N.; Macdonald, J.S.; Somerfield, M.R.; Hayes, D.F.; Bast, R.C., Jr. ASCO 2006 update of recommendations for the use of tumor markers in gastrointestinal cancer. J. Clin. Oncol. 2006, 24, 5313–5327. [Google Scholar] [CrossRef] [PubMed]
- Li, C.; Zhao, K.; Zhang, D.; Pang, X.; Pu, H.; Lei, M.; Fan, B.; Lv, J.; You, D.; Li, Z.; et al. Prediction models of colorectal cancer prognosis incorporating perioperative longitudinal serum tumor markers: A retrospective longitudinal cohort study. BMC Med. 2023, 21, 63. [Google Scholar] [CrossRef]
- Wan, J.C.M.; Massie, C.; Garcia-Corbacho, J.; Mouliere, F.; Brenton, J.D.; Caldas, C.; Pacey, S.; Baird, R.; Rosenfeld, N. Liquid biopsies come of age: Towards implementation of circulating tumour DNA. Nat. Rev. Cancer 2017, 17, 223–238. [Google Scholar] [CrossRef] [PubMed]
- Costanza, B.; Turtoi, A.; Bellahcène, A.; Hirano, T.; Peulen, O.; Blomme, A.; Hennequière, V.; Mutijima, E.; Boniver, J.; Meuwis, M.A.; et al. Innovative methodology for the identification of soluble biomarkers in fresh tissues. Oncotarget 2018, 9, 10665–10680. [Google Scholar] [CrossRef]
- Goel, G. Molecular characterization and biomarker identification in colorectal cancer: Toward realization of the precision medicine dream. Cancer Manag. Res. 2018, 10, 5895–5908. [Google Scholar] [CrossRef]
- Hussen, B.M.; Abdullah, S.T.; Abdullah, S.R.; Younis, Y.M.; Hidayat, H.J.; Rasul, M.F.; Mohamadtahr, S. Exosomal non-coding RNAs: Blueprint in colorectal cancer metastasis and therapeutic targets. Noncoding RNA Res. 2023, 8, 615–632. [Google Scholar] [CrossRef]
- Nagashima, T.; Yamaguchi, K.; Urakami, K.; Shimoda, Y.; Ohnami, S.; Ohshima, K.; Tanabe, T.; Naruoka, A.; Kamada, F.; Serizawa, M.; et al. Japanese version of the cancer genome atlas, JCGA, established using fresh frozen tumors obtained from 5143 cancer patients. Cancer Sci. 2020, 111, 687–699. [Google Scholar] [CrossRef]
- Lee, D.W.; Lim, Y.; Kim, H.P.; Kim, S.Y.; Roh, H.; Kang, J.K.; Lee, K.H.; Kim, M.J.; Ryoo, S.B.; Park, J.W.; et al. Circulating tumor DNA dynamics and treatment outcome of regorafenib in metastatic colorectal cancer. Cancer Res. Treat. 2023, 55, 927–938. [Google Scholar] [CrossRef] [PubMed]
- Farshidfar, F.; Weljie, A.M.; Kopciuk, K.A.; Hilsden, R.; McGregor, S.E.; Buie, W.D.; MacLean, A.; Vogel, H.J.; Bathe, O.F. A validated metabolomic signature for colorectal cancer: Exploration of the clinical value of metabolomics. Br. J. Cancer 2016, 115, 848–857. [Google Scholar] [CrossRef]
- Hakami, Z.H. Biomarker discovery and validation for gastrointestinal tumors: A comprehensive review of colorectal, gastric, and liver cancers. Pathol. Res. Pract. 2024, 255, 155216. [Google Scholar] [CrossRef] [PubMed]
- Sun, J.; Zhao, J.; Zhou, S.; Li, X.; Li, T.; Wang, L.; Yuan, S.; Chen, D.; Law, P.J.; Larsson, S.C.; et al. Systematic investigation of genetically determined plasma and urinary metabolites to discover potential interventional targets for colorectal cancer. J. Natl. Cancer Inst. 2024, 116, 1303–1312. [Google Scholar] [CrossRef]
- Tevini, J.; Eder, S.K.; Huber-Schönauer, U.; Niederseer, D.; Strebinger, G.; Gostner, J.M.; Aigner, E.; Datz, C.; Felder, T.K. Changing metabolic patterns along the colorectal adenoma-carcinoma sequence. J. Clin. Med. 2022, 11, 721. [Google Scholar] [CrossRef] [PubMed]
- Zhang, Y.; Du, Y.; Song, Z.; Liu, S.; Li, W.; Wang, D.; Suo, J. Profiling of serum metabolites in advanced colon cancer using liquid chromatography-mass spectrometry. Oncol. Lett. 2020, 19, 4002–4010. [Google Scholar] [CrossRef]
- Kuwabara, H.; Katsumata, K.; Iwabuchi, A.; Udo, R.; Tago, T.; Kasahara, K.; Mazaki, J.; Enomoto, M.; Ishizaki, T.; Soya, R.; et al. Salivary metabolomics with machine learning for colorectal cancer detection. Cancer Sci. 2022, 113, 3234–3243. [Google Scholar] [CrossRef]
- Nakajima, T.; Katsumata, K.; Kuwabara, H.; Soya, R.; Enomoto, M.; Ishizaki, T.; Tsuchida, A.; Mori, M.; Hiwatari, K.; Soga, T.; et al. Urinary polyamine biomarker panels with machine-learning differentiated colorectal cancers, benign disease, and healthy controls. Int. J. Mol. Sci. 2018, 19, 756. [Google Scholar] [CrossRef]
- Sakurai, T.; Katsumata, K.; Udo, R.; Tago, T.; Kasahara, K.; Mazaki, J.; Kuwabara, H.; Kawakita, H.; Enomoto, M.; Ishizaki, T.; et al. Validation of urinary charged metabolite profiles in colorectal cancer using capillary electrophoresis-mass spectrometry. Metabolites 2022, 12, 59. [Google Scholar] [CrossRef]
- Udo, R.; Katsumata, K.; Kuwabara, H.; Enomoto, M.; Ishizaki, T.; Sunamura, M.; Nagakawa, Y.; Soya, R.; Sugimoto, M.; Tsuchida, A. Urinary charged metabolite profiling of colorectal cancer using capillary electrophoresis-mass spectrometry. Sci. Rep. 2020, 10, 21057. [Google Scholar] [CrossRef]
- Iwamoto, H.; Okihara, M.; Akashi, I.; Kihara, Y.; Konno, O.; Kawachi, S.; Sunamura, M.; Sugimoto, M. Metabolomic profiling of plasma, urine, and saliva of kidney transplantation recipients. Int. J. Mol. Sci. 2022, 23, 3938. [Google Scholar] [CrossRef]
- Sugimoto, M.; Wong, D.T.; Hirayama, A.; Soga, T.; Tomita, M. Capillary electrophoresis mass spectrometry-based saliva metabolomics identified oral, breast and pancreatic cancer-specific profiles. Metabolomics 2010, 6, 78–95. [Google Scholar] [CrossRef]
- Sugimoto, M.; Hirayama, A.; Ishikawa, T.; Robert, M.; Baran, R.; Uehara, K.; Kawai, K.; Soga, T.; Tomita, M. Differential metabolomics software for capillary electrophoresis-mass spectrometry data analysis. Metabolomics 2010, 6, 27–41. [Google Scholar] [CrossRef]
- Hirayama, A.; Sugimoto, M.; Suzuki, A.; Hatakeyama, Y.; Enomoto, A.; Harada, S.; Soga, T.; Tomita, M.; Takebayashi, T. Effects of processing and storage conditions on charged metabolomic profiles in blood. Electrophoresis 2015, 36, 2148–2155. [Google Scholar] [CrossRef] [PubMed]
- Fukai, K.; Harada, S.; Iida, M.; Kurihara, A.; Takeuchi, A.; Kuwabara, K.; Sugiyama, D.; Okamura, T.; Akiyama, M.; Nishiwaki, Y.; et al. Metabolic profiling of total physical activity and sedentary behavior in community-dwelling men. PLoS ONE 2016, 11, e0164877. [Google Scholar] [CrossRef] [PubMed]
- Sasaki, K.; Sagawa, H.; Suzuki, M.; Yamamoto, H.; Tomita, M.; Soga, T.; Ohashi, Y. Metabolomics platform with capillary electrophoresis coupled with high-resolution mass spectrometry for plasma analysis. Anal. Chem. 2019, 91, 1295–1301. [Google Scholar] [CrossRef]
- Pang, Z.; Chong, J.; Zhou, G.; de Lima Morais, D.A.; Chang, L.; Barrette, M.; Gauthier, C.; Jacques, P.; Li, S.; Xia, J. MetaboAnalyst 5.0: Narrowing the gap between raw spectra and functional insights. Nucleic Acids Res. 2021, 49, W388–W396. [Google Scholar] [CrossRef] [PubMed]
- Umemori, Y.; Ohe, Y.; Kuribayashi, K.; Tsuji, N.; Nishidate, T.; Kameshima, H.; Hirata, K.; Watanabe, N. Evaluating the utility of N1,N12-diacetylspermine and N1,N8-diacetylspermidine in urine as tumor markers for breast and colorectal cancers. Clin. Chim. Acta 2010, 411, 1894–1899. [Google Scholar] [CrossRef]
- Kajiwara, N.; Kakihana, M.; Maeda, J.; Kaneko, M.; Ota, S.; Enomoto, A.; Ikeda, N.; Sugimoto, M. Salivary metabolomic biomarkers for non-invasive lung cancer detection. Cancer Sci. 2024, 115, 1695–1705. [Google Scholar] [CrossRef]
- Soda, K. The mechanisms by which polyamines accelerate tumor spread. J. Exp. Clin. Cancer Res. 2011, 30, 95. [Google Scholar] [CrossRef] [PubMed]
- Milovic, V.; Turchanowa, L. Polyamines and colon cancer. Biochem. Soc. Trans. 2003, 31, 381–383. [Google Scholar] [CrossRef] [PubMed]
- Weiss, T.S.; Bernhardt, G.; Buschauer, A.; Thasler, W.E.; Dolgner, D.; Zirngibl, H.; Jauch, K.W. Polyamine levels of human colorectal adenocarcinomas are correlated with tumor stage and grade. Int. J. Color. Dis. 2002, 17, 381–387. [Google Scholar] [CrossRef] [PubMed]
- Wang, C.; Ruan, P.; Zhao, Y.; Li, X.; Wang, J.; Wu, X.; Liu, T.; Wang, S.; Hou, J.; Li, W.; et al. Spermidine/spermine N1-acetyltransferase regulates cell growth and metastasis via AKT/β-catenin signaling pathways in hepatocellular and colorectal carcinoma cells. Oncotarget 2017, 8, 1092–1109. [Google Scholar] [CrossRef]
- Tse, R.T.; Ding, X.; Wong, C.Y.; Cheng, C.K.; Chiu, P.K.; Ng, C.F. The association between spermidine/spermine N1-acetyltransferase (SSAT) and human malignancies. Int. J. Mol. Sci. 2022, 23, 5926. [Google Scholar] [CrossRef] [PubMed]
- Fukutake, N.; Ueno, M.; Hiraoka, N.; Shimada, K.; Shiraishi, K.; Saruki, N.; Ito, T.; Yamakado, M.; Ono, N.; Imaizumi, A.; et al. A novel multivariate index for pancreatic cancer detection based on the plasma free amino acid profile. PLoS ONE 2015, 10, e0132223. [Google Scholar] [CrossRef] [PubMed]
- Maeda, J.; Higashiyama, M.; Imaizumi, A.; Nakayama, T.; Yamamoto, H.; Daimon, T.; Yamakado, M.; Imamura, F.; Kodama, K. Possibility of multivariate function composed of plasma amino acid profiles as a novel screening index for non-small cell lung cancer: A case control study. BMC Cancer 2010, 10, 690. [Google Scholar] [CrossRef]
- Liu, J.; Wang, J.; Ma, X.; Feng, Y.; Chen, Y.; Wang, Y.; Xue, D.; Qiao, S. study of the relationship between serum amino acid metabolism and lymph node metastasis in patients with colorectal cancer. Oncol. Targets Ther. 2020, 13, 10287–10296. [Google Scholar] [CrossRef]
- Zhang, H.; Qiao, L.; Li, X.; Wan, Y.; Yang, L.; Wang, H. Tissue metabolic profiling of lymph node metastasis of colorectal cancer assessed by 1H NMR. Oncol. Rep. 2016, 36, 3436–3448. [Google Scholar] [CrossRef]
- Sastre, J.; Maestro, M.L.; Puente, J.; Veganzones, S.; Alfonso, R.; Rafael, S.; García-Saenz, J.A.; Vidaurreta, M.; Martín, M.; Arroyo, M.; et al. Circulating tumor cells in colorectal cancer: Correlation with clinical and pathological variables. Ann. Oncol. 2008, 19, 935–938. [Google Scholar] [CrossRef]
- Kure, K.; Hosoya, M.; Ueyama, T.; Fukaya, M.; Sugimoto, K.; Tomiki, Y.; Ohnaga, T.; Sakamoto, K.; Komiyama, H. Using the polymeric circulating tumor cell chip to capture circulating tumor cells in blood samples of patients with colorectal cancer. Oncol. Lett. 2020, 19, 2286–2294. [Google Scholar] [CrossRef] [PubMed]
- El Messaoudi, S.; Mouliere, F.; Du Manoir, S.; Bascoul-Mollevi, C.; Gillet, B.; Nouaille, M.; Fiess, C.; Crapez, E.; Bibeau, F.; Theillet, C.; et al. Circulating DNA as a strong multimarker prognostic tool for metastatic colorectal cancer patient management care. Clin. Cancer Res. 2016, 22, 3067–3077. [Google Scholar] [CrossRef]
- Fan, G.; Zhang, K.; Yang, X.; Ding, J.; Wang, Z.; Li, J. Prognostic value of circulating tumor DNA in patients with colon cancer: Systematic review. PLoS ONE 2017, 12, e0171991. [Google Scholar] [CrossRef] [PubMed]
- Tabernero, J.; Lenz, H.J.; Siena, S.; Sobrero, A.; Falcone, A.; Ychou, M.; Humblet, Y.; Bouché, O.; Mineur, L.; Barone, C.; et al. Analysis of circulating DNA and protein biomarkers to predict the clinical activity of regorafenib and assess prognosis in patients with metastatic colorectal cancer: A retrospective, exploratory analysis of the CORRECT trial. Lancet Oncol. 2015, 16, 937–948. [Google Scholar] [CrossRef]
- Reinert, T.; Henriksen, T.V.; Christensen, E.; Sharma, S.; Salari, R.; Sethi, H.; Knudsen, M.; Nordentoft, I.; Wu, H.T.; Tin, A.S.; et al. Analysis of plasma cell-free DNA by ultradeep sequencing in patients with stages I to III colorectal cancer. JAMA Oncol. 2019, 5, 1124–1131. [Google Scholar] [CrossRef] [PubMed]
- Yang, X.C.; Liu, H.; Liu, D.C.; Tong, C.; Liang, X.W.; Chen, R.H. Prognostic value of pan-immune-inflammation value in colorectal cancer patients: A systematic review and meta-analysis. Front. Oncol. 2022, 12, 1036890. [Google Scholar] [CrossRef]

| Feature | Controls | Polyps | Stages I–III | Stage IV | p-Value d | |
|---|---|---|---|---|---|---|
| Gender | Female | 1 | 19 | 87 | 8 | 0.7972 a |
| Male | 3 | 24 | 105 | 8 | ||
| Age | Median | 64 | 70 | 70 | 69 | 0.793 b |
| Min | 47 | 51 | 27 | 53 | ||
| Max | 87 | 84 | 97 | 84 | ||
| Body mass index (kg/m2) | Median | 23.5 | 21.2 | 22.1 | 21.4 | 0.387 b |
| Min | 17.1 | 17.9 | 14.9 | 13.7 | ||
| Max | 31.7 | 29.8 | 33.7 | 31.8 | ||
| Tumor size (mm) | Median | N/A c | N/A c | 39 | 57 | 0.061 |
| Min | N/A c | N/A c | 7 | 23 | ||
| Max | N/A c | N/A c | 125 | 176 | ||
Disclaimer/Publisher’s Note: The statements, opinions and data contained in all publications are solely those of the individual author(s) and contributor(s) and not of MDPI and/or the editor(s). MDPI and/or the editor(s) disclaim responsibility for any injury to people or property resulting from any ideas, methods, instructions or products referred to in the content. |
© 2024 by the authors. Licensee MDPI, Basel, Switzerland. This article is an open access article distributed under the terms and conditions of the Creative Commons Attribution (CC BY) license (https://creativecommons.org/licenses/by/4.0/).
Share and Cite
Ishizaki, T.; Sugimoto, M.; Kuboyama, Y.; Mazaki, J.; Kasahara, K.; Tago, T.; Udo, R.; Iwasaki, K.; Hayashi, Y.; Nagakawa, Y. Stage-Specific Plasma Metabolomic Profiles in Colorectal Cancer. J. Clin. Med. 2024, 13, 5202. https://doi.org/10.3390/jcm13175202
Ishizaki T, Sugimoto M, Kuboyama Y, Mazaki J, Kasahara K, Tago T, Udo R, Iwasaki K, Hayashi Y, Nagakawa Y. Stage-Specific Plasma Metabolomic Profiles in Colorectal Cancer. Journal of Clinical Medicine. 2024; 13(17):5202. https://doi.org/10.3390/jcm13175202
Chicago/Turabian StyleIshizaki, Tetsuo, Masahiro Sugimoto, Yu Kuboyama, Junichi Mazaki, Kenta Kasahara, Tomoya Tago, Ryutaro Udo, Kenichi Iwasaki, Yutaka Hayashi, and Yuichi Nagakawa. 2024. "Stage-Specific Plasma Metabolomic Profiles in Colorectal Cancer" Journal of Clinical Medicine 13, no. 17: 5202. https://doi.org/10.3390/jcm13175202
APA StyleIshizaki, T., Sugimoto, M., Kuboyama, Y., Mazaki, J., Kasahara, K., Tago, T., Udo, R., Iwasaki, K., Hayashi, Y., & Nagakawa, Y. (2024). Stage-Specific Plasma Metabolomic Profiles in Colorectal Cancer. Journal of Clinical Medicine, 13(17), 5202. https://doi.org/10.3390/jcm13175202