Article

The SpO2/FiO2 Ratio Combined with Prognostic Scores for Pneumonia and COVID-19 Increases Their Accuracy in Predicting Mortality of COVID-19 Patients

1
Department of Surgery, Dentistry, Paediatrics, and Gynaecology, Division of Cardiac Surgery, University of Verona Medical School, 37129 Verona, Italy
2
Department of Health Promotion, Mother and Child Care, Internal Medicine and Medical Specialties, University of Palermo, 90127 Palermo, Italy
3
Pediatric Infectious Disease Unit, “G. Di Cristina” Hospital, ARNAS Civico Di Cristina Benfratelli, 90127 Palermo, Italy
4
Section of Infectious Diseases, Department of Mental Health and Public Medicine, University of Campania “Luigi Vanvitelli”, 80131 Naples, Italy
5
Infectious and Tropical Disease Unit, AOU Policlinico “P. Giaccone”, 90127 Palermo, Italy
*
Author to whom correspondence should be addressed.
J. Clin. Med. 2024, 13(19), 5884; https://doi.org/10.3390/jcm13195884
Submission received: 24 August 2024 / Revised: 29 September 2024 / Accepted: 30 September 2024 / Published: 2 October 2024

Abstract

:
Background: Identifying high-risk COVID-19 patients is critical for emergency department decision-making. Our study’s primary objective was to identify new independent predictors of mortality and their predictive utility in combination with traditional pneumonia risk assessment scores and new risk scores for COVID-19 developed during the pandemic. Methods: A retrospective study was performed in two Italian University Hospitals. A multivariable logistic model was used to locate independent parameters associated with mortality. Results: Age, PaO2/FiO2, and SpO2/FiO2 ratios were found to be independent parameters associated with mortality. This study found that the Pneumonia Severity Index (PSI) was superior to many of the risk scores developed during the pandemic, for example, the International Severe Acute Respiratory Infection Consortium Coronavirus Clinical Characterisation Consortium (ISARIC 4C) (AUC 0.845 vs. 0.687, p < 0.001), and to many of the risk scores already in use, for example, the National Early Warning Score 2 (NEWS2) (AUC 0.845 vs. 0.589, p < 0.001). Furthermore, our study found that the Pneumonia Severity Index had a similar performance to other risk scores, such as CRB-65 (AUC 0.845 vs. 0.823, p = 0.294). Combining the PaO2/FiO2 or SpO2/FiO2 ratios with the risk scores analyzed improved the prognostic accuracy. Conclusions: Adding the SpO2/FiO2 ratio to the traditional, validated, and already internationally known pre-pandemic prognostic scores seems to be a valid and rapid alternative to the need for developing new prognostic scores. Future research should focus on integrating these markers into existing pneumonia scores to improve their prognostic accuracy.

1. Introduction

Noninvasive risk assessment is crucial in patients with COVID-19 in the emergency department [1]. Objective prognostic information describing the probability of survival for patients on admission may inform doctors in improving triage before admission and the proportionality of treatment during admission [2]. There have been efforts to develop predictive scores and algorithms to address these needs, and an example is the International Severe Acute Respiratory Infection Consortium Coronavirus Clinical Characterisation Consortium (ISARIC 4C) [3]. Given the heterogeneity in symptoms on presentation and the potential outcomes [4,5], it is not surprising that many of the tools proposed so far have relied on complex sets of parameters or specialized laboratory markers. New prognostic scores created during the COVID-19 pandemic have been added to the old prognostic scores for pneumonia, such as the Pneumonia Severity Index (PSI), CURB-65, and NEWS2. The PSI has been demonstrated to be a powerful tool for predicting mortality in patients with COVID-19, and it performed significantly better than CURB-65 [6]. The simplified score of the CURB-65 or CRB-65 has been used to assess the severity of COVID-19 without the limit of laboratory data for blood urea nitrogen, especially during the COVID-19 pandemic; which may be a helpful score tool because of its simplicity in application, especially in emergent and complicated conditions [7]. Also, the National Early Warning Score 2 (NEWS2) index has been used to identify the risk of death of COVID-19 patients [8].
The PaO2/FiO2 ratio, derived from arterial blood gas analysis, remains the gold standard for diagnosing acute respiratory failure. The noninvasive SpO2/FiO2 ratio has been found to correlate well with the PaO2/FiO2 ratio in adult and pediatric patients with pneumonia, acute respiratory distress syndrome (ARDS), and acute lung injury in various studies [9,10,11]. The SpO2/FiO2 ratio, measured within the first 6 h after hospital admission, is an independent indicator of ARDS development among patients at risk [12]. The SpO2/FiO2 ratio could represent a diagnostic and prognostic marker as a potential substitute, especially in resource-limited settings [13]. The ABC2-SPH risk score is an easy-to-use rapid scoring system based on the characteristics of COVID-19 patients, commonly available at hospital admission. It was designed and validated for early stratification of in-hospital mortality risk of patients with COVID-19 [14,15]. An analogous mortality risk score is the COVID-19 MRS, in which the PaO2/FiO2 ratio represents one of the criteria for the score [16]. Other studies have tried to optimize the prognostic effectiveness of existing scores in patients hospitalized with COVID-19. An example is National Early Warning Score 2 Plus (NEWS 2 Plus) [17]. Furthermore, our research group has recently developed the highly performing prognostic Cascio–Zinna COVID-19 score (CZ COVID-19) [18].
The first purpose of this study was to assess the predictive accuracy of the principal risk scores used during the COVID-19 pandemic and to compare them in terms of predicting in-hospital mortality. Secondly, our study aimed to evaluate the role of the PaO2/FiO2 and SpO2/FiO2 ratios as independent predictors of mortality in admitted patients with COVID-19 pneumonia and their predictive utility when combined with other scores developed to assess the severity of pneumonia or COVID-19.

2. Materials and Methods

2.1. Study Design and Setting

This retrospective study was conducted at multiple departments of two Italian University hospitals during the first and second waves of the COVID-19 pandemic: the infectious and tropical disease unit, internal medicine unit, and geriatric unit of the University Hospital “Policlinico Paolo Giaccone” of Palermo (Italy), and the infectious and tropical disease unit of the “Luigi Vanvitelli” University Hospital of Campania (Italy).
The medical records of 230 consecutive patients over 18 years admitted to the University Hospital of Palermo (first cohort) and of 1357 consecutive patients over 18 years admitted to the “Luigi Vanvitelli” University Hospital of Campania (Italy) (second cohort) during the first and second wave of the COVID-19 pandemic, between June 2020 and December 2021, were analyzed. The data collected refers to the period when the treatment protocols were developed, and no standard treatment was available. Therefore, none of the patients had previously received “early therapy” with antivirals or monoclonal.
The diagnosis of COVID-19 was based on the positive respiratory tract real-time polymerase chain reaction (RT-PCR) results for the SARS-CoV-2 nucleic acid.
This study was conducted in accordance with the Declaration of Helsinki [19].
All the experiments were performed following the relevant guidelines and regulations. Informed consent was obtained from all participants and/or their legal guardians.
This study was approved by the Ethics Committee of the University of Campania L. Vanvitelli, Naples (n°10,877/2020) and the Ethics Committee “Palermo I” of the A.O.U. Policlinico “Paolo Giaccone”, Palermo, Italy (verbal n. 11/2022, 12 December 2022).

2.2. Data Collection

The following variables were extracted for the first cohort of patients admitted to the University Hospital “Policlinico Paolo Giaccone” of Palermo (Italy):
-
epidemiological and demographic characteristics,
-
medical comorbidities,
-
Charlson Comorbidity Index (CCI) [20] on admission,
-
days from onset of symptoms to hospitalization,
-
days from positive swab to hospitalization,
-
days from onset of symptoms to positive swab,
-
Pneumonia Severity Index (PSI) [21] on admission,
-
CRB-65 score, abbreviated for confusion, respiratory rate, BP, and age > 65 years [22,23] on admission,
-
National Early Warning Score 2 (NEWS2) [24] on admission,
-
International Severe Acute Respiratory Infection Consortium Coronavirus Clinical Characterisation Consortium (ISARIC 4C) [3,25] on admission,
-
hospitalization or outpatient management of Patients with SARS-CoV-2 (HOME-CoV) [26] on admission,
-
ABC2-SPH risk score (ABC2-SPH) [14,15] on admission,
-
CAPS-D score [27] on admission,
-
SOARS score, abbreviated for SpO2, obesity, age, respiratory rate, and stroke history (SOARS) [28] on admission,
-
COVID-19 Severity Index [29] on admission,
-
ASCL score, abbreviated for age, sex, CRP at hospital admission, and LDH at hospital admission (ASCL) [30] on admission,
-
COVID-19 Early Warning Score (COEWS) [31] on admission,
-
National Early Warning Score 2 Plus (NEWS2 Plus) [17] on admission,
-
Cascio–Zinna COVID-19-mortality Score (CZ COVID-19) [18] on admission,
-
clinical presentation,
-
vital signs at first clinical contact (blood pressure, heart rate, oxygen saturation, respiratory rate, body temperature),
-
respiratory function,
-
laboratory tests,
-
imaging,
-
oxygen therapy,
-
days of hospitalization.
For the second cohort, patients admitted to the Luigi Vanvitelli University Hospital in Campania (Italy), fewer variables but sufficient for our study were extracted. Unfortunately, the SpO2/FiO2 ratio could not be evaluated in the second cohort due to a lack of data.
The above data were derived from paper medical records and stored in a Microsoft Access database.

2.3. Statistical Analyses

Data distribution was evaluated using the Shapiro–Wilk test. In the descriptive analysis, the mean (μ) and standard deviation (SD) were calculated for continuous values with normal distribution and median (μe) and interquartile range (IQR) for continuous values without normal distribution, and absolute and relative frequencies were calculated for categorical variables.
In the bivariate analysis, we calculated p-values using an unpaired Student’s t-test and Chi-Square for categorical variables. A p-value of less than 0.05 was considered statistically significant. All tests were two-tailed.
Multivariable analysis was performed using forward conditional stepwise logistic regression to examine the association between clinical and laboratory parameters and the risk of death. The dependent variable was a favorable clinical outcome or death, and the independent variables were selected according to clinical and statistical criteria in several stages.
The PaO2/FiO2 ratio threshold chosen to plot the receiver operating characteristic (ROC) curves was ≤300 mmHg; this threshold corresponds to the definition of both severe COVID-19 and acute respiratory distress syndrome (ARDS) [32]. The SpO2/FiO2 ratio thresholds were determined using the ROC curves. The agreement between the SpO2/FiO2 and the PaO2/FiO2 ratios was assessed using the Pearson correlation coefficient [33].
Failure to register one of the parameters studied in this clinical study was the criteria for exclusion at entry into this study.
For the statistical analysis, we used IBM SPSS, version 26, and MedCalc and Matlab, version R2023b; for graphical statistical presentation, we used the GraphPad Prism Package, version 9, and TIBCO Software Statistica (formerly StatSoft), version 10.

2.4. Combination of Risk Scores and an Independent Predictor of Mortality

We examined the discriminative power of the PaO2/FiO2 and SpO2/FiO2 ratios in predicting mortality in patients with COVID-19 pneumonia and their predictive utility when combined with CCI, with CRB-65 and NEWS2 scores, and with new main scorings developed during the COVID-19 pandemic such as the ISARIC 4C, HOME-CoV, ABC2-SPH, CAPS-D, SOARS, COVID-19 Severity Index, ASCL, COEWS and CZ COVID-19. The combinations of these rating systems with independent predictors of mortality (PaO2/FiO2 or SpO2/FiO2 ratios) were formed by logistic regression analysis of the estimates of predicted probabilities. The ROC analysis was used to calculate the area under the curve (AUC) of the prediction models. DeLong’s statistic test was used to compare the AUC of the prediction models [34]. In the end, the net reclassification index (NRI) was calculated to measure the prediction increment of these new biomarkers, PaO2/FiO2 or SpO2/FiO2, when added to various prognostic scores.

3. Results

We included 230 patients (40 died, 17.39% of the sample) with a μ ± SD age of 66.91 ± 15.50 in the first cohort and 1357 patients (104 died, 7.67% of the sample) with a μ ± SD age of 61.33 ± 16.07 in the second cohort (Supplementary Table S1).
In the first cohort, the most common comorbidities encountered were arterial hypertension with 136 (59.1%) cases, diabetes (81, 35.2%), and cardiovascular disease (47, 20.4%); 105 patients (45.7%) had a CCI > 4 points, of these, 29 patients died (72.5%, p < 0.001). In the first cohort, the most frequent symptoms of clinical onset were fever (53.5%) and cough (25.2%); 67 (29.1%) and 60 patients (26.1%) had a CRB-65 on admission ≥ 2 points and a PSI on admission ≥ IV risk class, respectively; of these, ≥ 70% died (72.5%, p < 0.001; 70.0%, p < 0.001; respectively). In the same way, 84 (36.5%) and 125 patients (85.0%) had an ABC2-SPH on admission ≥ 5 points and SOARS on admission ≥ 3 points, respectively; of these, 72.5% (p < 0.001) and 85.0% died (p < 0.001), respectively. A total of 142 (61.7%) and 168 patients (73.0%) had a COVID-19 Severity Index on admission and ASCL on admission ≥ 7 points, respectively; of these, 30 (75.0%, p = 0.058) and 35 patients (87.5%, p = 0.023) died, respectively. Almost all deceased patients had a NEWS2 on admission ≥ 3 points (36 dead patients, 90.0%) and NEWS2 Plus on admission ≥ 5 points (40 dead patients, 100%). A total of 203 patients (88.3%) were classified in a high-risk group for CZ COVID-19; of these, 40 patients died (p < 0.001). The median calculated for ISARIC 4C on admission, COEWS on admission, and CAPS-D on admission were 6 points (IQR 5–7), 2 points (1–4) and 11 points (IQR 8–13), respectively, with an increase in the calculated score to 7 points (IQR 6–8, p = 0.002) in dead patients for ISARIC 4C, 14 points (IQR 35.0, p = 0.002) in dead patients for COEWS and 14 points (IQR 10–16, p < 0.001) in dead patients for CAPS-D. (Supplementary Table S1).
The mean duration of the hospital recovery ± SD was 15.94 ± 11.55 and 15.86 ± 9.21 days in the first and second cohorts, respectively (Supplementary Table S1).
The hemoglobin (Hb) values were lower in patients who died (11.05 ± 2.53 g/dL, p < 0.001, first cohort; 12.71 ± 1.14 g/dL, p = 0.05, second cohort), as were the platelet (PLT) count (208 ± 108 × 103/µL, p = 0.003, first cohort; 289 ± 110 × 103/µL, p = 0.174, second cohort), baseline oxygen saturation (SpO2) percentage (95 ± 3%, p = 0.041, first cohort; 85 ± 6%, p < 0.001, second cohort); conversely, the white blood cell (WBC) count values were higher in patients who died (18,417 ± 5595 cell/µL, p = 0.009, first cohort; 9722 ± 5008 cell/µL, p = 0.006, second cohort) (Supplementary Table S1). Likewise, the PaO2/FiO2 ratio (287 ± 70, p = 0.015, first cohort; 182 ± 94, p < 0.001, second cohort) and the SpO2/FiO2 ratio (353 ± 78, p = 0.046, first cohort) values were lower in patients who died (Supplementary Table S1). A scatter plot of the SpO2/FiO2 and PaO2/FiO2 ratios demonstrated a linear correlation in the first cohort (p < 0.001 by Pearson correlation coefficient) (Figure 1). A total of 103 (44.8%) and 595 patients (43.8%) had a PaO2/FiO2 ratio ≤ 300 on admission in the first and second cohorts; of these, >80% died (82.5%, p = 0.015; 92.9%; p < 0.001; respectively). In the first cohort, 91 patients (39.6%), of which 30 patients died (75.0%), had a SpO2/FiO2 ratio ≤ 350 (Supplementary Table S1). We classified the patients into two risk categories (a low-risk group and a high-risk group) according to their PaO2/FiO2 and SpO2/FiO2 ratios in the first cohort and only according to their PaO2/FiO2 ratio in the second cohort (p < 0.001 by Log-rank test) (Figure 2). Figure 2 shows the above groups’ Kaplan-Meier curve [35].
After performing multivariate analysis, only age (OR 1.130, 95% CI 1.127–1.186 and p < 0.001 in the first cohort; OR 1.117, 95% CI 1.093–1.142 and p < 0.001 in the second cohort) and the PaO2/FiO2 ratio (OR 0.994, 95% CI 0.989–0.999 and p = 0.022 in first cohort; OR 0.990, 95% CI 0.897–0.993 and p < 0.001 in second cohort) were found to be independent parameters in predicting mortality in both cohorts (Table 1).

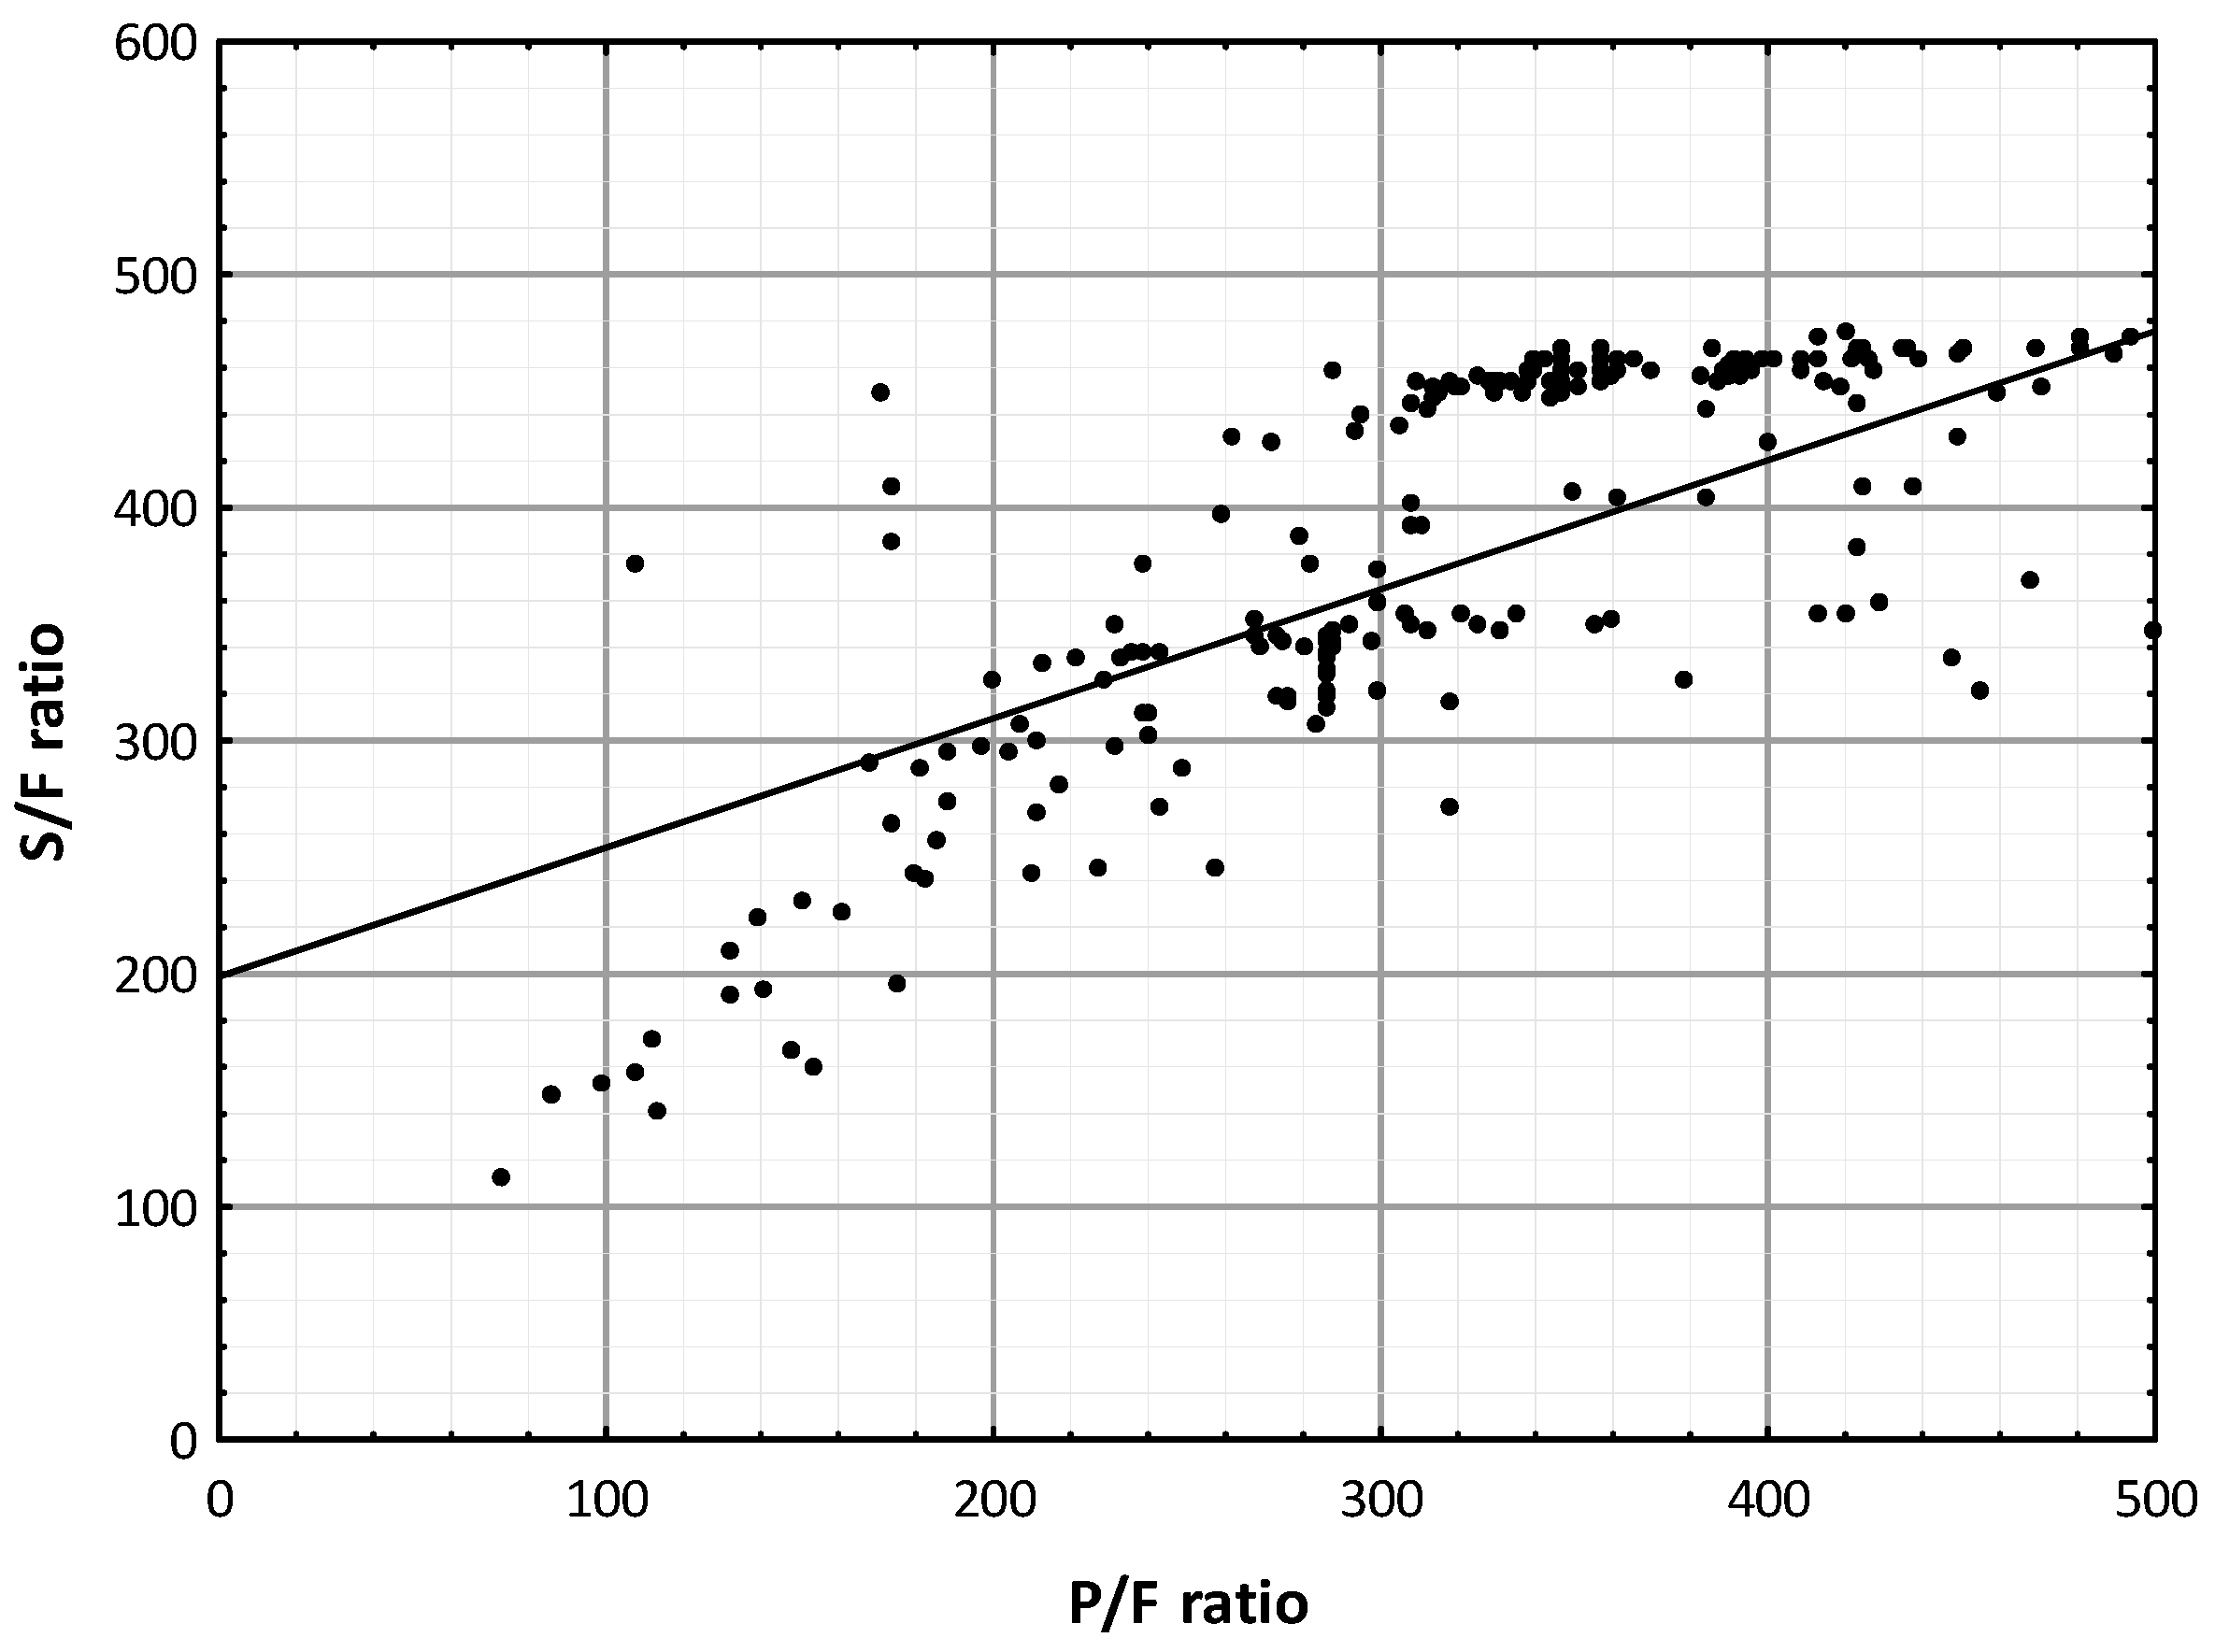
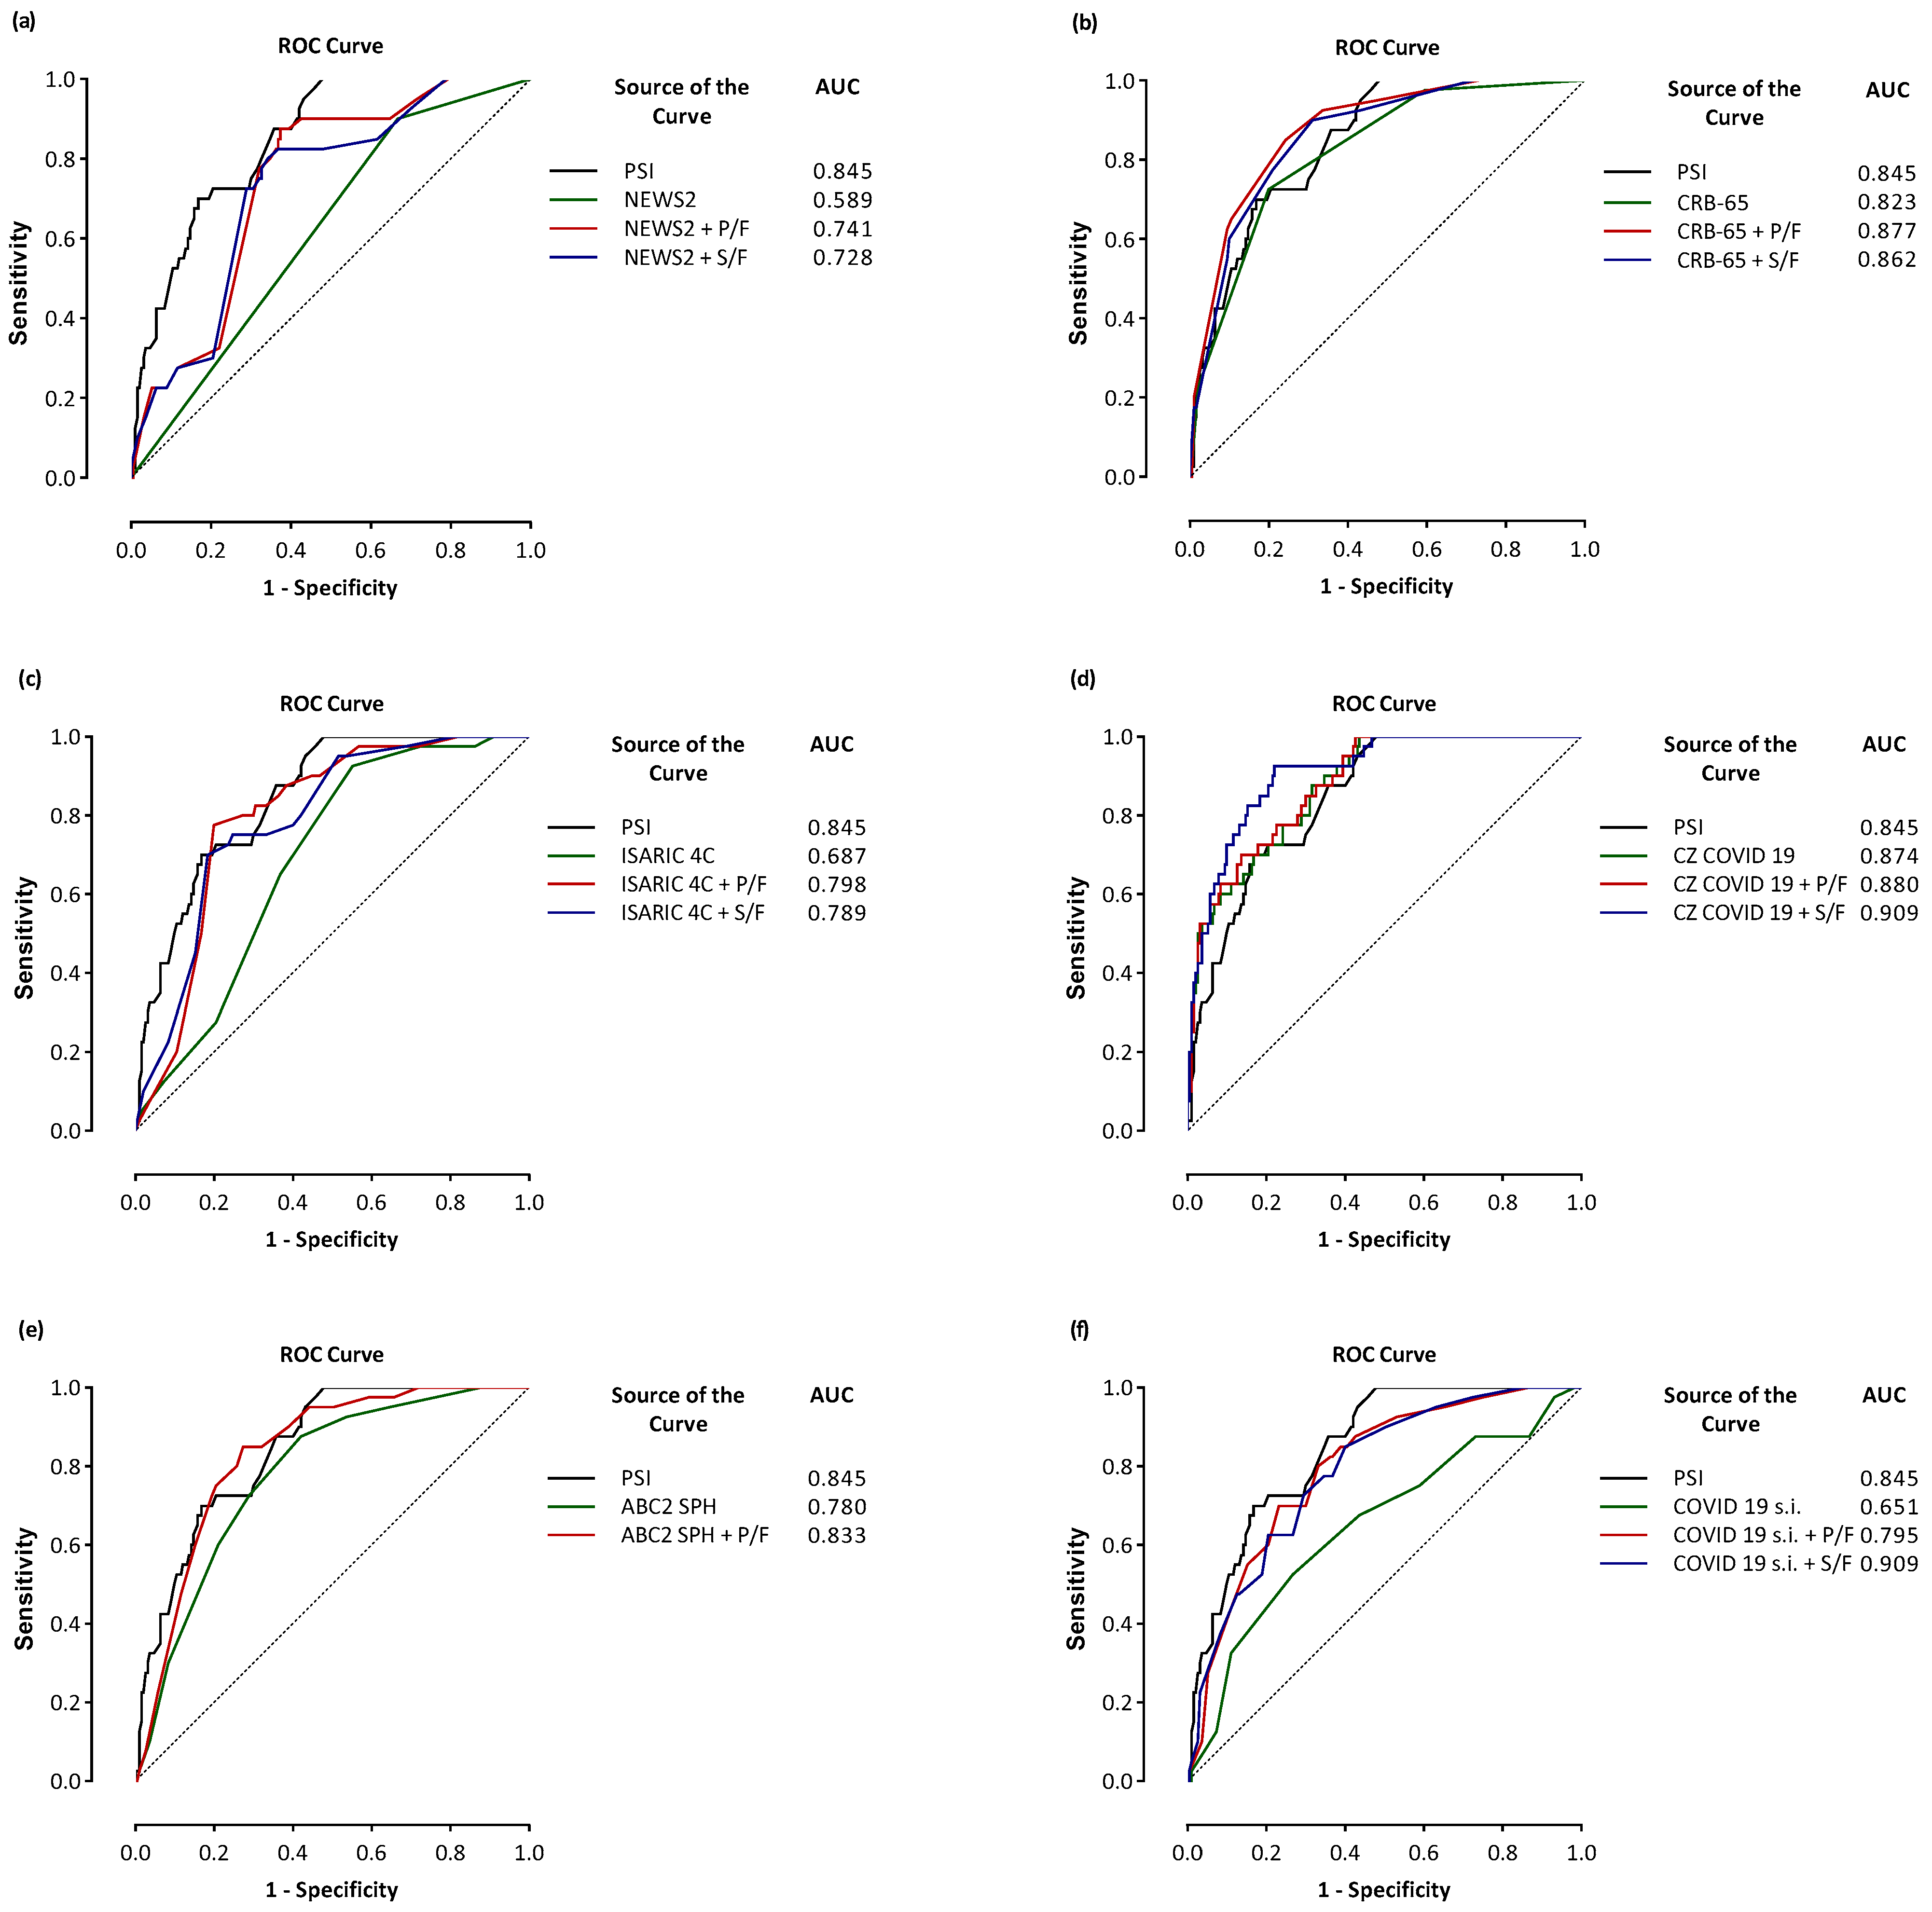
Comparison Scores and Combined Scores with the PaO2/FiO2 or SpO2/FiO2 Ratios

The PSI, CRB-65, and NEWS2 have fair discriminative ability. The PSI scored better than CRB-65 and NEWS2 in predicting mortality (AUC 0.766 vs. 0.763, p = 0.891; AUC 0.766 vs. 0.616, p = 0.003, respectively). Adding the PaO2/FiO2 ratio to CRB-65 improved the performance compared to CRB-65 alone (AUC 0.877 vs. 0.763, p < 0.001), and adding the SpO2/FiO2 ratio to CRB-65 improved the performance compared to CRB-65 alone (AUC 0.862 vs. 0.763, p < 0.001). Both the PaO2/FiO2 ratio combined with CRB-65 and the SpO2/FiO2 ratio combined with CRB-65 have a good discriminative ability and seemed to be more favorable than the PSI (AUC 0.877 vs. 0.766; AUC 0.862 vs. 0.766), and significant differences were found (p < 0.001 and p < 0.001, respectively) (Table 2 and Figure 3).
Similarly, adding the PaO2/FiO2 and SpO2/FiO2 ratios to NEWS2 improved the performance compared to NEWS2 alone (AUC 0.741 vs. 0.616, p < 0.001; AUC 0.728 vs. 0.616, p < 0.001; respectively). However, the PaO2/FiO2 or SpO2/FiO2 ratios combined with NEWS2 did not have a good discriminative ability and seemed to be more favorable than PSI (AUC 0.741 vs. 0.766; AUC 0.728 vs. 0.766; respectively), and no significant differences were found (p = 0.631 and p = 0.483, respectively) (Table 2 and Figure 3).
The results of the global comparative analysis of the ROC curves and Net Reclassification Improvement of risk scorings are shown in Table 3. Every score was compared to the PaO2/FiO2 or the SpO2/FiO2 ratios combined with corresponding scores. This initial examination revealed that combining the PaO2/FiO2 or SpO2/FiO2 ratios with the same score enhances predictive validity. The COWES score (AUC 0.658, 95% IC 0.593–0.719) is an example, compared to the PaO2/FiO2 ratio combined with COWES (AUC 0.783, 95% IC 0.724–0.834, p = 0.005; NRI 0.311, p = 0.016) and the SpO2/FiO2 ratio combined with COWES (AUC 0.787, 95% CI 0.729–0.983, p = 0.009; NRI 307, p = 0.012). The PSI was compared to the other scores with or without the PaO2/FiO2 or SpO2/FiO2 ratios in Table 3. The analysis shows that the PSI (AUC 0.845, 95% CI 792–0.890, 0.792–0.890) is similar to the CRB-65 (AUC 0.823, 95% CI 0.767–0.870, p = 0.294), SOARS (AUC 0.759, 95% CI 0.699–0.813, p = 0.045) and CZ COVID–19 (AUC 0.874, 95% CI 0.824–0.914, p = 0.427). The PaO2/FiO2 or SpO2/FiO2 ratios, if added to other scores with lower predictive power than the PSI, determined an increase in their diagnostic accuracy equal to the PSI, according to this study. The COVID-19 Severity Index (AUC 0.651, 95% CI 0.586–0.713, p-value compared to PSI 0.001) is an example. Indeed, the COVID-19 Severity Index combined with the PaO2/FiO2 ratio has an AUC of 0.795 (95% CI 0.737–0.845, p-value compared to PSI = 0.229), and it has an NRI 0.212 (p = 0.013). The same COVID-19 Severity Index combined with the SpO2/FiO2 ratio has an AUC of 0.909 (95% CI 0.864–0.943, p-value compared to PSI = 0.168), and it has an NRI 0.193 (p = 0.039). Similar findings were highlighted for other risk scores and ISARIC 4C (AUC 0.687, 95% CI 0.623–0.746, p < 0.001), ISARIC 4C combined with the PaO2/FiO2 ratio (AUC 798, 95% CI 0.740–0.848, p = 0.220; NRI 203, p = 0.006), and ISARIC 4C combined with the SpO2/FiO2 (AUC 0.789, 95% CI 0.730–0.839, p = 0.156; NRI 143, p = 0.043). Although not statistically significant (p = 0.068), the SpO2/FiO2 ratio with CZ COVID-19 has an AUC of 0.909 (95% CI 0.894–0.943), a sensitivity of 92.5%, and a specificity of 77.9% highest respect the PSI (AUC 0.845, sensitivity of 70.0%, and specificity 83.2%). We obtained a similar result (AUC 0.909 vs. 0.875, sensitivity 92.5% vs. 87.5%, and specificity 77%, respectively) when comparing the SpO2/FiO2 ratio with CZ COVID-19 and the SpO2/FiO2 ratio with the PSI. The significance level was 0.249 (Table 3 and Figure 3).

4. Discussion

Decision-making tactics in the COVID-19 patients’ approach to hospital admission were the focus of our research. Our study shows that at the beginning of the pandemic, they had prognostic scores that were valid in identifying patients who required more care, for example, the PSI. Our study also shows that other existing prognostic scores, such as the CRB-65 or those developed during the pandemic wave, such as ISARIC 4C, are excellent prognostic scores when combined with independent predictors of mortality, as the PaO2/FiO2 or SpO2/FiO2 ratios.
The COVID-19 challenge has spread a strong message to the world: the need to build a resilient and sustainable health system [36]. The timely detection of COVID-19 patients with a higher risk of mortality is essential to reduce mortality and better manage hospital resources [37]. COVID-19 ARDS is a severe, predictable complication of COVID-19 that requires early recognition and comprehensive management [38]. Our analysis shows a strong association between mortality from COVID-19 with advanced age and low PaO2/FiO2 and SpO2/FiO2 ratios. Observations from our retrospective study showed that SARS-CoV-2 patients with PaO2/FiO2 ratio levels lower than 300 and with SpO2/FiO2 ratio levels lower than 350 are at higher risk of in-hospital mortality than those with higher levels. The PaO2/FiO2 ratio is used to classify the severity of ARDS [39]. A PaO2/FiO2 ratio < 300 showed at least a two- to three-fold correlation to adverse outcomes; this may provide simple but straightforward targets for clinicians facing COVID-19 respiratory failure in a non-ICU setting [40].
The noninvasive parameter SpO2/FiO2 ratio was found to be correlated with the PaO2/FiO2 ratio in patients with COVID-19 pneumonia [9,41]. The SpO2/FiO2 ratio, calculated on the first days of hospitalization, is independently associated with mortality, has a predictive capacity for 28-day mortality, and is a good alternative to the PaO2/FiO2 ratio [42]. Furthermore, the SpO2/FiO2 ratio is a noninvasive prognostic marker that facilitates early adjustment for treatment, thus improving overall survival [43]. Moreover, it is undeniable that pulse oximeters are becoming increasingly widespread and can provide costless monitoring. Hence, replacing the PaO2/FiO2 ratio with the SpO2/FiO2 ratio may allow resource-limited facilities to diagnose acute respiratory failure objectively [13]. The SpO2/FiO2 ratio has already been included in some scores, an example of which is the ABC2-SPH developed by a Spanish research group [14,15].
Our analysis confirms that the PSI score is a good predictor for mortality in patients with COVID-19 pneumonia, but it is very complex and includes many variables. In the evaluation of COVID-19 pneumonia, we need scores that are quick and easy to use [44]. Our analysis shows that the CRB-65 score was a good alternative predictor for mortality in patients with COVID-19 pneumonia, and a combination of the PaO2/FiO2 or SpO2/FiO2 ratios with CRB-65 was a good equal alternative to the PSI score. In a meta-analysis, Chalmers JD et al. [45] confirmed that CURB-65 and CRB-65 have a predictive performance similar to the PSI [46]. In another meta-analysis, Zaki HA et al. [47] obtained CURB-65 respect PSI was slightly better in early mortality prediction and predicting admission to intensive care support [46]. Finally, in several clinical studies comparing CURB-65 to CRB-65, it emerges that CRB-65 was more sensitive as a predictor of death as well as guidance for hospitalization, and it is a more practical score since it does not use laboratory variables [23,47,48]. The NEWS2 score may not accurately reflect the severity of hypoxemia and lung injury [49]. According to this study, the PaO2/FiO2 or SpO2/FiO2 ratios, when added to other prognostic scores with lower predictive power than the PSI, determined an increase in their diagnostic acuity equal to the PSI.
Since the first SARS-CoV-2 infection was identified in December 2019, the COVID-19 pandemic has significantly increased morbidity and mortality around the world [50]. Early detection of patients likely to develop critical illness is essential and may aid in delivering proper care and optimizing the use of limited resources [51]. Several studies have derived prognostic predictors for COVID-19 [3]. It is important to use clear and objective criteria for risk stratification and early diagnosis of patients at a high risk of clinical worsening [52]. Thanks to this, new risk scores for predicting in-hospital mortality have been developed by categorizing patients at low, intermediate, high, or very high risk of death [3,16]. Prognostic scores attempt to transform complex clinical pictures into tangible numerical values [3]. Unfortunately, only a few models have found their way into routine care at the ED [53].
The ISARIC 4C mortality score indicates mortality risk at admission based on demographic and physiological parameters derived from a national-level population cohort study in the United Kingdom (UK) [54]. The CURB-65 and ISARIC 4C scores showed comparable performance [55]. The CZ COVID-19 score is a valid alternative to the PSI score for quickly stratifying COVID-19 patients on admission and facilitating decision-making. Furthermore, the SpO2/FiO2 ratio combined with the CZ COVID-19 score has a greater predictive power than the PSI.
This study looked at the role of the SpO2/FiO2 ratio as an independent factor linked to death, and it was seen that this biomarker, when added to the diagnostic scores for pneumonia and COVID-19, increases their accuracy. We used both the standard AUC metric and the NRI metric to accomplish this. The NRI is an increasingly popular measure for evaluating improvements in risk predictions [56]. Despite its limitations, the NRI seeks to quantify whether a new marker provides clinically relevant improvements in prediction models [57,58].

5. Conclusions

Adding the SpO2/FiO2 ratio to the traditional, validated, and already internationally known pre-pandemic prognostic scores is a valid alternative to the need for developing new prognostic scores. The SpO2/FiO2 ratio combined with the multiple scores developed for the COVID-19 disease significantly increases their predictive power. The SpO2/FiO2 ratio combined with the CZ COVID-19 score obtained a greater sensitivity and specificity than the PSI.

Supplementary Materials

The following supporting information can be downloaded at: https://www.mdpi.com/article/10.3390/jcm13195884/s1, Table S1: Univariate and bivariate statistical analysis of the first and second cohort of patients.

Author Contributions

G.Z., conceptualization, data curation, formal analysis, software, methodology, writing–original draft, writing–reviewing and editing; L.P., data curation; C.C., data curation; N.S., data curation; A.L., data curation; M.B., data curation; A.R., data curation; N.C., data curation; A.C., conceptualization, data curation, methodology, project administration, validation, writing—reviewing and editing, supervision. All authors have read and agreed to the published version of the manuscript.

Funding

This research received no external funding.

Institutional Review Board Statement

This study was approved by the Ethics Committee of the University of Campania L. Vanvitelli, Naples (n°10,877/2020) and by the Ethics Committee “Palermo I” of the A.O.U. Policlinico “Paolo Giaccone”, Palermo, Italy (verbal n. 11/2022, 12 December 2022).

Informed Consent Statement

Not applicable.

Data Availability Statement

Data presented in this study are available on request from the corresponding author.

Conflicts of Interest

The authors declare no conflicts of interest.

Acronyms and Abbreviations

ABC2-SPH: ABC2-SPH risk score; ASCL: ASCL score abbreviated for age, sex, CRP at hospital admission, and LDH at hospital admission; ARDS: acute respiratory distress syndrome; AUC: area under the curve; CAPS-D: CAPS-D score; CCI: Charlson Comorbidity Index; COEWS: COVID-19 Early Warning Score; COVID-19 Severity Index: COVID-19 Severity Index; CRB-65: CRB-65 score abbreviated for confusion, respiratory rate, BP, and age > 65 years; CZ COVID-19: Cascio–Zinna COVID-19 mortality score; FiO2: fraction of inspired O2; Hb: hemoglobin; HOME-CoV score: hospitalization or outpatient management of patients with SARS-CoV-2 infection; HR: heart rate; IL-6: interleukin-6; IMV: Invasive Mechanical Ventilation; IQR: interquartile range; ISARIC 4C: International Severe Acute Respiratory Infection Consortium Coronavirus Clinical Characterisation Consortium; NEWS2 Plus: National Early Warning Score 2 Plus; NEWS2: National Early Warning Score 2; NIV: non-invasive ventilation; NRI: Net Reclassification Index; LDH, lactate dehydrogenase; PLT, platelets; PSI, Pneumonia Severity Index; SD, standard deviation; SOARS: SOARS score abbreviated for SpO2, obesity, age, respiratory rate, and stroke history; SpO2: oxygen saturation; WBC: white blood cells; μ, mean; μe, median.

References

  1. Satici, M.O.; Islam, M.M.; Satici, C.; Uygun, C.N.; Ademoglu, E.; Altunok, İ.; Aksel, G.; Eroglu, S.E. The role of a noninvasive index ‘SpO2/FiO2’ in predicting mortality among patients with COVID-19 pneumonia. Am. J. Emerg. Med. 2022, 57, 54–59. [Google Scholar] [CrossRef] [PubMed]
  2. Abate, S.M.; Ahmed Ali, S.; Mantfardo, B.; Basu, B. Rate of Intensive Care Unit admission and outcomes among patients with coronavirus: A systematic review and Meta-analysis. PLoS ONE 2020, 15, e0235653. [Google Scholar] [CrossRef] [PubMed]
  3. Knight, S.R.; Ho, A.; Pius, R.; Buchan, I.; Carson, G.; Drake, T.M.; Dunning, J.; Fairfield, C.J.; Gamble, C.; Green, C.A.; et al. Risk stratification of patients admitted to hospital with COVID-19 using the ISARIC WHO Clinical Characterisation Protocol: Development and validation of the 4C Mortality Score. BMJ 2020, 370, m3339. [Google Scholar] [CrossRef]
  4. Stokes, E.K.; Zambrano, L.D.; Anderson, K.N.; Marder, E.P.; Raz, K.M.; El Burai Felix, S.; Tie, Y.; Fullerton, K.E. Coronavirus Disease 2019 Case Surveillance-United States, January 22–May 30, 2020. Morb. Mortal Wkly. Rep. 2020, 69, 759–765. [Google Scholar] [CrossRef] [PubMed]
  5. Wu, Z.; McGoogan, J.M. Characteristics of and Important Lessons From the Coronavirus Disease 2019 (COVID-19) Outbreak in China: Summary of a Report of 72,314 Cases from the Chinese Center for Disease Control and Prevention. JAMA 2020, 323, 1239–1242. [Google Scholar] [CrossRef]
  6. Satici, C.; Demirkol, M.A.; Sargin Altunok, E.; Gursoy, B.; Alkan, M.; Kamat, S.; Demirok, B.; Surmeli, C.D.; Calik, M.; Cavus, Z.; et al. Performance of pneumonia severity index and CURB-65 in predicting 30-day mortality in patients with COVID-19. Int. J. Infect. Dis. 2020, 98, 84–89. [Google Scholar] [CrossRef]
  7. Su, Y.; Tu, G.W.; Ju, M.J.; Yu, S.J.; Zheng, J.L.; Ma, G.G.; Liu, K.; Ma, J.F.; Yu, K.H.; Xue, Y.; et al. Comparison of CRB-65 and quick sepsis-related organ failure assessment for predicting the need for intensive respiratory or vasopressor support in patients with COVID-19. J. Infect. 2020, 81, 647–679. [Google Scholar] [CrossRef]
  8. Wibisono, E.; Hadi, U.; Bramantono; Arfijanto, M.V.; Rusli, M.; Rahman, B.E.; Asmarawati, T.P.; Choirunnisa, M.L.; Rahayu, D.R.P. National early warning score (NEWS) 2 predicts hospital mortality from COVID-19 patients. Ann. Med. Surg. 2022, 76, 103462. [Google Scholar] [CrossRef]
  9. Kumar, A.; Aggarwal, R.; Khanna, P.; Kumar, R.; Singh, A.K.; Soni, K.D.; Trikha, A. Correlation of the SpO2/FiO2 (S/F) ratio and the PaO2/FiO2 (P/F) ratio in patients with COVID-19 pneumonia. Med. Intensiv. (Engl. Ed.) 2022, 46, 408–410. [Google Scholar] [CrossRef]
  10. Rice, T.W.; Wheeler, A.P.; Bernard, G.R.; Hayden, D.L.; Schoenfeld, D.A.; Ware, L.B.; National Institutes of Health, National Heart, Lung; Blood Institute ARDS Network. Comparison of the SpO2/FiO2 ratio and the PaO2/FIO2 ratio in patients with acute lung injury or ARDS. Chest 2007, 132, 410–417. [Google Scholar] [CrossRef]
  11. Bilan, N.; Dastranji, A.; Ghalehgolab Behbahani, A. Comparison of the spo2/fio2 ratio and the PaO2/FiO2 ratio in patients with acute lung injury or acute respiratory distress syndrome. J. Cardiovasc. Thorac. Res. 2015, 7, 28–31. [Google Scholar] [CrossRef] [PubMed]
  12. Festic, E.; Bansal, V.; Kor, D.J.; Gajic, O. U.S. Critical Illness and Injury Trials Group: Lung Injury Prevention Study Investigators (USCIITG–LIPS). SpO2/FiO2 ratio on hospital admission is an indicator of early acute respiratory distress syndrome development among patients at risk. J. Intensive Care Med. 2015, 30, 209–216. [Google Scholar] [CrossRef]
  13. Carvalho, E.B.; Leite, T.R.S.; Sacramento, R.F.M.; Nascimento, P.R.L.D.; Samary, C.D.S.; Rocco, P.R.M.; Silva, P.L. Rationale and limitations of the SpO2/FiO2 as a possible substitute for PaO2/FiO2 in different preclinical and clinical scenarios. Rev. Bras. Ter. Intensiv. 2022, 34, 185–196. [Google Scholar] [CrossRef]
  14. Marcolino, M.S.; Pires, M.C.; Ramos, L.E.F.; Silva, R.T.; Oliveira, L.M.; Carvalho, R.L.R.; Mourato, R.L.S.; Sánchez-Montalvá, A.; Raventós, B.; Anschau, F.; et al. ABC2-SPH risk score for in-hospital mortality in COVID-19 patients: Development, external validation and comparison with other available scores. Int. J. Infect. Dis. 2021, 110, 281–308. [Google Scholar] [CrossRef] [PubMed]
  15. Cimini, C.C.R.; Delfino-Pereira, P.; Pires, M.C.; Ramos, L.E.F.; Gomes, A.G.D.R.; Jorge, A.O.; Fagundes, A.L.; Garcia, B.M.; Pessoa, B.P.; de Carvalho, C.A.; et al. Assessment of the ABC2-SPH risk score to predict invasive mechanical ventilation in COVID-19 patients and comparison to other scores. Front. Med. 2023, 10, 1259055. [Google Scholar] [CrossRef]
  16. Fumagalli, C.; Rozzini, R.; Vannini, M.; Coccia, F.; Cesaroni, G.; Mazzeo, F.; Cola, M.; Bartoloni, A.; Fontanari, P.; Lavorini, F.; et al. Clinical risk score to predict in-hospital mortality in COVID-19 patients: A retrospective cohort study. BMJ Open 2020, 10, e040729. [Google Scholar] [CrossRef] [PubMed]
  17. Trongtrakul, K.; Tajarernmuang, P.; Limsukon, A.; Theerakittikul, T.; Niyatiwatchanchai, N.; Surasit, K.; Glunriangsang, P.; Liwsrisakun, C.; Bumroongkit, C.; Pothirat, C.; et al. The National Early Warning Score 2 with Age and Body Mass Index (NEWS2 Plus) to Determine Patients with Severe COVID-19 Pneumonia. J. Clin. Med. 2024, 13, 298. [Google Scholar] [CrossRef]
  18. Zinna, G.; Pipitò, L.; Colomba, C.; Scichilone, N.; Licata, A.; Barbagallo, M.; Russo, A.; Almasio, P.L.; Coppola, N.; Cascio, A. The Development and Validation of a New Mortality Risk Score. J. Clin. Med. 2024, 13, 1832. [Google Scholar] [CrossRef]
  19. World Medical Association. World Medical Association Declaration of Helsinki: Ethical principles for medical research involving human subjects. JAMA 2013, 310, 2191–2194. [Google Scholar] [CrossRef]
  20. Christensen, D.M.; Strange, J.E.; Gislason, G.; Torp-Pedersen, C.; Gerds, T.; Fosbøl, E.; Phelps, M. Charlson Comorbidity Index Score and Risk of Severe Outcome and Death in Danish COVID-19 Patients. J. Gen. Intern. Med. 2020, 35, 2801–2803. [Google Scholar] [CrossRef]
  21. Ortega, L.; Sierra, M.; Domínguez, J.; Martínez, J.; Matas, L.; Bastart, F.; Galí, N.; Ausina, V. Utility of a pneumonia severity index in the optimization of the diagnostic and therapeutic effort for community-acquired pneumonia. Scand. J. Infect. Dis. 2005, 37, 657–663. [Google Scholar] [CrossRef] [PubMed]
  22. Keller, K.; Schmitt, V.H.; Sagoschen, I.; Münzel, T.; Espinola-Klein, C.; Hobohm, L. CRB-65 for Risk Stratification and Prediction of Prognosis in Pulmonary Embolism. J. Clin. Med. 2023, 12, 1264. [Google Scholar] [CrossRef] [PubMed]
  23. McNally, M.; Curtain, J.; O’Brien, K.K.; Dimitrov, B.D.; Fahey, T. Validity of British Thoracic Society guidance (the CRB-65 rule) for predicting the severity of pneumonia in general practice: Systematic review and meta-analysis. Br. J. Gen. Pract. 2010, 60, e42. [Google Scholar] [CrossRef] [PubMed]
  24. Smith, G.B.; Redfern, O.C.; Pimentel, M.A.; Gerry, S.; Collins, G.S.; Malycha, J.; Prytherch, D.; Schmidt, P.E.; Watkinson, P.J. The National Early Warning Score 2 (NEWS2). Clin. Med. 2019, 19, 260. [Google Scholar] [CrossRef]
  25. Crocker-Buque, T.; Myles, J.; Brentnall, A.; Gabe, R.; Duffy, S.; Williams, S.; Tiberi, S. Using ISARIC 4C mortality score to predict dynamic changes in mortality risk in COVID-19 patients during hospital admission. PLoS ONE 2022, 17, e0274158. [Google Scholar] [CrossRef]
  26. Douillet, D.; Riou, J.; Morin, F.; Mahieu, R.; Chauvin, A.; Gennai, S.; Ferrant, L.; Lopez, R.; Sebbane, M.; Plantefeve, G.; et al. Derivation and validation of a risk-stratification model for patients with probable or proven COVID-19 in EDs: The revised HOME-CoV score. Emerg. Med. J. 2024, 41, 218–225. [Google Scholar] [CrossRef]
  27. Werfel, S.; Jakob, C.E.M.; Borgmann, S.; Schneider, J.; Spinner, C.; Schons, M.; Hower, M.; Wille, K.; Haselberger, M.; Heuzeroth, H.; et al. Development and validation of a simplified risk score for the prediction of critical COVID-19 illness in newly diagnosed patients. J. Med. Virol. 2021, 93, 6703–6713. [Google Scholar] [CrossRef]
  28. Chua, F.; Vancheeswaran, R.; Draper, A.; Vaghela, T.; Knight, M.; Mogal, R.; Singh, J.; Spencer, L.G.; Thwaite, E.; Mitchell, H.; et al. Early prognostication of COVID-19 to guide hospitalisation versus outpatient monitoring using a point-of-test risk prediction score. Thorax 2021, 76, 696–703. [Google Scholar] [CrossRef] [PubMed]
  29. Huespe, I.; Carboni Bisso, I.; Di Stefano, S.; Terrasa, S.; Gemelli, N.A.; Las Heras, M. COVID-19 Severity Index: A predictive score for hospitalized patients. Med. Intensiv. (Engl. Ed.) 2022, 46, 98–101. [Google Scholar] [CrossRef]
  30. Scotto, R.; Lanzardo, A.; Buonomo, A.R.; Pinchera, B.; Cattaneo, L.; Sardanelli, A.; Mercinelli, S.; Viceconte, G.; Perrella, A.; Esposito, V.; et al. A Simple Non-Invasive Score Based on Baseline Parameters Can Predict Outcome in Patients with COVID-19. Vaccines 2022, 10, 2043. [Google Scholar] [CrossRef]
  31. Klén, R.; Huespe, I.A.; Gregalio, F.A.; Lalueza Blanco, A.L.; Pedrera Jimenez, M.; Garcia Barrio, N.; Valdez, P.R.; Mirofsky, M.A.; Boietti, B.; Gómez-Huelgas, R.; et al. Development and validation of COEWS (COVID-19 Early Warning Score) for hospitalized COVID-19 with laboratory features: A multicontinental retrospective study. Elife 2023, 12, e85618. [Google Scholar] [CrossRef] [PubMed]
  32. Catoire, P.; Tellier, E.; de la Rivière, C.; Beauvieux, M.C.; Valdenaire, G.; Galinski, M.; Revel, P.; Combes, X.; Gil-Jardiné, C. Assessment of the SpO2/FiO2 ratio as a tool for hypoxemia screening in the emergency department. Am. J. Emerg. Med. 2021, 44, 116–120. [Google Scholar] [CrossRef] [PubMed]
  33. Pripp, A.H. Pearsons eller Spearmans korrelasjonskoeffisienter [Pearson’s or Spearman’s correlation coefficients]. Tidsskr Nor Laegeforen. 2018, 138. [Google Scholar] [CrossRef] [PubMed]
  34. DeLong, E.R.; DeLong, D.M.; Clarke-Pearson, D.L. Comparing the areas under two or more correlated receiver operating characteristic curves: A nonparametric approach. Biometrics 1988, 44, 837–845. [Google Scholar] [CrossRef]
  35. Rich, J.T.; Neely, J.G.; Paniello, R.C.; Voelker, C.C.; Nussenbaum, B.; Wang, E.W. A practical guide to understanding Kaplan-Meier curves. Otolaryngol. Head. Neck Surg. 2010, 143, 331–336. [Google Scholar] [CrossRef]
  36. Haileamlak, A. The impact of COVID-19 on health and health systems. Ethiop. J. Health Sci. 2021, 31, 1073–1074. [Google Scholar]
  37. Zadeh Hosseingholi, E.; Maddahi, S.; Jabbari, S.; Molavi, G. Identification of High Death Risk Coronavirus Disease-19 Patients using Blood Tests. Adv. Biomed. Res. 2022, 11, 58. [Google Scholar] [CrossRef]
  38. Gibson, P.G.; Qin, L.; Puah, S.H. COVID-19 acute respiratory distress syndrome (ARDS): Clinical features and differences from typical pre-COVID-19 ARDS. Med. J. Aust. 2020, 213, 54–56.e1. [Google Scholar] [CrossRef]
  39. Kadkhodai, L.; Saghaei, M.; Habibzadeh, M.; Alikiaii, B.; Hashemi, S.J. Estimating the best fraction of inspired oxygen for calculation of PaO2/FiO2 ratio in acute respiratory distress syndrome due to COVID-19 pneumonia. J. Res. Med. Sci. 2022, 27, 38. [Google Scholar] [CrossRef]
  40. Sartini, S.; Massobrio, L.; Cutuli, O.; Campodonico, P.; Bernini, C.; Sartini, M.; Cristina, M.L.; Castellani, L.; Ceschi, L.; Spadaro, M.; et al. Role of SatO2, PaO2/FiO2 Ratio and PaO2 to Predict Adverse Outcome in COVID-19: A Retrospective, Cohort Study. Int. J. Environ. Res. Public Health 2021, 18, 11534. [Google Scholar] [CrossRef]
  41. Alberdi-Iglesias, A.; Martín-Rodríguez, F.; Ortega Rabbione, G.; Rubio-Babiano, A.I.; Núñez-Toste, M.G.; Sanz-García, A.; Del Pozo Vegas, C.; Castro Villamor, M.A.; Martín-Conty, J.L.; Jorge-Soto, C.; et al. Role of SpO2/FiO2 Ratio and ROX Index in Predicting Early Invasive Mechanical Ventilation in COVID-19. A Pragmatic, Retrospective, Multi-Center Study. Biomedicines 2021, 9, 1036. [Google Scholar] [CrossRef] [PubMed]
  42. Roozeman, J.P.; Mazzinari, G.; Serpa Neto, A.; Hollmann, M.W.; Paulus, F.; Schultz, M.J.; Pisani, L.; PRoVENT-COVID Collaborative Group. Prognostication using SpO2/FiO2 in invasively ventilated ICU patients with ARDS due to COVID-19-Insights from the PRoVENT-COVID study. J. Crit. Care 2022, 68, 31–37. [Google Scholar] [CrossRef] [PubMed]
  43. Lu, X.; Jiang, L.; Chen, T.; Wang, Y.; Zhang, B.; Hong, Y.; Wang, J.; Yan, F. Continuously available ratio of SpO2/FiO2 serves as a noninvasive prognostic marker for intensive care patients with COVID-19. Respir. Res. 2020, 21, 194. [Google Scholar] [CrossRef] [PubMed]
  44. García Clemente, M.M.; Herrero Huertas, J.; Fernández Fernández, A.; De La Escosura Muñoz, C.; Enríquez Rodríguez, A.I.; Pérez Martínez, L.; Gómez Mañas, S.; Iscar Urrutia, M.; López González, F.J.; Madrid Carbajal, C.J.; et al. Assessment of risk scores in COVID-19. Int. J. Clin. Pract. 2021, 75, e13705. [Google Scholar] [CrossRef]
  45. Chalmers, J.D.; Singanayagam, A.; Akram, A.R.; Mandal, P.; Short, P.M.; Choudhury, G.; Wood, V.; Hill, A.T. Severity assessment tools for predicting mortality in hospitalised patients with community-acquired pneumonia. Systematic review and meta-analysis. Thorax 2010, 65, 878–883. [Google Scholar] [CrossRef]
  46. Zaki, H.A.; Hamdi Alkahlout, B.; Shaban, E.; Mohamed, E.H.; Basharat, K.; Elsayed, W.A.E.; Azad, A. The Battle of the Pneumonia Predictors: A Comprehensive Meta-Analysis Comparing the Pneumonia Severity Index (PSI) and the CURB-65 Score in Predicting Mortality and the Need for ICU Support. Cureus 2023, 15, e42672. [Google Scholar] [CrossRef]
  47. Santana, A.R.; Amorim, F.F.; Soares, F.B.; de Souza Godoy, L.G.; de Jesus Almeida, L.; Rodrigues, T.A.; de Andrade Filho, G.M.; Silva, T.A.; da Silva Neto, O.G.; Rocha, P.H.G.; et al. Comparison of CURB-65 and CRB-65 as predictors of death in community-acquired pneumonia in adults admitted to an ICU. Crit. Care 2013, 17 (Suppl. 3), P39. [Google Scholar] [CrossRef]
  48. Ebell, M.H.; Walsh, M.E.; Fahey, T.; Kearney, M.; Marchello, C. Meta-analysis of Calibration, Discrimination, and Stratum-Specific Likelihood Ratios for the CRB-65 Score. J. Gen. Intern. Med. 2019, 34, 1304–1313. [Google Scholar] [CrossRef] [PubMed]
  49. Fan, G.; Tu, C.; Zhou, F.; Liu, Z.; Wang, Y.; Song, B.; Gu, X.; Wang, Y.; Wei, Y.; Li, H.; et al. Comparison of severity scores for COVID-19 patients with pneumonia: A retrospective study. Eur. Respir. J. 2020, 56, 2002113. [Google Scholar] [CrossRef]
  50. Chippa, V.; Aleem, A.; Anjum, F. Post-Acute Coronavirus (COVID-19) Syndrome; StatPearls Publishing: Treasure Island, FL, USA, 2024. [Google Scholar]
  51. Liang, W.; Liang, H.; Ou, L.; Chen, B.; Chen, A.; Li, C.; Li, Y.; Guan, W.; Sang, L.; Lu, J.; et al. Development and Validation of a Clinical Risk Score to Predict the Occurrence of Critical Illness in Hospitalized Patients With COVID-19. JAMA Intern. Med. 2020, 180, 1081–1089. [Google Scholar] [CrossRef]
  52. Doğanay, F.; Ak, R. Performance of the CURB-65, ISARIC-4C and COVID-GRAM scores in terms of severity for COVID-19 patients. Int. J. Clin. Pract. 2021, 75, e14759. [Google Scholar] [CrossRef] [PubMed]
  53. Albahri, A.S.; Hamid, R.A.; Alwan, J.K.; Al-Qays, Z.T.; Zaidan, A.A.; Zaidan, B.B.; Albahri, A.O.S.; AlAmoodi, A.H.; Khlaf, J.M.; Almahdi, E.M.; et al. Role of biological Data Mining and Machine Learning Techniques in Detecting and Diagnosing the Novel Coronavirus (COVID-19): A Systematic Review. J. Med. Syst. 2020, 44, 122. [Google Scholar] [CrossRef] [PubMed]
  54. Gupta, R.K.; Harrison, E.M.; Ho, A.; Docherty, A.B.; Knight, S.R.; van Smeden, M.; Abubakar, I.; Lipman, M.; Quartagno, M.; Pius, R.; et al. Development and validation of the ISARIC 4C Deterioration model for adults hospitalised with COVID-19: A prospective cohort study. Lancet Respir. Med. 2021, 9, 349–359. [Google Scholar] [CrossRef] [PubMed]
  55. Alwazzeh, M.J.; Subbarayalu, A.V.; Abu Ali, B.M.; Alabdulqader, R.; Alhajri, M.; Alwarthan, S.M.; AlShehail, B.M.; Raman, V.; Almuhanna, F.A. Performance of CURB-65 and ISARIC 4C mortality scores for hospitalized patients with confirmed COVID-19 infection in Saudi Arabia. Inform. Med. Unlocked 2023, 39, 101269. [Google Scholar] [CrossRef] [PubMed]
  56. Leening, M.J.; Vedder, M.M.; Witteman, J.C.; Pencina, M.J.; Steyerberg, E.W. Net reclassification improvement: Computation, interpretation, and controversies: A literature review and clinician’s guide. Ann. Intern. Med. 2014, 160, 122–131. [Google Scholar] [CrossRef]
  57. Kerr, K.F.; Wang, Z.; Janes, H.; McClelland, R.L.; Psaty, B.M.; Pepe, M.S. Net reclassification indices for evaluating risk prediction instruments: A critical review. Epidemiology 2014, 25, 114–121. [Google Scholar] [CrossRef]
  58. Grunkemeier, G.L.; Jin, R. Net reclassification index: Measuring the incremental value of adding a new risk factor to an existing risk model. Ann. Thorac. Surg. 2015, 99, 388–392. [Google Scholar] [CrossRef]
Figure 1. S/F ratio vs. p/F ratio scatter plot in the first cohort. The line represents the best fit linear relationship. Abbreviations: P/F, PaO2/FiO2 ratio; S/F, SaO2/FiO2 ratio. (p < 0.001 by Pearson correlation coefficient).
Jcm 13 05884 g001
Figure 2. Survival curve according to the PaO2/FiO2 ratio (p < 0.001 by Log-rank test) (a) and the SpO2/FiO2 ratio (p < 0.001 by Log-rank test) (b) in the first cohort, respectively. Abbreviations: P/F, PaO2/FiO2 ratio; S/F, SaO2/FiO2 ratio.
Jcm 13 05884 g002
Figure 3. ROC curve of the risk scores in predicting mortality. Comparison between the PSI vs. other risk scores and the PSI vs. the combination of P/F or S/F with the other risk scores. Comparison between the PSI vs. NEWS2 (a), the PSI vs. CRB 65 (b), the PSI vs. ISARIC 4C (c), the PSI vs. CZ COVID-19 (d), the PSI vs. ABC2 SPH (e), the PSI vs. COVID-19 Severity Index (f), the PSI vs. COEWS (g), the PSI vs. SOARS (h). Abbreviations: ABC2 SPH, ABC2-SPH risk score; COEWS, COVID-19 Early Warning Score; COVID-19 s.i., COVID-19 Severity Index; CRB 65, CRB-65 score abbreviated for confusion, respiratory rate, BP, and age > 65 years; CZ COVID-19, Cascio–Zinna COVID-19 mortality Score; ISARIC 4C, International Severe Acute Respiratory Infection Consortium Coronavirus Clinical Characterisation Consortium; NEWS2, National Early Warning Score 2; PSI, Pneumonia Severity Index; SOARS, SOARS score abbreviated for SpO2, obesity, age, respiratory rate, and stroke history.
Jcm 13 05884 g003aJcm 13 05884 g003b
Table 1. Multivariable model for predicting mortality in the two patient cohorts.
VariablesFirst Cohort (n: 230) Second Cohort (n: 1357)
mOR (95% CI)p-ValuemOR (95% CI)p-Value
Age (years)1.13 (1.127–1.186)<0.0011.117 (1.093–1.142)<0.001
Hb (g/dL)0.586 (0.462–0.743)<0.0011.173 (0.951–1.447)0.128
WBC (cell/μL)3.541 (1.305–9.607)0.0131.117 (0.682–1.830)0.659
PLT (×103/µL)0.111 (0.036–0.345)<0.0011.581 (0.991–2.521)0.054
P/F 0.994 (0.989–0.999)0.0220.990 (0.897–0.993)<0.001
Abbreviations: P/F, PaO2/FiO2 ratio; 95% CI, 95% confidence interval; Hb, hemoglobin; mOR, multivariable odds ratio; n, number of patients; PLT, platelets; WBC, white blood cells.
Table 2. Diagnostic test performance of the risk scores in predicting the mortality of the 230 patients in the first cohort.
Value % NEWS2 ≥ 3NEWS2 + P/F n *NEWS2 + S/F *CRB-65 ≥ 2CRB-65 + P/F *CRB-65 + S/F *PSI ≥ IV
Sensitivity33.287.580.072.585.090.070.0
Specificity90.062.565.880.075.868.983.2
NLR2.00.60.50.30.30.50.2
PLR9.07.04.02.65.69.02.3
NPV36.433.033.043.342.537.946.7
PPV22.196.094.093.396.097.092.9
95% CI0.550–0.6790.679–0.7960.666–0.7840.702–0.8160.827–0.9160.810–0.9030.706–0.819
p-value0.001<0.001<0.001<0.001<0.001<0.001<0.001
AUC0.6160.7410.7280.7630.8770.8620.766
p-value **Reference<0.001<0.001Reference<0.0010.001
p-value ***0.0030.6310.4830.891<0.0010.005Reference
Abbreviations: 95% CI, 95% confidence interval; AUC, area under the curve; CRB-65, CRB-65 score abbreviated for confusion, respiratory rate, BP, and age > 65 years; NEWS2, National Early Warning Score 2; NLR, negative likelihood ratio; NPV, negative predictive value; P/F, PaO2/FiO2 ratio; PLR, positive likelihood ratio; PPV, positive predictive value; PSI, Pneumonia Severity Index; S/F, SaO2/FiO2 ratio. * Considering the most appropriate cut-off value. ** Comparison of DeLong’s test p-value between reference scores and the PaO2/FiO2 or SpO2/FiO2 combined with same scores. *** Comparison of DeLong’s test p-value between PSI and other scores.
Table 3. Comparative analysis of the ROC curves and Net Reclassification Improvement of risk scores by adding the PaO2/FiO2 or SpO2/FiO2 ratios applied to the 230 patients in the first cohort.
ScoresYear of BirthNation of BirthSensitivity (%)Specificity (%)AUC95% CIp-Valuep-Value $p-Value $$p-ValueNRI
(p-Value)
CCI1987USA72.560.00.6850.621–0.745<0.001Reference0.001Reference
  CCI + P/F * 75.078.40.8070.750–0.856<0.0010.0010.3980.012 $$$0.210 (1.613)
  CCI + S/F * 72.579.50.7860.727–0.837<0.0010.0070.2160.009 $$$$0.194 (1.181)
PSI1998USA70.083.20.8450.792–0.890<0.001ReferenceReferenceReference
  PSI + P/F * 90.078.40.8870.838–0.924<0.0010.052Reference $$$0.153 (0.035)
  PSI + S/F * 87.575.80.8750.825–0.915<0.0010.162Reference $$$$0.101 (0.142)
CRB-652002UK72.580.00.8230.767–0.870<0.001Reference0.294Reference
  CRB-65 + P/F * 85.075.80.8770.827–0.916<0.0010.0230.2530.548 $$$0.083 (0.152)
  CRB-65 + S/F * 90.068.90.8620.810–0.903<0.0010.0190.5720.057 $$$$0.039 (0.548)
NEWS22017UK90.033.20.5890.523–0.6530.061Reference<0.001Reference
  NEWS2 + P/F * 87.562.60.7410.679–0.796<0.001<0.0010.020<0.001 $$$0.195 (<0.001)
  NEWS2 + S/F * 80.065.80.7280.666–0.784<0.001<0.0010.0120.012 $$$$0.226 (<0.001)
ISARIC 4C2020UK92.544.70.6870.623–0.746<0.001Reference<0.001Reference
  ISARIC 4C + P/F * 77.580.00.7980.740–0.848<0.0010.0030.2200.001 $$$0.203 (0.006)
  ISARIC 4C + S/F * 70.081.60.7890.730–0.839<0.0010.0050.1560.254 $$$$0.143 (0.043)
HOME-CoV2020FR90.040.50.6660.601–0.727<0.001Reference<0.001Reference
  HOME-CoV + P/F * 75.075.30.7770.717–0.829<0.0010.0020.097<0.001 $$$0.223 (0.002)
  HOME-CoV + S/F * 85.060.00.7870.729–0.838<0.0010.0060.0780.028 $$$$0.405 (2.887)
ABC2-SPH2021ES87.557.90.7800.721–0.832<0.001Reference0.1160.018 $$$$Reference
ABC2-SPH + P/F * 85.072.60.8330.778–0.879<0.0010.0400.7450.041 $$$0.109 (0.043)
CAPS-D2021GER57.583.20.7480.687–0.803<0.001Reference0.048Reference
  CAPS-D + P/F * 85.069.50.8130.756–0.861<0.0010.0580.4400.016 $$$0.364 (0.007)
  CAPS-D + S/F * 82.572.60.8100.753–0.858<0.0010.0850.3960.039 $$$$0.428 (0.001)
SOARS 2021UK62.578.90.7590.699–0.813<0.001Reference0.045Reference
  SOARS + P/F * 72.578.40.8200.765–0.868<0.0010.0030.5270.029 $$$0.138 (0.040)
  SOARS + S/F * 67.580.50.8150.759–0.863<0.0010.0050.4540.036 $$$$0.214 (0.007)
COVID-19 sever index 2021ARG52.573.20.6510.586–0.7130.002Reference<0.001Reference
  COVID-19 Severity Index + P/F * 80.066.80.7950.737–0.845<0.0010.0020.2290.001 $$$0.212 (0.013)
  COVID-19 Severity Index + S/F * 92.577.90.9090.864–0.943<0.0010.0050.1680.002 $$$$0.193 (0.039)
ASCL2022ITA82.543.70.6690.604–0.729<0.001Reference0.002Reference
  ASCL + P/F * 85.063.20.7830.725–0.835<0.0010.0050.1580.001 $$$0.093 (0.003)
  ASCL + S/F * 75.070.00.7820.723–0.834<0.0010.0100.1510.004 $$$$0.275 (<0.001)
COEWS2023m72.556.30.6580.593–0.7190.001Reference0.001Reference
  COEWS + P/F * 95.055.80.7830.724–0.834<0.0010.0050.1480.001 $$$0.311 (0.016)
  COEWS + S/F * 85.060.00.7870.729–0.838<0.0010.0090.1290.003 $$$$0.307 (0.012)
NEWS2 Plus2024TH85.042.10.6400.575–0.7020.001Reference<0.001Reference
  NEWS2 Plus + P/F * 85.066.80.7660.705–0.819<0.0010.0010.0630.001 $$$0.395 (3.289)
  NEWS2 Plus + S/F * 80.067.40.7520.691–0.806<0.0010.0020.0350.001 $$$$0.300 (<0.001)
CZ COVID-192024ITA10056.30.8740.824–0.914<0.001Reference0.427Reference
  CZ COVID-19 + P/F * 10057.40.8800.831–0.919<0.0010.0110.3330.842 $$$0.011 (0.157)
  CZ COVID-19 + S/F * 92.577.90.9090.864–0.943<0.0010.0360.0680.249 $$$$0.160 (<0.001)
Abbreviations: 95%CI, 95% confidence interval; ABC2-SPH, ABC2-SPH risk score; ASCL, ASCL score abbreviated for age, sex, CRP at hospital admission, and LDH at hospital admission; AUC, area under the curve; CAPS-D, CAPS-D score; CCI, Charlson Comorbidity Index; COEWS, COVID-19 Early Warning Score; COVID-19 Severity Index, COVID-19 Severity Index; CRB-65, CRB-65 score abbreviated for confusion, respiratory rate, BP, and age > 65 years; CZ COVID-19, Cascio–Zinna COVID-19 mortality Score; USA, United States of America; UK, United Kingdom; FR, France; ES, Spain; GER, Germany; ARG, Argentina; m, multicontinental retrospective study; TH, Thailand; ITA, Italy; HOME-CoV score, hospitalization or outpatient management of patients with SARS-CoV-2 infection; ISARIC 4C, International Severe Acute Respiratory Infection Consortium Coronavirus Clinical Characterisation Consortium; NEWS2 Plus, National Early Warning Score 2 Plus; NEWS2, National Early Warning Score 2; NRI, Net Reclassification Improvement; P/F, PaO2/FiO2 ratio; PSI, Pneumonia Severity Index; S/F, SaO2/FiO2 ratio; SOARS, SOARS score abbreviated for SpO2, obesity, age, respiratory rate, AND stroke history. $ Comparison of DeLong’s test p-value between the reference scores and PaO2/FiO2 or SpO2/FiO2 combined with other scores. $$ Comparison of DeLong’s test p-value between “PSI score” and other scores. $$$ Comparison of DeLong’s test p-value between “PSI score + ratio P/F” and “other scores + ratio P/F”. $$$$ Comparison of DeLong’s test p-value between “PSI score + ratio S/F” and “other scores + ratio S/F”. * The prognostic scores were combined with PaO2/FiO2 or SpO2/FiO2 ratios.
Disclaimer/Publisher’s Note: The statements, opinions and data contained in all publications are solely those of the individual author(s) and contributor(s) and not of MDPI and/or the editor(s). MDPI and/or the editor(s) disclaim responsibility for any injury to people or property resulting from any ideas, methods, instructions or products referred to in the content.

