
Is an Electronic Nose Able to Predict Clinical Response following Neoadjuvant Treatment of Rectal Cancer? A Prospective Pilot Study

 , , , , ,
Abstract
:1. Introduction
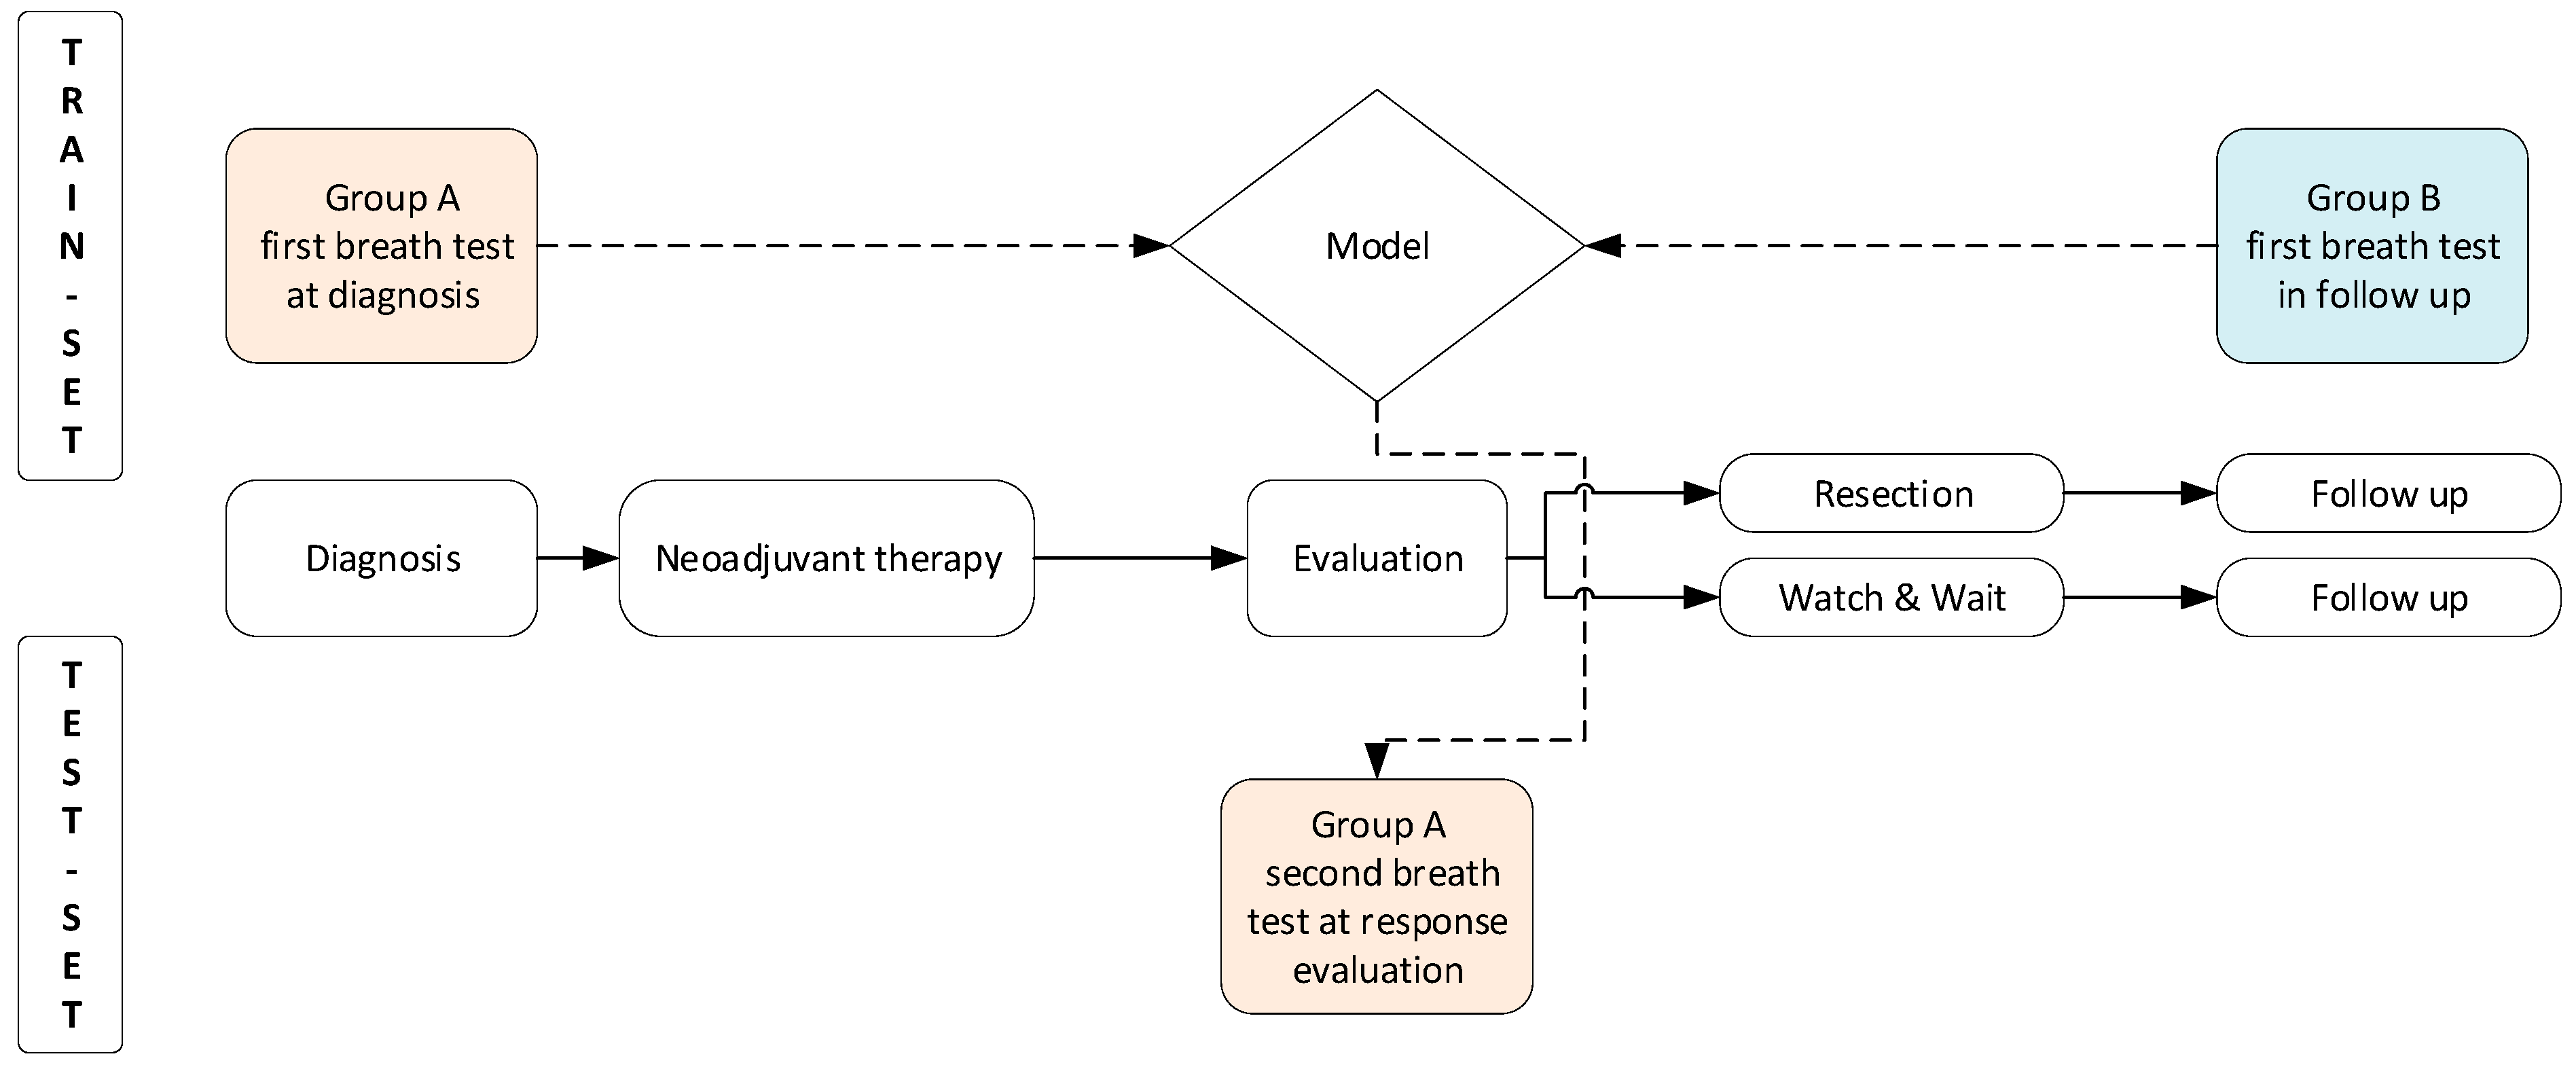
2. Material and Methods
2.1. Study Design and Patient Selection
2.2. Study Procedures
2.3. Aeonose™ Technology and Model Development
2.4. Statistical Analysis
2.5. Ethics
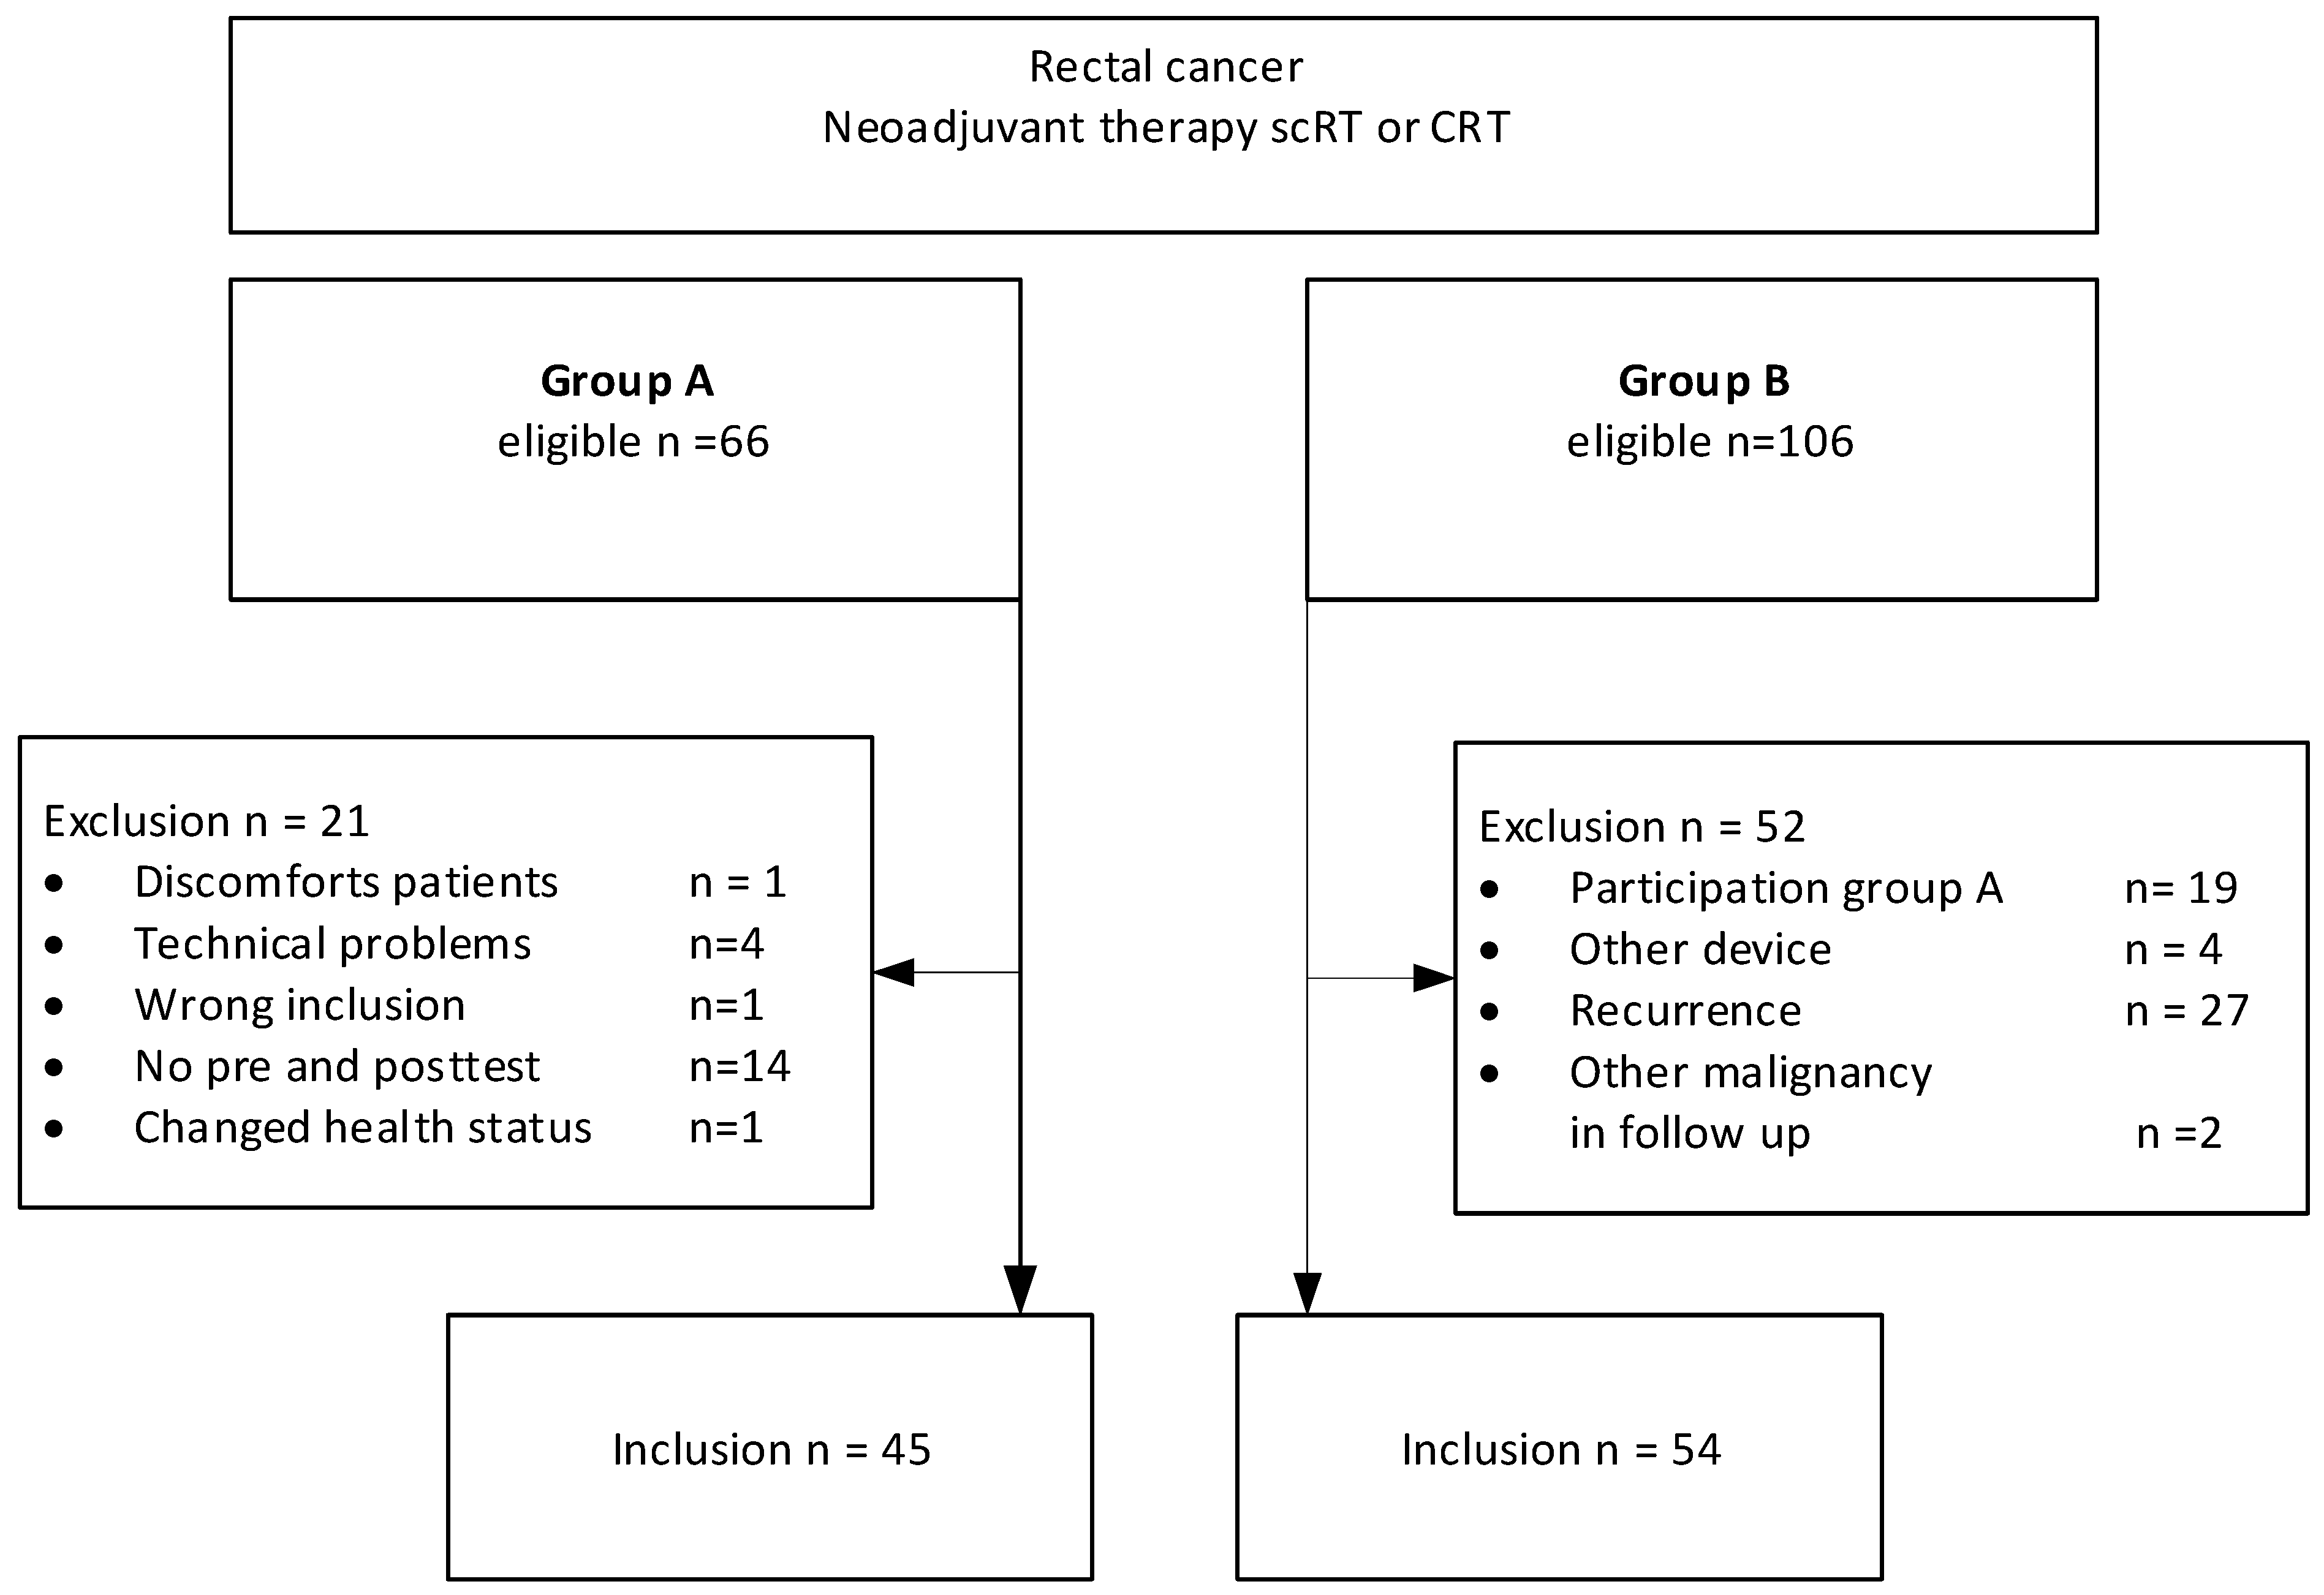
3. Results
3.1. Study Population
3.2. Patient Characteristics
3.3. Model Performance of the Training Set
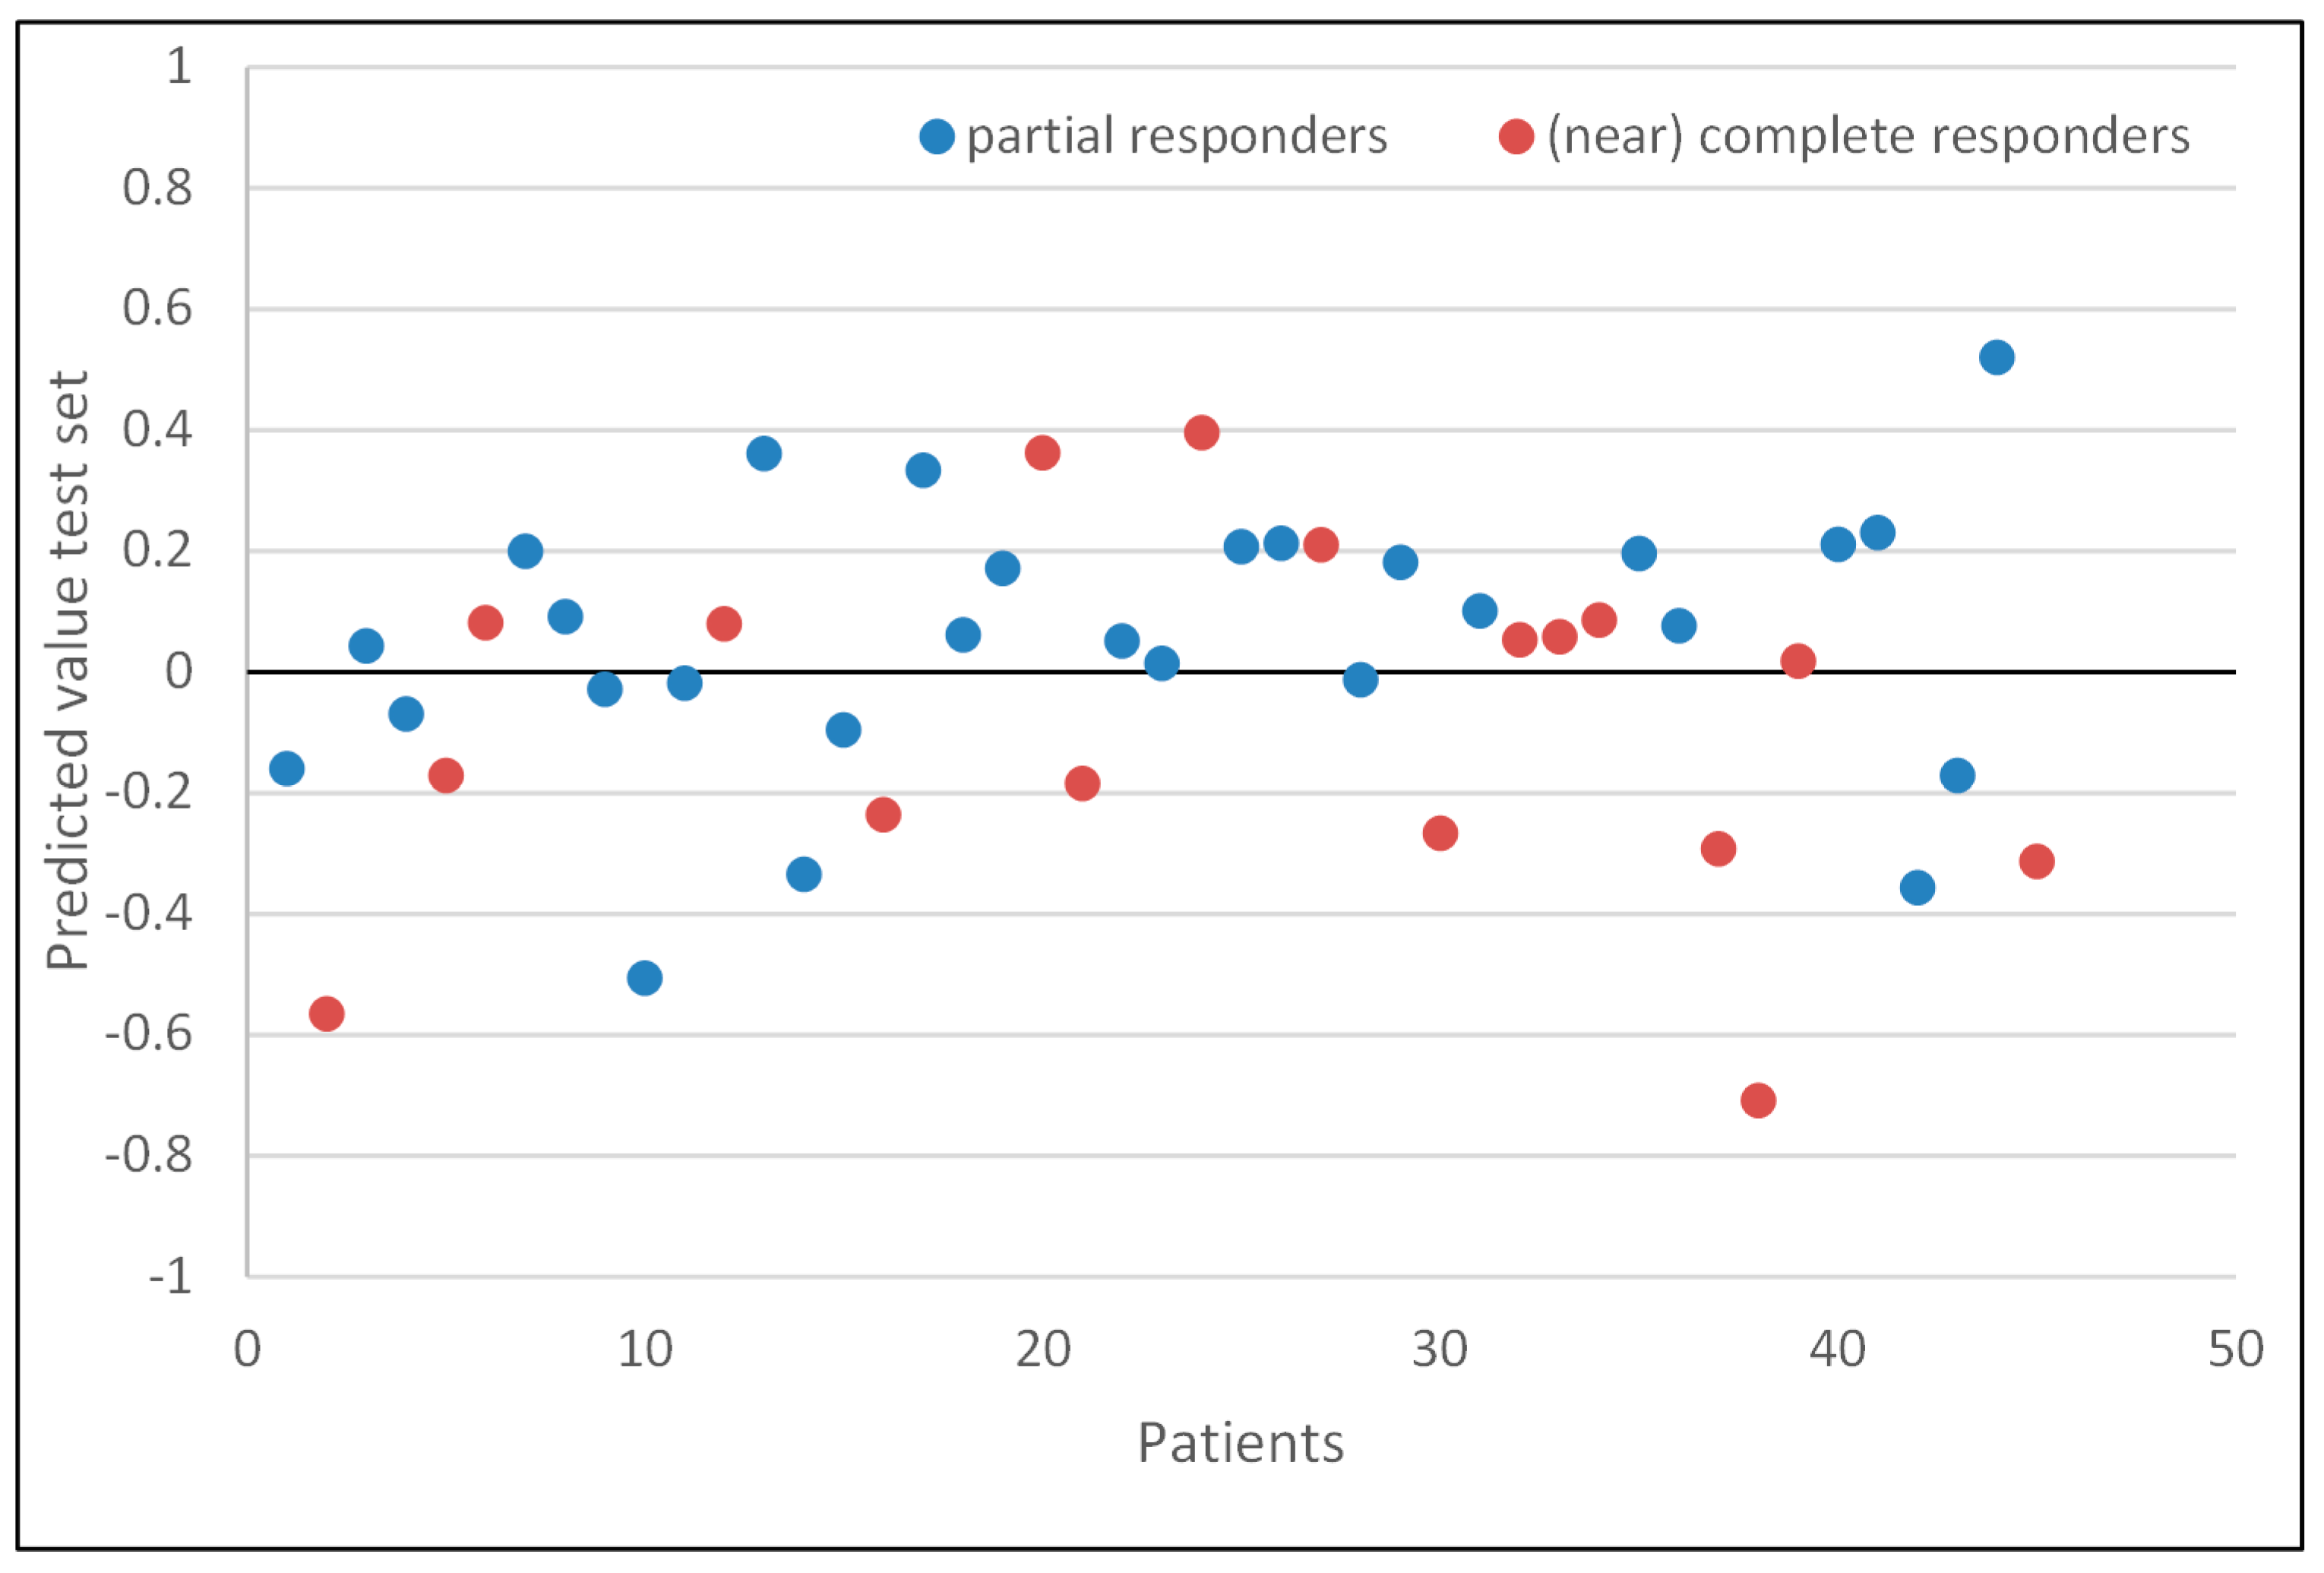
3.4. Response Evaluation
3.5. Model Performance of the Test Set
4. Discussion
5. Conclusions
Author Contributions
Funding
Institutional Review Board Statement
Informed Consent Statement
Data Availability Statement
Acknowledgments
Conflicts of Interest
Abbreviations
| scRT | Short-course radiotherapy |
| CRT | Chemoradiotherapy |
| W&W | Watch-and-Wait |
| VOC | Volatile organic compounds |
| CRC | Colorectal cancer |
| eNose | Electronic nose |
References
- Sung, H.; Ferlay, J.; Siegel, R.L.; Laversanne, M.; Soerjomataram, I.; Jemal, A.; Bray, F. Global Cancer Statistics 2020: GLOBOCAN Estimates of Incidence and Mortality Worldwide for 36 Cancers in 185 Countries. CA Cancer J. Clin. 2021, 71, 209–249. [Google Scholar] [CrossRef] [PubMed]
- Hupkens, B.J.; Maas, M.; Martens, M.H.; van der Sande Marit, E.; Lambregts, D.M.; Breukink, S.O.; Melenhorst, J.; Houwers, J.B.; Hoff, C.; Sosef, M.N.; et al. Organ preservation in rectal cancer after chemoradiation: Should we extend the observation period in patients with a clinical near-complete response? Ann. Surg. Oncol. 2018, 25, 197–203. [Google Scholar] [CrossRef] [PubMed]
- Custers, P.A.; Beets, G.L.; Bach, S.P.; Blomqvist, L.K.; Figueiredo, N.; Gollub, M.J.; Martling, A.; Melenhorst, J.; Ortega, C.D.; Perez, R.O.; et al. An International Expert-Based Consensus on the Definition of a Clinical Near-Complete Response After Neoadjuvant (Chemo) radiotherapy for Rectal Cancer. Dis. Colon Rectum 2024, 67, 782–795. [Google Scholar] [CrossRef]
- Maas, M.; Lambregts, D.M.; Nelemans, P.J.; Heijnen, L.A.; Martens, M.H.; Leijtens, J.W.; Sosef, M.; Hulsewé, K.W.; Hoff, C.; Breukink, S.O.; et al. Assessment of clinical complete response after chemoradiation for rectal cancer with digital rectal examination, endoscopy, and MRI: Selection for organ-saving treatment. Ann. Surg. Oncol. 2015, 22, 3873–3880. [Google Scholar] [CrossRef] [PubMed]
- van der Sande, M.E.; Beets, G.L.; Hupkens, B.J.; Breukink, S.O.; Melenhorst, J.; Bakers, F.C.; Lambregts, D.M.; Grabsch, H.I.; Beets-Tan, R.G.; Maas, M. Response assessment after (chemo) radiotherapy for rectal cancer: Why are we missing complete responses with MRI and endoscopy? Eur. J. Surg. Oncol. 2019, 45, 1011–1017. [Google Scholar] [CrossRef] [PubMed]
- Altomare, D.F.; Di Lena, M.; Porcelli, F.; Travaglio, E.; Longobardi, F.; Tutino, M.; Depalma, N.; Tedesco, G.; Sardaro, A.; Memeo, R.; et al. Effects of curative colorectal cancer surgery on exhaled volatile organic compounds and potential implications in clinical follow-up. Ann. Surg. 2015, 262, 862–867. [Google Scholar] [CrossRef] [PubMed]
- van Keulen, K.E.; Jansen, M.E.; Schrauwen, R.W.; Kolkman, J.J.; Siersema, P.D. Volatile organic compounds in breath can serve as a non-invasive diagnostic biomarker for the detection of advanced adenomas and colorectal cancer. Aliment. Pharmacol. Ther. 2020, 51, 334–346. [Google Scholar] [CrossRef] [PubMed]
- Van De Goor, R.M.G.E.; Leunis, N.; Van Hooren, M.R.A.; Francisca, E.; Masclee, A.; Kremer, B.; Kross, K.W. Feasibility of electronic nose technology for discriminating between head and neck, bladder, and colon carcinomas. Eur. Arch. Oto-Rhino-Laryngol. 2017, 274, 1053–1060. [Google Scholar] [CrossRef] [PubMed]
- Haick, H.; Broza, Y.Y.; Mochalski, P.; Ruzsanyi, V.; Amann, A. Assessment, origin, and implementation of breath volatile cancer markers. Chem. Soc. Rev. 2014, 43, 1423–1449. [Google Scholar] [CrossRef] [PubMed]
- Wang, Q.; Fang, Y.; Tan, S.; Li, Z.; Zheng, R.; Ren, Y.; Jiang, Y.; Huang, X. Diagnostic performance of volatile organic compounds analysis and electronic noses for detecting colorectal cancer: A systematic review and meta-analysis. Front. Oncol. 2024, 14, 1397259. [Google Scholar] [CrossRef] [PubMed]
- de Boer, N.K.; de Meij, T.G.; Oort, F.A.; Larbi, I.B.; Mulder, C.J.; van Bodegraven, A.A.; van der Schee, M.P. The scent of colorectal cancer: Detection by volatile organic compound analysis. Clin. Gastroenterol. Hepatol. 2014, 12, 1085–1089. [Google Scholar] [CrossRef] [PubMed]
- Shreiner, A.B.; Kao, J.Y.; Young, V.B. The gut microbiome in health and in disease. Curr. Opin. Gastroenterol. 2015, 31, 69. [Google Scholar] [CrossRef] [PubMed]
- Bosch, S.; Lemmen, J.P.; Menezes, R.; van der Hulst, R.; Kuijvenhoven, J.; Stokkers, P.C.; de Meij, T.G.; de Boer, N.K. The influence of lifestyle factors on fecal volatile organic compound composition as measured by an electronic nose. J. Breath Res. 2019, 13, 046001. [Google Scholar] [CrossRef] [PubMed]
- Phillips, M.; Byrnes, R.; Cataneo, R.N.; Chaturvedi, A.; Kaplan, P.D.; Libardoni, M.; Mehta, V.; Mundada, M.; Patel, U.; Ramakrishna, N.; et al. Detection of volatile biomarkers of therapeutic radiation in breath. J. Breath Res. 2013, 7, 036002. [Google Scholar] [CrossRef] [PubMed]
- Steenhuis, E.G.M.; Schoenaker, I.J.H.; de Groot, J.W.B.; Fiebrich, H.B.; de Graaf, J.C.; Brohet, R.M.; van Dijk, J.D.; van Westreenen, H.L.; Siersema, P.D. Feasibility of volatile organic compound in breath analysis in the follow-up of colorectal cancer: A pilot study. Eur. J. Surg. Oncol. 2020, 46, 2068–2073. [Google Scholar] [CrossRef] [PubMed]
- Hanevelt, J.; Schoenaker, I.J.; Brohet, R.M.; Schrauwen, R.W.; Baas, F.J.; Tanis, P.J.; van Westreenen, H.L.; de Vos tot Nederveen Cappel, W.H. Alteration of the Exhaled Volatile Organic Compound Pattern in Colorectal Cancer Patients after Intentional Curative Surgery—A Prospective Pilot Study. Cancers 2023, 15, 4785. [Google Scholar] [CrossRef] [PubMed]
- Kort, S.; Brusse-Keizer, M.; Gerritsen, J.; van der Palen, J. Data analysis of electronic nose technology in lung cancer: Generating prediction models by means of Aethena. J. Breath Res. 2017, 11, 026006. [Google Scholar] [CrossRef] [PubMed]
- Kort, S.; Brusse-Keizer, M.; Gerritsen, J.W.; Schouwink, H.; Citgez, E.; de Jongh, F. Improving lung cancer diagnosis by combining exhaled-breath data and clinical parameters. ERJ Open Res. 2020, 6, 00221–2019. [Google Scholar] [CrossRef] [PubMed]
- Kort, S.; Brusse-Keizer, M.; Schouwink, H.; Citgez, E.; de Jongh, F.H.; van Putten, J.W.; van den Borne, B.; Kastelijn, E.A.; Stolz, D. Diagnosing non-small cell lung cancer by exhaled breath profiling using an electronic nose: A multicenter validation study. Chest 2023, 163, 697–706. [Google Scholar] [CrossRef] [PubMed]
- Haalboom, M.; Kort, S.; van der Palen, J. Using a stepwise approach to simultaneously develop and validate machine learning based prediction models. J. Clin. Epidemiol. 2022, 142, 305–310. [Google Scholar] [CrossRef] [PubMed]

| Total | Group A | Group B | p-Value | |
|---|---|---|---|---|
| n = 99 | n = 45 | n = 54 | ||
| Age, mean ± SD | 65 ± 9.7 | 66 ± 9.0 | 65 ± 10.6 | 0.470 |
| Gender, n (%) | 0.199 | |||
| Male | 51 (52) | 20 (44) | 31 (57) | |
| Female | 48 (49) | 25 (56) | 23 (43) | |
| BMI kg/m2, n (%) | 0.288 | |||
| <25 | 31 (31) | 14 (31) | 17 (32) | |
| 25–29.9 | 46 (47) | 24 (53) | 22 (41) | |
| ≥30 | 22 (22) | 7 (16) | 15 (28) | |
| Current smoker, n (%) | 10 (10) | 6 (13) | 4 (7) | 0.505 |
| ASA, n (%) | 0.530 | |||
| I | 29 (29) | 11 (24) | 18 (33) | |
| II | 67 (68) | 32 (71) | 35 (65) | |
| III | 3 (3) | 2 (4) | 1 (2) | |
| MMR-status, n (%) | 0.900 | |||
| MMR-Proficient | 75 (76) | 35 (78) | 40 (74) | |
| MMR-Deficient | 1 (1) | 0 | 1 (2) | |
| Unknown | 23 (23) | 10 (22) | 13 (24) | |
| Risk stage, n (%) | 0.023 | |||
| Low risk | 7 (7) | 6 (13) | 1 (2) | |
| Intermediate risk | 27 (27) | 15 (33) | 12 (22) | |
| High risk | 65 (66) | 24 (53) | 41 (76) | |
| Neo-adjuvant treatment, n (%) | 0.010 | |||
| scRT | 29 (29) | 19 (42) | 10 (19) | |
| CRT | 70 (71) | 26 (58) | 44 (82) | |
| Response evaluation, n (%) | 0.764 | |||
| Partial | 60 (61) | 28 (62) | 32 (59) | |
| (Near) complete | 39 (39) | 17 (38) | 22 (41) | |
| Location, n (%) | 0.055 | |||
| Zwolle | 69 (70) | 27 (60) | 42 (78) | |
| Maastricht | 30 (30) | 18 (40) | 12 (22) | |
| Comorbidity, n (%) | ||||
| Hypertension | 25 (25.3) | 11 (24.4) | 14 (25.9) | 0.866 |
| Diabetes Mellitus | 16 (16.2) | 9 (20) | 7 (13) | 0.344 |
| Medication, n (%) | ||||
| PPI use | 13 (13) | 8 (18) | 5 (9) | 0.195 |
| Metformin use | 13 (13) | 7 (16) | 6 (11) | 0.486 |
| Use of supplements, n (%) | 31 (31.3) | 18 (40) | 13 (24) | 0.089 |
| Last meal < 3 h, n (%) | 42 (43.3) | 24 (54.5) | 18 (34) | 0.043 |
| Alcohol use, n (%) | 66 (68) | 26 (60.5) | 40 (74.1) | 0.153 |
| Alcohol < 24 h, n (%) | 33 (34.4) | 11 (25.6) | 22 (41.5) | 0.102 |
| Training Set n = 99 | Test Set n = 45 | |
|---|---|---|
| Sensitivity | 0.80 (CI 0.65–0.90) | 0.64 (CI 0.46–0.82) |
| Specificity | 0.65 (CI 0.51–0.77) | 0.47 (CI 0.23–0.70) |
| PPV | 0.65 (CI 0.51–0.77) | 0.67 (CI 0.49–0.84) |
| NPV | 0.80 (CI 0.64–0.90) | 0.44 (CI 0.21–0.67) |
| Accuracy | 0.72 (CI 0.63–0.80) | 0.58 (CI 0.43–0.72) |
| AUC | 0.86 (CI 0.79–0.93) | 0.63 (CI 0.45–0.81) |
| Total | Correctly Predicted | Incorrectly Predicted | p-Value | |
|---|---|---|---|---|
| n = 45 | n = 26 | n = 19 | ||
| Age, mean ± SD | 66 ± 9.0 | 65 ± 10.4 | 67 ± 6.9 | 0.370 |
| Gender, n (%) | 0.345 | |||
| Male | 20 (44) | 10 (39) | 10 (53) | |
| Female | 25 (56) | 16 (62) | 9 (47) | |
| BMI kg/m2, n (%) | 0.380 | |||
| <25 | 14 (31) | 10 (39) | 4 (21) | |
| 25–30 | 24 (53) | 12 (46) | 12 (63) | |
| ≥30 | 7 (16) | 4 (15) | 3 (16) | |
| Current smoker | 6 (13) | 5 (19) | 1 (5) | 0.222 |
| ASA, n (%) | 0.056 | |||
| I | 11 (24) | 4 (15) | 7 (37) | |
| II | 32 (71) | 20 (77) | 12 (63) | |
| III | 2 (4) | 2 (8) | 0 | |
| Risk Stage, n (%) | 0.557 | |||
| Low risk | 6 (13) | 3 (12) | 3 (16) | |
| Intermediate risk | 15 (33) | 11 (42) | 4 (21) | |
| High risk | 24 (53) | 12 (46) | 12 (63) | |
| Neo-adjuvant treatment, n (%) | 0.532 | |||
| scRT | 19 (42) | 12 (46) | 7 (37) | |
| CRT | 26 (58) | 14 (54) | 12 (63) | |
| Response evaluation, n (%) | 0.257 | |||
| Partial | 28 (62) | 18 (69) | 10 (53) | |
| (near) complete | 17 (38) | 8 (31) | 9 (47) | |
| Location, n (%) | 0.712 | |||
| Zwolle | 27 (60) | 15 (58) | 12 (63) | |
| Maastricht | 18 (40) | 11 (42) | 7 (37) | |
| Comorbidity, n (%) | ||||
| Hypertension | 11 (24) | 7 (27) | 4 (21) | 0.736 |
| Diabetes Mellitus | 9 (20) | 8 (31) | 1 (5) | 0.058 |
| Medication, n (%) | ||||
| PPI use | 8 (18) | 6 (24) | 2 (11) | 0.433 |
| Metformin use | 7 (16) | 6 (24) | 1 (5) | 0.119 |
| Last meal < 3 h, n (%) | 24 (55) | 14 (56) | 10 (53) | 0.824 |
| Use of supplements, n (%) | 18 (40) | 12 (46) | 6 (32) | 0.324 |
| Alcohol use, n (%) | 26 (61) | 13 (54) | 13 (68) | 0.342 |
| Alcohol < 24 h, n (%) | 11 (26) | 5 (21) | 6 (32) | 0.495 |
Disclaimer/Publisher’s Note: The statements, opinions and data contained in all publications are solely those of the individual author(s) and contributor(s) and not of MDPI and/or the editor(s). MDPI and/or the editor(s) disclaim responsibility for any injury to people or property resulting from any ideas, methods, instructions or products referred to in the content. |
© 2024 by the authors. Licensee MDPI, Basel, Switzerland. This article is an open access article distributed under the terms and conditions of the Creative Commons Attribution (CC BY) license (https://creativecommons.org/licenses/by/4.0/).
Share and Cite
Schoenaker, I.J.H.; Pennings, A.; van Westreenen, H.L.; Finnema, E.J.; Brohet, R.M.; Hanevelt, J.; de Vos Tot Nederveen Cappel, W.H.; Melenhorst, J. Is an Electronic Nose Able to Predict Clinical Response following Neoadjuvant Treatment of Rectal Cancer? A Prospective Pilot Study. J. Clin. Med. 2024, 13, 5889. https://doi.org/10.3390/jcm13195889
Schoenaker IJH, Pennings A, van Westreenen HL, Finnema EJ, Brohet RM, Hanevelt J, de Vos Tot Nederveen Cappel WH, Melenhorst J. Is an Electronic Nose Able to Predict Clinical Response following Neoadjuvant Treatment of Rectal Cancer? A Prospective Pilot Study. Journal of Clinical Medicine. 2024; 13(19):5889. https://doi.org/10.3390/jcm13195889
Chicago/Turabian StyleSchoenaker, Ivonne J. H., Alexander Pennings, Henderik L. van Westreenen, Evelyn J. Finnema, Richard M. Brohet, Julia Hanevelt, Wouter H. de Vos Tot Nederveen Cappel, and Jarno Melenhorst. 2024. "Is an Electronic Nose Able to Predict Clinical Response following Neoadjuvant Treatment of Rectal Cancer? A Prospective Pilot Study" Journal of Clinical Medicine 13, no. 19: 5889. https://doi.org/10.3390/jcm13195889