
Are Platelet-Related Parameters Prognostic Predictors of Renal and Cardiovascular Outcomes in IgA Nephropathy?

Abstract
1. Introduction
2. Materials and Methods
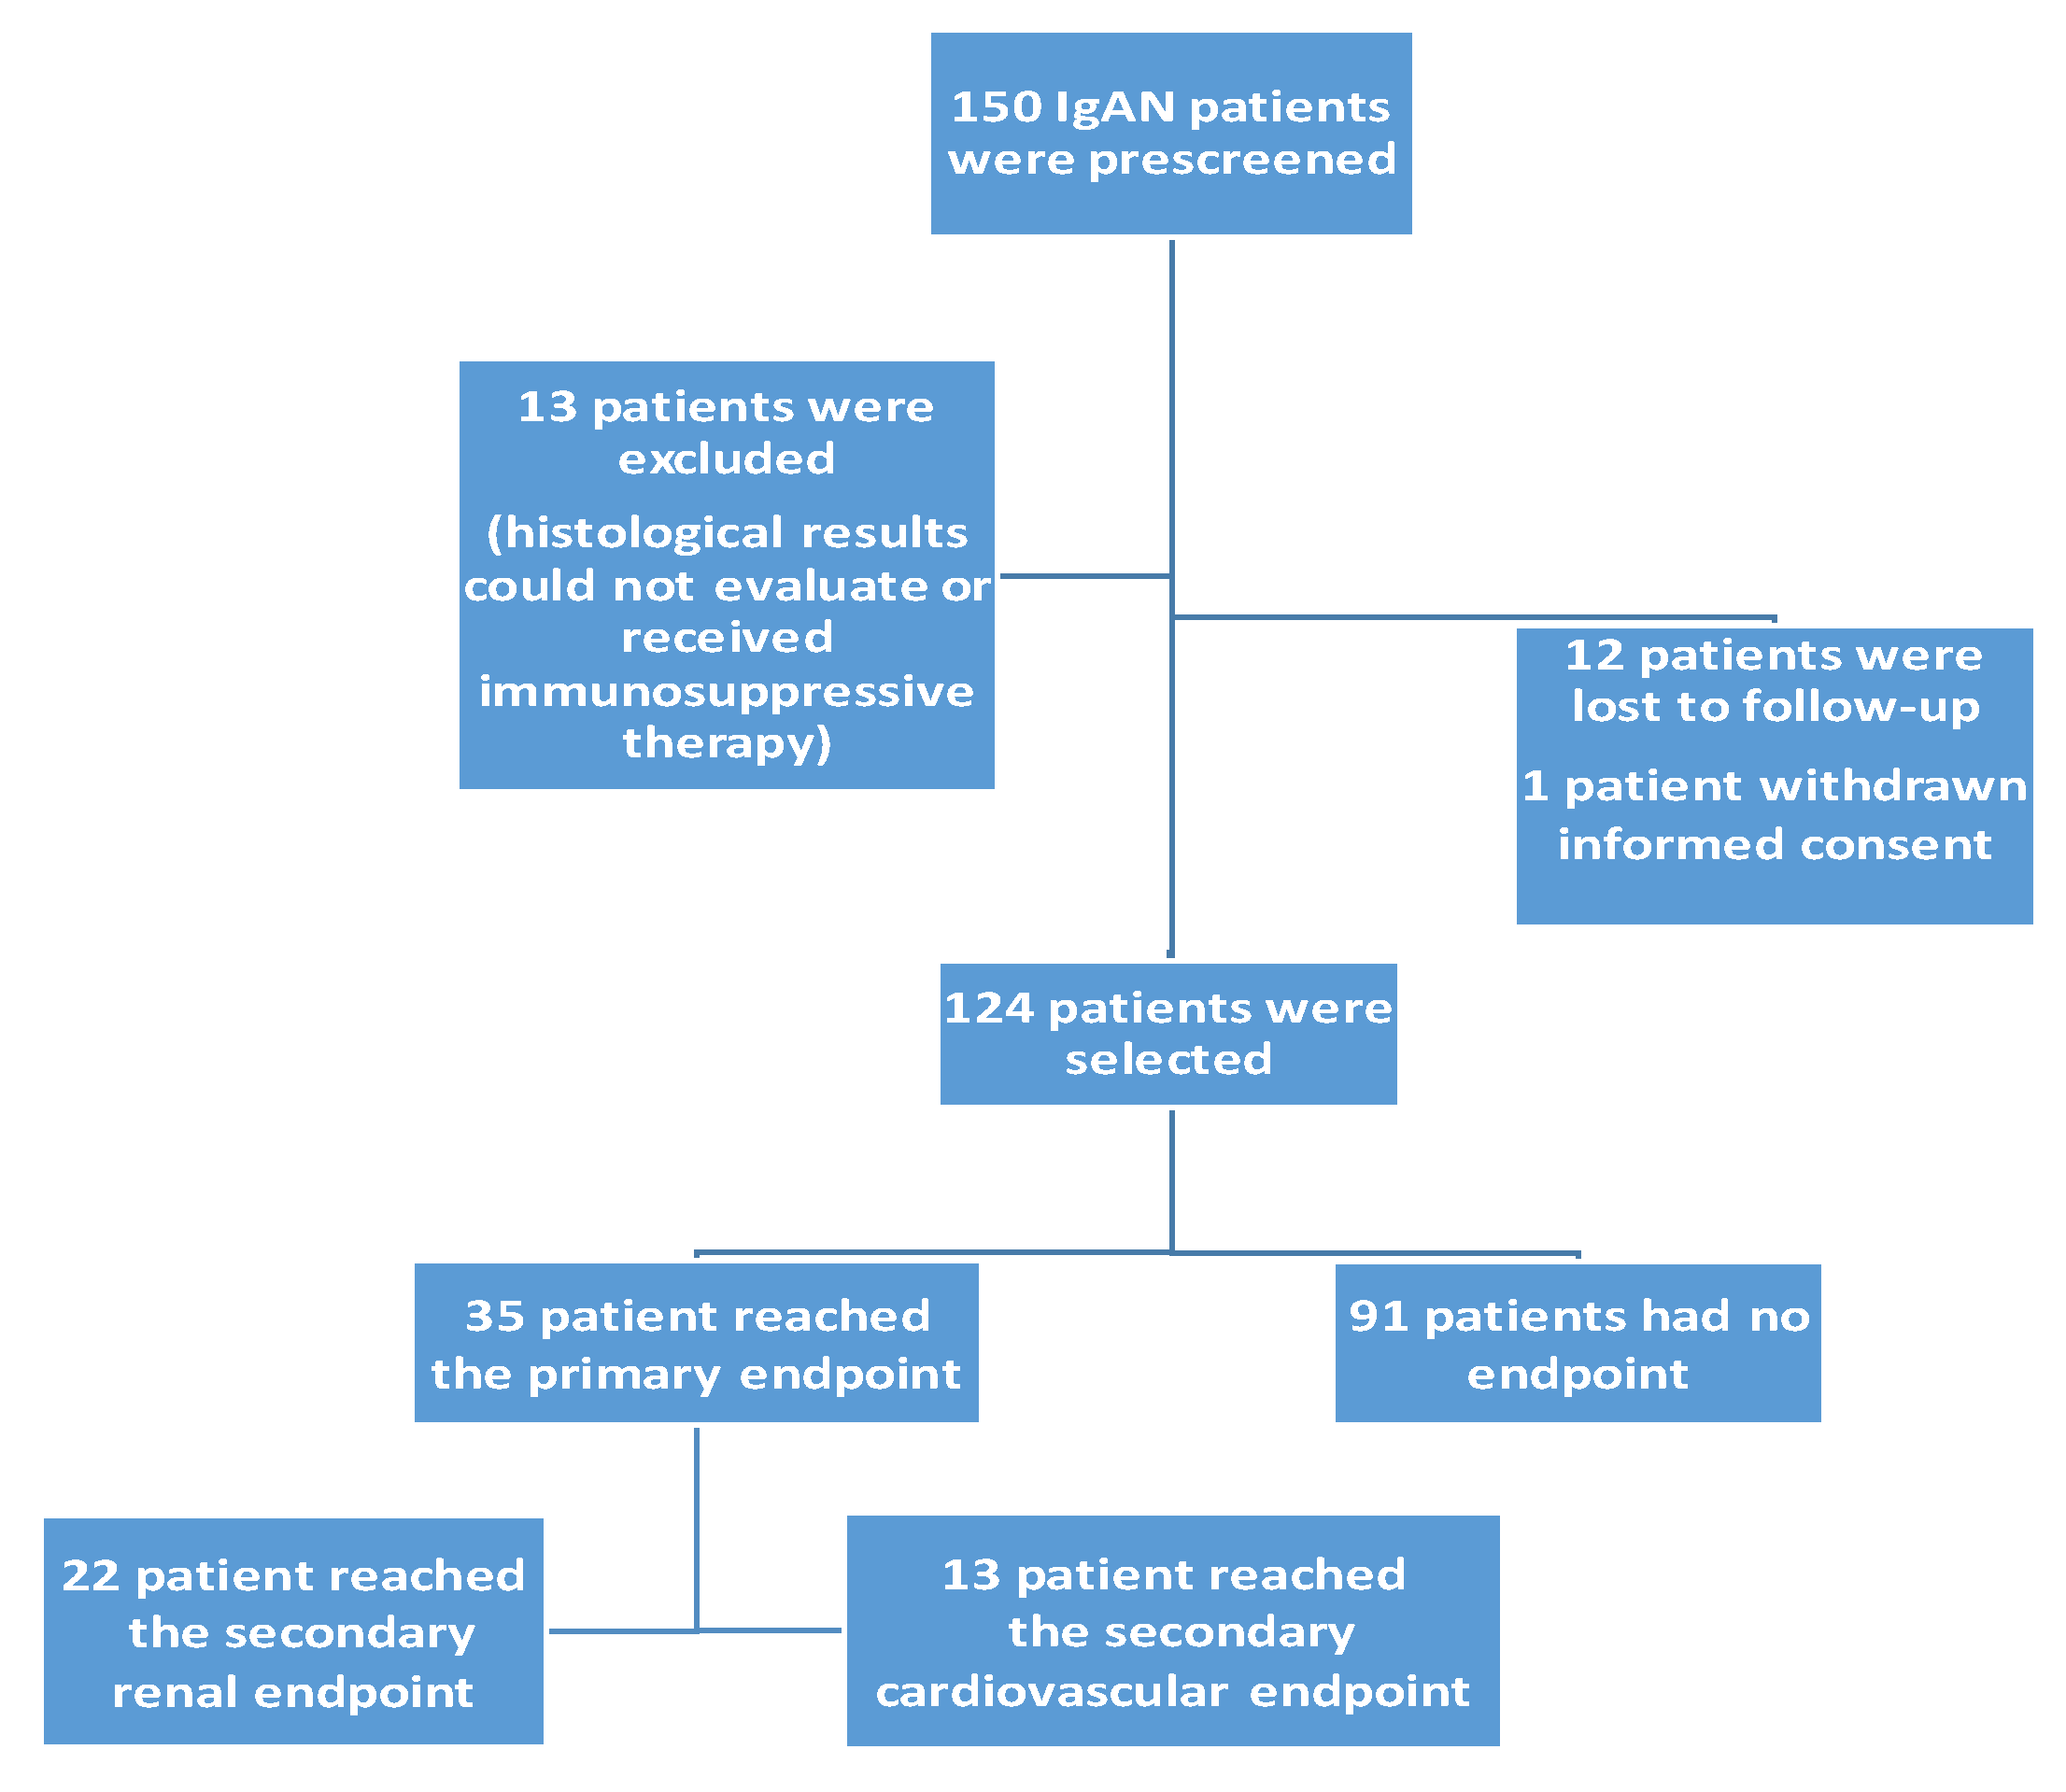
2.1. Selection of Patients
2.2. Clinical and Histological Data Collection
2.3. Renal and Cardiovascular Endpoints
2.4. The Definition of Platelet-Related Parameters
2.5. Statistical Analysis
3. Results
4. Discussion
Limitations of this Study
5. Conclusions
Author Contributions
Funding
Institutional Review Board Statement
Informed Consent Statement
Data Availability Statement
Acknowledgments
Conflicts of Interest
References
- Rodrigues, J.C.; Haas, M.; Reich, H.N. IgA Nephropathy. Clin. J. Am. Soc. Nephrol. 2017, 12, 677–686. [Google Scholar] [CrossRef] [PubMed]
- Mohd, R.; Kazmin, N.E.M.; Cader, R.A.; Shukor, N.A.; Wong, Y.P.; Shah, S.A.; Alfian, N. Long-term outcome of immunoglobulin A (IgA) nephropathy: A single-center experience. PLoS ONE 2021, 16, e0249592. [Google Scholar] [CrossRef] [PubMed]
- Kim, J.K.; Kim, J.H.; Lee, S.C.; Kang, E.W.; Chang, T.I.; Moon, S.J.; Yoon, S.Y.; Yoo, T.H.; Kang, S.W.; Choi, K.H.; et al. Clinical Features and Outcomes of IgA Nephropathy with Nephrotic Syndrome. Clin. J. Am. Soc. Nephrol. 2012, 7, 427–436. [Google Scholar] [CrossRef] [PubMed]
- Rauen, T.; Floege, J. Inflammation in IgA Nephropathy. Pediatr. Nephrol. 2017, 32, 2215–2224. [Google Scholar] [CrossRef] [PubMed]
- Schena, F.P.; Rossini, M.; Abbrescia, D.I.; Zaza, G. The Molecular Mechanisms of Inflammation and Scarring in the Kidneys of Immunoglobulin A Nephropathy: Gene Involvement in the Mechanisms of Inflammation and Scarring in Kidney Biopsy of IgAN Patients. Semin. Immunopathol. 2021, 43, 691–705. [Google Scholar] [CrossRef] [PubMed]
- Zinellu, A.; Mangoni, A.A. Neutrophil-to-lymphocyte and platelet-to-lymphocyte ratio and disease activity in rheumatoid arthritis: A systematic review and meta-analysis. Eur. J. Clin. Investig. 2023, 53, e13877. [Google Scholar] [CrossRef] [PubMed]
- Huang, Y.; Deng, W.; Pan, X.; Liu, M.; Zhong, Z.; Huang, Q.; Li, T. The relationship between platelet to albumin ratio and disease activity in axial spondyloarthritis patients. Mod. Rheumatol. 2022, 32, 974–979. [Google Scholar] [CrossRef]
- Kumarasamy, C.; Tiwary, V.; Sunil, K.; Suresh, D.; Shetty, S.; Muthukaliannan, G.K.; Baxi, S.; Jayaraj, R. Prognostic Utility of Platelet-Lymphocyte Ratio, Neutrophil-Lymphocyte Ratio and Monocyte-Lymphocyte Ratio in Head and Neck Cancers: A Detailed PRISMA Compliant Systematic Review and Meta-Analysis. Cancers 2021, 13, 4166. [Google Scholar] [CrossRef]
- Li, L.; Yu, J.; Zhou, Z. Platelet-Associated Parameters in Patients with Psoriasis: A PRISMA-Compliant Systematic Review and Meta-Analysis. Medicine 2021, 100, e28234. [Google Scholar] [CrossRef]
- Li, L.Q.; Bai, Z.H.; Zhang, L.H.; Zhang, Y.; Lu, X.C.; Zhang, Y.; Liu, Y.K.; Wen, J.; Li, J.Z. Meta-Analysis of Hematological Biomarkers as Reliable Indicators of Soft Tissue Sarcoma Prognosis. Front. Oncol. 2020, 10, 30. [Google Scholar] [CrossRef]
- Holinstat, M. Normal Platelet Function. Cancer Metastasis Rev. 2017, 36, 195–198. [Google Scholar] [CrossRef] [PubMed]
- Tan, J.; Song, G.; Wang, S.; Dong, L.; Liu, X.; Jiang, Z.; Qin, A.; Tang, Y.; Qin, W. Platelet-to-Albumin Ratio: A Novel IgA Nephropathy Prognosis Predictor. Front. Immun. 2022, 13, 842362. [Google Scholar] [CrossRef] [PubMed]
- Herter, J.M.; Rossaint, J.; Zarbock, A. J Platelets in inflammation an immunity. Thromb. Haemost. 2014, 12, 1764–1775. [Google Scholar] [CrossRef] [PubMed]
- Koupenova, M.; Clancy, L.; Corkrey, H.A.; Freedman, J.E. Circulating platelets as mediators of immunity, inflammation, and thrombosis. Circ. Res. 2018, 122, 337–351. [Google Scholar] [CrossRef] [PubMed]
- Marcoux, G.; Laroche, A.; Espinoza Romero, J.; Boilard, E. Role of platelets and megakaryocytes in adaptive immunity. Platelets 2021, 32, 340–351. [Google Scholar] [CrossRef] [PubMed]
- Garraud, O.; Hamzeh-Cognasse, H.; Cognasse, F. Platelets and cytokines: How and why? Transfus. Clin. Biol. 2012, 19, 104–108. [Google Scholar] [CrossRef] [PubMed]
- Koenen, R.R. The prowess of platelets in immunity and inflammation. Thromb. Haemost. 2016, 116, 605–612. [Google Scholar] [CrossRef]
- Thijs, A.; Nanayakkara, P.W.; Ter Wee, P.M.; Huijgens, P.C.; van Guldener, C.; Stehouwer, C.D. Mild-to-moderate renal impairment is associated with platelet activation: A cross-sectional study. Clin. Nephrol. 2008, 70, 325–331. [Google Scholar]
- Baaten, C.; Schröer, J.R.; Floege, J.; Marx, N.; Jankowski, J.; Berger, M.; Noels, H. Platelet Abnormalities in CKD and Their Implications for Antiplatelet Therapy. Clin. J. Am. Soc. Nephrol. 2021, 17, 155–170. [Google Scholar] [CrossRef]
- Cao, S.L.; Zhang, G.Q.; Li, J.; Bao, L.; Lan, X.M.; Jin, Q.P.; Luo, H.Y.; Jing, E.; Li, B.; Ma, D.; et al. Platelet-to-albumin ratio is a potential biomarker for predicting diabetic nephropathy in patients with type 2 diabetes. Biomark Med. 2023, 17, 841–848. [Google Scholar] [CrossRef]
- Toraman, A.; Neşe, N.; Özyurt, B.C.; Kürşat, S. Association between neutrophil-lymphocyte & platelet lymphocyte ratios with prognosis & mortality in rapidly progressive glomerulonephritis. Indian J. Med. Res. 2019, 150, 399–406. [Google Scholar] [CrossRef]
- Naranjo, M.; Agrawal, A.; Goyal, A.; Rangaswami, J. Neutrophil-to-lymphocyte ratio and platelet-to-lymphocyte ratio predict acute cellular rejection in the kidney allograft. Ann. Transplant. 2018, 23, 467–474. [Google Scholar] [CrossRef] [PubMed]
- Arroyo, V.; García-Martinez, R.; Salvatella, X. Human Serum Albumin, Systemic Inflammation, and Cirrhosis. J. Hepatol. 2014, 61, 396–407. [Google Scholar] [CrossRef] [PubMed]
- Li, T.; Li, X.; Wei, Y.; Dong, G.; Yang, J.; Yang, J.; Fang, P.; Qi, M. Predictive Value of C-Reactive Protein-To-Albumin Ratio for Neonatal Sepsis. J. Inflamm. Res. 2021, 14, 3207–3215. [Google Scholar] [CrossRef] [PubMed]
- Haksoyler, V.; Topkan, E. High Pretreatment Platelet-To-Albumin Ratio Predicts Poor Survival Results in Locally Advanced Nasopharyngeal Cancers Treated with Chemoradiotherapy. Ther. Clin. Risk Manage. 2021, 17, 691–700. [Google Scholar] [CrossRef]
- Kalyoncuoglu, M.; Durmus, G. Relationship between C-reactive protein-to-albumin ratio and the extent of coronary artery disease in patients with non-ST-elevated myocardial infarction. Coron. Artery Dis. 2020, 31, 130–136. [Google Scholar] [CrossRef] [PubMed]
- Ahbap, E.; Sakaci, T.; Kara, E.; Sahutoglu, T.; Koc, Y.; Basturk, T.; Sevinc, M.; Akgol, C.; Kayalar, A.O.; Ucar, Z.A.; et al. Neutrophil-to-lymphocyte ratio and platelet-tolymphocyte ratio in evaluation of inflammation in end-stage renal disease. Clin. Nephrol. 2016, 85, 199–208. [Google Scholar] [CrossRef]
- Zhu, X.; Li, R.; Zhu, Y.; Zhou, J.; Han, X.; Tong, Y.; Tan, Y. Neutrophil/lymphocyte, platelet/lymphocyte, monocyte/lymphocyte ratios and systemic immune-inflammation index in patients with depression. Bratisl. Med. J. 2023, 124, 471–474. [Google Scholar] [CrossRef]
- Saito, N.; Shirai, Y.; Horiuchi, T.; Sugano, H.; Shiba, H.; Sakamoto, T.; Uwagawa, T.; Yanaga, K. Preoperative Platelet to Albumin Ratio Predicts Outcome of Patients with Cholangiocarcinoma. Anticancer Res. 2018, 38, 987–992. [Google Scholar] [CrossRef]
- Guo, M.; Sun, T.; Zhao, Z.; Ming, L. Preoperative Platelet to Albumin Ratio Predicts Outcome of Patients with Non-Small-Cell Lung Cancer. Ann. Thorac. Cardiovasc. Surg. 2021, 27, 84–90. [Google Scholar] [CrossRef]
- Gui, Y.; Xu, Y.; Yang, P. Predictive Value of the Platelet-To-Albumin Ratio (PAR) on the Risk of Death at Admission in Patients Suffering from Severe Fever with Thrombocytopenia Syndrome. J. Inflamm. Res. 2021, 14, 5647–5652. [Google Scholar] [CrossRef] [PubMed]
- Yang, Y.; Yuan, J.; Liu, L.; Qie, S.; Yang, L.; Yan, Z. Platelet-to-albumin ratio: A Risk Factor Associated with Technique Failure and Mortality in Peritoneal Dialysis Patients. Ren. Fail. 2021, 43, 1359–1367. [Google Scholar] [CrossRef] [PubMed]
- Molnar, M.Z.; Streja, E.; Kovesdy, C.P.; Budoff, M.J.; Nissenson, A.R.; Krishnan, M.; Anker, S.D.; Norris, K.C.; Fonarow, G.C.; Kalantar-Zadeh, K. High Platelet Count as a Link between Renal Cachexia and Cardiovascular Mortality in End-Stage Renal Disease Patients. Am. J. Clin. Nutr. 2011, 94, 945–954. [Google Scholar] [CrossRef] [PubMed]
- Peng, F.; Li, Z.; Yi, C.; Guo, Q.; Yang, R.; Long, H.; Huang, F.; Yu, X.; Yang, X. Platelet Index Levels and Cardiovascular Mortality in Incident Peritoneal Dialysis Patients: A Cohort Study. Platelets 2017, 28, 576–584. [Google Scholar] [CrossRef]
- Fogo, A.B. Mechanisms of Progression of Chronic Kidney Disease. Pediatr. Nephrol. 2007, 22, 2011–2022. [Google Scholar] [CrossRef] [PubMed]
- Sági, B.; Késői, I.; Vas, T.; Csiky, B.; Nagy, J.; Kovács, T.J. Left ventricular myocardial mass index associated with cardiovascular and renal prognosis in IgA nephropathy. BMC Nephrol. 2022, 23, 285. [Google Scholar] [CrossRef] [PubMed]
- Sági, B.; Késői, I.; Vas, T.; Csiky, B.; Nagy, J.; Kovács, T. The prognostic role of heart rate recovery after exercise and metabolic syndrome in IgA nephropathy. BMC Nephrol. 2021, 22, 390. [Google Scholar] [CrossRef]
- Yamamoto, R.; Nagasawa, Y.; Shoji, T.; Iwatani, H.; Hamano, T.; Kawada, N.; Inoue, K.; Uehata, T.; Kaneko, T.; Okada, N.; et al. Cigarette Smoking and Progression of IgA Nephropathy. Am. J. Kidney Dis. 2010, 56, 313–324. [Google Scholar] [CrossRef]
- Yi, F.; Li, Z.; Jiang, J.; Lan, L.; Bai, Y. Related factors of crescents and prognosis in IgA nephropathy. Clin. Nephrol. 2023, 99, 24–31. [Google Scholar] [CrossRef]
- Chang, D.; Cheng, Y.; Luo, R.; Zhang, C.; Zuo, M.; Xu, Y.; Dai, W.; Li, Y.; Han, M.; He, X.; et al. The prognostic value of platelet-to-lymphocyte ratio on the long-term renal survival in patients with IgA nephropathy. Int. Urol. Nephrol. 2021, 53, 523–530. [Google Scholar] [CrossRef]
- Gan, W.; Guan, Q.; Hu, X.; Zeng, X.; Shao, D.; Xu, L.; Xiao, W.; Mao, H.; Chen, W. The association between platelet-lymphocyte ratio and the risk of all-cause mortality in chronic kidney disease: A systematic review and meta-analysis. Int. Urol. Nephrol. 2022, 54, 2959–2967. [Google Scholar] [CrossRef]
- Zeng, M.; Liu, Y.; Liu, F.; Peng, Y.; Sun, L.; Xiao, L. J-shaped association of platelet-to-lymphocyte ratio with 5-year mortality among patients with chronic kidney disease in a prospective cohort study. Int. Urol. Nephrol. 2020, 52, 1943–1957. [Google Scholar] [CrossRef]
- Chen, T.; Yang, M. Platelet-to. lymphocyte ratio is associated with cardiovascular disease in continuous ambulatory peritoneal dialysis patients. Int. Immunol. 2020, 78, 106063. [Google Scholar] [CrossRef]


| Clinical Data | IgAN Patients (n = 124) | PAR High (n = 61) | PAR Low (n = 63) | p | Without a Combined Endpoint (n = 91) | With a Combined Endpoint (n = 33) | p |
|---|---|---|---|---|---|---|---|
| Man/woman (n/%) | 83/29 (74/26) | 48/13 (79/21) | 35/28 (55/45) | 0.004 | 53/38 (58/42) | 28/58(85/15) | <0.001 |
| Age (year) | 43.7 ± 13.5 | 43.6 ± 11.7 | 43.9 ± 11.2 | NS | 40.7 ± 12.3 | 53.1 ± 10.0 | <0.001 |
| Average systolic/diastolic RR (mmHg) | 124/74 ± 14/9 | 127/75 ± 15/9 | 120/73 ± 11/8 | 0.003 | 121/72 ± 13/8 | 129/77 ± 14/8 | 0.003 |
| 24 h pulse pressure (mmHg) | 49.6 ± 10.7 | 52.2 ± 12.8 | 47.1 ± 7.7 | 0.012 | 48.9 ± 8.0 | 51.8 ± 12.5 | NS |
| Diurnal index systolic (%) | 9.66 ± 5.6 | 10.2 ± 6.2 | 9.2 ± 5.2 | NS | 10.4 ± 5.9 | 7.6 ± 7.8 | 0.033 |
| Metabolic parameters | |||||||
| Hypertension (n, %) | 94 (84) | 51 (81) | 43 (70) | NS | 62 (68) | 30 (91) | <0.001 |
| BMI (kg/m2) | 26.6 ± 4.6 | 26.7 ± 4.5 | 26.5 ± 4.7 | NS | 26.2 ± 4.4 | 27.8 ± 4.7 | 0.048 |
| Dyslipidemia (n, %) | 58 (52) | 32 (51) | 26 (43) | NS | 38 (42) | 18 (54) | NS |
| Diabetes (n, %) | 30 (27) | 15 (24) | 15 (24) | NS | 14 (15) | 16 (48) | 0.001 |
| eGFR (mL/min/1.73 m2) | 84.5 ± 32.4 | 83.8 ± 29.6 | 85.2 ± 27.8 | NS | 93.0 ± 33.5 | 62.1 ± 30.7 | 0.001 |
| Duration of kidney disease (year) | 10.8 ± 9.4 | 11.5 ± 10 | 10 ± 9 | NS | 9.5 ± 9.3 | 10.2 ± 10.8 | NS |
| Smoking (n, %) | 21 (19) | 11 (17) | 10 (16) | NS | 11 (12) | 9 (27) | 0.012 |
| Metabolic syndrome (n, %) | 27 (24) | 14 (22) | 13 (21) | NS | 11 (12) | 16 (48) | <0.001 |
| Platelet-related parameters | |||||||
| PLR | 140.14 ± 65.18 | 158.05 ± 73.05 | 122.23 ± 50.15 | 0.001 | 132.67 ± 35.88 | 155.58 ± 84.44 | 0.037 |
| PAR (G/g) | 5.78 ± 1.89 | 7.12 ± 1.64 | 4.41 ± 0.89 | <0.001 | 5.43 ± 1.84 | 6.03 ± 1.71 | 0.039 |
| PLT (G/L) | 238.9 ± 68.88 | 290 ± 51.29 | 187.7 ± 40.24 | <0.001 | 244.27 ± 64.86 | 221.35 ± 69.48 | NS |
| Echocardiographic parameters | |||||||
| LVEF (%) | 62.4 ± 6.5 | 62.9 ± 7.7 | 62.5 ± 4.9 | NS | 63.4 ± 6.3 | 61.0 ± 6.1 | 0.037 |
| LVMI (g/m2) | 107.7 ± 22.8 | 110.5 ± 23.2 | 104.9 ± 16.1 | 0.034 | 99.7 ± 19.7 | 127.1 ± 17.1 | <0.001 |
| LVM (g) | 204.4 ± 51.4 | 239.0 ± 48.8 | 194.9 ± 44.0 | 0.028 | 199.1 ± 46.5 | 241.2 ± 48.7 | <0.001 |
| LVEDD (cm) | 5.09 ± 0.4 | 4.93 ± 0.39 | 5.05 ± 0.41 | NS | 5.88 ± 0.42 | 5.14 ± 0.33 | NS |
| DD (n/%) | 37 (47) | 24 (39) | 13 (21) | 0.025 | 33 (36) | 24 (72) | 0.001 |
| Pathological lesions | |||||||
| M (0/1) (n/%) | 52 (46) | 29 (46) | 23 (38) | NS | 34 (37) | 16 (48) | NS |
| E (0/1) (n/%) | 2 (2) | 1 (1.6) | 1 (1.6) | NS | 1 (1) | 0 (0) | NS |
| S (0/1) (n/%) | 22 (20) | 14 (22) | 8 (13) | NS | 14 (15) | 6 (18) | NS |
| T (0/1/2) (n/%) | 56 (50) | 27 (43) | 29 (47) | NS | 27 (29) | 29 (88) | <0.001 |
| C (0/1) (n/%) | 28 (25) | 17 (27) | 11 (18) | NS | 18 (20) | 10 (30) | NS |
| Laboratory results | |||||||
| Hb (g/dL) | 13.6 ± 1.53 | 13.6 ± 1.54 | 13.7 ± 1.56 | NS | 13.9± | 13.3± | NS |
| AU (mg/L) | 484.6 ± 658.4 | 494.8 ± 521.8 | 431.4 ± 550.9 | NS | 361.2± | 731.7± | 0.002 |
| UA (umol/L) | 320.5 ± 76.7 | 318.1 ± 68.8 | 342.3 ± 76.7 | NS | 318.4± | 363.4± | 0.015 |
| Total cholesterol (mmol/L) | 5.03 ± 1.21 | 4.95 ± 1.41 | 4.98 ± 0.95 | NS | 5.39± | 5.19± | NS |
| HDL cholesterol (mmol/L) | 1.28 ± 0.51 | 1.23 ± 0.36 | 1.31 ± 0.64 | NS | 1.34± | 1.32± | NS |
| TG (mmol/L) | 1.69 ± 1.05 | 1.76 ± 1.12 | 1.71 ± 0.90 | NS | 2.04± | 1.97± | NS |
| Therapy | |||||||
| ACEI/ARB (n, %) | 65 (82) | 52 (82) | 50 (82) | NS | 71 (78) | 29 (88) | 0.021 |
| BB (n, %) | 22 (28) | 18 (28) | 13 (21) | NS | 15 (16) | 16 (48) | <0.001 |
| Statin (n, %) | 26 (33) | 18 (28) | 18 (46) | NS | 22 (24) | 13 (39) | 0.027 |
| CCB (n, %) | 22 (28) | 12 (19) | 18 (29) | NS | 18 (20) | 12 (36) | 0.015 |
| PAR | PLR | PLT | ||||
|---|---|---|---|---|---|---|
| r | p | r | p | r | p | |
| Gender | −0.273 | 0.001 | 0.031 | 0.367 | −0.201 | 0.013 |
| Age | −0.007 | 0.468 | −0.029 | 0.377 | −0.128 | 0.079 |
| Dyslipidemia | 0.073 | 0.209 | 0.005 | 0.477 | 0.084 | 0.176 |
| Obesity | −0.024 | 0.397 | −0.079 | 0.192 | −0.077 | 0.198 |
| HT | 0.068 | 0.227 | 0.077 | 0.198 | 0.073 | 0.211 |
| DM | −0.064 | 0.239 | −0.097 | 0.141 | −0.131 | 0.074 |
| eGFR (ml/min) | 0.056 | 0.266 | 0.143 | 0.057 | 0.158 | 0.040 |
| AU (mg/L) | 0.048 | 0.296 | −0.165 | 0.033 | 0.038 | 0.336 |
| M | 0.081 | 0.205 | 0.056 | 0.283 | 0.084 | 0.194 |
| E | 0.033 | 0.367 | −0.041 | 0.334 | 0.045 | 0.319 |
| S | 0.161 | 0.047 | 0.001 | 0.497 | 0.087 | 0.185 |
| T | −0.016 | 0.435 | 0.019 | 0.423 | −0.058 | 0.274 |
| C | 0.053 | 0.292 | 0.069 | 0.237 | 0.061 | 0.264 |
| LVH | 0.003 | 0.486 | −0.178 | 0.025 | −0.130 | 0.077 |
| Univariate Analysis | Multivariate Analysis | |||||||||||
|---|---|---|---|---|---|---|---|---|---|---|---|---|
| PAR | B | Std. Errors | Beta | t | p | B | Std. Errors | Beta | t | p | 95.0% CI for B Lower | 95.0% CI for B Upper |
| Gender | −1.098 | 0.348 | −0.273 | −3.153 | 0.002 | −1.264 | 0.418 | −0.315 | −3.025 | 0.003 | −2.094 | −0.434 |
| Age | −0.001 | 0.013 | −0.007 | −0.080 | 0.937 | 0.005 | 0.017 | 0.033 | 0.296 | 0.768 | −0.028 | 0.038 |
| Dyslipidemia | 0.278 | 0.342 | 0.073 | 0.812 | 0.418 | 0.351 | 0.395 | 0.092 | 0.888 | 0.377 | −0.434 | 1.136 |
| Obesity | −0.105 | 0.400 | −0.024 | −0.261 | 0.794 | 0.300 | 0.511 | 0.068 | 0.587 | 0.559 | −0.716 | 1.316 |
| HT | 0.297 | 0.395 | 0.068 | 0.751 | 0.454 | 0.669 | 0.510 | 0.152 | 1.313 | 0.193 | −0.344 | 1.683 |
| DM | −0.285 | 0.400 | −0.064 | −0.712 | 0.478 | −0.447 | 0.525 | −0.101 | −0.851 | 0.397 | −1.490 | 0.596 |
| eGFR | 0.003 | 0.005 | 0.056 | 0.627 | 0.532 | 0.008 | 0.006 | 0.156 | 1.298 | 0.197 | −0.004 | 0.021 |
| AU | 0.001 | 0.001 | 0.048 | 0.537 | 0.592 | 0.001 | 0.001 | 0.063 | 0.607 | 0.545 | 0.001 | 0.002 |
| M | 0.305 | 0.369 | 0.081 | 0.828 | 0.410 | 0.470 | 0.391 | 0.124 | 1.200 | 0.233 | −0.308 | 1.247 |
| E | 0.655 | 1.921 | 0.033 | 0.341 | 0.734 | 0.845 | 1.979 | 0.043 | 0.427 | 0.670 | −3.087 | 4.777 |
| S | 0.760 | 0.451 | 0.161 | 1.687 | 0.095 | 0.848 | 0.518 | 0.180 | 1.638 | 0.105 | −0.180 | 1.876 |
| T | −0.041 | 0.249 | −0.016 | −0.163 | 0.871 | −0.070 | 0.291 | −0.027 | −0.240 | 0.811 | −0.648 | 0.508 |
| C | 0.230 | 0.418 | 0.053 | 0.550 | 0.583 | −0.028 | 0.459 | −0.006 | −0.061 | 0.951 | −0.940 | 0.883 |
| LVH | 0.012 | 0.346 | 0.003 | 0.034 | 0.973 | −0.115 | 0.453 | −0.030 | −0.253 | 0.801 | −1.015 | 0.785 |
| PLR | ||||||||||||
| Gender | 4.241 | 12.486 | 0.031 | 0.340 | 0.735 | 6.407 | 1.524 | 0.046 | 0.441 | 0.660 | −22.442 | 35.256 |
| Age | −0.144 | 0.456 | −0.029 | −0.315 | 0.753 | 0.324 | 0.574 | 0.064 | 0.563 | 0.575 | −0.817 | 1.464 |
| Dyslipidemia | 0.695 | 11.831 | 0.005 | 0.059 | 0.953 | 2.324 | 13,736 | 0.018 | 0.169 | 0.866 | −24.961 | 29.608 |
| Obesity | −12.019 | 13.772 | −0.079 | −0.873 | 0.385 | −11.937 | 17.775 | −0.078 | −0.672 | 0.504 | −47.244 | 23.370 |
| HT | 11.600 | 13.622 | 0.077 | 0.852 | 0.396 | 29.988 | 17.724 | 0.199 | 1.692 | 0.094 | −5.218 | 65.195 |
| DM | −14.860 | 13.750 | −0.097 | −1.081 | 0.282 | −15.847 | 18.245 | −0.104 | −0.869 | 0.387 | −52.088 | 20.394 |
| eGFR | 0.261 | 0.164 | 0.143 | 1.590 | 0.114 | 0.341 | 0.222 | 0.186 | 1.535 | 0.128 | −0.100 | 0.782 |
| AU | −0.017 | 0.009 | −0.165 | −1.850 | 0.067 | −0.020 | 0.011 | −0.195 | −1.864 | 0.066 | −0.041 | 0.001 |
| M | 7.295 | 12.696 | 0.056 | 0.575 | 0.567 | 10.273 | 13.604 | 0.079 | 0.755 | 0.452 | −16.750 | 37.297 |
| E | −28.315 | 65.985 | 0.041 | −0.429 | 0.669 | −56.341 | 68.790 | −0.082 | −0.819 | 0.415 | −192.983 | 80.302 |
| S | 0.135 | 15.688 | 0.001 | 0.009 | 0.993 | 14.410 | 17.985 | 0.089 | 0.801 | 0.425 | −21.315 | 50.134 |
| T | 1.671 | 8.540 | 0.019 | 0.196 | 0.845 | 12.890 | 10.112 | 0.146 | 1.275 | 0.206 | −7.196 | 32.976 |
| C | 10.334 | 14.354 | 0.069 | 0.720 | 0.473 | 4.195 | 15.947 | 0.028 | 0.263 | 0.793 | −27.481 | 35.871 |
| LVH | −23.245 | 11.713 | −0.178 | −1.985 | 0.049 | −27.749 | 15.746 | −0.213 | −1.762 | 0.081 | −59.026 | 3.528 |
| PLT | ||||||||||||
| Gender | −27.550 | 12.153 | −0.201 | −2.267 | 0.025 | −35.340 | 14.137 | −0.258 | −2.500 | 0.014 | −63.421 | −7.259 |
| Age | −0.639 | 0.449 | −0.128 | −1.422 | 0.157 | −0.318 | 0.559 | −0.063 | −0.568 | 0.571 | −1.428 | 0.793 |
| Dyslipidemia | 10.936 | 11.708 | 0.084 | 0.934 | 0.352 | 14.666 | 13.370 | 0.113 | 1.097 | 0.276 | −11.892 | 41.223 |
| Obesity | −11.645 | 13.680 | −0.077 | −0.851 | 0.396 | 2.471 | 17.301 | 0.016 | 0.143 | 0.887 | −31.896 | 36.838 |
| HT | 10.901 | 13.533 | 0.073 | 0.806 | 0.422 | 35.171 | 17.252 | 0.235 | 2.039 | 0.044 | 0.902 | 69.441 |
| DM | −19.848 | 13.602 | −0.131 | −1.459 | 0.147 | −19.807 | 17.759 | −0.131 | −1.115 | 0.268 | −55.083 | 15.469 |
| eGFR | 0.287 | 0.163 | 0.158 | 1.765 | 0.080 | 0.398 | 0.216 | 0.219 | 1.843 | 0.069 | −0.031 | 0.827 |
| AU | 0.004 | 0.009 | 0.038 | 0.425 | 0.672 | 0.007 | 0.010 | 0.065 | 0.638 | 0.525 | −0.014 | 0.027 |
| M | 10.929 | 12.584 | 0.084 | 0.869 | 0.387 | 15.123 | 13.242 | 0.117 | 1.142 | 0.256 | −11.180 | 41.427 |
| E | 30.863 | 65.520 | 0.045 | 0.471 | 0.639 | 9.932 | 66.958 | 0.015 | 0.148 | 0.882 | −123.073 | 142.936 |
| S | 13.965 | 15.521 | 0.087 | 0.900 | 0.370 | 18.098 | 17.506 | 0.112 | 1.034 | 0.304 | −16.676 | 52.871 |
| T | −5.094 | 8.469 | −0.058 | −0.601 | 0.549 | 0.813 | 9.843 | 0.009 | 0.083 | 0.934 | −18.738 | 20.364 |
| C | 9.038 | 14.263 | 0.061 | 0.634 | 0.528 | −0.481 | 15.522 | −0.003 | −0.031 | 0.975 | −31.313 | 30.352 |
| LVH | −16.848 | 11.722 | −0.130 | −1.437 | 0.153 | −15.306 | 15.327 | −0.118 | −0.999 | 0.321 | −45.751 | 15.138 |
| Primary, Combined Endpoints | B | SE | Wald | df | p | Exp(B) | 95.0% CI for Exp(B) Lower | 95.0% CI for Exp(B) Upper |
|---|---|---|---|---|---|---|---|---|
| PLR | 0.009 | 0.004 | 4.903 | 1 | 0.027 | 1.009 | 1.001 | 1.017 |
| PAR | 0.734 | 0.465 | 2.489 | 1 | 0.115 | 2.084 | 0.837 | 5.188 |
| PLT | −0.019 | 0.013 | 2.048 | 1 | 0.152 | 0.981 | 0.957 | 1.007 |
| Gender | −2.021 | 0.778 | 6.740 | 1 | 0.009 | 0.133 | 0.029 | 0.609 |
| Age | 0.035 | 0.023 | 2.277 | 1 | 0.131 | 1.035 | 0.990 | 1.083 |
| Dyslipidemia | 1.186 | 0.564 | 4.421 | 1 | 0.036 | 3.273 | 1.084 | 9.885 |
| Obesity | 0.523 | 0.507 | 1.067 | 1 | 0.302 | 1.688 | 0.625 | 4.556 |
| HT | −1.262 | 1.171 | 1.162 | 1 | 0.281 | 0.283 | 0.029 | 2.810 |
| DM | −1.354 | 0.589 | 5.280 | 1 | 0.022 | 0.258 | 0.081 | 0.819 |
| eGFR (mL/min/1.73 m2) | −0.015 | 0.010 | 2.556 | 1 | 0.110 | 0.985 | 0.966 | 1.003 |
| AU (mg/L) | 0.001 | 0.001 | 1.567 | 1 | <0.001 | 1.001 | 1.001 | 1.002 |
| M | 0.509 | 0.527 | 0.933 | 1 | 0.334 | 1.663 | 0.593 | 4.668 |
| E | 9.206 | 528.463 | 0.001 | 1 | 0.986 | 9954.897 | 0.001 | 6781.987 |
| S | 0.457 | 0.646 | 0.500 | 1 | 0.479 | 1.579 | 0.445 | 5.604 |
| T | 0.660 | 0.657 | 1.009 | 1 | 0.315 | 1.936 | 0.534 | 7.022 |
| C | −0.450 | 0.535 | 0.705 | 1 | 0.401 | 0.638 | 0.223 | 1.821 |
| LVH | −0.892 | 0.592 | 2.273 | 1 | 0.132 | 0.410 | 0.129 | 1.307 |
| Secondary renal endpoints | ||||||||
| PLR | 0.003 | 0.006 | 0.269 | 1 | 0.604 | 1.003 | 0.991 | 1.015 |
| PAR | 0.337 | 0.629 | 0.288 | 1 | 0.592 | 1.401 | 0.409 | 4.804 |
| Tct | −0.016 | 0.018 | 0.768 | 1 | 0.381 | 0.984 | 0.951 | 1.020 |
| Gender | 0.140 | 0.675 | 0.043 | 1 | 0.836 | 1.150 | 0.306 | 4.316 |
| Age | −0.008 | 0.027 | 0.079 | 1 | 0.778 | 0.992 | 0.941 | 1.047 |
| Dyslipidemia | 0.277 | 0.676 | 0.167 | 1 | 0.683 | 1.319 | 0.350 | 4.965 |
| Obesity | 0.458 | 0.608 | 0.569 | 1 | 0.451 | 1.581 | 0.481 | 5.204 |
| HT | −2.379 | 1.375 | 2.991 | 1 | 0.084 | 0.093 | 0.006 | 1.373 |
| DM | −0.332 | 0.769 | 0.187 | 1 | 0.666 | 0.717 | 0.159 | 3.236 |
| eGFR (mL/min/1.73 m2) | −0.011 | 0.011 | 1.011 | 1 | 0.315 | 0.989 | 0.967 | 1.011 |
| AU (mg/L) | 0.002 | 0.001 | 15.021 | 1 | 0.001 | 1.002 | 1.001 | 1.003 |
| M | 0.829 | 0.718 | 1.331 | 1 | 0.249 | 2.290 | 0.560 | 9.359 |
| E | 9.946 | 700.758 | 0.001 | 1 | 0.989 | 20,870.393 | 0.001 | 12,678.798 |
| S | −0.512 | 0.763 | 0.450 | 1 | 0.502 | 0.599 | 0.134 | 2.676 |
| T | −0.145 | 0.839 | 0.030 | 1 | 0.863 | 0.865 | 0.167 | 4.483 |
| C | 0.956 | 0.812 | 1.383 | 1 | 0.240 | 2.600 | 0.529 | 12.778 |
| LVH | −1.880 | 0.896 | 4.401 | 1 | 0.036 | 0.153 | 0.026 | 0.884 |
| Secondary cardiovascular endpoints | ||||||||
| PLR | 0.007 | 0.005 | 1.773 | 1 | 0.183 | 1.007 | 0.997 | 1.018 |
| PAR | 0.485 | 0.808 | 0.360 | 1 | 0.548 | 1.624 | 0.333 | 7.911 |
| PLT | 0.013 | 0.026 | 0.271 | 1 | 0.602 | 1.014 | 0.964 | 1.066 |
| Gender | −3.753 | 1.482 | 6.412 | 1 | 0.011 | 0.023 | 0.001 | 0.428 |
| Age | 0.137 | 0.064 | 4.595 | 1 | 0.032 | 1.147 | 1.012 | 1.300 |
| Dyslipidemia | 1.932 | 1.151 | 2.816 | 1 | 0.093 | 6.902 | 0.723 | 65.888 |
| Obesity | 1.271 | 1.294 | 0.965 | 1 | 0.326 | 3.563 | 0.282 | 44.995 |
| HT | −12.897 | 262.853 | 0.002 | 1 | 0.961 | 0.001 | 0.001 | 0.0001 |
| DM | −2.279 | 1.029 | 4.905 | 1 | 0.027 | 0.102 | 0.014 | 0.769 |
| eGFR (mL/min/1.73 m2) | −0.039 | 0.028 | 2.009 | 1 | 0.156 | 0.962 | 0.911 | 1.015 |
| AU (mg/L) | 0.001 | 0.001 | 0.234 | 1 | 0.629 | 1.000 | 0.999 | 1.002 |
| M | 1.180 | 1.175 | 1.010 | 1 | 0.315 | 3.256 | 0.326 | 32.551 |
| E | 8.193 | 1722.647 | 0.001 | 1 | 0.996 | 3615.569 | 0.001 | 2356.432 |
| S | 3.838 | 2.102 | 3.332 | 1 | 0.068 | 46.413 | 0.754 | 2858.117 |
| T | 1.857 | 1.825 | 1.035 | 1 | 0.309 | 6.407 | 0.179 | 229.266 |
| C | −0.912 | 1.041 | 0.766 | 1 | 0.381 | 0.402 | 0.052 | 3.094 |
| LVH | −1.799 | 1.252 | 2.063 | 1 | 0.151 | 0.165 | 0.014 | 1.926 |
Disclaimer/Publisher’s Note: The statements, opinions and data contained in all publications are solely those of the individual author(s) and contributor(s) and not of MDPI and/or the editor(s). MDPI and/or the editor(s) disclaim responsibility for any injury to people or property resulting from any ideas, methods, instructions or products referred to in the content. |
© 2024 by the authors. Licensee MDPI, Basel, Switzerland. This article is an open access article distributed under the terms and conditions of the Creative Commons Attribution (CC BY) license (https://creativecommons.org/licenses/by/4.0/).
Share and Cite
Sági, B.; Vas, T.; Csiky, B.; Nagy, J.; Kovács, T.J. Are Platelet-Related Parameters Prognostic Predictors of Renal and Cardiovascular Outcomes in IgA Nephropathy? J. Clin. Med. 2024, 13, 991. https://doi.org/10.3390/jcm13040991
Sági B, Vas T, Csiky B, Nagy J, Kovács TJ. Are Platelet-Related Parameters Prognostic Predictors of Renal and Cardiovascular Outcomes in IgA Nephropathy? Journal of Clinical Medicine. 2024; 13(4):991. https://doi.org/10.3390/jcm13040991
Chicago/Turabian StyleSági, Balázs, Tibor Vas, Botond Csiky, Judit Nagy, and Tibor József Kovács. 2024. "Are Platelet-Related Parameters Prognostic Predictors of Renal and Cardiovascular Outcomes in IgA Nephropathy?" Journal of Clinical Medicine 13, no. 4: 991. https://doi.org/10.3390/jcm13040991
APA StyleSági, B., Vas, T., Csiky, B., Nagy, J., & Kovács, T. J. (2024). Are Platelet-Related Parameters Prognostic Predictors of Renal and Cardiovascular Outcomes in IgA Nephropathy? Journal of Clinical Medicine, 13(4), 991. https://doi.org/10.3390/jcm13040991