
Clinical Utility of the Tokyo Guidelines 2018 for Acute Cholangitis in the Emergency Department and Comparison with Novel Markers (Neutrophil-to-Lymphocyte and Blood Nitrogen Urea-to-Albumin Ratios)

Abstract
1. Introduction
2. Methods
2.1. Study Design and Participants
2.2. Study Variables
2.3. Study Endpoints
2.4. Statistical Analysis
3. Results
3.1. General Characteristics
3.2. Comparison of Clinical Outcomes
3.3. Factors Influencing Clinical Outcomes
3.4. Comparison of Accuracy of Variables for Predicting Outcomes
4. Discussion
5. Limitations
6. Conclusions
Supplementary Materials
Author Contributions
Funding
Institutional Review Board Statement
Informed Consent Statement
Data Availability Statement
Conflicts of Interest
References
- Ahmed, M. Acute cholangitis—An update. World J. Gastrointest. Pathophysiol. 2018, 9, 1–7. [Google Scholar] [CrossRef] [PubMed]
- Navuluri, R.; Hoyer, M.; Osman, M.; Fergus, J. Emergent Treatment of Acute Cholangitis and Acute Cholecystitis. Semin. Interv. Radiol. 2020, 37, 14–23. [Google Scholar] [CrossRef] [PubMed]
- Tsou, Y.K.; Su, Y.-T.; Lin, C.-H.; Liu, N.-J. Acute cholangitis: Does malignant biliary obstruction vs choledocholithiasis etiology change the clinical presentation and outcomes? World J. Clin. Cases 2023, 11, 6984–6994. [Google Scholar] [CrossRef] [PubMed]
- Miura, F.; Okamoto, K.; Takada, T.; Strasberg, S.M.; Asbun, H.J.; Pitt, H.A.; Gomi, H.; Solomkin, J.S.; Schlossberg, D.; Han, H.; et al. Tokyo Guidelines 2018: Initial management of acute biliary infection and flowchart for acute cholangitis. J. Hepato-Biliary-Pancreat. Sci. 2018, 25, 31–40. [Google Scholar] [CrossRef]
- Hudgi, A.; Cartelle, A.L.; Ahmed, A.; Alkaddour, A.; Palacio, C.; Vega, K.J.; Yap, J.E.L. Tokyo Guidelines (TG18) for Acute Cholangitis Provide Improved Specificity and Accuracy Compared to Fellow Assessment. Cureus 2022, 14, e27527. [Google Scholar] [CrossRef]
- Nve, E.; Badia, J.M.; Amillo-Zaragüeta, M.; Juvany, M.; Mourelo-Fariña, M.; Jorba, R. Early Management of Severe Biliary Infection in the Era of the Tokyo Guidelines. J. Clin. Med. 2023, 12, 4711. [Google Scholar] [CrossRef] [PubMed]
- Mohan, R.; Wei Lynn Goh, S.; Tan, G.W.; Tan, Y.P.; Junnarkar, S.P.; Huey, C.W.T.; Low, J.K.; Shelat, V.G. Validation of Tokyo Guidelines 2007 and Tokyo Guidelines 2013/2018 Criteria for Acute Cholangitis and Predictors of In-Hospital Mortality. Visc. Med. 2021, 37, 434–442. [Google Scholar] [CrossRef]
- Ye, S.; Lyu, Y.; Wang, B. The Predictive Value of Different Laboratory Indicators Based on the 2018 Tokyo Guidelines for the Severity of Acute Cholangitis. J. Emerg. Med. 2023, 65, e280–e289. [Google Scholar] [CrossRef] [PubMed]
- Faikhongngoen, S.; Chenthanakij, B.; Wittayachamnankul, B.; Phinyo, P.; Wongtanasarasin, W. Developing a Simple Score for Diagnosis of Acute Cholecystitis at the Emergency Department. Diagnostics 2022, 12, 2246. [Google Scholar] [CrossRef]
- Ahsan, K.B.; Alam, M.R.; Morel, D.G.; Karim, M.A. Emergency department resource optimisation for improved performance: A review. J. Ind. Eng. Int. 2019, 15, 253–266. [Google Scholar] [CrossRef]
- Durst, M.S.; Vargas-Torres, C.; Olson, A.D.; Mazumdar, M.; Richardson, L.D. Effect of Emergency Department and ICU Occupancy on Admission Decisions and Outcomes for Criti-cally Ill Patients. Crit. Care Med. 2018, 46, 720–727. [Google Scholar]
- Han, S.I.; Cha, K.-C.; Roh, Y.I.; Hwang, S.O.; Jung, W.J.; Kim, T.Y. Association between Novel Marker (Platelet-Lymphocyte Ratio, Neutrophil-Lymphocyte Ratio, and Delta Neutrophil Index) and Outcomes in Sudden Cardiac Arrest Patients. Emerg. Med. Int. 2021, 2021, 6650958. [Google Scholar] [CrossRef] [PubMed]
- Chen, C.; Gu, L.; Chen, L.; Hu, W.; Feng, X.; Qiu, F.; Fan, Z.; Chen, Q.; Qiu, J.; Shao, B. Neutrophil-to-Lymphocyte Ratio and Platelet-to-Lymphocyte Ratio as Potential Predictors of Prognosis in Acute Ischemic Stroke. Front. Neurol. 2020, 11, 525651. [Google Scholar] [CrossRef] [PubMed]
- Han, T.; Cheng, T.; Liao, Y.; Tang, S.; Liu, B.; He, Y.; Gu, Z.; Lei, C.; Cao, Y.; Cao, Y. Analysis of the Value of the Blood Urea Nitrogen to Albumin Ratio as a Predictor of Mortality in Patients with Sepsis. J. Inflamm. Res. 2022, 15, 1227–1235. [Google Scholar] [CrossRef] [PubMed]
- Regolo, M.; Vaccaro, M.; Sorce, A.; Stancanelli, B.; Colaci, M.; Natoli, G.; Russo, M.; Alessandria, I.; Motta, M.; Santangelo, N.; et al. Neutrophil-to-Lymphocyte Ratio (NLR) Is a Promising Predictor of Mortality and Admission to Intensive Care Unit of COVID-19 Patients. J. Clin. Med. 2022, 11, 2235. [Google Scholar] [CrossRef] [PubMed]
- Lee, S.-H.; Lee, T.-Y.; Jeong, J.-H.; Cheon, Y.-K. Clinical Significance of the Neutrophil-Lymphocyte Ratio as an Early Predictive Marker for Adverse Outcomes in Patients with Acute Cholangitis. Medicina 2022, 58, 255. [Google Scholar] [CrossRef] [PubMed]
- Chang, D.W.; Dacosta, D.; Shapiro, M.F. Priority levels in medical intensive care at an academic public hospital. JAMA Intern. Med. 2017, 177, 280–281. [Google Scholar] [CrossRef] [PubMed]
- Heyland, D.K.; Konopad, E.; Noseworthy, T.W.; Johnston, R.; Gafni, A. Is It ‘Worthwhile’ to Continue Treating Patients With a Prolonged Stay (>14 Days) in the ICU?: An Economic Evaluation. Chest 1998, 114, 192–198. [Google Scholar] [CrossRef][Green Version]
- Sokal, A.; Sauvanet, A.; Fantin, B.; de Lastours, V. Acute cholangitis: Diagnosis and management. J. Visc. Surg. 2019, 156, 515–525. [Google Scholar] [CrossRef]
- Dundar, Z.D.; Kucukceran, K.; Ayranci, M.K. Blood urea nitrogen to albumin ratio is a predictor of in-hospital mortality in older emergency department patients. Am. J. Emerg. Med. 2021, 46, 349–354. [Google Scholar] [CrossRef]
- Singh, K.; Singh, S. Blood Urea Nitrogen/Albumin Ratio and Mortality Risk in Patients with COVID-19. Indian J. Crit. Care Med. 2022, 26, 626–631. [Google Scholar] [CrossRef]
- Kaeley, N.; Singh, S.; Mahala, P.; Choudhary, S.; Singh, U.P. Predictive Value of Blood Urea Nitrogen/Albumin Ratio in Mortality in Moderate to Severe COVID-19 Patients: A Retrospective Observational Analysis. Cureus 2023, 15, e48416. [Google Scholar] [CrossRef] [PubMed]
- Bae, S.J.; Kim, K.; Yun, S.J.; Lee, S.H. Predictive performance of blood urea nitrogen to serum albumin ratio in elderly patients with gastrointestinal bleeding. Am. J. Emerg. Med. 2021, 41, 152–157. [Google Scholar] [CrossRef] [PubMed]
- Qian, B.; Zheng, Y.; Jia, H.; Zheng, X.; Gao, R.; Li, W. Neutrophil-lymphocyte ratio as a predictive marker for postoperative infectious complications: A systematic review and meta-analysis. Heliyon 2023, 9, e15586. [Google Scholar] [CrossRef] [PubMed]
- Buonacera, A.; Stancanelli, B.; Colaci, M.; Malatino, L. Neutrophil to Lymphocyte Ratio: An Emerging Marker of the Relationships between the Immune System and Diseases. Int. J. Mol. Sci. 2022, 23, 3636. [Google Scholar] [CrossRef] [PubMed]
- Capuzzo, M.; Valpondi, V.; Sgarbi, A.; Bortolazzi, S.; Pavoni, V.; Gilli, G.; Candini, G.; Gritti, G.; Alvisi, R. Validation of severity scoring systems SAPS II and APACHE II in a single-center population. Intensive Care Med. 2000, 26, 1779–1785. [Google Scholar] [CrossRef] [PubMed]
- Beck, D.H.; Smith, G.B.; Pappachan, J.V.; Millar, B. External validation of the SAPS II, APACHE II and APACHE III prognostic models in South England: A multicentre study. Intensive Care Med. 2003, 29, 249–256. [Google Scholar] [CrossRef] [PubMed]
- Pellathy, T.P.; Pinsky, M.R.; Hravnak, M. Intensive Care Unit Scoring Systems. Crit. Care Nurse 2021, 41, 54–64. [Google Scholar] [CrossRef] [PubMed]
- Yoon, U.; Mojica, J.; Wiltshire, M.; Segna, K.; Block, M.; Pantoja, A.; Torjman, M.; Wolo, E. Emergent airway management outside of the operating room—A retrospective review of patient characteristics, complications and ICU stay. BMC Anesthesiol. 2019, 19, 220. [Google Scholar] [CrossRef]
- Lapinsky, S.E. Endotracheal intubation in the ICU. Crit. Care 2015, 19, 1–3. [Google Scholar] [CrossRef]
- Lane, G. Intubation techniques. Oper. Tech. Otolaryngol. Head Neck Surg. 2005, 16, 166–170. [Google Scholar] [CrossRef]
- Stone, K.; Zwiggelaar, R.; Jones, P.; Mac Parthaláin, N. A systematic review of the prediction of hospital length of stay: Towards a unified framework. PLoS Digit. Health 2022, 1, e0000017. [Google Scholar] [CrossRef] [PubMed]


| All Patients (n = 482) | |
|---|---|
| Age | 75 (23–98) |
| Male sex, n (%) | 248 (51.5%) |
| Hypertension, n (%) | 242 (50.2%) |
| Diabetes mellitus, n (%) | 125 (25.9%) |
| Liver cirrhosis, n (%) | 16 (3.3%) |
| Chronic renal failure, n (%) | 18 (3.7%) |
| Systolic blood pressure (mmHg) | 128 (52–269) |
| Diastolic blood pressure (mmHg) | 71 (40–149) |
| Heart rate (bpm) | 86.5 (20–153) |
| Hemoglobin level (g/dL) | 12.95 (4.6–19.3) |
| WBC count (×109/L) | 9660 (1830–36,000) |
| Neutrophil count (×109/L) | 8490 (3320–9780) |
| Lymphocyte count (×109/L) | 860 (100–5020) |
| Platelet (×109/L) | 193,000 (13,000–523,000) |
| Albumin (g/dL) | 4.1 (1.2–5.2) |
| Total bilirubin (mg/dL) | 2.2 (0.2–23.5) |
| PT-INR | 1.1 (0.86–3.27) |
| BUN (mg/dL) | 15.55 (4.5–200) |
| Serum lactate dehydrogenase (U/L) | 282 (105–2551) |
| Creatinine (mg/dL) | 0.88 (0.33–7.88) |
| Hospital duration (days) | 8 (1–147) |
| TG2018 | 1 (1–3) |
| BAR | 3.84 (1–111.11) |
| NLR | 9.91 (0.67–194.20) |
| C-reactive protein (mg/dL) | 3.40 (0.03–31.02) |
| Factor | Clinical Outcomes | p | |
|---|---|---|---|
| Intensive Care | |||
| No (n = 401) | Yes (n = 81) | ||
| BAR | 3.62 (1–35.06) | 6.14 (2.18–111.11) | 0.000 |
| NLR | 8.42 (0.67–86.55) | 17.76 (0.95–194.20) | 0.000 |
| CRP | 2.79 (0.03–30.14) | 7.43 (0.03–31.02) | 0.000 |
| TG2018 | 1 (1–3) | 3 (1–3) | 0.000 |
| Long-term hospital stays | |||
| No (n = 371) | Yes (n = 111) | ||
| BAR | 3.70 (1.00–111.11) | 5.32 (1.66–35.06) | 0.000 |
| NLR | 9.51 (0.67–194.20) | 11.91 (0.95–96.10) | 0.168 |
| CRP | 2.91 (0.03–31.02) | 5.12 (0.04–29.9) | 0.000 |
| TG2018 | 1 (1–3) | 2 (1–3) | 0.000 |
| PTBD | |||
| No (n = 433) | Yes (n = 49) | ||
| BAR | 3.75 (1.00–111.11) | 5.08 (2.43–24.68) | 0.001 |
| NLR | 9.55 (0.67–194.20) | 14.98 (1.19–96.10) | 0.016 |
| CRP | 3.27 (0.03–31.02) | 6.21 (0.05–24.31) | 0.040 |
| TG2018 | 1 (1–3) | 2 (1–3) | 0.000 |
| Endotracheal intubation | |||
| No (n = 468) | Yes (n = 14) | ||
| BAR | 3.79 (1–111.11) | 9.24 (3.46–24.37) | 0.000 |
| NLR | 9.58 (0.67–194.20) | 20.16 (5.30–69.86) | 0.001 |
| CRP | 3.27 (0.03–31.02) | 10.70 (0.14–25.30) | 0.002 |
| TG2018 | 1 (1–3) | 3 (1–3) | 0.000 |
| Factor | Need for Intensive Care (n = 81) | Long-Term Hospital Stays (≥14 Days) (n = 111) | Need for PTBD (n = 49) | Need for Endotracheal Intubation (n = 14) |
|---|---|---|---|---|
| Adjust OR a (95% CI) | Adjust OR a (95% CI) | Adjust OR a (95% CI) | Adjust OR a (95% CI) | |
| BAR | 1.124 (1.042–1.213) | 1.014 (0.974–1.059) | 1.001 (0.961–1.044) | 1.023 (0.983–1.066) |
| NLR | 1.027 (1.010–1.045) | 0.997 (0.984–1.010) | 1.008 (0.994–1.023) | 1.008 (0.986–1.029) |
| CRP | 1.041 (1.002–1.081) | 1.040 (1.005–1.077) | 1.006 (0.961–1.053) | 1.038 (0.969–1.112) |
| TG2018 (1) | reference | reference | reference | reference |
| (2) | 2.435 (0.916–6.472) | 1.713 (0.934–3.141) | 0.837 (0.342–2.045) | - |
| (3) | 23.169 (9.788–54.844) | 3.267 (1.794–5.949) | 2.434 (1.122–5.284) | 16.146 (1.823–143.028) |
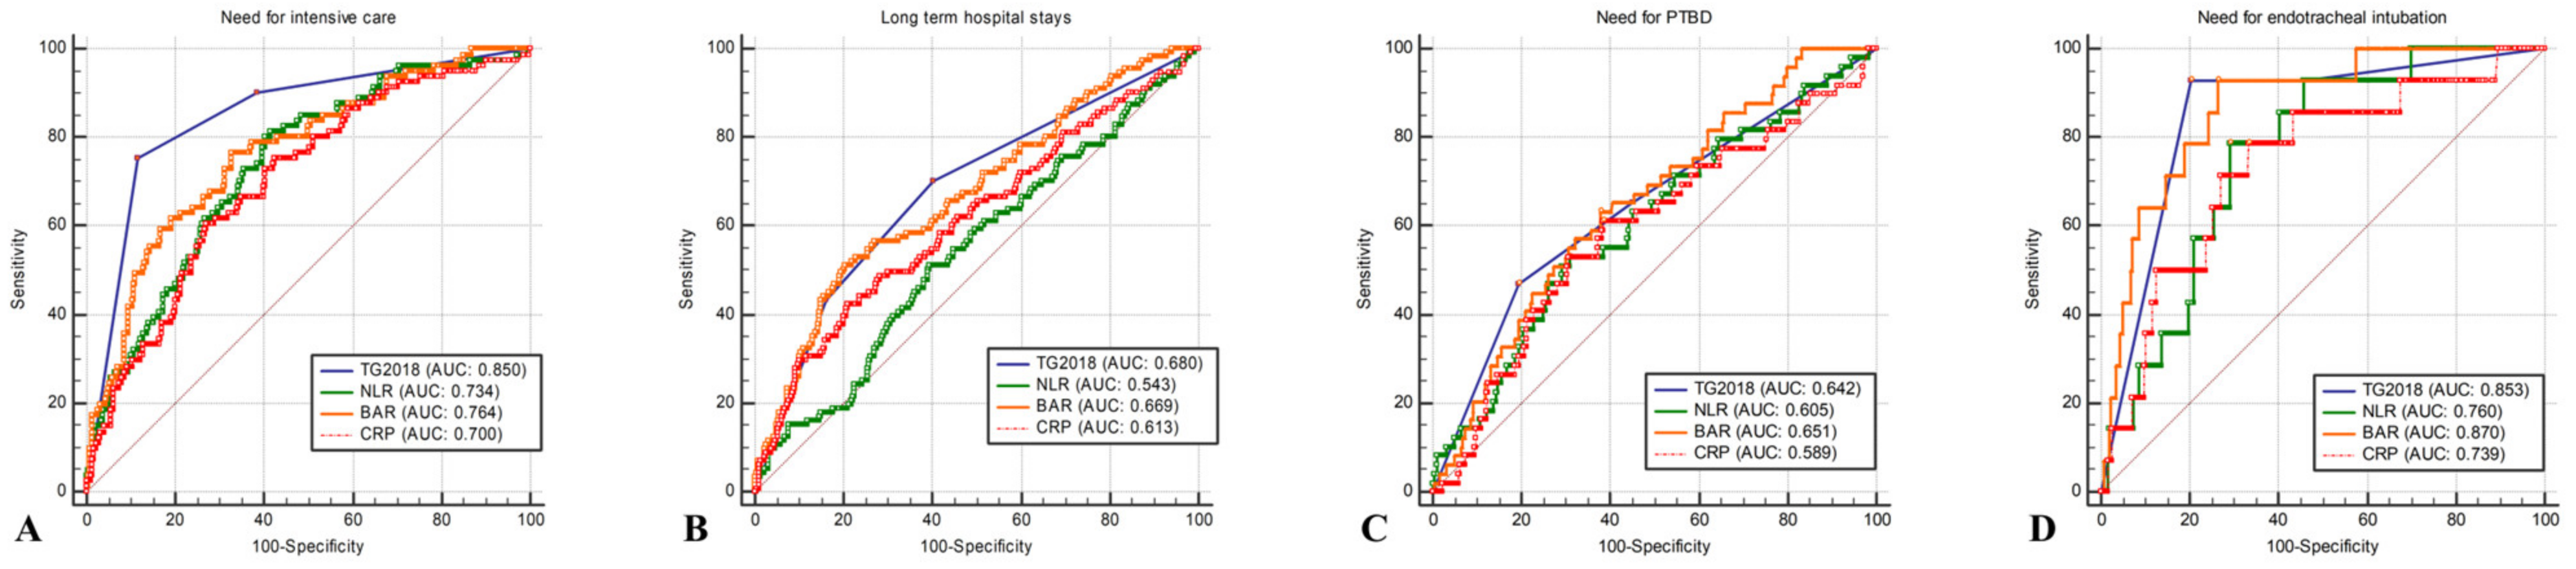
| Need for Intensive Care | AUC (95% CI) | Cutoff | Sensitivity (95% CI) | Specificity (95% CI) | PPV (95% CI) | NPV (95% CI) |
|---|---|---|---|---|---|---|
| BAR | 0.765 (0.724–0.802) | >4.26 | 76.54 (65.8–85.2) | 67.08 (92.2–71.7) | 32.0 (28.1–36.1) | 93.4 (90.5–95.5) |
| NLR | 0.734 (0.692–0.773) | >10.54 | 81.48 (71.3–89.2) | 58.60 (53.6–63.5) | 28.4 (25.4–31.7) | 94.0 (90.8–96.1) |
| CRP | 0.701 (0.658–0.742) | >6.2 | 60.49 (49.0–71.2) | 73.07 (68.4–77.3) | 31.2 (26.3–36.5) | 90.2 (87.4–92.3) |
| TG2018 | 0.850 (0.815–0.881) | >2 | 75.31 (64.5–84.2) | 88.28 (84.7–91.3) | 56.5 (49.1–63.6) | 94.7 (92.4–96.3) |
| Long-term hospital stays | AUC (95% CI) | Cutoff | Sensitivity (95% CI) | Specificity (95% CI) | PPV (95% CI) | NPV (95% CI) |
| BAR | 0.669 (0.625–0.711) | >5.26 | 51.35 (41.7–61.0) | 79.51 (75.0–83.5) | 42.9 (36.4–49.6) | 84.5 (81.8–86.9) |
| NLR | 0.543 (0.497–0.588) | >11.83 | 51.35 (41.7–61.0) | 60.65 (55.5–65.7) | 28.1 (23.8–32.7) | 80.6 (77.2–83.7) |
| CRP | 0.613 (0.568–0.656) | >7.75 | 42.34 (33.0–52.1) | 78.98 (74.5–83.0) | 37.6 (31.0–44.7) | 82.1 (79.5–84.4) |
| TG2018 | 0.680 (0.636–0.721) | >1 | 70.27 (60.9–78.6) | 59.57 (54.4–64.6) | 34.2 (30.4–38.2) | 87.0 (83.3–90.0) |
| Need for PTBD | AUC (95% CI) | Cutoff | Sensitivity (95% CI) | Specificity (95% CI) | PPV (95% CI) | NPV (95% CI) |
| BAR | 0.651 (0.607–0.694) | >4.25 | 63.27 (48.3–76.6) | 62.12 (57.4–66.7) | 15.9 (12.9–19.5) | 93.7 (91.1–95.6) |
| NLR | 0.605 (0.560–0.649) | >14.19 | 53.06 (38.3–67.5) | 69.05 (64.5–73.4) | 16.3 (12.6–20.7) | 92.9 (90.6–94.6) |
| CRP | 0.590 (0.544–0.634) | >4.59 | 61.22 (46.2–74.8) | 61.43 (56.7–66.0) | 15.2 (12.2–18.8) | 93.3 (90.7–95.3) |
| TG2018 | 0.642 (0.598–0.685) | >2 | 46.94 (32.5–61.7) | 80.37 (76.3–84.0) | 21.3 (16.0–27.8) | 93.0 (91.0–94.6) |
| Need for endotracheal intubation | AUC (95% CI) | Cutoff | Sensitivity (95% CI) | Specificity (95% CI) | PPV (95% CI) | NPV (95% CI) |
| BAR | 0.870 (0.837–0.899) | >5.20 | 92.86 (66.1–99.8) | 73.50 (69.3–77.4) | 9.5 (7.8–11.4) | 99.7 (98.1–100) |
| NLR | 0.761 (0.720–0.798) | >15.43 | 78.57 (49.2–95.3) | 70.94 (66.6–75.0) | 7.5 (5.6–9.9) | 99.1 (97.6–99.7) |
| CRP | 0.739 (0.698–0.778) | >5.92 | 78.57 (49.2–95.3) | 66.67 (62.2–70.9) | 6.6 (5.0–8.7) | 99.0 (97.4–99.6) |
| TG2018 | 0.854 (0.819–0.884) | >2 | 92.86 (66.1–99.8) | 79.70 (75.8–83.3) | 12.0 (9.8–14.7) | 99.7 (98.3–100) |
Disclaimer/Publisher’s Note: The statements, opinions and data contained in all publications are solely those of the individual author(s) and contributor(s) and not of MDPI and/or the editor(s). MDPI and/or the editor(s) disclaim responsibility for any injury to people or property resulting from any ideas, methods, instructions or products referred to in the content. |
© 2024 by the authors. Licensee MDPI, Basel, Switzerland. This article is an open access article distributed under the terms and conditions of the Creative Commons Attribution (CC BY) license (https://creativecommons.org/licenses/by/4.0/).
Share and Cite
Jung, H.-M.; Paik, J.; Lee, M.; Kim, Y.W.; Kim, T.-Y. Clinical Utility of the Tokyo Guidelines 2018 for Acute Cholangitis in the Emergency Department and Comparison with Novel Markers (Neutrophil-to-Lymphocyte and Blood Nitrogen Urea-to-Albumin Ratios). J. Clin. Med. 2024, 13, 2306. https://doi.org/10.3390/jcm13082306
Jung H-M, Paik J, Lee M, Kim YW, Kim T-Y. Clinical Utility of the Tokyo Guidelines 2018 for Acute Cholangitis in the Emergency Department and Comparison with Novel Markers (Neutrophil-to-Lymphocyte and Blood Nitrogen Urea-to-Albumin Ratios). Journal of Clinical Medicine. 2024; 13(8):2306. https://doi.org/10.3390/jcm13082306
Chicago/Turabian StyleJung, Hyun-Min, Jinhui Paik, Minsik Lee, Yong Won Kim, and Tae-Youn Kim. 2024. "Clinical Utility of the Tokyo Guidelines 2018 for Acute Cholangitis in the Emergency Department and Comparison with Novel Markers (Neutrophil-to-Lymphocyte and Blood Nitrogen Urea-to-Albumin Ratios)" Journal of Clinical Medicine 13, no. 8: 2306. https://doi.org/10.3390/jcm13082306
APA StyleJung, H.-M., Paik, J., Lee, M., Kim, Y. W., & Kim, T.-Y. (2024). Clinical Utility of the Tokyo Guidelines 2018 for Acute Cholangitis in the Emergency Department and Comparison with Novel Markers (Neutrophil-to-Lymphocyte and Blood Nitrogen Urea-to-Albumin Ratios). Journal of Clinical Medicine, 13(8), 2306. https://doi.org/10.3390/jcm13082306