Abstract
Background: The literature suggests the existence of an association between autism spectrum disorders (ASDs) and subclinical electroencephalographic abnormalities (SEAs), which show a heterogeneous prevalence rate (12.5–60.7%) within the pediatric ASD population. The aim of this study was to investigate the EEG findings in a cohort of ASD preschoolers and their correlation with the phenotypic characteristics. Methods: We retrospectively reviewed data on 141 ASD preschoolers evaluated in a tertiary care university hospital over the period 2008–2018. All participants underwent at least one standard polygraphic electroencephalogram (EEG) and a clinical multidisciplinary assessment with standardized instruments. Results: 77 patients (55%) showed SEAs, which were mainly represented by epileptiform discharges (p < 0.00001), especially focal and multifocal (p = 0.010). Abnormal EEG (p = 0.035) and epileptiform discharges (p = 0.014) were associated with seizure onset and were predominant in sleep (p < 0.00001). Patients with abnormal tracing (p = 0.031) and slow abnormalities (p < 0.001) were significantly younger. ASD severity was not found to be correlated with EEG results, which showed a potential, albeit non-significant, association with some psychometric parameters. Very similar results were found when patients were divided according to sex. Conclusions: EEG abnormalities appear to correlate more with ASD internalizing, externalizing and emotional comorbidities, rather than with ASD core symptoms; larger samples are needed to further investigate this association.
1. Introduction
Autism spectrum disorders (ASDs) are a heterogeneous group of neurodevelopmental conditions characterized by persistent deficits in social communication and social interaction across multiple contexts and by the presence of restricted, repetitive patterns of behavior, interests, or activities. The mere presence of the aforementioned clinical elements, however, is not sufficient to make the diagnosis, as the American Psychiatric Association (APA) has established that it is also necessary for them to arise during the early period of development and to cause clinically significant impairment in social, occupational, or other important areas of adaptive functioning (Diagnostic and Statistical Manual of Mental Disorders, 5th Edition, Text Revision [1]). The prevalence of ASD worldwide is estimated to be between 1.09 and 436 cases per 10,000 inhabitants, with a median of 100 cases per 10,000 inhabitants; these are very heterogeneous values, which are affected by various factors non-uniformly distributed throughout the world (i.e., ethnoracial and socioeconomical background, sociodemographic status, and community awareness about autism), responsible for a higher prevalence in Western countries compared, for example, to South-East Asia [1,2,3].
The diagnosis of ASD is made more frequently in males, with a male-to-female ratio varying between 3:1 and 4:1 [1]; this difference is probably due to several aspects, including the use of androcentric diagnostic criteria and tools [4], the phenomenon of camouflaging [5], and the hypothetical protective effect carried out by particular genetic, epigenetic, and hormonal factors [6,7,8].
Autism spectrum disorder, indeed, often occurs in comorbidity with other pathological conditions, among which intellectual disability (ID) is particularly important—it can be detected in 37.9% of autistic children [9] and this inevitably complicates the diagnosis of ASD, for which it is necessary that autistic symptoms must not be explained by a clinical picture of ID [1]. Given their notable frequency in the ASD population, particular attention must be paid to emotional and behavioral disorders too, which can be divided into internalizing disorders, mainly represented by anxiety (30–80%) [10] and depression (11–23%) [11], and externalizing disorders, especially aggressivity (17–56%) [12], hyperactivity, and inattention (13.8–66.7%) [13]. The correct diagnosis and management of these comorbidities is extremely important, as they have a heavy impact on the quality of life of autistic subjects [14]. Other recurrent conditions in the autistic population are represented by specific learning disorder (23.5–67%) [15,16,17], developmental coordination disorder (60–90%) [18,19,20,21], epilepsy (3.9–46%) [22,23,24,25,26,27,28,29,30,31,32,33,34,35,36,37,38,39,40,41,42,43,44,45,46,47,48], sleep disorders (50–80%) [49], and gastrointestinal symptoms (9–91%) [50].
Despite recent advances in genetics and the environmental factors contributing to ASD [8,51], its pathogenesis is still largely unknown today, with the idiopathic form of the disorder still accounting for approximately 85% of the diagnoses [52]. What we know is still broadly the result of various hypotheses. Among the most accredited ones, we have those relating to various possible abnormalities in the development of neuronal circuits [53], which, furthermore, are potentially not mutually exclusive with each other. For example, several authors have observed the presence of an imbalance between neurotransmitters, both excitatory (glutamate) and inhibitory (gamma-aminobutyric acid) [54,55,56,57,58,59], while others have found the existence of anomalous connections between different areas of the brain, in terms of both hypoconnectivity [60], especially between long-range brain regions [61], and hyperconnectivity [62], especially in local circuits [63], giving rise to the hypothesis of ASD as a connectopathy [64]. Other hypotheses concern the abnormal expression of a wide variety of neuronal proteins involved both in neurotransmission, such as the delta subunit of GABA-A receptors (encoded by the GABRD gene) [65], Parvalbumin [66,67], and in early brain development; for example, the CYFIP1 gene (cytoplasmic FMRP-interacting protein 1), the CHD5 gene (chromodomain helicase DNA-binding protein 5), the CNTNAP2 gene (contactin-associated protein 2), and other genes coding for neurexins [68,69,70,71]. Lastly, a potential important role for neuroinflammation has recently been suggested [72], with growing interest in the involvement of inflammatory markers such as high-mobility group box-1 protein (HMGB1) and caspase-7 (CASP7), both of which are implicated in neuronal death and found to be higher in autistic subjects than in neurotypical peers [73,74].
In this framework, the literature suggests that ASD shares these neurobiological bases with epilepsy [54,75,76,77,78,79,80,81,82], whose frequency varies depending on several factors heterogeneously distributed within various study cohorts, including the type of electroencephalogram (EEG) study, ASD diagnostic criteria, the co-occurrence of ID, developmental regression, age, gender, and etiology (idiopathic versus non-idiopathic) [83,84,85,86,87]. Since Hans Berger introduced it in 1924, EEG has been extensively used to investigate the autism–epilepsy association—this method records the brain’s electrical activity by measuring it as the total sum of excitatory and inhibitory neuronal postsynaptic potentials [88].
Through the use of EEG, various authors have highlighted the existence of a high recurrence of subclinical electroencephalographic abnormalities (SEAs), such as subclinical epileptiform discharges (SEDs) or paroxysmal slowing activity, not only in children with epilepsy and ASD, but also in those who have not experienced seizures. In the latter, the SEAs show a heterogeneous frequency, ranging from 12.5% to 60.7%, while this figure rises to 66.3% when patients with seizures are included too [83,89,90,91,92,93,94,95]. The role of SEAs in predicting the development of epilepsy in children with ASD is unclear. Despite the current lack of sufficient evidence, numerous authors agree, indeed, that SEAs could also impact neurodevelopmental outcomes [83,95,96,97].
Within this context, the aim of the present retrospective observational study is to depict the electroencephalographic findings observed in children of preschool age with ASD, and to correlate them with the patients’ phenotypic characteristics. Indeed, based on the most recent scientific literature on this topic [98], it is reasonable to assume that the EEG features might show an affinity with the phenotypic profile of the autistic subject. Hence, we expected to identify a relationship between EEG abnormalities and specific clinical traits within our cohort.
2. Materials and Methods
2.1. Participants
We retrospectively reviewed data on preschool children evaluated between January 2008 and June 2018 in both inpatient and outpatient settings at the IRCCS Stella Maris Foundation (Pisa, Italy), a tertiary care university hospital. Despite this being a single-center study, the catchment area of our facility extends to a large part of Italy and the subjects come from very heterogeneous cultural and socioeconomic backgrounds.
The study population was composed of 141 children, 115 males and 26 females (mean age: 43.91 months, SD: 13.79 months; range: 18–73.32 months). Specifically, in the male population the mean age was 44.74 months (SD: 13.72 months; range: 20.77–70.27 months), while in the female population it was 40.27 months (SD: 13.74 months; range: 18–73.32 months). The mean age reported refers to the age of the participants at the time of their first assessment carried out at our hospital; for some, these data coincide with their age at the diagnosis of ASD, while for others it does not, as this had already been carried out at other centers.
ASD diagnosis was performed or confirmed by a multidisciplinary team (a senior child psychiatrist, an experienced clinical child psychologist, an educational therapist, and a speech and language pathologist) during 5–7 days of extensive evaluation. The subject’s neurodevelopmental profile was investigated in a comprehensive manner, without being limited exclusively to the autistic spectrum. Diagnostic criteria were applied according to the time of the evaluation. Therefore, approximately 1/3 of the patients received a diagnosis of autistic disorder, Asperger’s disorder, or pervasive developmental disorder—not otherwise specified according to the Diagnostic and Statistical Manual of Mental Disorders, 4th Edition, Text Revision (DSM-IV-TR) criteria [99], while the remaining patients evaluated after 2013 received a diagnosis of autism spectrum disorder according to the Diagnostic and Statistical Manual of Mental Disorders, 5th Edition (DSM-5) criteria [1]. For the same reason, the diagnosis was confirmed using the Autism Diagnostic Observation Schedule-Generic (ADOS-G) [100], in approximately 1/3 of the children, or the Autism Diagnostic Observation Schedule-2 (ADOS-2) [101], in the remaining 2/3, using the specific module depending on the patient (Toddler, 1, or 2); due to poor collaboration, in 5 cases (all males) it was not possible to confirm the diagnosis with either of the two assessments.
All children included in this study were 6 years old or younger when they first entered our center and performed at least one standard polygraphic EEG recording in the context of the diagnostic evaluation for ASD. No patient was on psychopharmacological treatment and none of them had already received a diagnosis of epilepsy at the moment of their first EEG. The presence of other neurodevelopmental disorders was not evaluated with standardized tests, due to the age range of our sample, in which it is difficult to distinguish between delay/impairment and disorder (e.g., for developmental language disorder and attention deficit hyperactivity disorder) at least in the youngest children of our sample [102,103]. Any subsequent diagnosis of intellectual disability was taken into account for the interpretation of the results.
The exclusion criteria were: ASD associated with a defined neurological and/or metabolic or genetic condition with a defined etiology (non-idiopathic ASD); EEG recording not evaluable due to severe technical artifacts for poor collaboration.
The absence of a sleep recording was considered when interpreting the results, but did not constitute a reason for exclusion.
The parents of all subjects involved in the present study provided informed consent to use the data collected through clinical investigations and polygraphic EEG recordings for research purposes in an anonymous and aggregated form. All of the procedures complied with the Helsinki Declaration.
2.2. Clinical Investigations in ASD Subjects
The participants underwent further clinical assessment in order to complete the definition of the phenotypic profile.
We used the ADOS Calibrated Severity Score (ADOS-CSS) as a clinical measure of ASD severity. According to Lord et al., 2012 [101], by comparing the total score (range: 1–10) with pre-established cut-off values, it is possible to distinguish 4 categories of increasing severity: minimal-to-no evidence (range: 1–2), low levels (range: 3–4), moderate levels (range: 5–7), and high levels (range 8–10) of autistic features. In the present paper, we often refer to ADOS-CSS scores between 5 and 10 as moderate–severe ASD.
To assess the children’s intellectual abilities, several standardized tests were used, tailored to their varying levels of verbal and functional skills. These tests included the Leiter International Performance Scale—Revised (LIPS-R), the Griffiths Mental Development Scales—Extended Revised (GMDS-ER), the Griffiths Scales of Child Development 3rd Edition (Griffiths III) [104], and the Italian version of the Wechsler Preschool and Primary Scale of Intelligence (WPPSI) [105]. For tests that provided a mental age (MA), the IQ was calculated by dividing the mental age by the child’s chronological age (CA) and then multiplying by 100 (MA/CA × 100). In this study, we focused specifically on non-verbal IQ scores, also known as performance IQ (PIQ).
In order to evaluate behavioral and emotional problems, we used the Italian version of the Child Behavior Checklist (CBCL 1½-5), which consists of 100 items regarding the child’s behavior [106,107]. We focused our attention on the Internalizing (a combination of the Emotionally Reactive, Anxious/Depressed, Somatic Complaints, and Withdrawn scales), Externalizing (a combination of the Aggressive Behavior and Attention Problems scales), and Total Problems (which considers all 100 items) summary scales. To interpret the results we referred to both the CBCL summary scales and the CBCL DSM-oriented scales scoring systems, which distinguish three categories of increasing severity: clinical insignificance (t-score ≤ 60 for the CBCL summary scales; t-score ≤ 65 for the CBCL DSM-oriented scales), borderline clinical range (t-score between 60 and 63 for the CBCL summary scales; t-score between 65 and 69 for the CBCL DSM-oriented scales), and clinical significance (t-score ≥ 64 for the CBCL summary scales; t-score ≥ 70 for the CBCL DSM-oriented scales) [106]. Together with these three summary scales, we also took into account the CBCL—Emotional Dysregulation Profile (CBCL-ED), which consists of a set of the Anxiety/Depression scale, Aggression scale, and Attention Syndrome scale. In this case, by comparing the sum of the t-scores of these three scales with other cut-offs, it was possible to distinguish three categories of increasing severity: patients with low/no emotional dysregulation (t-score < 180), patients with deficient emotional self-regulation (t-score between 180 and 210), and patients with severe emotional dysregulation (t-score ≥ 210).
2.3. EEG Recording and Analysis
The polygraphic EEG recording was performed after partial sleep deprivation and was aimed to include a period of wakefulness and a period of daytime sleep, as recommended by the guidelines of the International League Against Epilepsy (ILAE) [108]. The EEG recordings were performed non-invasively according to the 10–20 International System at the EPILAB of the IRCCS Stella Maris Foundation (Pisa, Italy), with two surface electromyographic (EMG) electrodes placed over the deltoid muscles of both sides; two experienced neurophysiologists (E.B., A.R.F.) analyzed the recordings in joint sessions. During wakefulness, each patient underwent two activation procedures, represented by hyperventilation (HV) and intermittent photic stimulation (IPS) [109], in order to increase the diagnostic yield. Parents were also recommended to preliminarily perform adequate sleep deprivation [110], both as a further activation procedure and to encourage the child to fall asleep during the second part of the recording.
We focused on the first polygraphic EEG recording for each child. The mean age at the first recording was 43.08 months (SD: 18.71 months; range: 7.04–141.55 months), preceding the formal diagnosis of ASD in a subgroup of patients. In relation to this parameter, females (mean age = 40.25 months; SD: 12.52 months; range: 24.12–72.41 months) were found to be slightly younger than males (mean age = 43.72 months; SD: 19.83 months; range: 7.04–141.55 months). An EEG longitudinal follow-up was available for 46 participants (11 females and 35 males). Each EEG recording was systematically assessed and qualitatively classified according to the definitions provided in the glossary proposed by Kane et al. [111]. Firstly, we categorized the abnormal EEG findings using as classifiers the following terms:
- Focal, multifocal, or diffuse epileptiform discharges (spikes, polyspike discharges, sharp waves, spike-and-slow-wave complexes);
- Non-epileptiform abnormalities, which include:
- ○
- Focal or diffuse slow-wave activity (including the slowing of background activity);
- ○
- Fast activity.
According to the presence or absence of the aforementioned abnormalities, we, respectively, classified the EEG exam as ‘abnormal’ or ‘normal’. Finally, to define the location of focal and multifocal grapho-elements, we divided the scalp into 3 regions: the frontal midline region, the temporal region, and the posterior region.
2.4. Statistical Analysis
We performed the statistical analysis using the R studio software package (version 2024.04.0+735). The binary parameters were tested by the χ2 goodness of fit test and the χ2 test for categorical variables. The normality of the distribution of quantitative variables within our population was tested using the D’Agostino–Pearson normality test, while the comparison of quantitative variables between groups was performed by an independent samples t-test or one-way ANOVA (with Welch’s correction for nonhomogeneous variances), after correlation analysis using Pearson’s correlation coefficient (r). We considered a p-value ≤ 0.05 to be statistically significant and we accompanied each statistical result with the corresponding effect size (Cohen’s ω for the χ2 goodness of fit test; φ for the χ2 test for categorical variables; Cohen’s d for the independent samples t-test; ω2 for the one-way ANOVA).
3. Results
Among the 141 patients recruited for this study, one subject was excluded since his EEG recording was not evaluable due to technical artifacts for poor collaboration. We then included 114 males (81.4%) and 26 females (18.6%), with a M:F ratio of approximately 4.38:1, who showed no significant differences in age at the time of their first evaluation carried out at our hospital (male mean age = 44.77 vs. female mean age = 40.27, p = 0.141, Cohen’s d = 0.327). Nine participants (6.4%) experienced seizures (seven males and two females); two subjects (1.4%) had already shown them before the first EEG assessment, while the remaining seven (5%) developed them at a later time.
In order to summarize the composition of the study sample from a clinical point of view, the distribution of the clinical raw scores is reported in Figure 1 and Figure S1 (Supplementary File S1), while the normality testing is shown in Table S1 (Supplementary File S1).
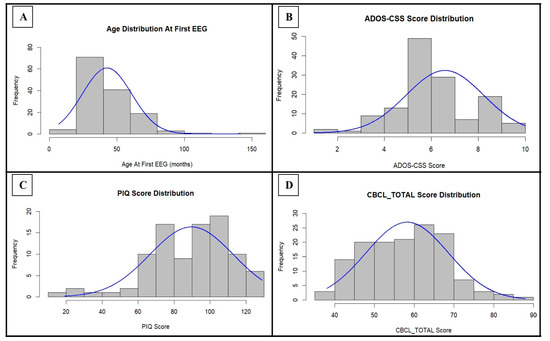
Figure 1.
Distribution of age at the first EEG, ADOS-CSS score, PIQ score, and CBCL_TOTAL score within the cohort: for each parameter, the normal curve expected for those values of mean and standard deviation is indicated in blue. ADOS-CSS: ADOS Calibrated Severity Score; PIQ: Performance Intelligence Quotient; CBCL_TOTAL: Child Behavior Checklist—Total Problems Scale.
We obtained a complete polygraphic EEG recording (wakefulness + sleep) from 128 patients (91.43%), while it was not possible to obtain a sleep recording in the remaining 13 cases (12 males and 1 female). As shown in Table 1 and Figure 2, we found an abnormal EEG in 77 subjects (55%; epileptiform discharges in 68, slow abnormalities in 24, and fast rhythmic activity in 5). Comparing the two sexes, the EEG was abnormal in 17 girls (65.38%; epileptiform discharges in 15, slow abnormalities in 4, fast rhythmic activity in 2) and in 60 boys (52.63%; epileptiform discharges in 53, slow abnormalities in 20, fast rhythmic activity in 3). Epileptiform discharges were always found to be more frequent than slow abnormalities (see Table 1)

Table 1.
Main electroencephalographic findings. n: number of participants.
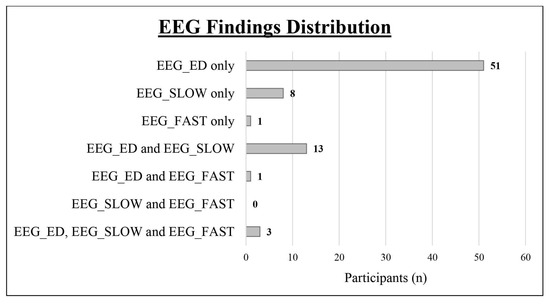
Figure 2.
Distribution of the different types of EEG abnormalities within the study cohort. EEG_ED: epileptiform discharges; EEG_SLOW: slow abnormalities; EEG_FAST: fast abnormalities.
We found no significant differences between females and males in terms of the frequency of abnormal EEG (p = 0.238, φ = 0.100); this was also true when separately considering epileptiform discharges (p = 0.302, φ = 0.087) and slow abnormalities (p = 0.792, φ = 0.022). The corresponding contingency tables are shown in Table 2 (see A and B) and Table S2 (Supplementary File S1—see A).
Table 2.
Contingency tables for χ2 tests regarding the relationship between EEG findings and both sex on the left (see A and B) and seizures on the right (see C and D). TOT: total; F: female; M: male; EEG_ED: epileptiform discharges.
As shown in Table 3 and Figure 3, leaving out those who showed EEG abnormalities both in wakefulness and in sleep, an abnormal EEG (49 vs. 3) and epileptiform discharges, in particular (52 vs. 1), were more frequent during sleep/drowsiness; these results were confirmed both in males (39 vs. 2 for abnormal EEG; 40 vs. 1 for epileptiform discharges) and females (10 vs. 1 for abnormal EEG; 12 vs. 0 for epileptiform discharges). Slow abnormalities showed a similar tendency in the general group (11 vs. 5, p = 0.134, Cohen’s ω= 0.375).
Table 3.
Main electroencephalographic findings in relation to the state of alertness. n: number of participants; TOT: total; M: males; F: females; EEG_ED: epileptiform discharges; EEG_SLOW: slow abnormalities.
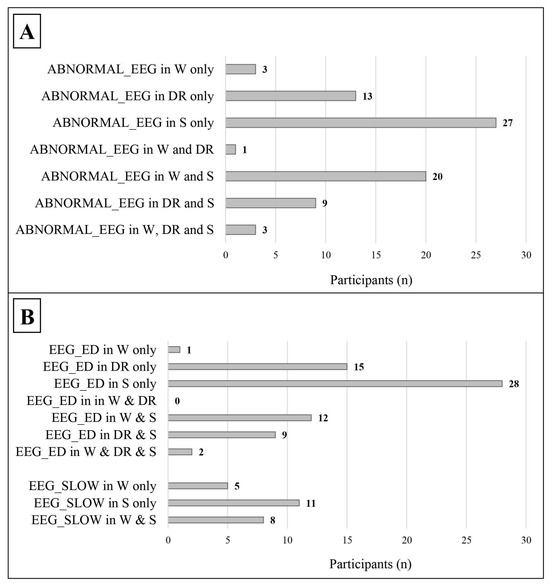
Figure 3.
Distribution of abnormal EEG findings in relation to the state of alertness. The data refer only to patients with a complete standard polygraphic EEG (wakefulness + sleep). (A) The distribution of abnormal EEG in relation to the state of alertness. (B) The distribution of the different types of EEG abnormalities in relation to the state of alertness. ABNORMAL_EEG: abnormal EEG tracing; EEG_ED: epileptiform discharges; EEG_SLOW: slow abnormalities; W: wakefulness; DR: drowsiness; S: sleep.
Table 4.
Main epileptiform discharge subtypes: the percentages refer to the total number of participants reporting epileptiform discharges. EEG_ED: epileptiform discharges; n: number of participants; TOT: total; M: males; F: females.
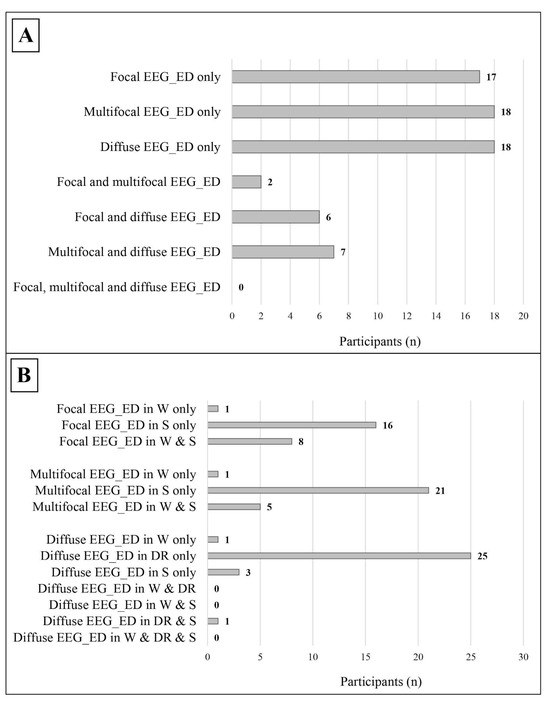
Figure 4.
Distribution of the different subtypes of epileptic discharges within the study cohort. (A) The distribution of different subtypes of epileptic discharges in relation to each other, the data refer to the whole cohort. (B) The distribution of the different subtypes of epileptic discharges in relation to the state of alertness; the data refer only to patients with a complete standard polygraphic EEG (wakefulness + sleep). EEG_ED: epileptiform discharges; W: wakefulness; DR: drowsiness; S: sleep.
- Focal, which were found in 25 participants, mostly during sleep;
- Multifocal, which were found in 27 participants, mostly during sleep;
- Diffuse, which were found in 31 participants, mostly during drowsiness.
Focal/multifocal epileptiform discharges were significantly more frequent than diffuse discharges, both in the general sample (37 vs. 18, p = 0.010, Cohen’s ω = 0.345) and in males (29 vs. 13, p = 0.013, Cohen’s ω = 0.381). The main sites of epileptiform discharges were midline regions, while slow abnormalities were mostly located in the temporal lobe (see Table 5).
Table 5.
Distribution by the location of the main EEG abnormalities: the percentages refer to the total number of participants reporting epileptiform discharges or slow abnormalities, respectively. The + indicates the occurrence in the same participant of both diffuse and focal/multifocal (in the midline or temporal region) epileptiform discharges. n: number of participants; F/M: focal/multifocal; EEG_ED: epileptiform discharges; EEG_SLOW: slow abnormalities.
Age at the time of EEG evaluation influenced the outcome of the examination, as subjects with abnormal results were found to be significantly younger (mean age = 39.55 vs. 46.65 months, p = 0.031, Cohen’s d = 0.382). These results were statistically significant considering slow abnormalities (mean age = 33.13 vs. 44.73 months, p < 0.001, Cohen’s d = 0.761) and showed a similar tendency also for epileptiform discharges (mean age = 40.46 vs. 44.97 months, p = 0.144, Cohen’s d = 0.248). These results were confirmed above all in the male subgroup, less so in the female one, in which, by contrast, the age of the patients with an abnormal EEG and epileptiform discharges was higher, although without reaching statistical significance (see Table 6). After excluding the participant with a non-evaluable EEG, no significant difference in terms of age at the first EEG recording was found between the sexes (male mean age = 43.32 vs. female mean age = 40.24, p = 0.320, Cohen’s d = 0.188).
Table 6.
Correlation between age at first EEG recording and EEG findings (* indicates statistically significant results; # indicates potential trends): 0 = indicates the absence of the corresponding abnormal EEG finding; 1 = indicates the presence of the corresponding abnormal EEG finding. p: p-value; ABNORMAL_EEG: abnormal EEG tracing; AGE_EEG: age at the first EEG recording; EEG_ED: epileptiform discharges; EEG_SLOW: slow abnormalities.
Based on the ADOS-CSS score, two participants showed minimal-to-no evidence of autistic features, 10 showed low levels, 91 showed moderate levels, and 31 showed high levels (see Table 7). Considering the whole cohort, an abnormal EEG and epileptiform discharges were less frequent in patients with moderate–severe ASD (ADOS-CSS score ≥ 5), while the opposite was observed when considering slow abnormalities; overall, the EEG findings did not show any association with ASD severity (see Table 8).
Table 7.
Study cohort classification based on ASD severity assessed with ADOS-CSS. ASD: autism spectrum disorder; ADOS-CSS: ADOS Calibrated Severity Score; n: number of participants.
Table 8.
Relationship between ADOS-CSS and abnormal EEG findings: 0 = indicates the absence of the corresponding abnormal EEG finding; 1 = indicates the presence of the corresponding abnormal EEG finding. f: frequency; ADOS-CSS: ADOS Calibrated Severity Score; ABNORMAL_EEG: abnormal EEG tracing; EEG_ED: epileptiform discharges; EEG_SLOW: slow abnormalities.
With regard to the clinical assessments, as shown in Table S3 (Supplementary File S1), some weak or at most moderate correlations were found between the ADOS-CSS score and the PIQ and CBCL scores, with some differences between the sex subgroups.
Equally, we observed no statistically significant correlation between any of the measured psychometric parameters and the EEG findings (normal/abnormal EEG, any subtype of EEG abnormalities, the location of EEG abnormalities). However, we observed that children with an abnormal EEG tended to have a lower PIQ (mean value = 88.00 vs. 98.00, p = 0.059, Cohen’s d = 0.389), as well as slightly worse total CBCL scores (mean value = 59.30 vs. 56.95, p = 0.182, Cohen’s d = 0.227) and CBCL-ED scores (mean value = 171.77 vs. 167.78, p = 0.154, Cohen’s d = 0.244). Analyzing the type of EEG abnormalities, we found these trends were driven by epileptiform discharges. In fact, patients with epileptiform abnormalities showed a lower PIQ (mean value = 86.44 vs. 92.73, p = 0.190, Cohen’s d = 0.272) and slightly worse CBCL-ED scores (mean value = 171.96 vs. 168.04, p = 0.159, Cohen’s d = 0.239), while their scores at the externalizing problems CBCL were higher (mean value = 55.68 vs. 53.87, p = 0.197, Cohen’s d = 0.219). Conversely, we found no notable association with slow or fast abnormalities. The analysis of the individual female and male subgroups revealed results that were quite in line with those just described, albeit with some differences (see Table 9):
Table 9.
Correlation between psychometric parameters and EEG findings (# indicates potential trends): 0 = indicates the absence of the corresponding abnormal EEG finding; 1 = indicates the presence of the corresponding abnormal EEG finding. ABNORMAL_EEG: abnormal EEG tracing; EEG_ED: epileptiform discharges; EEG_SLOW: slow abnormalities; PIQ: Performance Intelligence Quotient; CBCL_INT: Child Behavior Checklist—Internalizing Problems Scale; CBCL_EXT: Child Behavior Checklist—Externalizing Problems Scale; CBCL_TOTAL: Child Behavior Checklist—Total Problems Scale; CBCL_ED: Child Behavior Checklist—Emotional Dysregulation Profile.
The ADOS-CSS score and psychometric scores were found to be quite homogeneous in the two subgroups (see Table 10), with only the PIQ being significantly lower among females (mean value = 75.33 vs. 94.54, p = 0.004, Cohen’s d = 0.790).
Table 10.
Comparison between female and male subgroup in relation to ADOS-CSS score and psychometric scores (* indicates statistically significant results): F = stands for female; M = stands for male. ADOS-CSS: ADOS Calibrated Severity Score; PIQ: Performance Intelligence Quotient; CBCL_INT: Child Behavior Checklist—Internalizing Problems Scale; CBCL_EXT: Child Behavior Checklist—Externalizing Problems Scale; CBCL_TOTAL: Child Behavior Checklist—Total Problems Scale; CBCL_ED: Child Behavior Checklist—Emotional Dysregulation Profile.
Furthermore, we separately analyzed the effects of the EEG findings in wakefulness and sleep on the measured psychometric parameters. No statistically significant correlation was found for the EEG abnormalities during wakefulness. Instead, we disclosed that patients with an abnormal EEG during sleep still tended to have lower scores for the PIQ (mean value = 85.01 vs. 93.46, p = 0.100, Cohen’s d = 0.357), but this tendency was not confirmed in the subgroups with epileptiform discharges (mean value = 86.70 vs. 91.31, p = 0.388, Cohen’s d = 0.191) and slow abnormalities (mean value = 83.38 vs. 90.57, p = 0.333, Cohen’s d = 0.297). By repeating these analyses separately for the two sexes (see Table 11), only in females did we observe a significantly lower PIQ in the event of an abnormal EEG during sleep (mean value = 61.33 vs. 90.45, p = 0.013, Cohen’s d = 1.127) and a tendency towards a lower PIQ in the presence of epileptiform discharges during sleep (mean value = 64.36 vs. 85.25, p = 0.088, Cohen’s d = 0.747).
Table 11.
Correlation between mean PIQ Score and EEG findings during sleep (* indicates statistically significant results; # indicates potential trends): 0 = indicates the absence of the corresponding abnormal EEG finding; 1 = indicates the presence of the corresponding abnormal EEG finding. ABNORMAL_EEG_S: abnormal EEG tracing during sleep; PIQ: Performance Intelligence Quotient; EEG_ED_S: epileptiform discharges during sleep; EEG_SLOW_S: slow abnormalities during sleep.
Taking into consideration the location of EEG abnormalities (see Table 5), focal/multifocal epileptiform discharges were observed mostly in the frontal midline region (36.76%), while the posterior site was the least frequently affected (4.42%). On the other hand, slow abnormalities were mainly located in the temporal (50%) and posterior (37.50%) regions, with the frontal midline site affected only in three cases (12.50%). Since the subgroup of children with slow abnormalities was too small to be analyzed, we focused on the location of epileptiform abnormalities, which showed no correlation with any of the clinical scores (see Table 12). The results obtained in the general sample were also confirmed among males, while females were not evaluable due to the lack of participants.
Table 12.
Correlation between the clinical scores and the location of epileptiform abnormalities: the PIQ scores in the male subgroup and the entire female subsample were not evaluable due to a lack of participants. Patients showing both focal/multifocal and diffuse epileptiform discharges were excluded from the sample. F-M = stands for frontal midline region; T = stands for temporal region; P = stands for posterior region; D = stands for diffuse discharges. ADOS-CSS: ADOS Calibrated Severity Score; PIQ: Performance Intelligence Quotient; CBCL_INT: Child Behavior Checklist—Internalizing Problems Scale; CBCL_EXT: Child Behavior Checklist—Externalizing Problems Scale; CBCL_TOTAL: Child Behavior Checklist—Total Problems Scale; CBCL_ED: Child Behavior Checklist—Emotional Dysregulation Profile; NE: not evaluable.
Lastly, seizures were significantly associated with the presence of an abnormal EEG (p = 0.035, φ = 0.179) and especially of epileptiform discharges (p = 0.014, φ = 0.208); no association was found with slow abnormalities (p = 0.620, φ = 0.042). The corresponding contingency tables are shown in Table 2 (see C and D) and Table S2 (Supplementary File S1—see B). Temporal epileptiform discharges during sleep and midline and diffuse epileptiform discharges during both wakefulness and sleep were found in the two subjects who already had seizures at the time of their first evaluation at our center. Of the remaining 66 participants with subclinical epileptiform discharges, 6 (9.1%) developed seizures during follow-up; by contrast, only 1 (1.4%) of the 72 subjects without subclinical epileptiform discharges developed seizures later on in the study. Albeit with the limit of their low overall frequency, these data show that seizures occurred significantly more prevalently in those who already exhibited SEDs (p = 0.039, φ = 0.175).
4. Discussion
4.1. Relationship Between SEAs and Clinical Features
The main objective of this study is to analyze the relationship between the EEG findings and clinical characteristics of ASD preschoolers.
Focusing on the core symptoms of autism, the ADOS-CSS score is unevenly distributed within our sample, with a poor representation of milder cases (see Figure 1 and Table 7); in fact, the majority (91.04%) are placed in the medium–high severity range (ADOS-CSS score ≥ 5). This aspect can be explained by the fact that our population belongs to the user base of a tertiary care university hospital, where overall, more severe cases tend to be admitted; for this reason, the study population may not be representative of the full spectrum of ASD, thus limiting the generalizability of the results. Despite this potential bias, the composition of our sample, in terms of the severity of the autistic phenotype, is very similar to those of other studies concerning ASD, such as that by Pellicano et al. [112]. Contrary to what has been reported in several studies in the literature on autism [96,113,114,115], within our population an abnormal EEG pattern was found more frequently among participants with ADOS-CSS score ≤ 4, with the exception of the male subgroup (see Table 8). Despite this, no connection between the SEAs and the severity of autistic core symptoms seems to be present. This same conclusion was also reached by Anukirthiga et al. [115] and Milovanovic et al. [89], while other authors found a statistically significant association between EEG abnormalities and the severe autistic phenotype [96,113,114,116]. In particular, Yousef and colleagues [114] reported the presence of an interesting link between the severity of autistic symptoms and the location of EEG abnormalities (severe cases showed mostly bicentrotemporal, bitempofrontal, and frontotemporal abnormalities), which did not find any confirmation within our cohort (see Table 12).
Regarding concomitant psychopathological symptoms, the psychometric parameters we measured show a rather homogeneous distribution within the general sample (see Figure 1). When comparing the two sexes (see Table 10), however, PIQ was significantly lower among females (p = 0.004). In agreement with this result, several studies [117,118,119,120,121], especially older ones, have highlighted a lower full-scale IQ in ASD females, while some more recent investigations do not confirm these data [122,123,124]. Potentially, this significant difference in PIQ that we detected could be the result of the tendency to late diagnosis of ASD in females [5,125]. In fact, for some autistic females, having better cognitive abilities can lead to a delay in the diagnosis of ASD [120,126,127], a phenomenon that, in the case of young samples like ours, predisposes them to a recruitment bias in favor of patients with lower IQ scores. In the most recent scientific literature on autism [98], the relationship between ID/full-scale IQ and electrical brain activity has been the subject of great interest, providing conflicting results. Some studies [128] argue that there is no association between abnormal EEG patterns and ID, in agreement with Akhter [129]. The latter investigation, however, also observed a significantly higher frequency of EEG abnormalities in subjects with moderate–severe ID, in agreement with Nicotera et al. [96] and Anukirthiga et al. [115]. In the current study, PIQ was notably lower in case of abnormal EEG (p = 0.059), particularly in females (p = 0.099), and in SEDs (p = 0.190). This relationship would seem to be driven by sleep abnormalities (see Table 11), which would play a significant role both in the general sample and, above all, in the female subgroup, in which PIQ was significantly lower in the presence of abnormal EEG (p = 0.013).
As for CBCL scores, in the present study we did not detect any significant difference between sexes (see Table 10), in agreement with Pisula et al. [130] and Muratori et al. [131]. However, the psychopathological comorbidities of ASD are still the subject of heated debate. Contrary to our results, several authors have highlighted the greater prevalence of internalizing disorders in females [132,133,134,135,136] and externalizing disorders in males [134,135,137,138,139], while others have reported conflicting results [140,141,142,143,144]. From the point of view of their relationship with EEG findings, the most recent scientific literature has focused mainly on externalizing disorders, also in this case providing contrasting views, both in favor [91,96] and against [97,145] the presence of an association. Valvo et al. [146] and Capal et al. [95], referring to the CBCL scores, carried out a more complete investigation, which highlighted the absence of an association with the EEG for both internalizing and externalizing symptoms. Similarly, we also did not find any statistically significant associations in the present study, but we identified potential trends that appear to link SEAs to the scores of all four CBCL scales we considered (see Table 9). The strongest trend, in particular, concerns externalizing symptoms, which were more severe in females with an abnormal EEG (p = 0.052), despite remaining on average below the threshold. A weaker relationship was found for CBCL total and CBCL-ED scores (see Table 9), both higher in participants with EEG abnormalities, especially in females. Also, in this case, the mean scores remained sub-threshold, with the exception of the mean CBCL total score in females with SEAs (mean value = 61.00), which is considered clinically borderline by the CBCL summary scales, though remaining clinically non-significant according to the CBCL DSM-oriented scales. Considering the slow abnormalities and the SEDs separately, the latter were found to be associated, albeit poorly, with worse, but still subclinical, mean scores totalized in the externalizing symptoms and emotional regulation scales (see Table 9). The only trend involving internalizing disorders concerned slow abnormalities, which appeared weakly linked to averagely worse symptoms in males (p = 0.175); the mean score remained clinically non-significant, at most borderline according to the CBCL summary scales.
Although statistical significance was not reached in almost all cases, the PIQ and CBCL scores showed an overall fascinating association with EEG findings, which was completely absent, on the contrary, in the case of the ADOS-CSS score (see Table 8 and Table 9). Based on these results, which outline simple, albeit interesting, trends, the presence of SEAs seems to impact more on the cognitive, emotional, and behavioral problems associated with ASD, rather than on its core symptoms. The underlying mechanisms are potentially attributable to the impact that SEAs, especially SEDs, would have on neuroplasticity, but it remains complex to interpret why the effects would be more evident for comorbidities, rather than for autism itself. Further research is needed, as several items of evidence suggest a role for SEAs in the pathogenesis of ASD (see Section 4.3), but in view of these results it cannot be excluded that they may represent more an expression of the alterations of the neuronal circuits, rather than a concause. Given the frequent finding of EEG abnormalities even in non-autistic subjects with ADHD, aggressive behavior, or anxiety symptoms [147,148], at least in a subgroup of patients SEAs could play the role of a pathogenetic bridge between ASD, of which they could represent a consequence, and its comorbidities, towards which they could potentially act as a contributory cause.
4.2. Frequency of SEAs
Numerous authors have investigated the interesting relationship between ASD and subclinical EEG abnormalities, with conflicting findings [86,87,93,98]. In our study, SEAs were found in 55% of participants. Such a figure might be an underestimate, as the EEG traces of children with ASD may be burdened by a remarkable number of artifacts that limit the effective duration of the interpretable recording. Even though most of the abnormalities can already be detected during the first 20 min of recording, by simply reaching a duration of 40 min it is possible to increase the yield by 11% [98]. Moreover, obtaining a sleep recording in ASD may be cumbersome; 13 patients (8.57%) in our cohort did not fall asleep during the EEG test. This increases the probability of false negatives, since SEAs tend to occur more frequently during sleep, as formerly observed in young children with typical development [149] and as confirmed in young autistic individuals by our findings and those of other studies [91,93,96,150]. In support of this hypothesis, it is relevant to underline that only one participant of those with a waking-only EEG had an abnormal EEG tracing.
The literature on the relationship between autism and EEG tends to focus mainly on the middle childhood (6–11 years) and young teen (12–14 years) age groups [98], in some cases including adults too [91,95,96,146,151], while only a few papers have focused their attention on preschoolers [152,153]. Former studies have reported very heterogeneous figures of SEAs in autistic children (8–60.7%) [98], compared to which our results are shifted towards the upper end. This is potentially attributable to the reduced age of the participants at the time of the first EEG recording (range: 7.04–141.55 months), since the rate of SEAs tends to progressively decrease with age, especially towards adolescence/adulthood [154,155,156]. Confirming this trend, in our sample it was possible to find a significantly higher frequency of SEAs in the younger participants (see Table 6).
The M:F ratio in our population was 4.38:1, roughly in line with the rest of the scientific literature on autism (4:1) [2,9,157], while the most recent studies that have investigated the association between EEG findings and ASD showed an M:F ratio ranging between 1.3:1 and 5.6:1, with an average of 2.95:1 [98]. Considering only our participants with abnormal EEG, the M:F ratio increases (3.53:1), similarly to what is reported in other investigations [113,128,158]. Regardless of their small number, SEAs were more frequent in the female subgroup rather than in the male one (65.38% vs. 52.63%), in agreement with what has been reported by previous investigations [113,128,158]. However, this difference does not seem to have any statistical significance (p = 0.238), as also reported by other studies [113,114,158]. Given the contradictory nature of these results, it is reasonable to further investigate this aspect in order to systematically address a potential gender imbalance and to investigate the underlying pathophysiology [4,5,159].
4.3. Relationship Between SEDs and ASD Pathogenesis
Within our sample, subclinical epileptiform discharges were more frequent than slow abnormalities (see Table 1), in agreement with several other authors [83,90,91,160,161,162]. These data are quite interesting, since SEDs seem to have a greater impact on the cognitive processes of the autistic subject than slow abnormalities [97]. Although epileptiform discharges, even when subclinical, are generally considered a non-specific sign of cortical dysfunction, Santarone et al. [152] argue that in autism they may be considered a neurophysiological marker of disease. El Achkar and Spence [163] go further, as they hypothesize that SEDs could contribute to determining the autistic phenotype. According to some authors, in fact, epileptiform discharges would be significantly associated with an anomalous brain development during the first year of life [83,96].
Neuronal hypersynchrony could be involved in one of the most important hypotheses regarding the physiopathology of ASD, which postulates an alteration of the balance between excitatory and inhibitory neurotransmission as the protagonist [164,165]. In studies conducted on humans [166] and on animal models [167], epileptiform discharges, even of short duration, provided that they are recurrent, have been found to be able to induce both neuronal death and axonal sprouting, responsible for the genesis of aberrant circuits characterized by alterations in GABAergic transmission [168,169], and in the levels of cerebral parvalbumin [170,171]. These anomalies are the cause of an excitation/inhibition imbalance, which may contribute to the neurobiology of autism [66,67], of some of its comorbidities (i.e., depression and anxiety) and of epileptic seizures [172].
In our sample, seizures were poorly represented, yet significantly associated with SEAs (p = 0.035), highlighting a particularly strong link with SEDs (p = 0.014), which were found to be predominantly focal and multifocal, both in the whole population (p = 0.010) and in the male subgroup (p = 0.013). Similar data, although in the absence of statistical significance, have been previously reported in some [95,96,97,158] but not in other [115,129,152] studies. The focal/multifocal distribution of SEDs could be related to a dysfunction of scattered cerebral hubs rather than to an impairment of the whole brain. It is likely that different neurobiological phenomena promote various EEG features in ASD. An asymmetry of brain morphometry has formerly been reported [173,174,175,176], and it would be noteworthy to explore a relationship between this parameter and SEA distribution. From this point of view, in line with another important hypothesis, which conceives autism as a connectopathy [60,61,63,64], Donovan and Basson [177] hypothesized that ASD could be due to aberrations in the neuronal circuits of specific cortical and subcortical structures. In support of this, Postema et al. [178] and Sha et al. [179] highlighted the presence of an interhemispheric asymmetry in the cortical thickness of the frontal and temporal lobes, which could be attribute to underlying anomalies in neuronal connectivity [179]. These same regions were the most frequently involved by SEDs within our sample (see Table 5), variably in agreement with what has been described in many other studies in the literature [48,93,94,95,96,97,113,128,129,151,152,156,158,180,181,182], suggesting their possible role in the altered brain asymmetry observed in autism. Indeed, it is believed that an abnormal functioning of the frontal and temporal lobes is crucially implicated in the physiopathology of ASD [183,184,185,186,187,188,189].
Noteworthy is the fact that we found most EEG abnormalities during sleep (see Figure 3). Within the scientific literature, the idea that sleep is strictly connected to neuroplasticity is generally shared [190]; during sleep, in fact, it is believed that synapses are subjected to pruning and refinement processes, aimed at optimizing neuronal circuits [191]. A particular role seems to be played by the slow-wave activity (SWA) of non-rapid eye movement (NREM) sleep, as proposed in the synaptic homeostasis hypothesis [192,193,194]. Similarly, sleep spindles also seem to be involved in synapse consolidation [195,196]. Although memory represents, to date, the main function modulated by sleep [197], some authors believe that other cognitive functions may also be influenced by the typical brain activity of NREM sleep phases [198,199,200]. Given these assumptions, it is reasonable to hypothesize that the presence of frequent subclinical epileptiform discharges during sleep may interfere with brain connectivity. This effect would be expressed through a dual action of SEDs, both direct, by interfering themselves with synaptic plasticity [201], and indirect, by perturbing the SWA in the performance of its functions. Also, considering the notable frequency of sleep disorders in the autistic population [202], what has just been described could represent a further point of contact between SEDs and the pathogenesis of ASD, whose ambiguous relationship with sleep is still a matter of debate [98]. These considerations have clinical implications, as they suggest the usefulness of implementing the recording of an EEG tracing during sleep in the diagnostic work-up of autism spectrum disorders. As also shown by other studies [91,93,96,150], sleep tracings make it possible to increase the probability of identifying EEG abnormalities, especially through prolonged recordings [83,91], which could also be performed overnight in case of suspected concomitant sleep disorders.
In light of the potential role of epileptiform discharges in the physiopathology of ASD, several authors have analyzed the possibility of using anti-seizure medications (ASMs) to treat SEDs. During ASM therapy, in fact, SEDs tend to wane [93,203] and some have reported an improvement of the core symptoms [204,205] and behavioral comorbidities of autism [204] too. However, a disease-modifying effect of ASMs has never been demonstrated either in people with epilepsy or in those with ASD, and a pharmaceutical treatment should only be established after epilepsy sets in or in specific encephalopathy settings. A purely preventive treatment of ASD patients with abnormal EEG in the absence of seizures is not currently recommended and remains a highly controversial issue [86,206], with some authors [152] suggesting that it might be justifiable to consider ASMs in case the discharges occupy a significant proportion of NREM sleep in the presence of an arrest of neurocognitive development. Nevertheless, subclinical EEG abnormalities could be related to a different disease course: it has been proposed that the presence of subclinical EEG abnormalities in autistic preschoolers suggests a worse clinical development [97]. Prospective studies would be needed to carefully assess the role of EEG findings as biomarkers of prognosis. Considering the higher frequency of SEAs in younger subjects, it is desirable to continue research in this direction, since the demonstration of the existence of a possible pathogenic relationship between SEDs and autism could allow clinicians to stratify the patients and tailor their treatment more accurately.
4.4. Study Limitations
The population size (n = 140) was limited by the difficulty of finding ASD patients with at least one EEG tracing in a natural observational setting. In the general population, EEG in ASD is performed only after seizure onset, which occurs mostly during adolescence [30,207]. However, we often obtain an early EEG exam in newly diagnosed ASD, in order to have a more comprehensive assessment of the patient’s profile. Sharing our observations with other third-level centers could help increase the study population, with a net benefit on the power of statistical analysis [208]. At least a part of the trends that we found by analyzing the relationship between psychometric parameters and EEG could actually hide an actual statistical significance, which could potentially be revealed by repeating the analysis on a larger population. Larger samples are required to detect smaller effects [209] and to counteract the overestimation of the population effect size, which is a common occurrence in small samples [210]. On the other hand, using small cohorts makes it possible to limit bias and measurement errors, improving the overall quality of the data, which can be analyzed with greater care, thus potentially producing more truthful results [209]. In addition, a meta-analysis performed on several small studies that point in the same direction, rather than a single study conducted on a large sample, could lead to a more robust conclusion [209].
However, a further weakness of small samples, which has a significant weight in autism studies, is their poor ability to mitigate the effect of confounding factors [209]. When we analyzed our participants with epileptiform discharges, we were forced, for reasons of statistical power, to group together both those who actually only showed SEDs and those who showed both SEDs and slow abnormalities (see Figure 2). This issue predisposes the study to the risk of having analyzed a spurious correlation, since, in this context, slow abnormalities could have acted as a confounding factor. A similar argument can be made for patients with slow abnormalities (see Figure 2), in which, vice versa, epileptiform discharges could have acted as a confounding factor. For the same reasons, it was not possible to separately analyze the patients with EEG abnormalities exclusively in wakefulness, on the one hand, and those with EEG abnormalities exclusively in sleep, on the other (see Figure 3). To limit the effect of confounding factors, especially when numerous and difficult to control, it is preferable to use a large sample [209]; from this perspective, autism represents an emblematic case, being a complex disorder closely intertwined both pathogenetically and epidemiologically with numerous other neuropsychiatric conditions, often still subclinical or underdiagnosed at preschool age, but already able to influence the results. Although the aim of this study is not to demonstrate causal relationships, for interpretative purposes it is important to point out the weaknesses of the correlations we analyzed, especially in the female subgroup.
Two additional vulnerable points are represented by the tertiary care university hospital selection bias, which has already been exhaustively discussed (see Section 4.1), and the absence of a control group of typically developing children, which precludes the possibility of excluding that what was observed in autistic subjects might also be confirmed in the general population.
Despite these limitations, we strongly believe that the results presented in this manuscript provide important information on the relationship between ASD and electrical brain activity, which certainly need to be further explored using larger, deeply phenotyped samples.
5. Conclusions
The analysis of EEG features might represent a potentially important resource in the field of autism spectrum disorders.
Hopefully, the interesting relationship between autism and SEAs could constitute a valid future ally for ASD diagnosis, at least in a subgroup of patients. Our results did not highlight any association between EEG abnormalities and the core symptoms of autism. However, given their notable frequency in the autistic population [83,89,90,91,92,93,94,95], there might be a common underlying pathophysiological background. Our results showed that subclinical EEG abnormalities are frequent in younger children with ASD, suggesting that the age group between 3 and 5 years might be the most suitable for investigation of potential electroencephalographic biomarkers of ASD. Larger studies in this age range, with higher statistical power, could unveil hidden pure associations between the autistic phenotype and the type of EEG abnormalities. Moreover, more space within the samples should be dedicated to autistic females, typically penalized in terms of representation in the literature on autism.
The study of the relationship between SEAs and ASD, however, could also hide possible prognostic advantages, as our data show that EEG abnormalities, and SEDs in particular, seem to be associated with seizures and the development of cognitive and behavioral comorbidities. Given also the potential impact of sleep-related SEAs on neuroplasticity, an early analysis of the EEG tracing, especially during sleep, could make it possible to better frame the autistic patient in the future, potentially assisting the clinician in setting up a therapeutic plan to manage early possible complications of ASD.
Supplementary Materials
The following supporting information can be downloaded at: https://www.mdpi.com/article/10.3390/jcm14020529/s1, Supplementary File S1 includes: Table S1. Normality testing of the distribution of the quantitative variables analyzed in our cohort. Table S2: Contingency tables for χ2 tests regarding the relationship between slow abnormalities and both sex (see A) and seizures (see B). Table S3: Correlation analysis within the overall cohort and the two sex subcohorts. Figure S1: The distribution of the CBCL-EXT score, CBCL_INT score, and CBCL_ED score within the cohort.
Author Contributions
Conceptualization, S.C. and E.B.; methodology, E.B.; formal analysis, E.B. and L.F.; investigation, A.M. and R.T.; resources, A.M. and R.T.; data curation, A.R.F. and E.B.; writing—original draft preparation, L.F.; writing—review and editing, S.C. and E.B.; supervision, A.R.F. and R.T.; project administration, A.R.F. and E.B.; funding acquisition, S.C. All authors have read and agreed to the published version of the manuscript.
Funding
This work was partly supported by the Italian Ministry of Health, 5 x 1000 voluntary contributions and Ricerca Corrente (RC-2025).
Institutional Review Board Statement
This study was conducted in accordance with the Declaration of Helsinki and approved by the Regional Ethical Committee of Meyer Hospital (Florence, Italy), number 131/2024 (Approval Date: 19 July 2024).
Informed Consent Statement
Written informed consent has been obtained from the patients and/or caregivers to be included in the study and to publish this paper.
Data Availability Statement
The data presented in this study are available upon request from the corresponding author. The data are not publicly available due to privacy or ethical restrictions.
Acknowledgments
We would like to express our sincere gratitude to all the participants and their families.
Conflicts of Interest
The authors declare that they have no competing interests.
Abbreviations
| ABNORMAL_EEG | Abnormal EEG tracing |
| ADOS-2 | Autism Diagnostic Observation Schedule-2 |
| ADOS-CSS | ADOS Calibrated Severity Score |
| ADOS-G | Autism Diagnostic Observation Schedule-Generic |
| ASMs | Anti-seizure medications |
| APA | American Psychiatric Association |
| ASD | Autism spectrum disorder |
| CASP7 | Caspase-7 |
| CBCL | Child Behavior Checklist |
| CBCL 1½-5 | Child Behavior Checklist 1½-5 |
| CBCL-ED | Child Behavior Checklist—Emotional Dysregulation Profile |
| CBCL-EXT | Child Behavior Checklist—Externalizing Problems Scale |
| CBCL-INT | Child Behavior Checklist—Internalizing Problems Scale |
| CBCL-TOTAL | Child Behavior Checklist—Total Problems Scale |
| CHD5 | Chromodomain helicase DNA-binding protein 5 |
| CNTNAP2 | Contactin-associated protein 2 |
| CYFIP1 | Cytoplasmic FMRP-interacting protein 1 |
| D | Diffuse discharges |
| DR | Drowsiness |
| DSM-5 | Diagnostic and Statistical Manual of Mental Disorders, 5th Edition |
| DSM-IV-TR | Diagnostic and Statistical Manual of Mental Disorders, 4th Edition, Text Revision |
| EEG | Electroencephalogram |
| EEG_ED | Epileptiform discharges |
| EEG_FAST | Fast abnormalities |
| EEG_SLOW | Slow abnormalities |
| EMG | Electromyographic |
| F | Females |
| f | Frequency |
| F-M | Frontal midline brain region |
| Full-scale IQ | Full-scale intelligence quotient |
| HMGB1 | High mobility group box-1 protein |
| HV | Hyperventilation |
| ID | Intellectual disability |
| ILAE | International League Against Epilepsy |
| IPS | Intermittent photic stimulation |
| IQ | Intelligence quotient |
| M | Males |
| MN | Mean |
| N | Number of observations |
| n | Number of participants |
| NDD | Neurodevelopmental disorder |
| NREM | Non-rapid eye movement |
| p | p value |
| P | Posterior brain region |
| PIQ | Performance intelligence quotient |
| S | Sleep |
| SD | Standard deviation |
| SEAs | Subclinical electroencephalographic abnormalities |
| SEDs | Subclinical epileptiform discharge |
| SWA | Slow-wave activity |
| T | Temporal brain region |
| W | Wakefulness |
| WPPSI-III | Wechsler Preschool and Primary Scale of Intelligence—Third Edition |
References
- American Psychiatric Association. Diagnostic and Statistical Manual of Mental Disorders, 5th ed.; Text Revision (DSM-5-TR); American Psychiatric Association Publishing: Washington, DC, USA, 2022. [Google Scholar] [CrossRef]
- Zeidan, J.; Fombonne, E.; Scorah, J.; Ibrahim, A.; Durkin, M.S.; Saxena, S.; Yusuf, A.; Shih, A.; Elsabbagh, M. Global prevalence of autism: A systematic review update. Autism Res. 2022, 15, 778–790. [Google Scholar] [CrossRef]
- Talantseva, O.I.; Romanova, R.S.; Shurdova, E.M.; Dolgorukova, T.A.; Sologub, P.S.; Titova, O.S.; Kleeva, D.F.; Grigorenko, E.L. The global prevalence of autism spectrum disorder: A three-level meta-analysis. Front. Psychiatry 2023, 14, 1071181. [Google Scholar] [CrossRef] [PubMed]
- McPartland, J.C.; Law, K.; Dawson, G.; Friedman, H. Encyclopedia of Mental Health; Academic Press: Cambridge, MA, USA, 2016. [Google Scholar]
- Corbett, B.A.; Schwartzman, J.M.; Libsack, E.J.; Muscatello, R.A.; Lerner, M.D.; Simmons, G.L.; White, S.W. Camouflaging in autism: Examining sex-based and compensatory models in social cognition and communication. Autism Res. 2021, 14, 127–142. [Google Scholar] [CrossRef] [PubMed]
- Werling, D.M. The role of sex-differential biology in risk for autism spectrum disorder. Biol. Sex Differ. 2016, 7, 58. [Google Scholar] [CrossRef] [PubMed]
- Elsabbagh, M. Linking risk factors and outcomes in autism spectrum disorder: Is there evidence for resilience? BMJ 2020, 368, l6880. [Google Scholar] [CrossRef]
- Lord, C.; Elsabbagh, M.; Baird, G.; Veenstra-Vanderweele, J. Autism spectrum disorder. Lancet 2018, 392, 508–520. [Google Scholar] [CrossRef]
- Maenner, M.J.; Warren, Z.; Williams, A.R.; Amoakohene, E.; Bakian, A.V.; Bilder, D.A.; Durkin, M.S.; Fitzgerald, R.T.; Furnier, S.M.; Hughes, M.M.; et al. Prevalence and Characteristics of Autism Spectrum Disorder Among Children Aged 8 Years—Autism and Developmental Disabilities Monitoring Network, 11 Sites, United States, 2020. MMWR Surveill. Summ. 2023, 72, 1–14. [Google Scholar] [CrossRef]
- Leachman, C.; Nichols, E.S.; Al-Saoud, S.; Duerden, E.G. Anxiety in children and adolescents with autism spectrum disorder: Behavioural phenotypes and environmental factors. BMC Psychol. 2024, 12, 534. [Google Scholar] [CrossRef] [PubMed]
- Kim, S.Y.; Lecavalier, L. Depression in young autistic people: A scoping review. Res. Autism Spectr. Disord. 2021, 88, 101841. [Google Scholar] [CrossRef]
- Baweja, R.; Waschbusch, D.A.; Mayes, S.D. Physical aggression toward others and self: Correlates in autism, attention-deficit/hyperactivity disorder, and population-based child samples. JAACAP Open 2023, 1, 274–283. [Google Scholar] [CrossRef]
- Rong, Y.; Yang, C.J.; Jin, Y.; Wang, Y. Prevalence of attention-deficit/hyperactivity disorder in individuals with autism spectrum disorder: A meta-analysis. Res. Autism Spectr. Disord. 2021, 83, 101759. [Google Scholar] [CrossRef]
- Kose, S.; Erermis, S.; Ozturk, O.; Ozbaran, B.; Demiral, N.; Bildik, T.; Aydin, C. Health related quality of life in children with autism spectrum disorders: The clinical and demographic related factors in Turkey. Res. Autism Spectr. Disord. 2013, 7, 213–220. [Google Scholar] [CrossRef]
- Estes, A.; Rivera, V.; Bryan, M.; Cali, P.; Dawson, G. Discrepancies Between Academic Achievement and Intellectual Ability in Higher-Functioning School-Aged Children with Autism Spectrum Disorder. J. Autism Dev. Disord. 2011, 41, 1044–1052. [Google Scholar] [CrossRef]
- Mayes, S.D.; Calhoun, S.L. Frequency of reading, math, and writing disabilities in children with clinical disorders. Learn. Individ. Differ. 2006, 16, 145–157. [Google Scholar] [CrossRef]
- Khachadourian, V.; Mahjani, B.; Sandin, S.; Kolevzon, A.; Buxbaum, J.D.; Reichenberg, A.; Janecka, M. Comorbidities in autism spectrum disorder and their etiologies. Transl. Psychiatry 2023, 13, 71. [Google Scholar] [CrossRef] [PubMed]
- Bhat, A.N. Is motor impairment in autism spectrum disorder distinct from developmental coordination disorder? A report from the SPARK study. Phys. Ther. 2020, 100, 633–644. [Google Scholar] [CrossRef]
- Kilroy, E.; Ring, P.; Hossain, A.; Nalbach, A.; Butera, C.; Harrison, L.; Jayashankar, A.; Vigen, C.; Aziz-Zadeh, L.; Cermak, S.A. Motor performance, praxis, and social skills in autism spectrum disorder and developmental coordination disorder. Autism Res. 2022, 15, 1649–1664. [Google Scholar] [CrossRef] [PubMed]
- Saito, M.; Hirota, T.; Sakamoto, Y.; Adachi, M.; Takahashi, M.; Osato-Kaneda, A.; Kim, Y.S.; Leventhal, B.; Shui, A.; Kato, S.; et al. Prevalence and cumulative incidence of autism spectrum disorders and the patterns of co-occurring neurodevelopmental disorders in a total population sample of 5-year-old children. Mol. Autism 2020, 11, 35. [Google Scholar] [CrossRef] [PubMed]
- Ming, X.; Brimacombe, M.; Wagner, G.C. Prevalence of motor impairment in autism spectrum disorders. Brain Dev. 2007, 29, 565–570. [Google Scholar] [CrossRef]
- Kielinen, M.; Rantala, H.; Timonen, E.; Linna, S.L.; Moilanen, I. Associated medical disorders and disabilities in children with autistic disorder: A population-based study. Autism 2004, 8, 49–60. [Google Scholar] [CrossRef]
- Takano, T.; Sawai, C. Early and Late-Onset Epilepsy in Autism: High Rate of Secondarily Generalized Seizures. Autism Open Access 2014, 4, 1–4. [Google Scholar] [CrossRef]
- Jokiranta, E.; Sourander, A.; Suominen, A.; Timonen-Soivio, L.; Brown, A.S.; Sillanpää, M. Epilepsy among children and adolescents with autism spectrum disorders: A population-based study. J. Autism Dev. Disord. 2014, 44, 2547–2557. [Google Scholar] [CrossRef] [PubMed]
- Kantzer, A.K.; Fernell, E.; Gillberg, C.; Miniscalco, C. Autism in community pre-schoolers: Developmental profiles. Res. Dev. Disabil. 2013, 34, 2900–2908. [Google Scholar] [CrossRef] [PubMed]
- Levy, S.E.; Giarelli, E.; Lee, L.C.; Schieve, L.A.; Kirby, R.S.; Cunniff, C.; Nicholas, J.; Reaven, J.; Rice, C.E. Autism spectrum disorder and co-occurring developmental, psychiatric, and medical conditions among children in multiple populations of the United States. J. Dev. Behav. Pediatr. 2010, 31, 267–275. [Google Scholar] [CrossRef]
- Surén, P.; Bakken, I.J.; Aase, H.; Chin, R.; Gunnes, N.; Lie, K.K.; Magnus, P.; Reichborn-Kjennerud, T.; Schjølberg, S.; Øyen, A.-S.; et al. Autism Spectrum Disorder, ADHD, Epilepsy, and Cerebral Palsy in Norwegian Children. Pediatrics 2012, 130, e152–e158. [Google Scholar] [CrossRef]
- Sæmundsen, E.; Magnússon, P.; Georgsdóttir, I.; Egilsson, E.; Rafnsson, V. Prevalence of autism spectrum disorders in an Icelandic birth cohort. BMJ Open 2013, 3, e002748. [Google Scholar] [CrossRef] [PubMed]
- Schendel, D.E.; Overgaard, M.; Christensen, J.; Hjort, L.; Jørgensen, M.; Vestergaard, M.; Parner, E.T. Association of Psychiatric and Neurologic Comorbidity With Mortality Among Persons With Autism Spectrum Disorder in a Danish Population. JAMA Pediatr. 2016, 170, 243–250. [Google Scholar] [CrossRef] [PubMed]
- Viscidi, E.W.; Triche, E.W.; Pescosolido, M.F.; McLean, R.L.; Joseph, R.M.; Spence, S.J.; Morrow, E.M. Clinical Characteristics of Children with Autism Spectrum Disorder and Co-Occurring Epilepsy. PLoS ONE 2013, 8, e67797. [Google Scholar] [CrossRef] [PubMed]
- Cederlund, M.; Gillberg, C. One hundred males with Asperger syndrome: A clinical study of background and associated factors. Dev. Med. Child Neurol. 2004, 46, 652–660. [Google Scholar] [CrossRef] [PubMed]
- Mouridsen, S.E.; Rich, B.; Isager, T. Epilepsy in individuals with a history of Asperger’s syndrome: A Danish nationwide register-based cohort study. J. Autism Dev. Disord. 2013, 43, 1308–1313. [Google Scholar] [CrossRef] [PubMed]
- Mouridsen, S.E.; Rich, B.; Isager, T. Epilepsy and other central nervous system diseases in atypical autism: A case control study. J. Neural Transm. 2011, 118, 621–627. [Google Scholar] [CrossRef] [PubMed]
- Giannotti, F.; Cortesi, F.; Cerquiglini, A.; Miraglia, D.; Vagnoni, C.; Sebastiani, T.; Bernabei, P. An investigation of sleep characteristics, EEG abnormalities and epilepsy in developmentally regressed and non-regressed children with autism. J. Autism Dev. Disord. 2008, 38, 1888–1897. [Google Scholar] [CrossRef]
- Aldinger, K.A.; Lane, C.J.; Veenstra-VanderWeele, J.; Levitt, P. Patterns of Risk for Multiple Co-Occurring Medical Conditions Replicate Across Distinct Cohorts of Children with Autism Spectrum Disorder. Autism Res. 2015, 8, 771–781. [Google Scholar] [CrossRef]
- Amiet, C.; Gourfinkel-An, I.; Laurent, C.; Bodeau, N.; Génin, B.; Leguern, E.; Tordjman, S.; Cohen, D. Does epilepsy in multiplex autism pedigrees define a different subgroup in terms of clinical characteristics and genetic risk? Mol. Autism 2013, 4, 47. [Google Scholar] [CrossRef] [PubMed]
- Icasiano, F.; Hewson, P.; Machet, P.; Cooper, C.; Marshall, A. Childhood autism spectrum disorder in the Barwon region: A community based study. J. Paediatr. Child Health 2004, 40, 696–701. [Google Scholar] [CrossRef]
- Ko, C.; Kim, N.; Kim, E.; Song, D.H.; Cheon, K.A. The effect of epilepsy on autistic symptom severity assessed by the social responsiveness scale in children with autism spectrum disorder. Behav. Brain Funct. 2016, 12, 20. [Google Scholar] [CrossRef]
- Kohane, I.S.; McMurry, A.; Weber, G.; MacFadden, D.; Rappaport, L.; Kunkel, L.; Bickel, J.; Wattanasin, N.; Spence, S.; Murphy, S.; et al. The Co-Morbidity Burden of Children and Young Adults with Autism Spectrum Disorders. PLoS ONE 2012, 7, e33224. [Google Scholar] [CrossRef] [PubMed]
- Liu, X.; Hubbard, J.A.; Fabes, R.A.; Adam, J.B. Sleep Disturbances and Correlates of Children with Autism Spectrum Disorders. Child Psychiatry Hum. Dev. 2006, 37, 179–191. [Google Scholar] [CrossRef]
- Nomura, Y.; Nagao, Y.; Kimura, K.; Hachimori, K.; Segawa, M. Epilepsy in autism: A pathophysiological consideration. Brain Dev. 2010, 32, 799–804. [Google Scholar] [CrossRef]
- Viscidi, E.W.; Johnson, A.L.; Spence, S.J.; Buka, S.L.; Morrow, E.M.; Triche, E.W. The association between epilepsy and autism symptoms and maladaptive behaviors in children with autism spectrum disorder. Autism 2014, 18, 996–1006. [Google Scholar] [CrossRef] [PubMed]
- Ming, X.; Brimacombe, M.; Chaaban, J.; Zimmerman-Bier, B.; Wagner, G.C. Autism Spectrum Disorders: Concurrent Clinical Disorders. J. Child Neurol. 2008, 23, 6–13. [Google Scholar] [CrossRef] [PubMed]
- Cuccaro, M.L.; Tuchman, R.F.; Hamilton, K.L.; Wright, H.H.; Abramson, R.K.; Haines, J.L.; Gilbert, J.R.; Pericak-Vance, M. Exploring the Relationship Between Autism Spectrum Disorder and Epilepsy Using Latent Class Cluster Analysis. J. Autism Dev. Disord. 2012, 42, 1630–1641. [Google Scholar] [CrossRef] [PubMed]
- Baghdadli, A.; Pascal, C.; Grisi, S.; Aussilloux, C. Risk factors for self-injurious behaviours among 222 young children with autistic disorders. J. Intellect. Disabil. Res. 2003, 47, 622–627. [Google Scholar] [CrossRef]
- Williams, E.; Thomas, K.; Sidebotham, H.; Emond, A. Prevalence and characteristics of autistic spectrum disorders in the ALSPAC cohort. Dev. Med. Child Neurol. 2008, 50, 672–677. [Google Scholar] [CrossRef]
- Baghdadli, A.; Assouline, B.; Sonié, S.; Pernon, E.; Darrou, C.; Michelon, C.; Picot, M.-C.; Aussilloux, C.; Pry, R. Developmental Trajectories of Adaptive Behaviors from Early Childhood to Adolescence in a Cohort of 152 Children with Autism Spectrum Disorders. J. Autism Dev. Disord. 2012, 42, 1314–1325. [Google Scholar] [CrossRef]
- Hughes, J.R.; Melyn, M. EEG and Seizures in Autistic Children and Adolescents: Further Findings with Therapeutic Implications. Clin. EEG Neurosci. 2005, 36, 15–20. [Google Scholar] [CrossRef]
- Burman, D.; Ramanujam, K.; Manzar, D.; Chattu, V.K.; Spence, D.W.; Zaki, N.F.W.; Jahrami, H.; Pandi-Perumal, S.R. Sleep and Autism Spectrum Disorder: A Comprehensive Review of Diagnosis, Markers, Interventions, and Treatments. Sleep Vigil. 2023, 7, 9–22. [Google Scholar] [CrossRef]
- Leader, G.; Abberton, C.; Cunningham, S.; Gilmartin, K.; Grudzien, M.; Higgins, E.; Joshi, L.; Whelan, S.; Mannion, A. Gastrointestinal symptoms in autism spectrum disorder: A systematic review. Nutrients 2022, 14, 1471. [Google Scholar] [CrossRef]
- Emberti Gialloreti, L.; Mazzone, L.; Benvenuto, A.; Fasano, A.; Alcon, A.G.; Kraneveld, A.; Moavero, R.; Raz, R.; Riccio, M.P.; Siracusano, M.; et al. Risk and Protective Environmental Factors Associated with Autism Spectrum Disorder: Evidence-Based Principles and Recommendations. J. Clin. Med. 2019, 8, 217. [Google Scholar] [CrossRef] [PubMed]
- National Institute of Health. About Autism. National Human Genome Research Institute; 2019. Available online: https://www.genome.gov/Genetic-Disorders/Autism (accessed on 5 May 2024).
- Won, H.; Mah, W.; Kim, E. Autism spectrum disorder causes, mechanisms, and treatments: Focus on neuronal synapses. Front. Mol. Neurosci. 2013, 6, 19. [Google Scholar] [CrossRef] [PubMed]
- Bozzi, Y.; Provenzano, G.; Casarosa, S. Neurobiological bases of autism-epilepsy comorbidity: A focus on excitation/inhibition imbalance. Eur. J. Neurosci. 2018, 47, 534–548. [Google Scholar] [CrossRef]
- Hussman, J.P. Suppressed GABAergic inhibition as a common factor in suspected etiologies of autism. J. Autism Dev. Disord. 2001, 31, 247–248. [Google Scholar] [CrossRef]
- Fatemi, S.H.; Reutiman, T.J.; Folsom, T.D.; Rooney, R.J.; Patel, D.H.; Thuras, P.D. mRNA and protein levels for GABAAalpha4, alpha5, beta1 and GABABR1 receptors are altered in brains from subjects with autism. J. Autism Dev. Disord. 2010, 40, 743–750. [Google Scholar] [CrossRef]
- Lawrence, Y.A.; Kemper, T.L.; Bauman, M.L.; Blatt, G.J. Parvalbumin-, calbindin-, and calretinin-immunoreactive hippocampal interneuron density in autism. Acta Neurol. Scand. 2010, 121, 99–108. [Google Scholar] [CrossRef]
- Tyzio, R.; Nardou, R.; Ferrari, D.C.; Tsintsadze, T.; Shahrokhi, A.; Eftekhari, S.; Khalilov, I.; Tsintsadze, V.; Brouchoud, C.; Chazal, G.; et al. Oxytocin-mediated GABA inhibition during delivery attenuates autism pathogenesis in rodent offspring. Science 2014, 343, 675–679. [Google Scholar] [CrossRef]
- Ben-Ari, Y. Is birth a critical period in the pathogenesis of autism spectrum disorders? Nat. Rev. Neurosci. 2015, 16, 498–505. [Google Scholar] [CrossRef]
- Hughes, J.R. Autism: The first firm finding = underconnectivity? Epilepsy Behav. 2007, 11, 20–24. [Google Scholar] [CrossRef]
- Noonan, S.K.; Haist, F.; Müller, R.A. Aberrant functional connectivity in autism: Evidence from low-frequency BOLD signal fluctuations. Brain Res. 2009, 1262, 48–63. [Google Scholar] [CrossRef]
- O’Reilly, C.; Lewis, J.D.; Elsabbagh, M. Is functional brain connectivity atypical in autism? A systematic review of EEG and MEG studies. PLoS ONE 2017, 12, e0175870. [Google Scholar] [CrossRef] [PubMed]
- Supekar, K.; Uddin, L.Q.; Khouzam, A.; Phillips, J.; Gaillard, W.D.; Kenworthy, L.E.; Yerys, B.E.; Vaidya, C.J.; Menon, V. Brain hyperconnectivity in children with autism and its links to social deficits. Cell Rep. 2013, 5, 738–747. [Google Scholar] [CrossRef] [PubMed]
- Belmonte, M.K.; Allen, G.; Beckel-Mitchener, A.; Boulanger, L.M.; Carper, R.A.; Webb, S.J. Autism and abnormal development of brain connectivity. J. Neurosci. 2004, 24, 9228–9231. [Google Scholar] [CrossRef] [PubMed]
- Ahring, P.K.; Liao, V.W.Y.; Gardella, E.; Johannesen, K.M.; Krey, I.; Selmer, K.K.; Stadheim, B.F.; Davis, H.; Peinhardt, C.; Koko, M.; et al. Gain-of-function variants in GABRD reveal a novel pathway for neurodevelopmental disorders and epilepsy. Brain 2022, 145, 1299–1309. [Google Scholar] [CrossRef]
- Lee, E.; Lee, J.; Kim, E. Excitation/Inhibition Imbalance in Animal Models of Autism Spectrum Disorders. Biol. Psychiatry 2017, 81, 838–847. [Google Scholar] [CrossRef]
- Filice, F.; Vörckel, K.J.; Sungur, A.Ö.; Wöhr, M.; Schwaller, B. Reduction in parvalbumin expression not loss of the parvalbumin-expressing GABA interneuron subpopulation in genetic parvalbumin and shank mouse models of autism. Mol. Brain 2016, 9, 10. [Google Scholar] [CrossRef]
- Nebel, R.A.; Zhao, D.; Pedrosa, E.; Kirschen, J.; Lachman, H.M.; Zheng, D.; Abrahams, B.S. Reduced CYFIP1 in Human Neural Progenitors Results in Dysregulation of Schizophrenia and Epilepsy Gene Networks. PLoS ONE 2016, 11, e0148039. [Google Scholar] [CrossRef]
- De Rubeis, S.; Pasciuto, E.; Li, K.W.; Fernández, E.; Di Marino, D.; Buzzi, A.; Ostroff, L.E.; Klann, E.; Zwartkruis, F.J.; Komiyama, N.H.; et al. CYFIP1 coordinates mRNA translation and cytoskeleton remodeling to ensure proper dendritic spine formation. Neuron 2013, 79, 1169–1182. [Google Scholar] [CrossRef] [PubMed]
- Parenti, I.; Lehalle, D.; Nava, C.; Torti, E.; Leitão, E.; Person, R.; Mizuguchi, T.; Matsumoto, N.; Kato, M.; Nakamura, K.; et al. Missense and truncating variants in CHD5 in a dominant neurodevelopmental disorder with intellectual disability, behavioral disturbances, and epilepsy. Hum. Genet. 2021, 140, 1109–1120. [Google Scholar] [CrossRef] [PubMed]
- Rodenas-Cuadrado, P.; Pietrafusa, N.; Francavilla, T.; La Neve, A.; Striano, P.; Vernes, S.C. Characterisation of CASPR2 deficiency disorder--a syndrome involving autism, epilepsy and language impairment. BMC Med. Genet. 2016, 17, 8. [Google Scholar] [CrossRef] [PubMed]
- Hughes, H.K.; Moreno, R.J.; Ashwood, P. Innate immune dysfunction and neuroinflammation in autism spectrum disorder (ASD). Brain Behav. Immun. 2023, 108, 245–254. [Google Scholar] [CrossRef] [PubMed]
- Dipasquale, V.; Cutrupi, M.C.; Colavita, L.; Manti, S.; Cuppari, C.; Salpietro, C. Neuroinflammation in autism spectrum disorders: Role of high mobility group box 1 protein. Int. J. Mol. Cell. Med. 2017, 6, 148. [Google Scholar] [PubMed]
- El-Ansary, A.; Al-Ayadhi, L. Neuroinflammation in autism spectrum disorders. J. Neuroinflamm. 2012, 9, 768. [Google Scholar] [CrossRef]
- Marín, O. Interneuron dysfunction in psychiatric disorders. Nat. Rev. Neurosci. 2012, 13, 107–120. [Google Scholar] [CrossRef] [PubMed]
- Jiang, X.; Lachance, M.; Rossignol, E. Involvement of cortical fast-spiking parvalbumin-positive basket cells in epilepsy. Prog. Brain Res. 2016, 226, 81–126. [Google Scholar] [CrossRef]
- Leonzino, M.; Busnelli, M.; Antonucci, F.; Verderio, C.; Mazzanti, M.; Chini, B. The Timing of the Excitatory-to-Inhibitory GABA Switch Is Regulated by the Oxytocin Receptor via KCC2. Cell Rep. 2016, 15, 96–103. [Google Scholar] [CrossRef] [PubMed]
- Sarlo, G.L.; Holton, K.F. Brain concentrations of glutamate and GABA in human epilepsy: A review. Seizure 2021, 91, 213–227. [Google Scholar] [CrossRef] [PubMed]
- Akyuz, E.; Polat, A.K.; Eroglu, E.; Kullu, I.; Angelopoulou, E.; Paudel, Y.N. Revisiting the role of neurotransmitters in epilepsy: An updated review. Life Sci. 2021, 265, 118826. [Google Scholar] [CrossRef] [PubMed]
- Medina-Ceja, L.; García-Barba, C. The glutamate receptor antagonists CNQX and MPEP decrease fast ripple events in rats treated with kainic acid. Neurosci. Lett. 2017, 655, 137–142. [Google Scholar] [CrossRef]
- Peret, A.; Christie, L.A.; Ouedraogo, D.W.; Gorlewicz, A.; Epsztein, J.; Mulle, C.; Crépel, V. Contribution of aberrant GluK2-containing kainate receptors to chronic seizures in temporal lobe epilepsy. Cell Rep. 2014, 8, 347–354. [Google Scholar] [CrossRef]
- Rogawski, M.A. AMPA receptors as a molecular target in epilepsy therapy. Acta Neurol. Scand. 2013, 127, 9–18. [Google Scholar] [CrossRef] [PubMed]
- Hrdlicka, M.; Komarek, V.; Propper, L.; Kulisek, R.; Zumrova, A.; Faladova, L.; Havlovicova, M.; Sedlacek, Z.; Blatny, M.; Urbanek, T. Not EEG abnormalities but epilepsy is associated with autistic regression and mental functioning in childhood autism. Eur. Child Adolesc. Psychiatry 2004, 13, 209–213. [Google Scholar] [CrossRef] [PubMed]
- Besag, F.M.C.; Vasey, M.J. Seizures and Epilepsy in Autism Spectrum Disorder. Child Adolesc. Psychiatr. Clin. N. Am. 2020, 29, 483–500. [Google Scholar] [CrossRef]
- Lee, B.H.; Smith, T.; Paciorkowski, A.R. Autism spectrum disorder and epilepsy: Disorders with a shared biology. Epilepsy Behav. 2015, 47, 191–201. [Google Scholar] [CrossRef]
- Spence, S.J.; Schneider, M.T. The role of epilepsy and epileptiform EEGs in autism spectrum disorders. Pediatr. Res. 2009, 65, 599–606. [Google Scholar] [CrossRef] [PubMed]
- Amiet, C.; Gourfinkel-An, I.; Bouzamondo, A.; Tordjman, S.; Baulac, M.; Lechat, P.; Mottron, L.; Cohen, D. Epilepsy in autism is associated with intellectual disability and gender: Evidence from a meta-analysis. Biol. Psychiatry 2008, 64, 577–582. [Google Scholar] [CrossRef] [PubMed]
- Britton, J.W.; Frey, L.C.; Hopp, J.L.; Korb, P.; Koubeissi, M.Z.; Lievens, W.E.; Pestana-Knight, E.M.; St. Louis, E.K. Electroencephalography (EEG): An Introductory Text and Atlas of Normal and Abnormal Findings in Adults, Children, and Infants; American Epilepsy Society: Chicago, IL, USA, 2016. [Google Scholar] [CrossRef]
- Milovanovic, M.; Radivojevic, V.; Radosavljev-Kircanski, J.; Grujicic, R.; Toskovic, O.; Aleksić-Hil, O.; Pejovic-Milovancevic, M. Epilepsy and interictal epileptiform activity in patients with autism spectrum disorders. Epilepsy Behav. 2019, 92, 45–52. [Google Scholar] [CrossRef]
- Akshoomoff, N.; Farid, N.; Courchesne, E.; Haas, R. Abnormalities on the neurological examination and EEG in young children with pervasive developmental disorders. J. Autism Dev. Disord. 2007, 37, 887–893. [Google Scholar] [CrossRef]
- Mulligan, C.K.; Trauner, D.A. Incidence and behavioral correlates of epileptiform abnormalities in autism spectrum disorders. J. Autism Dev. Disord. 2014, 44, 452–458. [Google Scholar] [CrossRef]
- Canitano, R.; Luchetti, A.; Zappella, M. Epilepsy, electroencephalographic abnormalities, and regression in children with autism. J. Child Neurol. 2005, 20, 27–31. [Google Scholar] [CrossRef]
- Chez, M.G.; Chang, M.; Krasne, V.; Coughlan, C.; Kominsky, M.; Schwartz, A. Frequency of epileptiform EEG abnormalities in a sequential screening of autistic patients with no known clinical epilepsy from 1996 to 2005. Epilepsy Behav. 2006, 8, 267–271. [Google Scholar] [CrossRef] [PubMed]
- Baird, G.; Robinson, R.O.; Boyd, S.; Charman, T. Sleep electroencephalograms in young children with autism with and without regression. Dev. Med. Child Neurol. 2006, 48, 604–608. [Google Scholar] [CrossRef] [PubMed]
- Capal, J.K.; Carosella, C.; Corbin, E.; Horn, P.S.; Caine, R.; Manning-Courtney, P. EEG endophenotypes in autism spectrum disorder. Epilepsy Behav. 2018, 88, 341–348. [Google Scholar] [CrossRef]
- Nicotera, A.G.; Hagerman, R.J.; Catania, M.V.; Buono, S.; Di Nuovo, S.; Liprino, E.M.; Stracuzzi, E.; Giusto, S.; Di Vita, G.; Musumeci, S.A. EEG Abnormalities as a Neurophysiological Biomarker of Severity in Autism Spectrum Disorder: A Pilot Cohort Study. J. Autism Dev. Disord. 2019, 49, 2337–2347. [Google Scholar] [CrossRef]
- Romero-González, M.; Navas-Sánchez, P.; Marín-Gámez, E.; Barbancho-Fernández, M.A.; Fernández-Sánchez, V.E.; Lara-Muñoz, J.P.; Guzmán-Parra, J. EEG abnormalities and clinical phenotypes in pre-school children with autism spectrum disorder. Epilepsy Behav. 2022, 129, 108619. [Google Scholar] [CrossRef] [PubMed]
- Bosetti, C.; Ferrini, L.; Ferrari, A.R.; Bartolini, E.; Calderoni, S. Children with Autism Spectrum Disorder and Abnormalities of Clinical EEG: A Qualitative Review. J. Clin. Med. 2024, 13, 279. [Google Scholar] [CrossRef] [PubMed]
- American Psychiatric Association. Diagnostic and Statistical Manual of Mental Disorders, 4th ed.; American Psychiatric Association Publishing: Washington, DC, USA, 2000. [Google Scholar] [CrossRef]
- Lord, C.; Risi, S.; Lambrecht, L.; Cook, J.E.H.; Leventhal, B.L.; DiLavore, P.C.; Pickles, A.; Rutter, M. The Autism Diagnostic Observation Schedule—Generic: A standard measure of social and communication deficits associated with the spectrum of autism. J. Autism Dev. Disord. 2000, 30, 205–223. [Google Scholar] [CrossRef]
- Lord, C.; Rutter, M.; DiLavore, P.; Risi, S.; Gotham, K.; Bishop, S. Autism Diagnostic Observation Schedule–2nd Edition (ADOS-2); WPS: Los Angeles, CA, USA, 2012. [Google Scholar]
- Sansavini, A.; Favilla, M.E.; Guasti, M.T.; Marini, A.; Millepiedi, S.; Di Martino, M.V.; Vecchi, S.; Battajon, N.; Bertolo, L.; Capirci, O.; et al. Developmental language disorder: Early predictors, age for the diagnosis, and diagnostic tools. A scoping review. Brain Sci. 2021, 11, 654. [Google Scholar] [CrossRef] [PubMed]
- Wolraich, M.L.; Hagan, J.F.; Allan, C.; Chan, E.; Davison, D.; Earls, M.; Evans, S.W.; Flinn, S.K.; Froehlich, T.; Frost, J.; et al. Clinical practice guideline for the diagnosis, evaluation, and treatment of attention-deficit/hyperactivity disorder in children and adolescents. Pediatrics 2019, 144, e20192528. Available online: https://publications.aap.org/pediatrics/article-abstract/144/4/e20192528/81590 (accessed on 19 December 2024). [CrossRef] [PubMed]
- Green, E.; Stroud, L.; Bloomfield, S.; Cronje, J.; Foxcroft, C.; Hurter, K.; Lane, H.; Marais, R.; Marx, C.; McAlinden, P. Griffiths Scales of Child Development, 3rd ed.; Part II: Administration and Scoring; Hogrefe: Oxford, UK, 2016. [Google Scholar] [CrossRef]
- Wechsler, D. Wechsler Preschool and Primary Scale of Intelligence—Fourth Edition; The Psychological Corporation: San Antonio, TX, USA, 2012. [Google Scholar]
- Achenbach, T.M. Manual for ASEBA School-Age Forms & Profiles; University of Vermont, Research Center for Children, Youth & Families: Burlington, VT, USA, 2001. [Google Scholar]
- Frigerio, A.; Cozzi, P.; Pastore, V.; Molteni, M.; Borgatti, R.; Montirosso, R. The evaluation of behavioral and emotional problems in a sample of Italian preschoolers using the Child Behavior Checklist and the Caregiver-Teacher Report Form. Infanz. E Adolesc. 2006, 5, 24–32. [Google Scholar]
- Peltola, M.E.; Leitinger, M.; Halford, J.J.; Vinayan, K.P.; Kobayashi, K.; Pressler, R.M.; Mindruta, I.; Mayor, L.C.; Lauronen, L.; Beniczky, S. Routine and sleep EEG: Minimum recording standards of the International Federation of Clinical Neurophysiology and the International League Against Epilepsy. Epilepsia 2023, 64, 602–618. [Google Scholar] [CrossRef] [PubMed]
- Ahdab, R.; Riachi, N. Reexamining the Added Value of Intermittent Photic Stimulation and Hyperventilation in Routine EEG Practice. Eur. Neurol. 2013, 71, 93–98. [Google Scholar] [CrossRef] [PubMed]
- Roupakiotis, S.C.; Gatzonis, S.D.; Triantafyllou, N.; Mantouvalos, V.; Chioni, A.; Zournas, C.; Siafakas, A. The usefulness of sleep and sleep deprivation as activating methods in electroencephalographic recording Contribution to a long-standing discussion. Seizure 2000, 9, 580–584. [Google Scholar] [CrossRef] [PubMed]
- Kane, N.; Acharya, J.; Beniczky, S.; Caboclo, L.; Finnigan, S.; Kaplan, P.W.; Shibasaki, H.; Pressler, R.; van Putten, M.J. A revised glossary of terms most commonly used by clinical electroencephalographers and updated proposal for the report format of the EEG findings. Revision 2017. Clin. Neurophysiol. Pract. 2017, 2, 170. [Google Scholar] [CrossRef]
- Pellicano, E.; Cribb, S.; Kenny, L. Patterns of Continuity and Change in the Psychosocial Outcomes of Young Autistic People: A Mixed-Methods Study. J. Abnorm. Child Psychol. 2020, 48, 301–313. [Google Scholar] [CrossRef]
- Kammoun, I.; BenTouhemi, D.; Hadjkacem, I.; Zouari, H.; Kamoun, F.; Khemekhem, K.; Ayadi, H.; Ellouze, E.; Hsairi, I.; Ghribi, F.; et al. Autism spectrum disorder and eeg specificity: A cross—Sectional tunisian study specificite de l’eeg dans le trouble du spectre autistique: Une etude transversale tunisienne. J. L’inf. Méd. Sfax 2022, 41, 41–47. [Google Scholar]
- Yousef, A.M.; Youssef, U.M.; El-Shabrawy, A.; Fattah, N.R.A.A.; Khedr, H. EEG abnormalities and severity of symptoms in non-epileptic autistic children. Egypt. J. Psychiatry 2017, 38, 59. [Google Scholar] [CrossRef]
- Anukirthiga, B.; Mishra, D.; Pandey, S.; Juneja, M.; Sharma, N. Prevalence of Epilepsy and Inter-Ictal Epileptiform Discharges in Children with Autism and Attention-Deficit Hyperactivity Disorder. Indian. J. Pediatr. 2019, 86, 897–902. [Google Scholar] [CrossRef]
- Emad, E.; Thabit, G. Association of Epileptiform Discharge and Autism Spectrum Disorder Severity in Children Attending the Outpatient Clinics, Child Welfare Teaching Hospital, Baghdad. J. Fac. Med. Baghdad 2023, 65, 266–271. [Google Scholar] [CrossRef]
- Wing, L. Sex ratios in early childhood autism and related conditions. Psychiatry Res. 1981, 5, 129–137. [Google Scholar] [CrossRef] [PubMed]
- Lord, C.; Schopler, E. Brief report: Differences in sex ratios in autism as a function of measured intelligence. J. Autism Dev. Disord. 1985, 15, 185–193. [Google Scholar] [CrossRef] [PubMed]
- Volkmar, F.R.; Szatmari, P.; Sparrow, S.S. Sex differences in pervasive developmental disorders. J. Autism Dev. Disord. 1993, 23, 579–591. [Google Scholar] [CrossRef] [PubMed]
- Giarelli, E.; Wiggins, L.D.; Rice, C.E.; Levy, S.E.; Kirby, R.S.; Pinto-Martin, J.; Mandell, D. Sex differences in the evaluation and diagnosis of autism spectrum disorders among children. Disabil. Health J. 2010, 3, 107–116. [Google Scholar] [CrossRef]
- Katusic, M.Z.; Myers, S.M.; Weaver, A.L.; Voigt, R.G. IQ in Autism Spectrum Disorder: A Population-Based Birth Cohort Study. Pediatrics 2021, 148, e2020049899. [Google Scholar] [CrossRef]
- Ryland, H.K.; Hysing, M.; Posserud, M.B.; Gillberg, C.; Lundervold, A.J. Autistic features in school age children: IQ and gender effects in a population-based cohort. Res. Autism Spectr. Disord. 2014, 8, 266–274. [Google Scholar] [CrossRef]
- de Giambattista, C.; Ventura, P.; Trerotoli, P.; Margari, F.; Margari, L. Sex Differences in Autism Spectrum Disorder: Focus on High Functioning Children and Adolescents. Front. Psychiatry 2021, 12, 539835. [Google Scholar] [CrossRef]
- Al-Mamari, W.; Idris, A.B.; Gabr, A.; Jalees, S.; Al-Jabri, M.; Abdulraheem, R.; Al-Mujaini, A.; Islam, M.M.; Al-Alawi, M.; Al-Adawi, S. Intellectual Profiles of Children with Autism Spectrum Disorder: Identification of verbal and nonverbal subscales predicting intellectual quotient. Sultan Qaboos Univ. Med. J. 2021, 21, 386–393. [Google Scholar] [CrossRef] [PubMed]
- Smith, J.V.; McQuaid, G.A.; Wallace, G.L.; Neuhaus, E.; Lopez, A.; Ratto, A.B.; Jack, A.; Khuu, A.; Webb, S.J.; Verbalis, A.; et al. Time is of the essence: Age at autism diagnosis, sex assigned at birth, and psychopathology. Autism 2024, 28, 2909–2922. [Google Scholar] [CrossRef] [PubMed]
- Begeer, S.; Mandell, D.; Wijnker-Holmes, B.; Venderbosch, S.; Rem, D.; Stekelenburg, F.; Koot, H.M. Sex Differences in the Timing of Identification Among Children and Adults with Autism Spectrum Disorders. J. Autism Dev. Disord. 2013, 43, 1151–1156. [Google Scholar] [CrossRef] [PubMed]
- Howe, Y.J.; O’Rourke, J.A.; Yatchmink, Y.; Viscidi, E.W.; Jones, R.N.; Morrow, E.M. Female Autism Phenotypes Investigated at Different Levels of Language and Developmental Abilities. J. Autism Dev. Disord. 2015, 45, 3537–3549. [Google Scholar] [CrossRef]
- Kanemura, H.; Sano, F.; Tando, T.; Sugita, K.; Aihara, M. Can EEG characteristics predict development of epilepsy in autistic children? Eur. J. Paediatr. Neurol. 2013, 17, 232–237. [Google Scholar] [CrossRef] [PubMed]
- Akhter, S.; Shefa, J.; Mannan, M. EEG changes and their relationship with intellectual disability in children with autism spectrum disorders in a tertiary care hospital. J. Int. Child Neurol. Assoc. 2021, 1. [Google Scholar] [CrossRef]
- Pisula, E.; Pudło, M.; Słowińska, M.; Kawa, R.; Strząska, M.; Banasiak, A.; Wolańczyk, T. Behavioral and emotional problems in high-functioning girls and boys with autism spectrum disorders: Parents’ reports and adolescents’ self-reports. Autism 2017, 21, 738–748. [Google Scholar] [CrossRef] [PubMed]
- Muratori, F.; Turi, M.; Prosperi, M.; Narzisi, A.; Valeri, G.; Guerrera, S.; Santocchi, E.; Apicella, F.; Lattarulo, C.; Calderoni, S.; et al. Parental Perspectives on Psychiatric Comorbidity in Preschoolers With Autism Spectrum Disorders Receiving Publicly Funded Mental Health Services. Front. Psychiatry 2019, 10, 107. [Google Scholar] [CrossRef] [PubMed]
- Oswald, T.M.; Winter-Messiers, M.A.; Gibson, B.; Schmidt, A.M.; Herr, C.M.; Solomon, M. Sex Differences in Internalizing Problems During Adolescence in Autism Spectrum Disorder. J. Autism Dev. Disord. 2016, 46, 624–636. [Google Scholar] [CrossRef]
- Hartley, S.L.; Sikora, D.M. Sex Differences in Autism Spectrum Disorder: An Examination of Developmental Functioning, Autistic Symptoms, and Coexisting Behavior Problems in Toddlers. J. Autism Dev. Disord. 2009, 39, 1715–1722. [Google Scholar] [CrossRef] [PubMed]
- Mandy, W.; Chilvers, R.; Chowdhury, U.; Salter, G.; Seigal, A.; Skuse, D. Sex Differences in Autism Spectrum Disorder: Evidence from a Large Sample of Children and Adolescents. J. Autism Dev. Disord. 2012, 42, 1304–1313. [Google Scholar] [CrossRef]
- Rynkiewicz, A.; Schuller, B.; Marchi, E.; Piana, S.; Camurri, A.; Lassalle, A.; Baron-Cohen, S. An investigation of the ‘female camouflage effect’ in autism using a computerized ADOS-2 and a test of sex/gender differences. Mol. Autism 2016, 7, 10. [Google Scholar] [CrossRef]
- Solomon, M.; Miller, M.; Taylor, S.L.; Hinshaw, S.P.; Carter, C.S. Autism Symptoms and Internalizing Psychopathology in Girls and Boys with Autism Spectrum Disorders. J. Autism Dev. Disord. 2012, 42, 48–59. [Google Scholar] [CrossRef] [PubMed]
- Hiller, R.M.; Young, R.L.; Weber, N. Sex Differences in Autism Spectrum Disorder based on DSM-5 Criteria: Evidence from Clinician and Teacher Reporting. J. Abnorm. Child Psychol. 2014, 42, 1381–1393. [Google Scholar] [CrossRef]
- May, T.; Cornish, K.; Rinehart, N.J. Gender Profiles of Behavioral Attention in Children With Autism Spectrum Disorder. J. Atten. Disord. 2012, 20, 627–635. [Google Scholar] [CrossRef] [PubMed]
- Salazar, F.; Baird, G.; Chandler, S.; Tseng, E.; O’sullivan, T.; Howlin, P.; Pickles, A.; Simonoff, E. Co-occurring Psychiatric Disorders in Preschool and Elementary School-Aged Children with Autism Spectrum Disorder. J. Autism Dev. Disord. 2015, 45, 2283–2294. [Google Scholar] [CrossRef] [PubMed]
- Hiller, R.M.; Young, R.L.; Weber, N. Sex differences in pre-diagnosis concerns for children later diagnosed with autism spectrum disorder. Autism 2016, 20, 75–84. [Google Scholar] [CrossRef]
- So, P.; Wierdsma, A.I.; van Boeijen, C.; Vermeiren, R.R.; Mulder, N.C. Gender differences between adolescents with autism in emergency psychiatry. Autism 2021, 25, 2331–2340. [Google Scholar] [CrossRef] [PubMed]
- Frazier, T.W.; Georgiades, S.; Bishop, S.L.; Hardan, A.Y. Behavioral and Cognitive Characteristics of Females and Males With Autism in the Simons Simplex Collection. J. Am. Acad. Child Adolesc. Psychiatry 2014, 53, 329–340.e3. [Google Scholar] [CrossRef] [PubMed]
- Holtmann, M.; Bölte, S.; Poustka, F. Autism spectrum disorders: Sex differences in autistic behaviour domains and coexisting psychopathology. Dev. Med. Child Neurol. 2007, 49, 361–366. [Google Scholar] [CrossRef] [PubMed]
- Prosperi, M.; Turi, M.; Guerrera, S.; Napoli, E.; Tancredi, R.; Igliozzi, R.; Apicella, F.; Valeri, G.; Lattarulo, C.; Gemma, A.; et al. Sex Differences in Autism Spectrum Disorder: An Investigation on Core Symptoms and Psychiatric Comorbidity in Preschoolers. Front. Integr. Neurosci. 2021, 14, 594082. [Google Scholar] [CrossRef] [PubMed]
- Hartley-McAndrew, M.; Weinstock, A. Autism Spectrum Disorder: Correlation between aberrant behaviors, EEG abnormalities and seizures. Neurol. Int. 2010, 2, e10. [Google Scholar] [CrossRef] [PubMed]
- Valvo, G.; Baldini, S.; Brachini, F.; Apicella, F.; Cosenza, A.; Ferrari, A.R.; Guerrini, R.; Muratori, F.; Romano, M.F.; Santorelli, F.M.; et al. Somatic Overgrowth Predisposes to Seizures in Autism Spectrum Disorders. PLoS ONE 2013, 8, e75015. [Google Scholar] [CrossRef]
- Li, Y.W.; Chen, H.J.; Hung, K.L. Electroencephalographic abnormalities in non-epileptic children with attention-deficit/hyperactivity disorder. Neuropsychiatry 2018, 8, 677–683. [Google Scholar]
- Boutros, N. Standard EEG in Personality and Anxiety Disorders. In Standard Electroencephalography in Clinical Psychiatry, 1st ed.; Boutros, N., Galderisi, S., Pogarell, O., Riggio, S., Eds.; Wiley: Hoboken, NJ, USA, 2011; pp. 133–146. [Google Scholar] [CrossRef]
- Eeg-Olofsson, O.; Petersén, I.; Selldén, U. The development of the electroencephalogram in normal children from the age of 1 through 15 years. Paroxysmal activity. Neuropadiatrie 1971, 2, 375–404. [Google Scholar] [CrossRef] [PubMed]
- Miskin, C.; Carvalho, K.S.; Valencia, I.; Legido, A.; Khurana, D.S. EEG Duration: The Long and the Short of It. J. Child Neurol. 2015, 30, 1767–1769. [Google Scholar] [CrossRef] [PubMed]
- Valvo, G.; Baldini, S.; Retico, A.; Rossi, G.; Tancredi, R.; Ferrari, A.R.; Calderoni, S.; Apicella, F.; Muratori, F.; Santorelli, F.M.; et al. Temporal lobe connects regression and macrocephaly to autism spectrum disorders. Eur. Child Adolesc. Psychiatry 2016, 25, 421–429. [Google Scholar] [CrossRef]
- Santarone, M.E.; Zambrano, S.; Zanotta, N.; Mani, E.; Minghetti, S.; Pozzi, M.; Villa, L.; Molteni, M.; Zucca, C. EEG Features in Autism Spectrum Disorder: A Retrospective Analysis in a Cohort of Preschool Children. Brain Sci. 2023, 13, 345. [Google Scholar] [CrossRef]
- Barbosa de Matos, M.; Nau, A.L.; Fezer, G.F.; Zeigelboim, B.S.; Liberalesso, P.B.N. Epilepsy and eeg abnormalities in children with autism spectrum disorder. J. Epilepsy Clin. Neurophysiol. 2015. Available online: http://files.bvs.br/upload/S/1676-2649/2015/v21n3/a5377.pdf (accessed on 6 November 2023).
- Parmeggiani, A.; Barcia, G.; Posar, A.; Raimondi, E.; Santucci, M.; Scaduto, M.C. Epilepsy and EEG paroxysmal abnormalities in autism spectrum disorders. Brain Dev. 2010, 32, 783–789. [Google Scholar] [CrossRef]
- Rossi, M.; Chatron, N.; Labalme, A.; Ville, D.; Carneiro, M.; Edery, P.; Portes, V.D.; Lemke, J.R.; Sanlaville, D.; Lesca, G. Novel homozygous missense variant of GRIN1 in two sibs with intellectual disability and autistic features without epilepsy. Eur. J. Hum. Genet. 2017, 25, 376–380. [Google Scholar] [CrossRef][Green Version]
- Sharma, V.; Saini, A.G.; Malhi, P.; Singhi, P. Epilepsy and EEG Abnormalities in Children with Autism Spectrum Disorders. Indian J. Pediatr. 2022, 89, 975–982. [Google Scholar] [CrossRef]
- Calderoni, S. Sex/gender differences in children with autism spectrum disorder: A brief overview on epidemiology, symptom profile, and neuroanatomy. J. Neurosci. Res. 2023, 101, 739–750. [Google Scholar] [CrossRef] [PubMed]
- Polat, İ.; Hız, A.S.; Yiş, U.; Ayanoğlu, M.; Okur, D.; Bayram, E.; Baykara, H.B. Epilepsy and Electroencephalographic Abnormalities in Children with Autistic Spectrum Disorder. J. Behcet Child. Hosp. 2022, 12, 107–115. [Google Scholar] [CrossRef]
- Werling, D.M.; Geschwind, D.H. Sex differences in autism spectrum disorders. Curr. Opin. Neurol. 2013, 26, 146. [Google Scholar] [CrossRef] [PubMed]
- McVicar, K.A.; Ballaban-Gil, K.; Rapin, I.; Moshé, S.L.; Shinnar, S. Epileptiform EEG abnormalities in children with language regression. Neurology 2005, 65, 129–131. [Google Scholar] [CrossRef] [PubMed]
- Gabis, L.; Pomeroy, J.; Andriola, M.R. Autism and epilepsy: Cause, consequence, comorbidity, or coincidence? Epilepsy Behav. 2005, 7, 652–656. [Google Scholar] [CrossRef] [PubMed]
- Kim, H.L.; Donnelly, J.H.; Tournay, A.E.; Book, T.M.; Filipek, P. Absence of Seizures Despite High Prevalence of Epileptiform EEG Abnormalities in Children with Autism Monitored in a Tertiary Care Center. Epilepsia 2006, 47, 394–398. [Google Scholar] [CrossRef] [PubMed]
- El Achkar, C.M.; Spence, S.J. Clinical characteristics of children and young adults with co-occurring autism spectrum disorder and epilepsy. Epilepsy Behav. 2015, 47, 183–190. [Google Scholar] [CrossRef] [PubMed]
- Rubenstein, J.L.R.; Merzenich, M.M. Model of autism: Increased ratio of excitation/inhibition in key neural systems. Genes Brain Behav. 2003, 2, 255–267. [Google Scholar] [CrossRef] [PubMed]
- Vignoli, A.; Fabio, R.A.; La Briola, F.; Giannatiempo, S.; Antonietti, A.; Maggiolini, S.; Canevini, M.P. Correlations between neurophysiological, behavioral, and cognitive function in Rett syndrome. Epilepsy Behav. 2010, 17, 489–496. [Google Scholar] [CrossRef] [PubMed]
- Schmeiser, B.; Zentner, J.; Prinz, M.; Brandt, A.; Freiman, T.M. Extent of mossy fiber sprouting in patients with mesiotemporal lobe epilepsy correlates with neuronal cell loss and granule cell dispersion. Epilepsy Res. 2017, 129, 51–58. [Google Scholar] [CrossRef]
- Stringer, J.L.; Agarwal, K.S.; Dure, L.S. Is cell death necessary for hippocampal mossy fiber sprouting? Epilepsy Res. 1997, 27, 67–76. [Google Scholar] [CrossRef]
- Jarero-Basulto, J.J.; Gasca-Martínez, Y.; Rivera-Cervantes, M.C.; Ureña-Guerrero, M.E.; Feria-Velasco, A.I.; Beas-Zarate, C. Interactions Between Epilepsy and Plasticity. Pharmaceuticals 2018, 11, 17. [Google Scholar] [CrossRef]
- McNamara, J.O.; Huang, Y.Z.; Leonard, A.S. Molecular signaling mechanisms underlying epileptogenesis. Sci. STKE 2006, 2006, re12. [Google Scholar] [CrossRef] [PubMed]
- Fairless, R.; Williams, S.K.; Diem, R. Calcium-Binding Proteins as Determinants of Central Nervous System Neuronal Vulnerability to Disease. Int. J. Mol. Sci. 2019, 20, 2146. [Google Scholar] [CrossRef] [PubMed]
- Vizi, S.; Bagosi, A.; Krisztin-Péva, B.; Gulya, K.; Mihály, A. Repeated 4-aminopyridine seizures reduce parvalbumin content in the medial mammillary nucleus of the rat brain. Brain Res. Mol. Brain Res. 2004, 131, 110–118. [Google Scholar] [CrossRef]
- Godoy, L.D.; Prizon, T.; Rossignoli, M.T.; Leite, J.P.; Liberato, J.L. Parvalbumin Role in Epilepsy and Psychiatric Comorbidities: From Mechanism to Intervention. Front. Integr. Neurosci. 2022, 16, 765324. [Google Scholar] [CrossRef] [PubMed]
- Herbert, M.R.; Harris, G.J.; Adrien, K.T.; Ziegler, D.A.; Makris, N.; Kennedy, D.N.; Lange, N.T.; Chabris, C.F.; Bakardjiev, A.; Hodgson, J.; et al. Abnormal asymmetry in language association cortex in autism. Ann. Neurol. 2002, 52, 588–596. [Google Scholar] [CrossRef] [PubMed]
- Dougherty, C.C.; Evans, D.W.; Katuwal, G.J.; Michael, A.M. Asymmetry of fusiform structure in autism spectrum disorder: Trajectory and association with symptom severity. Mol. Autism 2016, 7, 28. [Google Scholar] [CrossRef]
- Floris, D.L.; Wolfers, T.; Zabihi, M.; Holz, N.E.; Zwiers, M.P.; Charman, T.; Tillmann, J.; Ecker, C.; Dell’Acqua, F.; Banaschewski, T.; et al. Atypical brain asymmetry in autism—A candidate for clinically meaningful stratification. Biol. Psychiatry Cogn. Neurosci. Neuroimaging 2021, 6, 802–812. [Google Scholar] [CrossRef] [PubMed]
- Yoo, S.; Jang, Y.; Hong, S.J.; Park, H.; Valk, S.L.; Bernhardt, B.C.; Park, B.-Y. Whole-brain structural connectome asymmetry in autism. NeuroImage 2024, 288, 120534. [Google Scholar] [CrossRef] [PubMed]
- Donovan, A.P.A.; Basson, M.A. The neuroanatomy of autism—A developmental perspective. J. Anat. 2017, 230, 4–15. [Google Scholar] [CrossRef] [PubMed]
- Postema, M.C.; van Rooij, D.; Anagnostou, E.; Arango, C.; Auzias, G.; Behrmann, M.; Filho, G.B.; Calderoni, S.; Calvo, R.; Daly, E.; et al. Altered structural brain asymmetry in autism spectrum disorder in a study of 54 datasets. Nat. Commun. 2019, 10, 4958. [Google Scholar] [CrossRef]
- Sha, Z.; van Rooij, D.; Anagnostou, E.; Arango, C.; Auzias, G.; Behrmann, M.; Bernhardt, B.; Bolte, S.; Busatto, G.F.; Calderoni, S.; et al. Subtly altered topological asymmetry of brain structural covariance networks in autism spectrum disorder across 43 datasets from the ENIGMA consortium. Mol. Psychiatry 2022, 27, 2114–2125. [Google Scholar] [CrossRef] [PubMed]
- Hara, H. Autism and epilepsy: A retrospective follow-up study. Brain Dev. 2007, 29, 486–490. [Google Scholar] [CrossRef]
- Yasuhara, A. Correlation between EEG abnormalities and symptoms of autism spectrum disorder (ASD). Brain Dev. 2010, 32, 791–798. [Google Scholar] [CrossRef]
- Rossi, P.G.; Posar, A.; Parmeggiani, A. Epilepsy in adolescents and young adults with autistic disorder. Brain Dev. 2000, 22, 102–106. [Google Scholar] [CrossRef] [PubMed]
- Gendry Meresse, I.; Zilbovicius, M.; Boddaert, N.; Robel, L.; Philippe, A.; Sfaello, I.; Laurier, L.; Brunelle, F.; Samson, Y.; Mouren, M.-C.; et al. Autism severity and temporal lobe functional abnormalities. Ann. Neurol. 2005, 58, 466–469. [Google Scholar] [CrossRef] [PubMed]
- Salmond, C.H.; Ashburner, J.; Connelly, A.; Friston, K.J.; Gadian, D.G.; Vargha-Khadem, F. The role of the medial temporal lobe in autistic spectrum disorders. Eur. J. Neurosci. 2005, 22, 764–772. [Google Scholar] [CrossRef] [PubMed]
- Schumann, C.M.; Hamstra, J.; Goodlin-Jones, B.L.; Lotspeich, L.J.; Kwon, H.; Buonocore, M.H.; Lammers, C.R.; Reiss, A.L.; Amaral, D.G. The amygdala is enlarged in children but not adolescents with autism; the hippocampus is enlarged at all ages. J. Neurosci. 2004, 24, 6392–6401. [Google Scholar] [CrossRef]
- Margaret, L.; Bauman, M.D.; Thomas, L.; Kemper, M.D. The Neurobiology of Autism; Johns Hopkins University Press: Baltimore, MD, USA, 2006. [Google Scholar] [CrossRef]
- Damasio, A.R.; Maurer, R.G. A neurological model for childhood autism. Arch. Neurol. 1978, 35, 777–786. [Google Scholar] [CrossRef] [PubMed]
- Ozonoff, S. Executive functions in autism. In Learning and Cognition in Autism; Current Issues in Autism; Plenum Press: New York, NY, USA, 1995; pp. 199–219. [Google Scholar] [CrossRef]
- Mundy, P. Annotation: The neural basis of social impairments in autism: The role of the dorsal medial-frontal cortex and anterior cingulate system. J. Child Psychol. Psychiatry 2003, 44, 793–809. [Google Scholar] [CrossRef]
- Gorgoni, M.; D′Atri, A.; Lauri, G.; Rossini, P.M.; Ferlazzo, F.; De Gennaro, L. Is Sleep Essential for Neural Plasticity in Humans, and How Does It Affect Motor and Cognitive Recovery? Neural Plast. 2013, 2013, 103949. [Google Scholar] [CrossRef]
- Wang, G.; Grone, B.; Colas, D.; Appelbaum, L.; Mourrain, P. Synaptic plasticity in sleep: Learning, homeostasis and disease. Trends Neurosci. 2011, 34, 452–463. [Google Scholar] [CrossRef]
- Tononi, G.; Cirelli, C. Sleep and synaptic homeostasis: A hypothesis. Brain Res. Bull. 2003, 62, 143–150. [Google Scholar] [CrossRef]
- Tononi, G.; Cirelli, C. Sleep function and synaptic homeostasis. Sleep Med. Rev. 2006, 10, 49–62. [Google Scholar] [CrossRef]
- Tononi, G. Slow Wave Homeostasis and Synaptic Plasticity. J. Clin. Sleep Med. 2009, 5 (Suppl. 2), S16–S19. [Google Scholar] [CrossRef]
- Marshall, L.; Helgadóttir, H.; Mölle, M.; Born, J. Boosting slow oscillations during sleep potentiates memory. Nature 2006, 444, 610–613. [Google Scholar] [CrossRef] [PubMed]
- Ngo, H.V.V.; Martinetz, T.; Born, J.; Mölle, M. Auditory Closed-Loop Stimulation of the Sleep Slow Oscillation Enhances Memory. Neuron 2013, 78, 545–553. [Google Scholar] [CrossRef]
- Miyamoto, D.; Hirai, D.; Murayama, M. The roles of cortical slow waves in synaptic plasticity and memory consolidation. Front. Neural Circuits 2017, 11, 92. [Google Scholar] [CrossRef]
- Sanchez-Vives, M.V.; Mattia, M. Slow wave activity as the default mode of the cerebral cortex. Arch. Ital. Biol. 2014, 152, 147–155. [Google Scholar]
- Wilckens, K.A.; Hall, M.H.; Nebes, R.D.; Monk, T.H.; Buysse, D.J. Changes in Cognitive Performance Are Associated with Changes in Sleep in Older Adults with Insomnia. Behav. Sleep Med. 2016, 14, 295–310. [Google Scholar] [CrossRef] [PubMed]
- Wilckens, K.A.; Ferrarelli, F.; Walker, M.P.; Buysse, D.J. Slow-wave activity enhancement to improve cognition. Trends Neurosci. 2018, 41, 470–482. [Google Scholar] [CrossRef] [PubMed]
- Xu, Y.; Wang, Y.; Xu, F.; Li, Y.; Sun, J.; Niu, K.; Wang, P.; Li, Y.; Zhang, K.; Wu, D.; et al. Impact of interictal epileptiform discharges on brain network in self-limited epilepsy with centrotemporal spikes: A magnetoencephalography study. Brain Behav. 2023, 13, e3038. [Google Scholar] [CrossRef] [PubMed]
- Cortesi, F.; Giannotti, F.; Ivanenko, A.; Johnson, K. Sleep in children with autistic spectrum disorder. Sleep Med. 2010, 11, 659–664. [Google Scholar] [CrossRef] [PubMed]
- Wang, M.; Jiang, L.; Tang, X. Levetiracetam is associated with decrease in subclinical epileptiform discharges and improved cognitive functions in pediatric patients with autism spectrum disorder. Neuropsychiatr. Dis. Treat. 2017, 13, 2321–2326. [Google Scholar] [CrossRef] [PubMed]
- Hollander, E.; Dolgoff-Kaspar, R.; Cartwright, C.; Novotny, S. An Open Trial of Divalproex Sodium in Autism Spectrum Disorders. J. Clin. Psychiatry 2001, 62, 13438. [Google Scholar] [CrossRef]
- Plioplys, A.V. Autism: Electroencephalogram Abnormalities and Clinical Improvement With Valproic Acid. Arch. Pediatr. Adolesc. Med. 1994, 148, 220–222. [Google Scholar] [CrossRef]
- Precenzano, F.; Parisi, L.; Lanzara, V.; Vetri, L.; Operto, F.F.; Pastorino, G.M.G.; Ruberto, M.; Messina, G.; Risoleo, M.C.; Santoro, C.; et al. Electroencephalographic Abnormalities in Autism Spectrum Disorder: Characteristics and Therapeutic Implications. Medicina 2020, 56, 419. [Google Scholar] [CrossRef] [PubMed]
- Deykin, E.Y.; MacMahon, B. The incidence of seizures among children with autistic symptoms. Am. J. Psychiatry 1979, 136, 1310–1312. [Google Scholar] [CrossRef]
- Button, K.S.; Ioannidis, J.P.A.; Mokrysz, C.; Nosek, B.A.; Flint, J.; Robinson, E.S.J.; Munafò, M.R. Power failure: Why small sample size undermines the reliability of neuroscience. Nat. Rev. Neurosci. 2013, 14, 365–376. [Google Scholar] [CrossRef] [PubMed]
- Indrayan, A.; Mishra, A. The importance of small samples in medical research. J. Postgrad. Med. 2021, 67, 219–223. [Google Scholar] [CrossRef] [PubMed]
- Fritz, C.O.; Morris, P.E.; Richler, J.J. Effect size estimates: Current use, calculations, and interpretation. J. Exp. Psychol. Gen. 2012, 141, 2–18. [Google Scholar] [CrossRef]


Disclaimer/Publisher’s Note: The statements, opinions and data contained in all publications are solely those of the individual author(s) and contributor(s) and not of MDPI and/or the editor(s). MDPI and/or the editor(s) disclaim responsibility for any injury to people or property resulting from any ideas, methods, instructions or products referred to in the content. |
© 2025 by the authors. Licensee MDPI, Basel, Switzerland. This article is an open access article distributed under the terms and conditions of the Creative Commons Attribution (CC BY) license (https://creativecommons.org/licenses/by/4.0/).