
Low-Density Lipoprotein Subfraction Phenotype Is Associated with Epicardial Adipose Tissue Volume in Type 2 Diabetes

 , , , , , ,
  ,
,  , and
, and 
Abstract
1. Introduction
2. Materials and Methods
2.1. Study Design, Setting and Subjects’ Characteristics
2.2. Image Analysis
2.3. Biochemical Analysis
2.4. Lipoprotein Isolation and Composition
2.5. Lipoprotein Functional Assays
2.5.1. Electronegative LDL
2.5.2. LDL Susceptibility to Aggregation
2.5.3. LDL and HDL Susceptibility to Oxidation
2.5.4. PAF-AH Activity
2.5.5. LDL Size and HDL Subfraction
2.6. Statistical Analysis
3. Results
3.1. Clinical Characteristics and Biochemical Profiles of T2DM Patients and Healthy Controls
3.2. Lipid Profile and Apolipoproteins in Plasma
3.3. HF Biomarkers
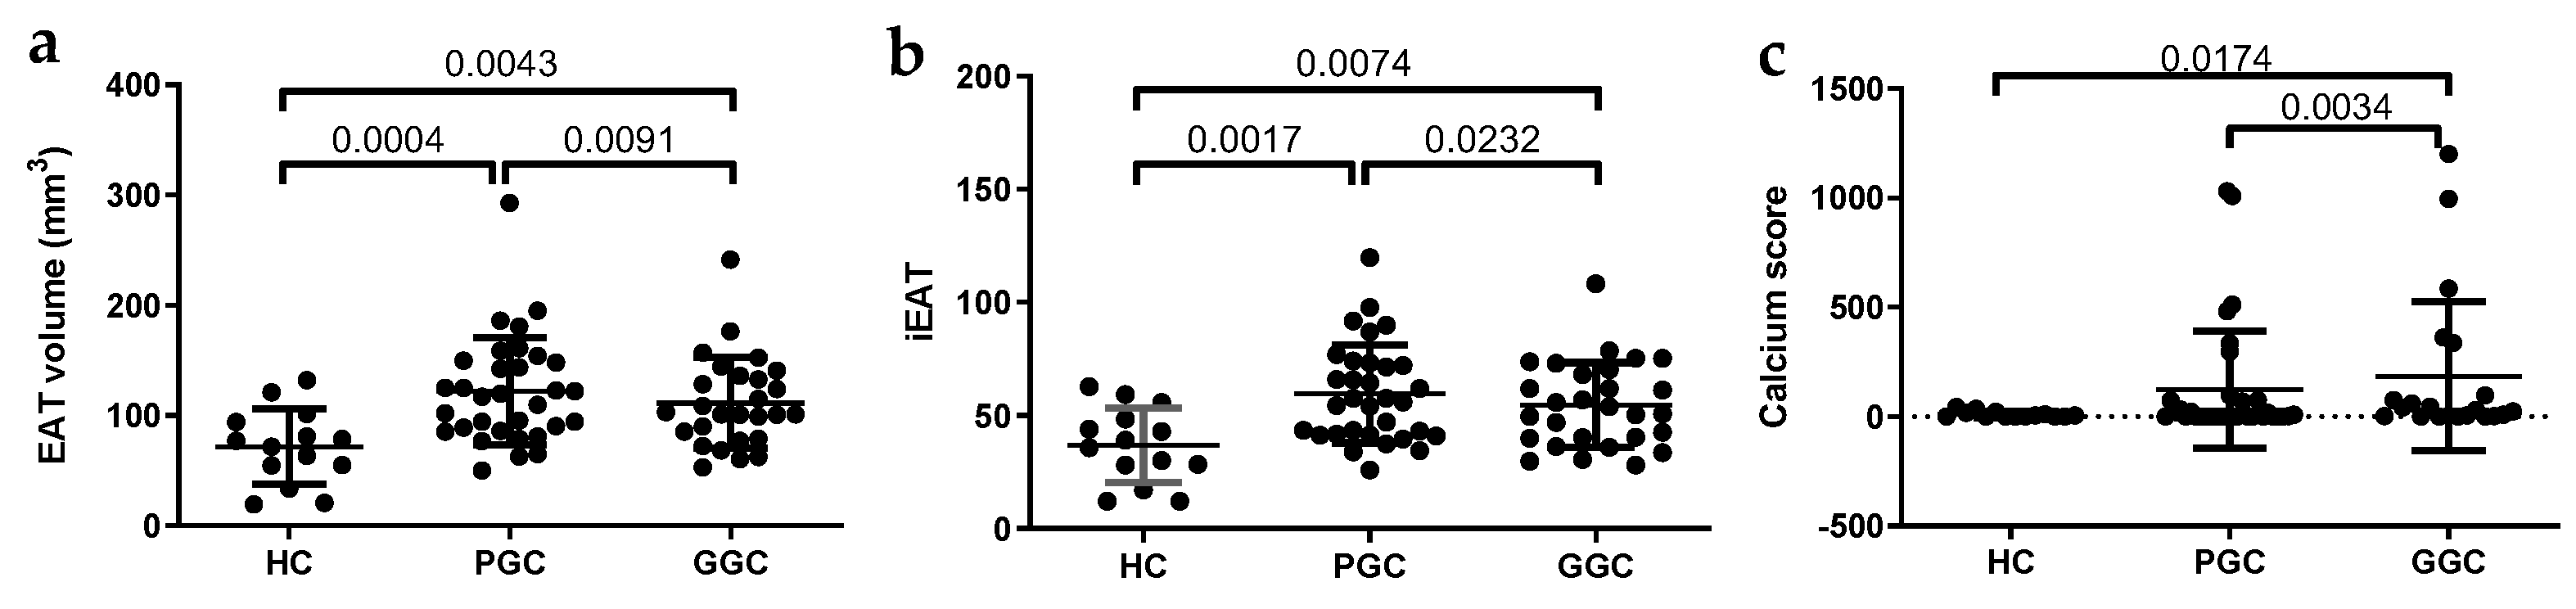
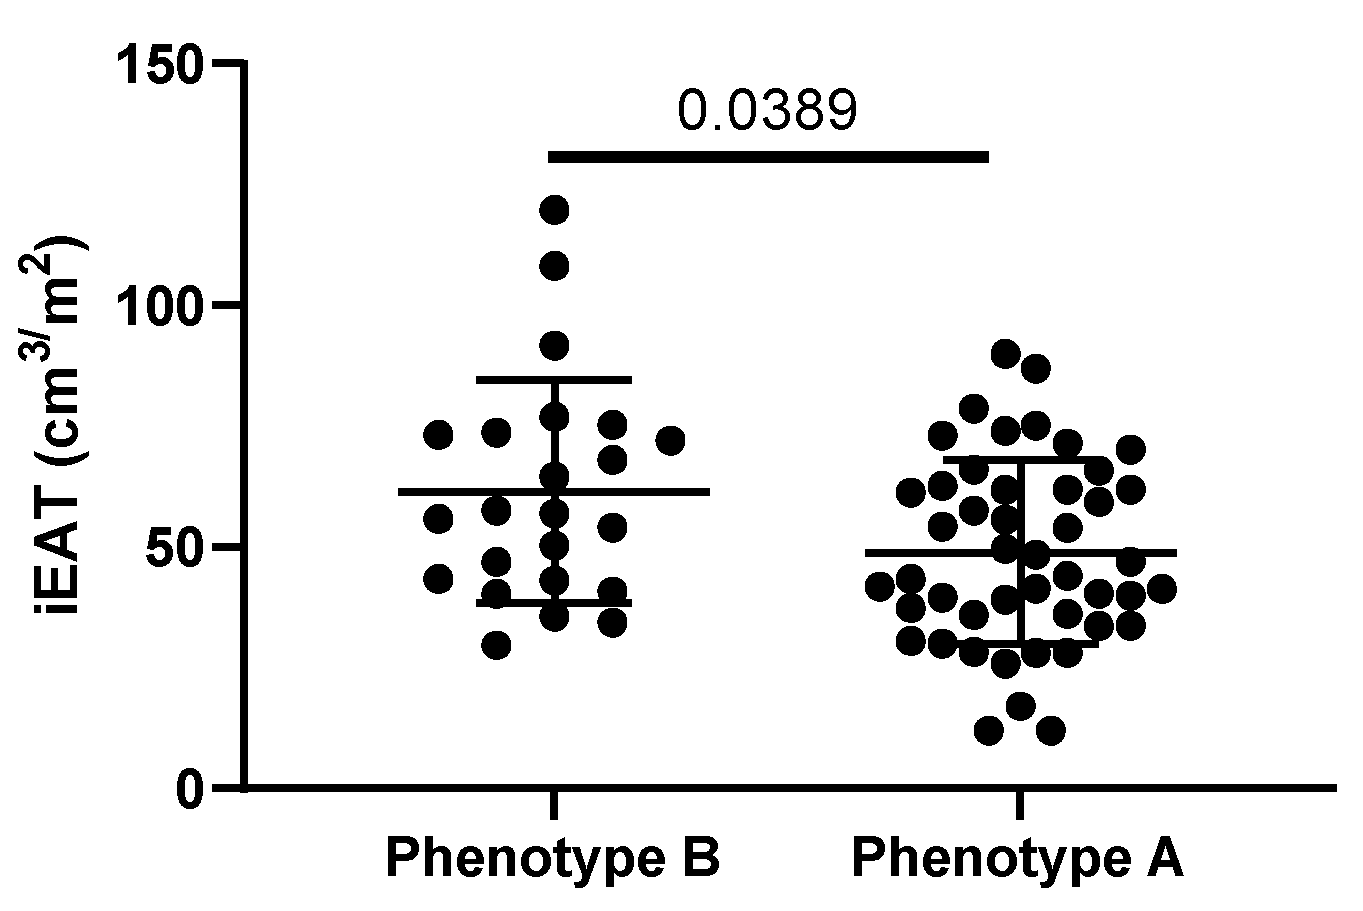
3.4. iEAT and CAC
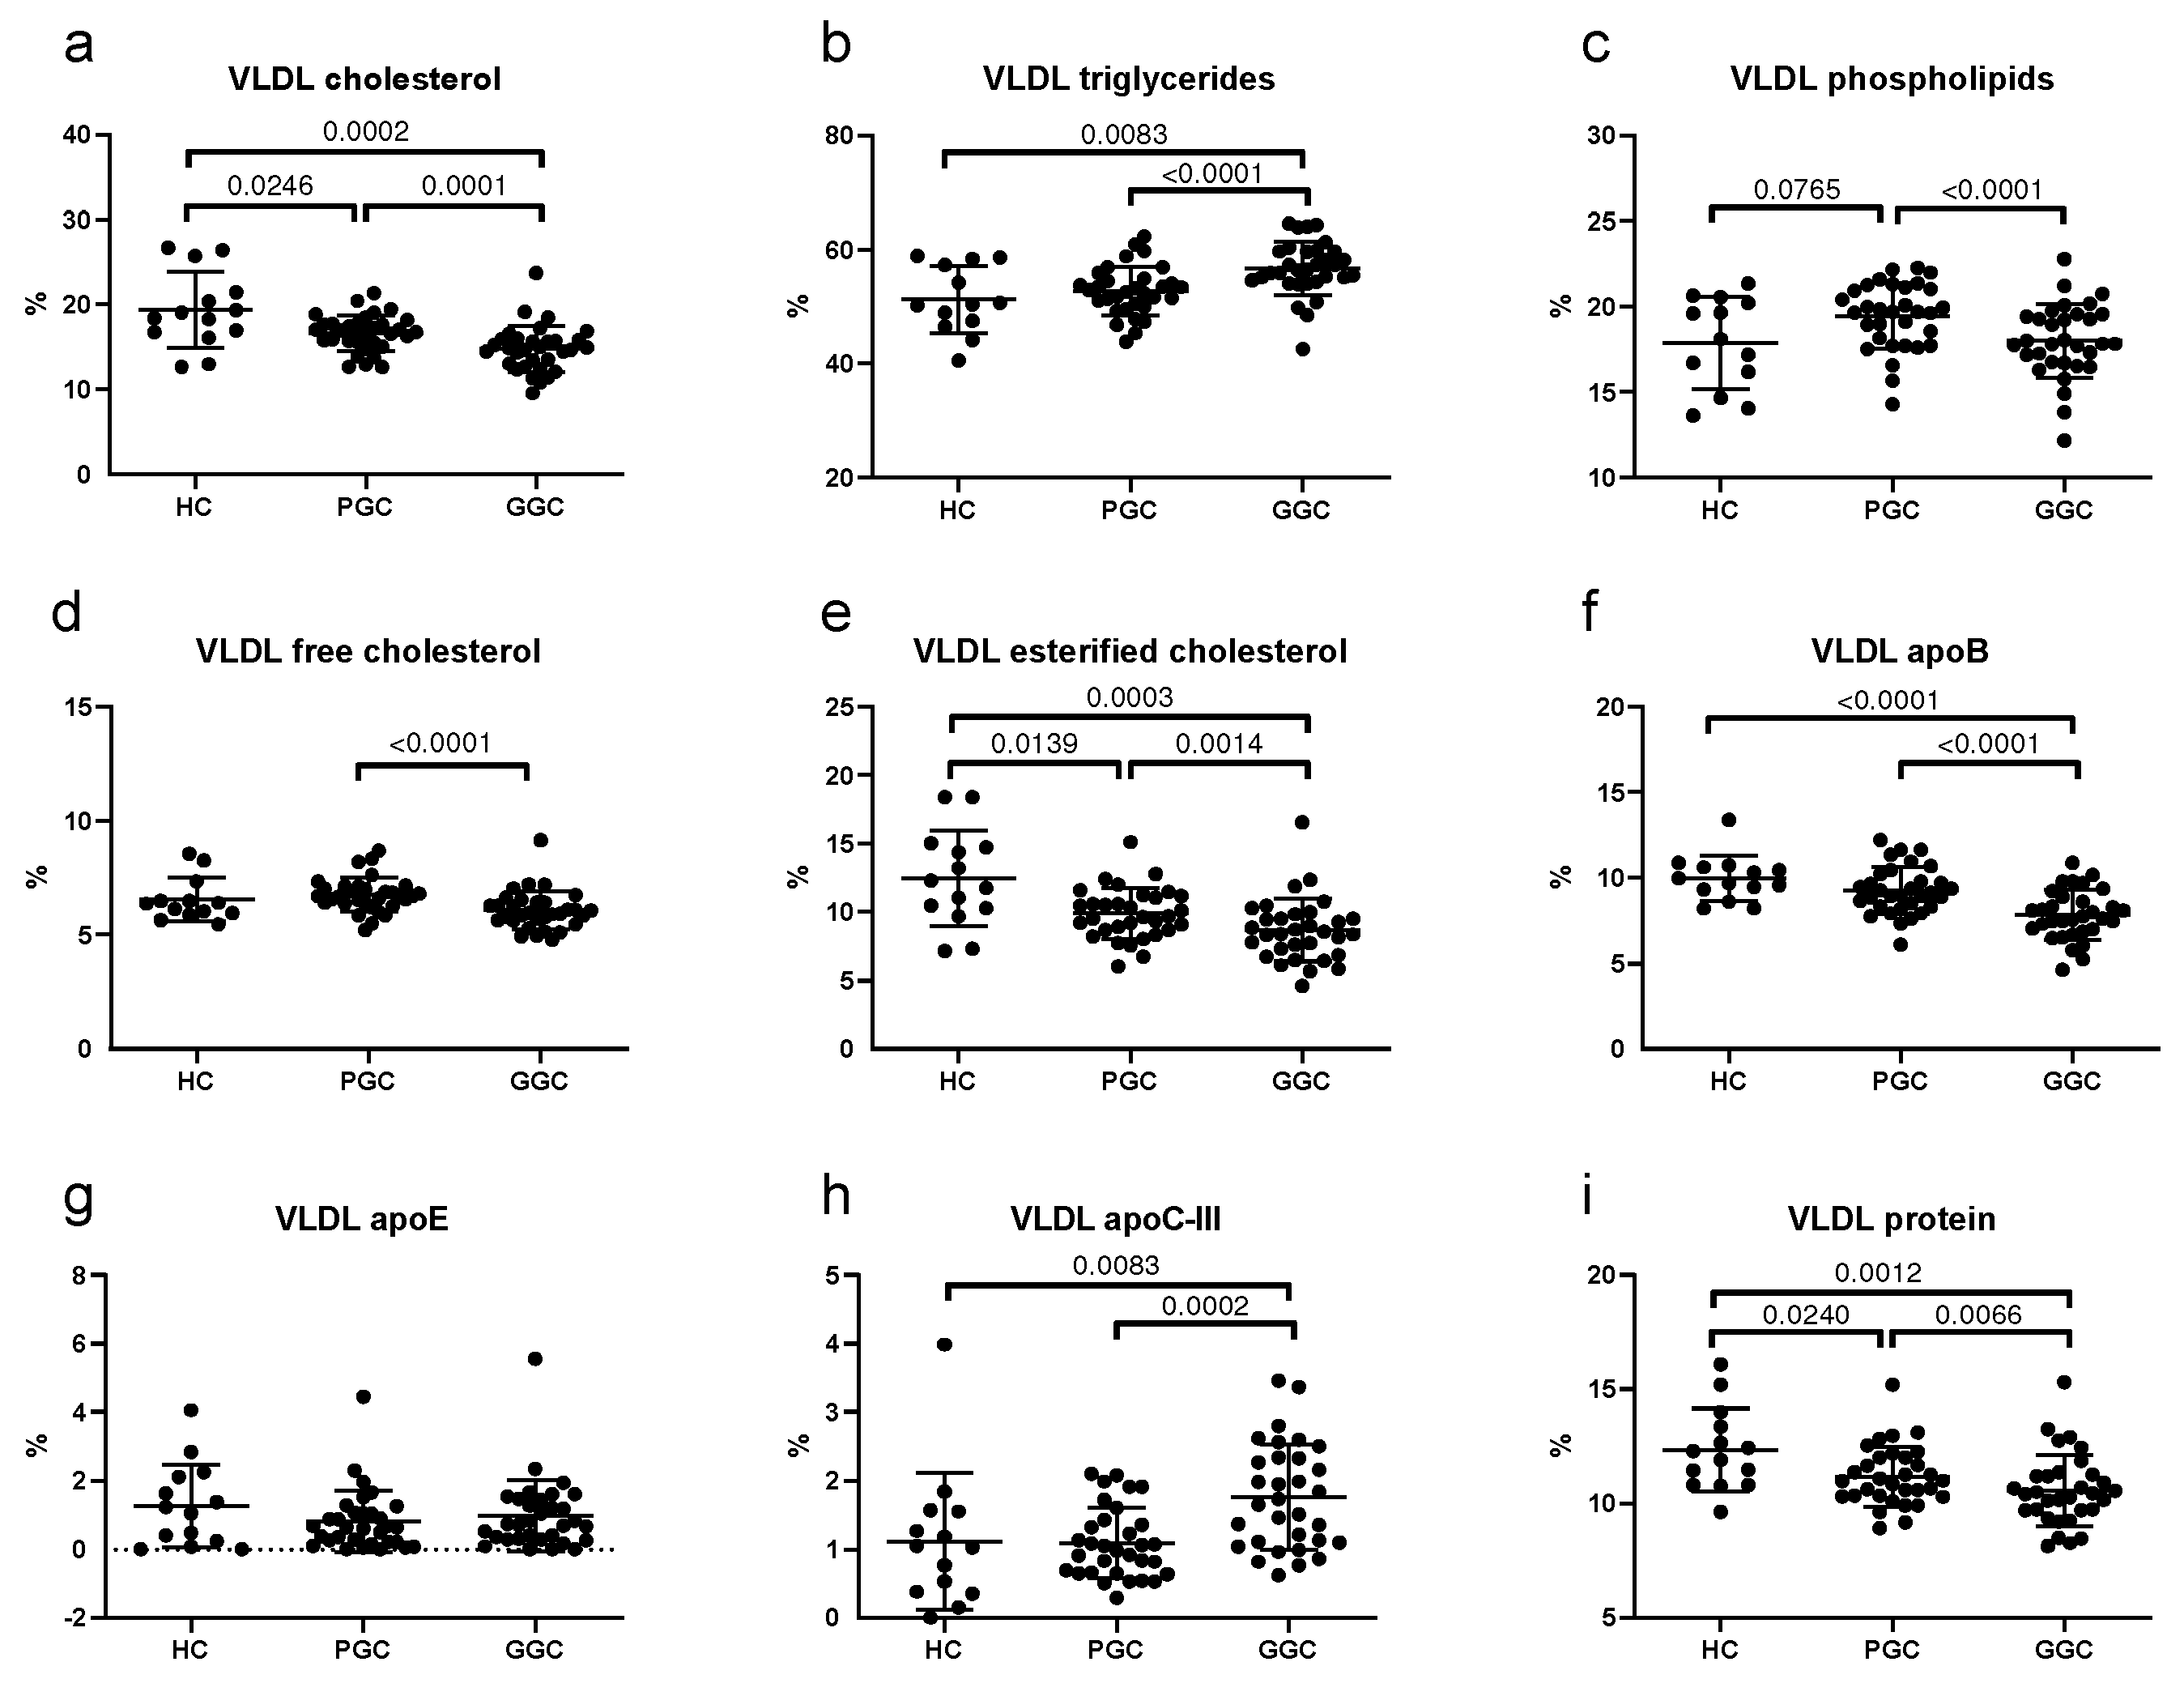
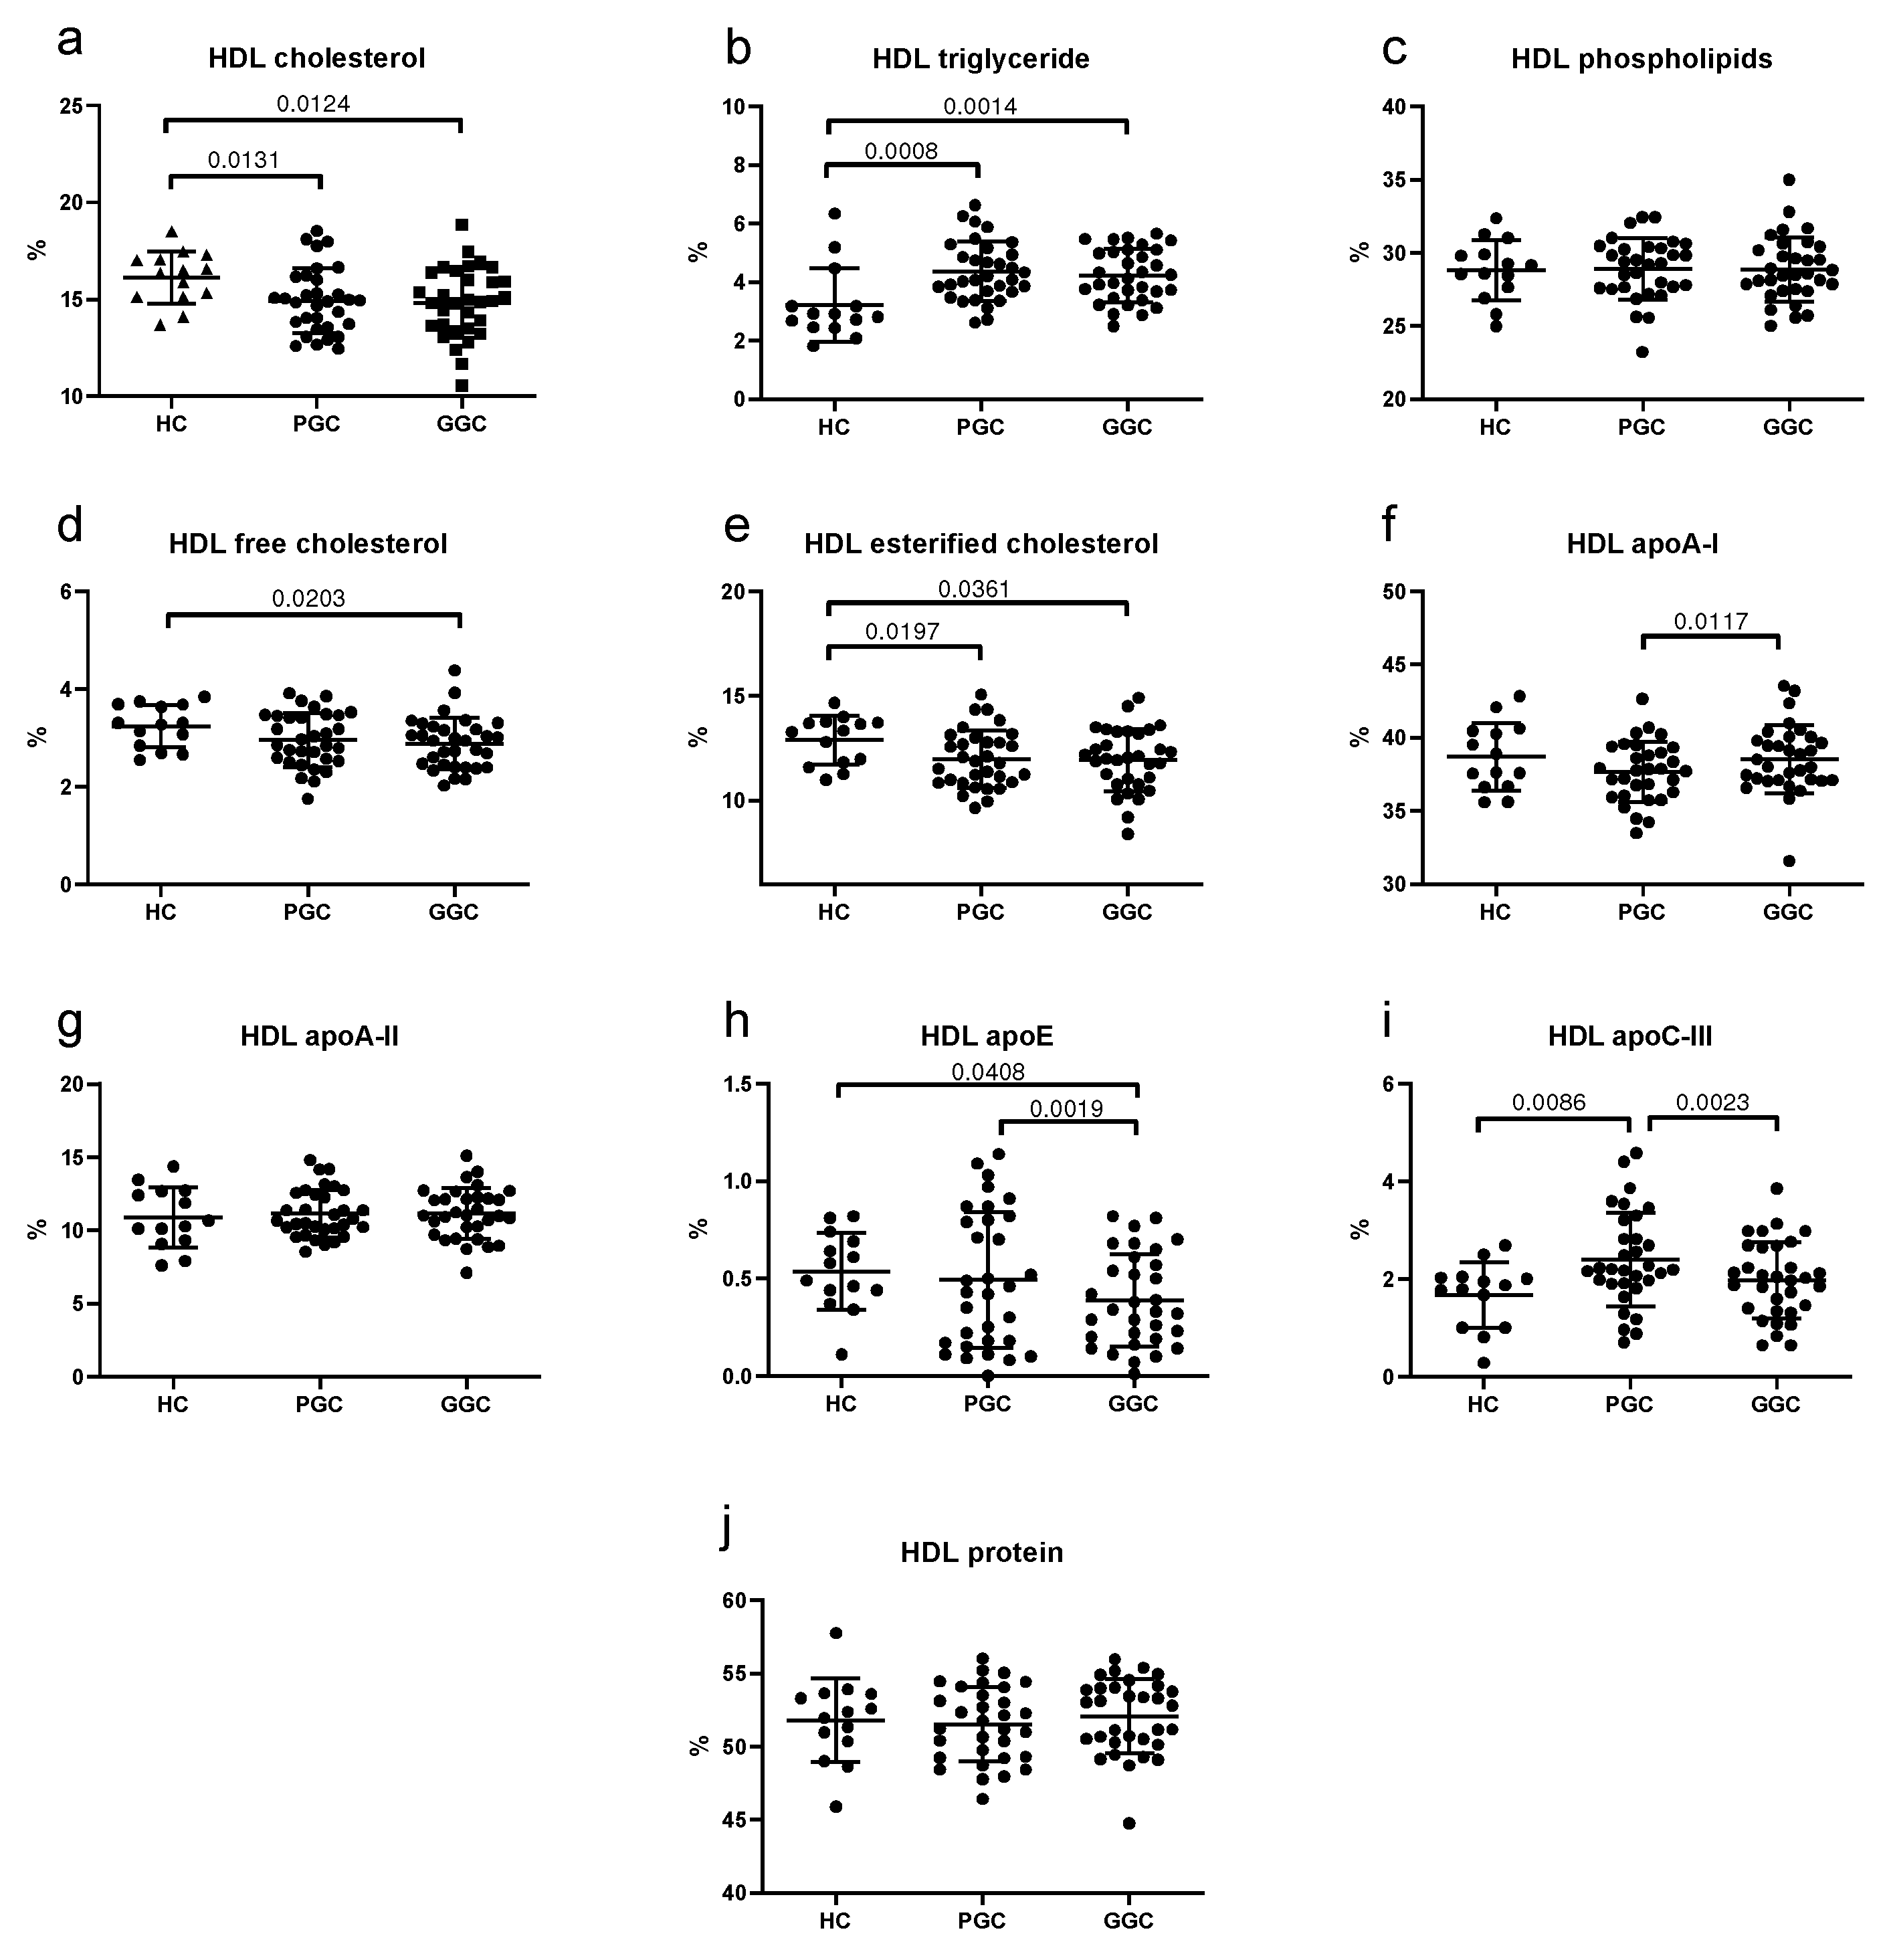
3.5. Lipoprotein Composition
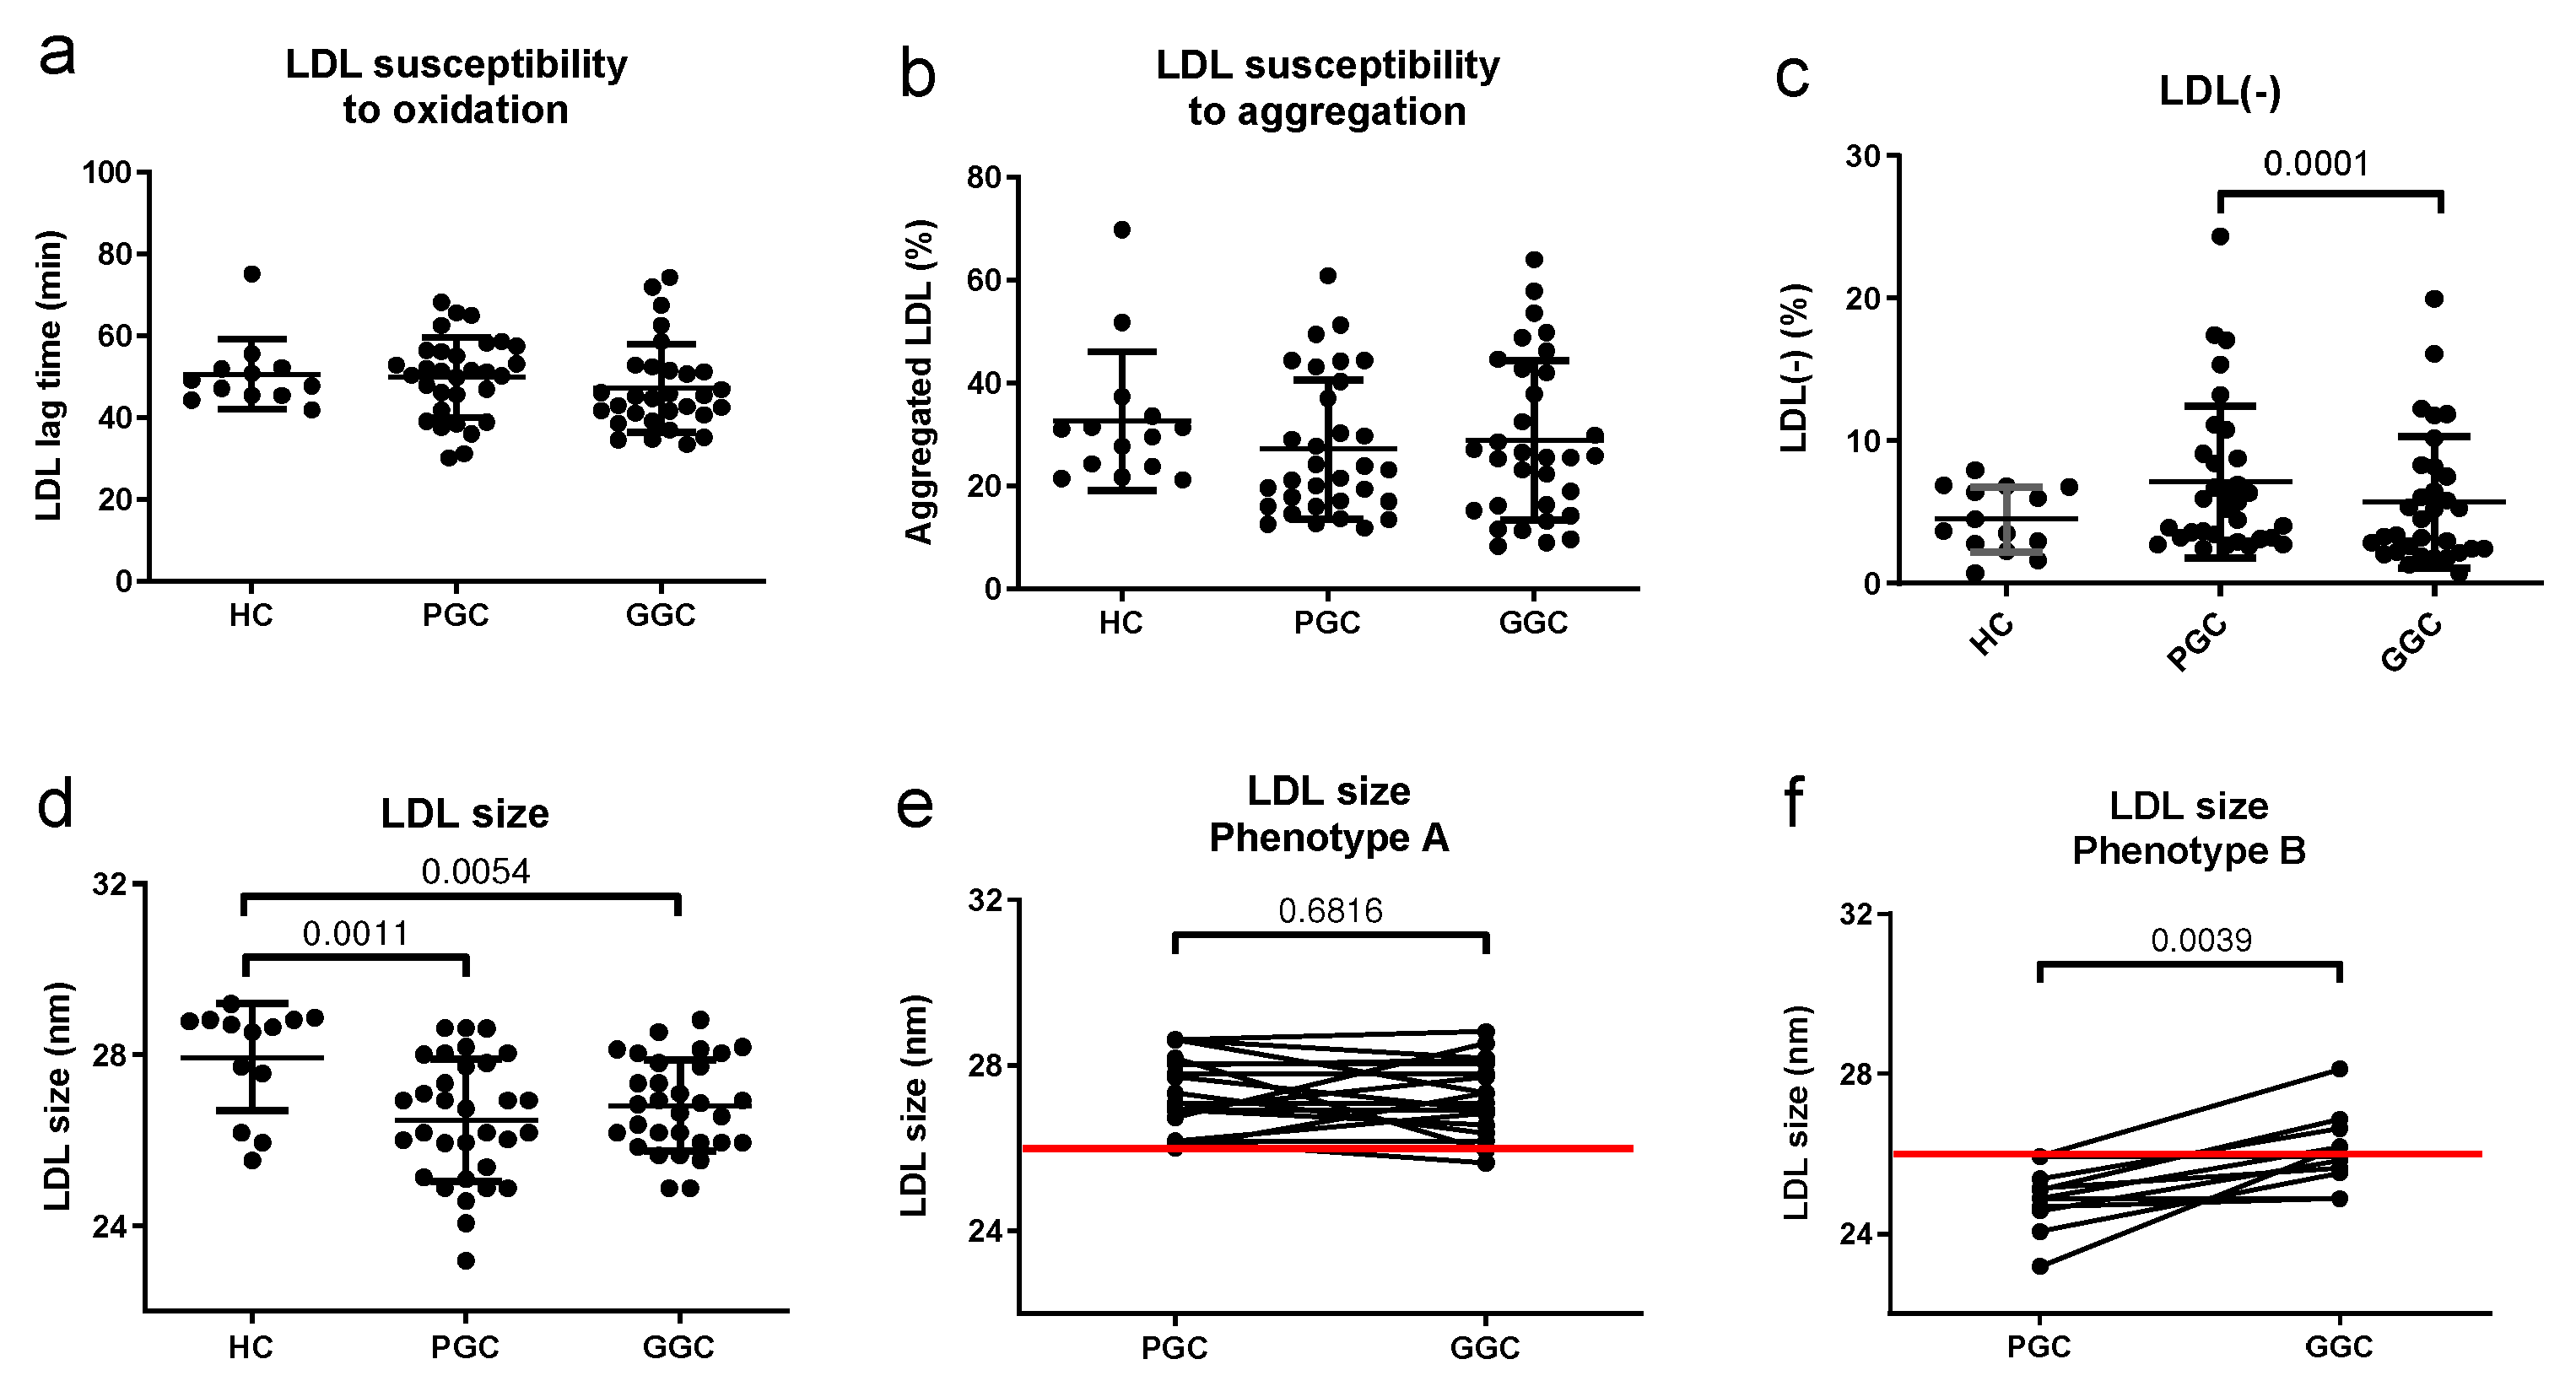
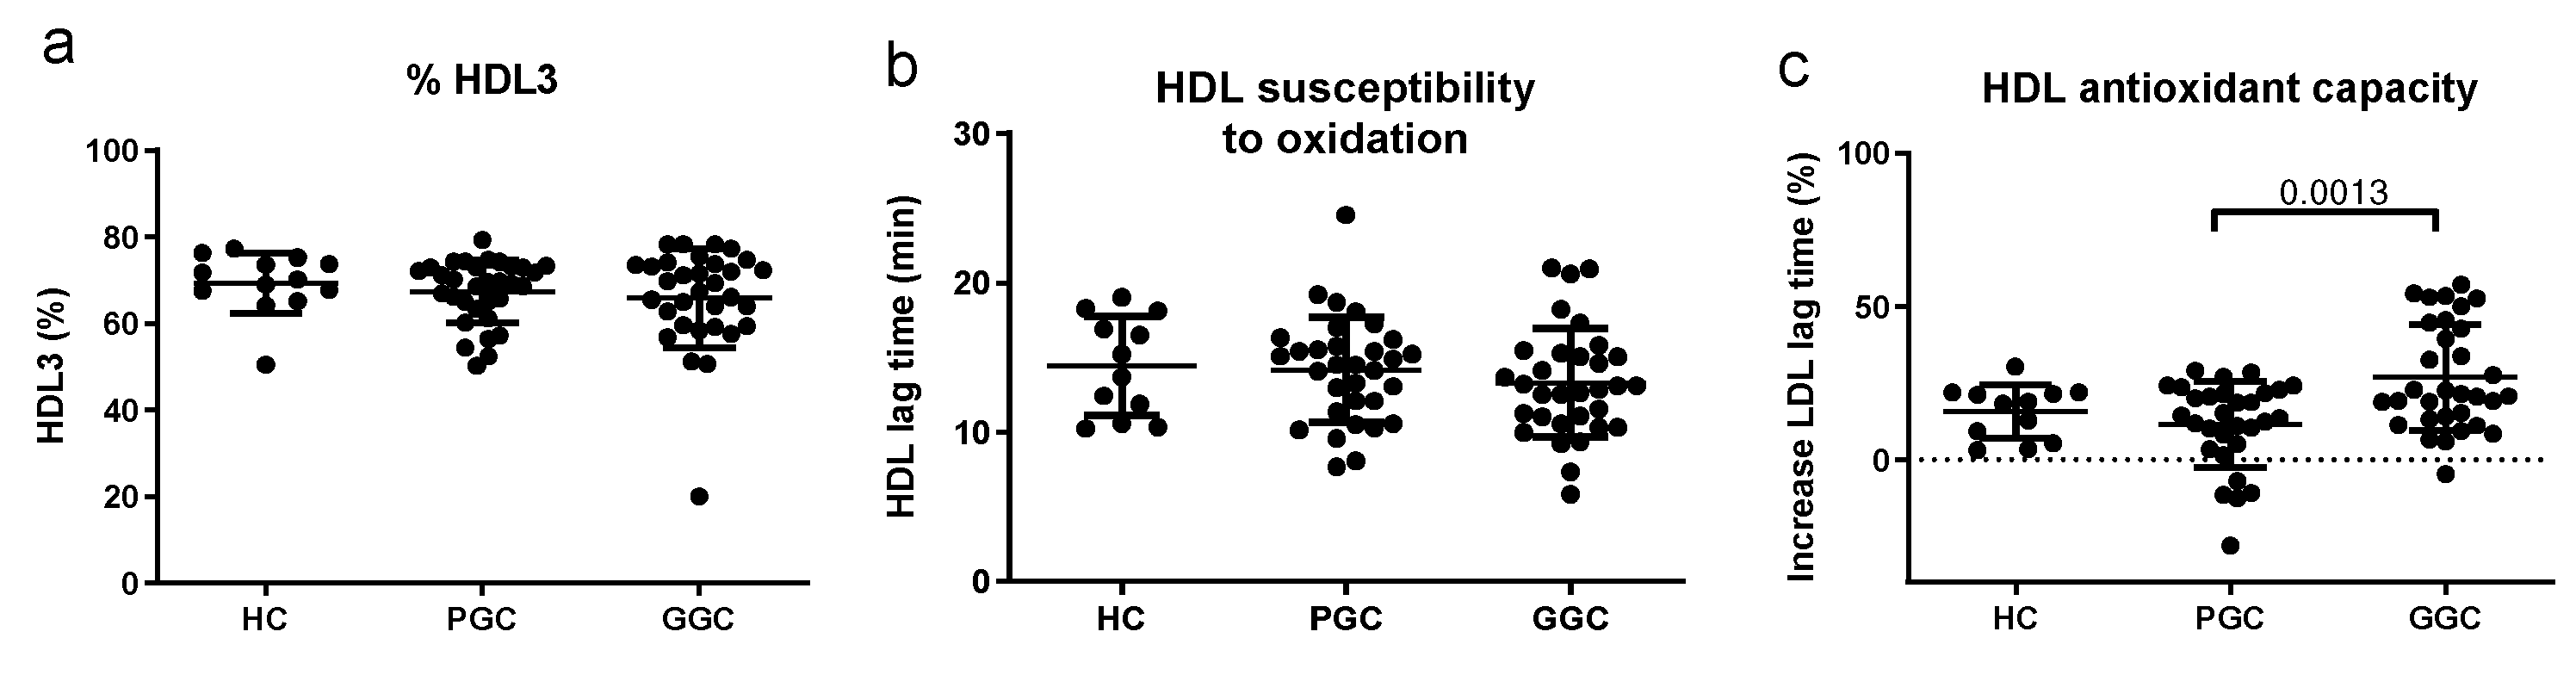
3.6. Lipoprotein Functional Properties
3.7. Correlations with iEAT
3.8. Bivariate and Multivariable Regression Analysis
3.9. Receiver Operating Characteristic Analysis
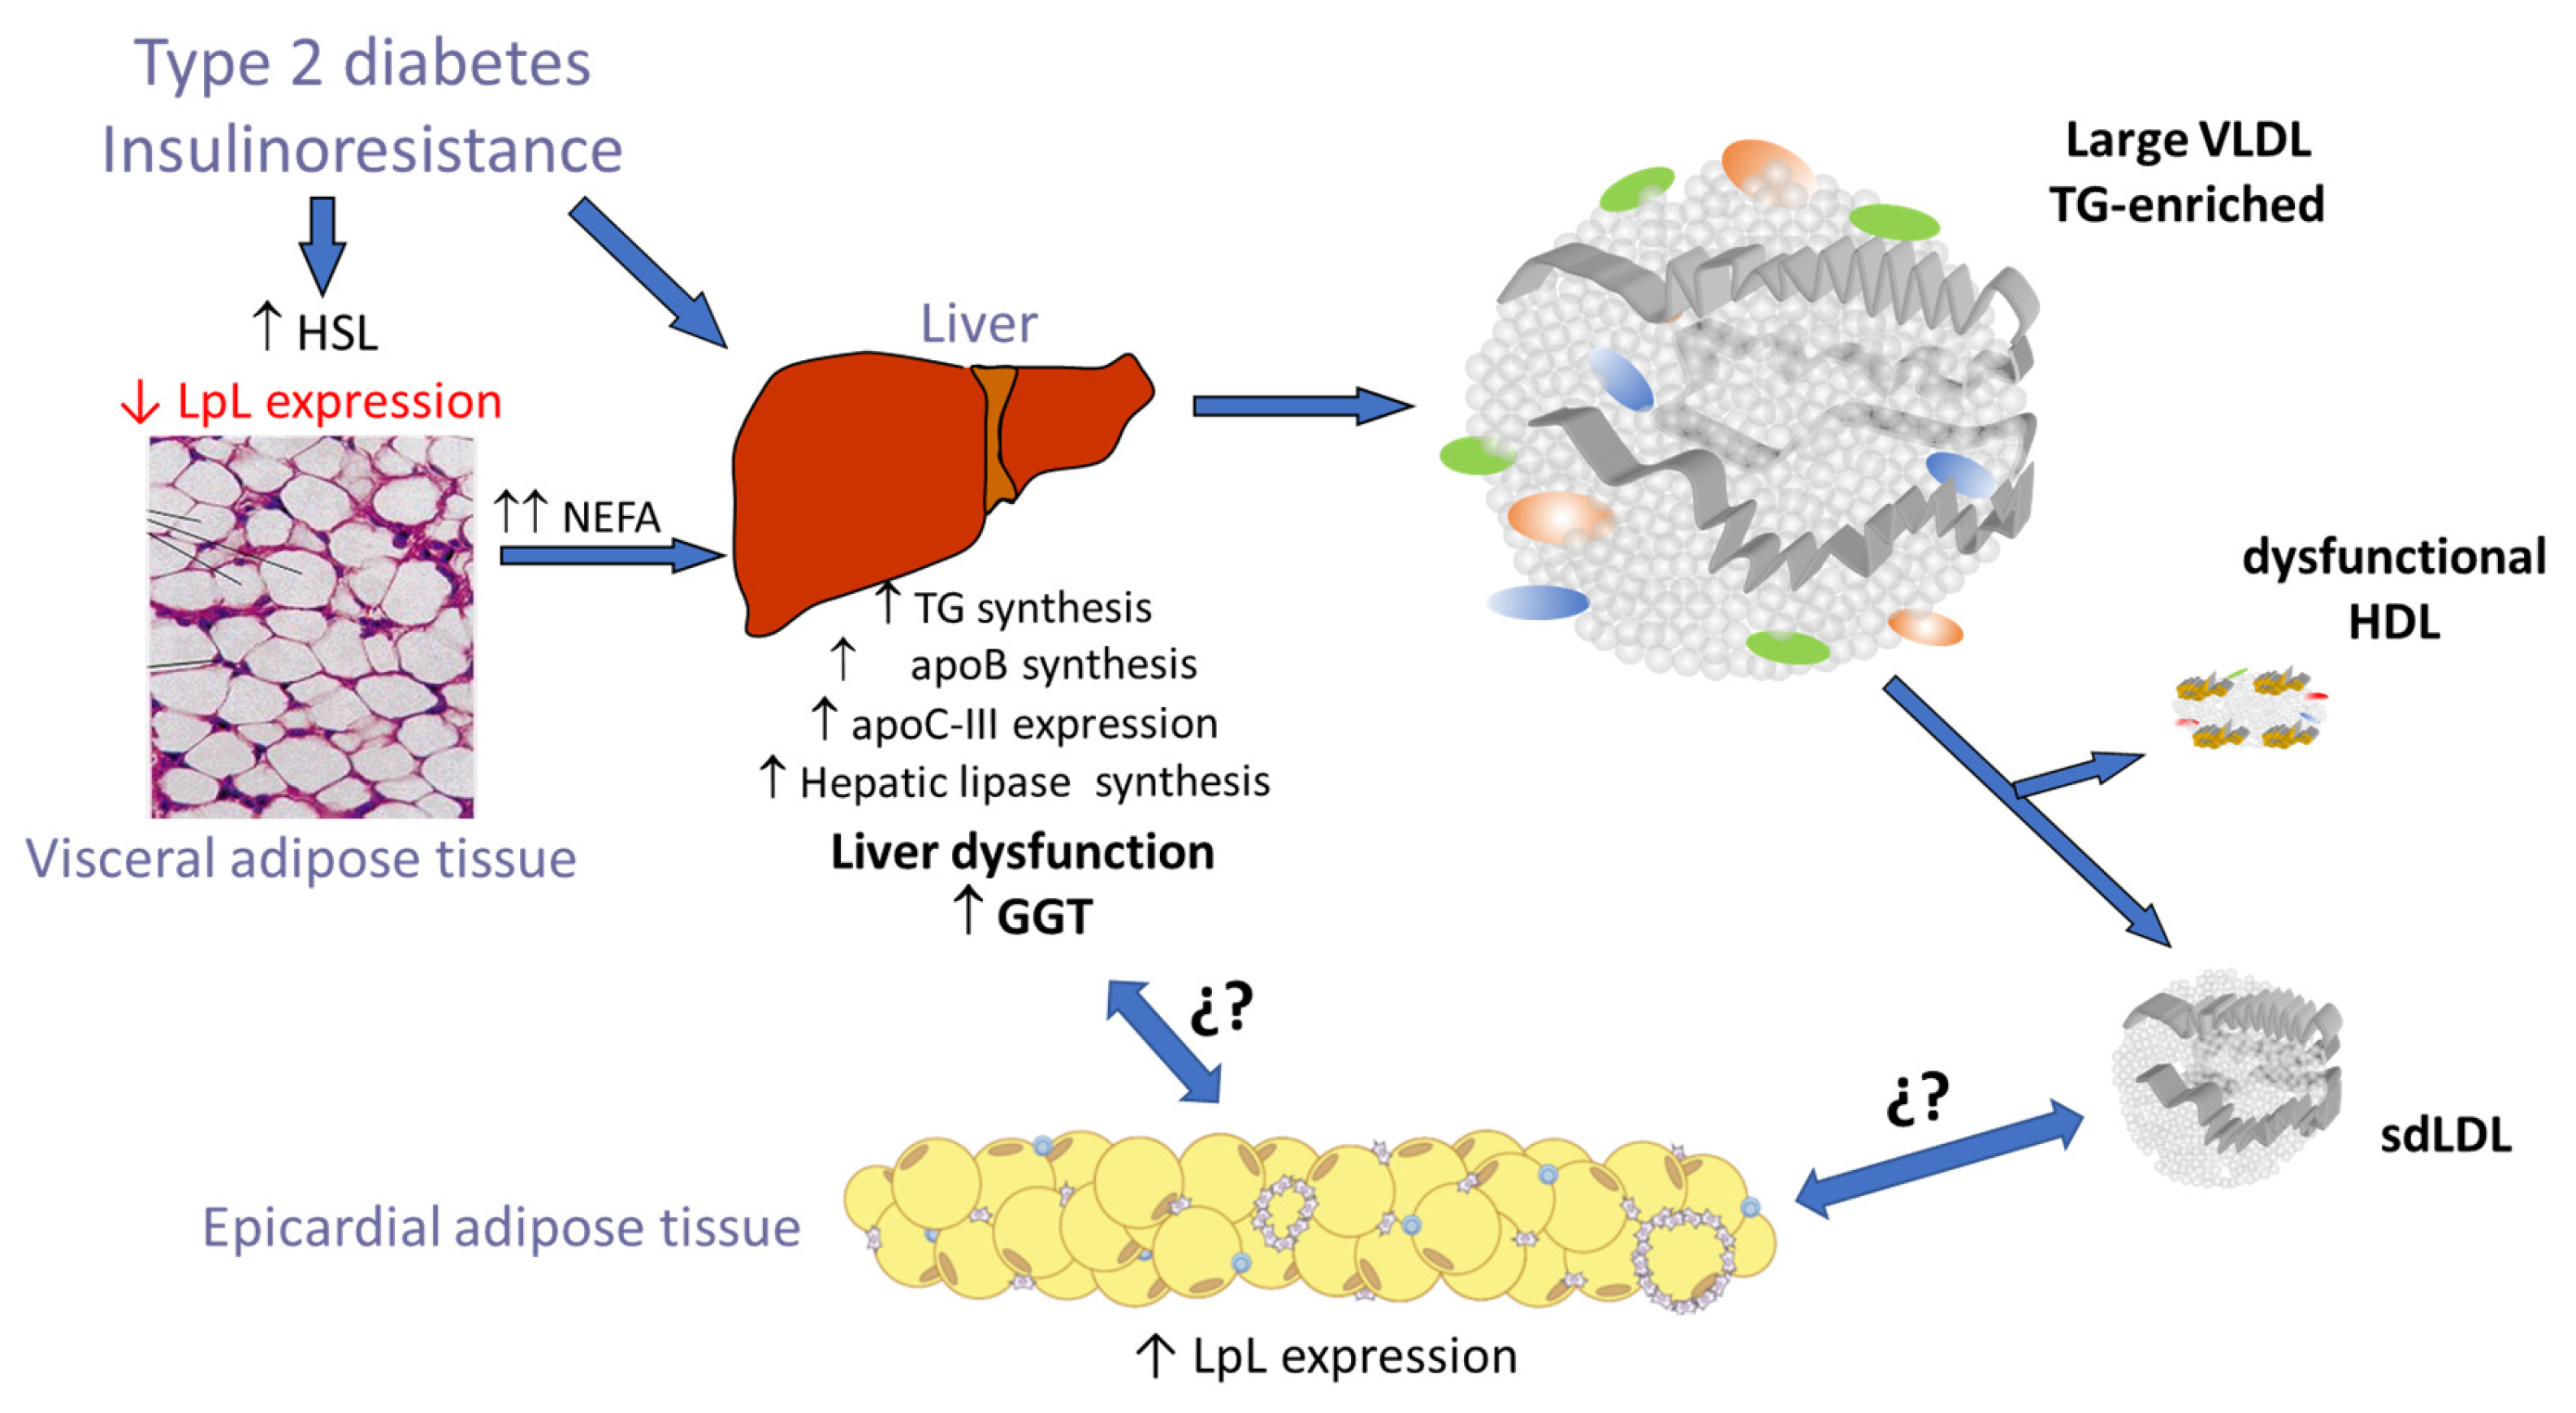
4. Discussion
5. Conclusions
Supplementary Materials
Author Contributions
Funding
Institutional Review Board Statement
Informed Consent Statement
Data Availability Statement
Conflicts of Interest
References
- Scherer, P.E.; Hill, J.A. Obesity, Diabetes, and Cardiovascular Diseases: A Compendium. Circ. Res. 2016, 118, 1703–1705. [Google Scholar] [CrossRef] [PubMed]
- Lorenzatti, A.J.; Toth, P.P. New Perspectives on Atherogenic Dyslipidaemia and Cardiovascular Disease. Eur. Cardiol. 2020, 15, 29–37. [Google Scholar] [CrossRef] [PubMed]
- Soran, H.; Schofield, J.D.; Adam, S.; Durrington, P.N. Diabetic dyslipidaemia. Curr. Opin. Lipidol. 2016, 27, 313–322. [Google Scholar] [CrossRef] [PubMed]
- Reis, A.; Rocha, S.; Dias, I.H.; Costa, R.; Soares, R.; Sánchez-Quesada, J.L.; Perez, A.; de Freitas, V. Type 2 Diabetes mellitus alters the cargo of (poly)phenol metabolome and the oxidative status in circulating lipoproteins. Redox Biol. 2023, 59, 102572. [Google Scholar] [CrossRef]
- Sánchez-Quesada, J.L.; Vinagre, I.; De Juan-Franco, E.; Sánchez-Hernández, J.; Bonet-Marques, R.; Blanco-Vaca, F.; Ordóñez-Llanos, J.; Pérez, A. Impact of the LDL subfraction phenotype on Lp-PLA2 distribution, LDL modification and HDL composition in type 2 diabetes. Cardiovasc. Diabetol. 2013, 12, 112. [Google Scholar] [CrossRef]
- Iacobellis, G.; Corradi, D.; Sharma, A.M. Epicardial adipose tissue: Anatomic, biomolecular and clinical relationships with the heart. Nat. Clin. Pract. Cardiovasc. Med. 2005, 2, 536–543. [Google Scholar] [CrossRef]
- Iacobellis, G. Epicardial fat links obesity to cardiovascular diseases. Prog. Cardiovasc. Dis. 2023, 78, 27–33. [Google Scholar] [CrossRef]
- Villasante Fricke, A.C.; Iacobellis, G. Epicardial Adipose Tissue: Clinical Biomarker of Cardio-Metabolic Risk. Int. J. Mol. Sci. 2019, 20, 5989. [Google Scholar] [CrossRef]
- Dillmann, W.H. Diabetic cardiomyopathy. Circ. Res. 2019, 124, 1160–1162. [Google Scholar] [CrossRef]
- Sardu, C.; D’onofrio, N.; Torella, M.; Portoghese, M.; Loreni, F.; Mureddu, S.; Signoriello, G.; Scisciola, L.; Barbieri, M.; Rizzo, M.R.; et al. Pericoronary fat inflammation and Major Adverse Cardiac Events (MACE) in prediabetic patients with acute myocardial infarction: Effects of metformin. Cardiovasc. Diabetol. 2019, 18, 126. [Google Scholar] [CrossRef]
- Mazurek, T.; Zhang, L.; Zalewski, A.; Mannion, J.D.; Diehl, J.T.; Arafat, H.; Sarov-Blat, L.; O’Brien, S.; Keiper, E.A.; Johnson, A.G.; et al. Human epicardial adipose tissue is a source of inflammatory mediators. Circulation 2003, 108, 2460–2466. [Google Scholar] [CrossRef] [PubMed]
- Greulich, S.; Maxhera, B.; Vandenplas, G.; de Wiza, D.H.; Smiris, K.; Mueller, H.; Heinrichs, J.; Blumensatt, M.; Cuvelier, C.; Akhyari, P.; et al. Secretory products from epicardial adipose tissue of patients with type 2 diabetes mellitus induce cardiomyocyte dysfunction. Circulation 2012, 126, 2324–2334. [Google Scholar] [CrossRef] [PubMed]
- Vianello, E.; Dozio, E.; Arnaboldi, F.; Marazzi, M.; Martinelli, C.; Lamont, J.; Tacchini, L.; Sigrüner, A.; Schmitz, G.; Romanelli, M.C. Epicardial adipocyte hypertrophy: Association with M1-polarization and toll-like receptor pathways in coronary artery disease patients. Nutr. Metab. Cardiovasc. Dis. 2016, 26, 246–253. [Google Scholar] [CrossRef] [PubMed]
- Salgado-Somoza, A.; Teijeira-Fernandez, E.; Fernandez, A.L.; Gonzalez-Juanatey, J.R.; Eiras, S. Changes in lipid transport-involved proteins of epicardial adipose tissue associated with coronary artery disease. Atherosclerosis 2012, 224, 492–499. [Google Scholar] [CrossRef]
- Salgado-Somoza, A.; Teijeira-Fernandez, E.; Rubio, J.; Couso, E.; Gonzalez-Juanatey, J.R.; Eiras, S. Coronary artery disease is associated with higher epicardial retinol-binding protein 4 (RBP4) and lower glucose transporter (GLUT) 4 levels in epicardial and subcutaneous adipose tissue. Clin. Endocrinol. 2012, 76, 51–58. [Google Scholar] [CrossRef]
- Mancio, J.; Azevedo, D.; Saraiva, F.; Azevedo, A.I.; Pires-Morais, G.; Leite-Moreira, A.; Falcao-Pires, I.; Lunet, N.; Bettencourt, N. Epicardial adipose tissue volume assessed by computed tomography and coronary artery disease: A systematic review and meta-analysis. Eur. Heart J. Cardiovasc. Imaging 2018, 19, 490–497. [Google Scholar] [CrossRef]
- Shmilovich, H.; Dey, D.; Cheng, V.Y.; Rajani, R.; Nakazato, R.; Otaki, Y.; Nakanishi, R.; Slomka, P.J.; Thomson, L.E.; Hayes, S.W.; et al. Threshold for the upper normal limit of indexed epicardial fat volume: Derivation in a healthy population and validation in an outcome-based study. Am. J. Cardiol. 2011, 108, 1680–1685. [Google Scholar] [CrossRef]
- Kotha, S.; Plein, S.; Greenwood, J.P.; Levelt, E. Role of epicardial adipose tissue in diabetic cardiomyopathy through the lens of cardiovascular magnetic resonance imaging—A narrative review. Ther. Adv. Endocrinol. Metab. 2024, 15, 20420188241229540. [Google Scholar] [CrossRef]
- Yuvaraj, J.; Isa, M.; Che, Z.C.; Lim, E.; Nerlekar, N.; Nicholls, S.J.; Seneviratne, S.; Lin, A.; Dey, D.; Wong, D.T.L. Atherogenic index of plasma is associated with epicardial adipose tissue volume assessed on coronary computed tomography angiography. Sci. Rep. 2022, 12, 9626. [Google Scholar] [CrossRef]
- American Diabetes Association. 2. Classification and Diagnosis of Diabetes. Diabetes Care 2016, 39 (Suppl. 1), S13–S22. [Google Scholar] [CrossRef]
- Mancia, G.; Fagard, R.; Narkiewicz, K.; Redon, J.; Zanchetti, A.; Böhm, M.; Christiaens, T.; Cifkova, R.; De Backer, G.; Dominiczak, A.; et al. 2013 ESH/ESC guidelines for the management of arterial hypertension: The Task Force for the Management of Arterial Hypertension of the European Society of Hypertension (ESH) and of the European Society of Cardiology (ESC). Eur. Heart J. 2013, 34, 2159–2219. [Google Scholar] [CrossRef] [PubMed]
- Oudkerk, M.; Stillman, A.E.; Halliburton, S.S.; Kalender, W.A.; Möhlenkamp, S.; McCollough, C.H.; Vliegenthart, R.; Shaw, L.J.; Stanford, W.; Taylor, A.J.; et al. Coronary artery calcium screening: Current status and recommendations from the European Society of Cardiac Radiology and North American Society for Cardiovascular Imaging. Int. J. Cardiovasc. Imaging 2008, 24, 645–671. [Google Scholar] [CrossRef] [PubMed]
- McDonagh, T.A.; Metra, M.; Adamo, M.; Gardner, R.S.; Baumbach, A.; Böhm, M.; Burri, H.; Butler, J.; Čelutkienė, J.; Chioncel, O.; et al. 2023 Focused Update of the 2021 ESC Guidelines for the diagnosis and treatment of acute and chronic heart failure. Eur. Heart J. 2023, 44, 3627–3639. [Google Scholar] [CrossRef] [PubMed]
- Havel, R.J.; Eder, H.A.; Bragdon, J.H. The distribution and chemical composition of ultracentrifugally separated lipoproteins in human serum. J. Clin. Investig. 1955, 34, 1345–1353. [Google Scholar] [CrossRef]
- Benítez, S.; Villegas, V.; Bancells, C.; Jorba, O.; González-Sastre, F.; Ordóñez-Llanos, J.; Sánchez-Quesada, J.L. Impaired binding affinity of electronegative low-density lipoprotein (LDL) to the LDL receptor is related to nonesterified fatty acids and lysophosphatidylcholine content. Biochemistry 2004, 43, 15863–15872. [Google Scholar] [CrossRef]
- Bancells, C.; Benítez, S.; Jauhiainen, M.; Ordóñez-Llanos, J.; Kovanen, P.T.; Villegas, S.; Sánchez-Quesada, J.L.; Öörni, K. High binding affinity of electronegative LDL to human aortic proteoglycans depends on its aggregation level. J. Lipid Res. 2009, 50, 446–455. [Google Scholar] [CrossRef]
- Bancells, C.; Villegas, S.; Blanco, F.J.; Benítez, S.; Gállego, I.; Beloki, L.; Pérez-Cuellar, M.; Ordóñez-Llanos, J.; Sánchez-Quesada, J.L. Aggregated electronegative low density lipoprotein in human plasma shows a high tendency toward phospholipolysis and particle fusion. J. Biol. Chem. 2010, 285, 32425–32435. [Google Scholar] [CrossRef]
- Rivas-Urbina, A.; Rotllan, N.; Santos, D.; Julve, J.; Escola-Gil, J.C.; Sanchez-Quesada, J.L. Assessment of Ex Vivo Antioxidative Potential of Murine HDL in Atherosclerosis. Methods Mol. Biol. 2022, 2419, 283–292. [Google Scholar] [CrossRef]
- Sanchez-Quesada, J.L.; Benitez, S.; Otal, C.; Franco, M.; Blanco-Vaca, F.; Ordonez-Llanos, J. Density distribution of electronegative LDL in normolipemic and hyperlipemic subjects. J. Lipid Res. 2002, 43, 699–705. [Google Scholar] [CrossRef]
- Krauss, R.M. Lipids and lipoproteins in patients with type 2 diabetes. Diabetes Care 2004, 27, 1496–1504. [Google Scholar] [CrossRef]
- Iacobellis, G. Epicardial adipose tissue in endocrine and metabolic diseases. Endocrine 2014, 46, 8–15. [Google Scholar] [CrossRef] [PubMed]
- Christensen, R.H.; von Scholten, B.J.; Hansen, C.S.; Jensen, M.T.; Vilsbøll, T.; Rossing, P.; Jørgensen, P.G. Epicardial adipose tissue predicts incident cardiovascular disease and mortality in patients with type 2 diabetes. Cardiovasc. Diabetol. 2019, 18, 114. [Google Scholar] [CrossRef] [PubMed]
- Ren, J.; Yao, G.; Ren, L.; Wang, Y.; Gao, J.; Zhang, Y. Exploring the Associations Between Non-Traditional Lipid Parameters and Epicardial Adipose Tissue Volume. Angiology 2023, 33197231207264. [Google Scholar] [CrossRef]
- Urata, T.; Kishino, T.; Watanabe, K.; Shibasaki, S.; Yotsukura, M.; Mori, H.; Kawamura, N.; Tanaka, T.; Osaka, M.; Matsushima, S.; et al. Sonographically Measured Adipose Tissue Thickness Correlates with Laboratory Test Abnormalities Reflecting Metabolic State in Elderly Women. Metab. Syndr. Relat. Disord. 2022, 20, 148–155. [Google Scholar] [CrossRef]
- Donmez, Y.; Bulut, A. Epicardial fat thickness is significantly increased and related to LDL cholesterol level in patients with familial hypercholesterolemia. J. Ultrasound. 2019, 22, 309–314. [Google Scholar] [CrossRef]
- Rubio-Guerra, A.F.; Benitez-Maldonado, D.R.; Lozano-Nuevo, J.J.; Arana-Pazos, K.C.; Huerta-Ramirez, S.; Narvaez-Rivera, J.L. Correlation between epicardial fat thickness and biochemical markers of metabolic risk. Med. Clin. 2018, 151, 236–238. [Google Scholar] [CrossRef]
- Colom, C.; Viladés, D.; Pérez-Cuellar, M.; Leta, R.; Rivas-Urbina, A.; Carreras, G.; Ordóñez-Llanos, J.; Pérez, A.; Sánchez-Quesada, J.L. Associations between epicardial adipose tissue, subclinical atherosclerosis and high-density lipoprotein composition in type 1 diabetes. Cardiovasc. Diabetol. 2018, 17, 156. [Google Scholar] [CrossRef]
- Dawson, L.P.; Lum, M.; Nerleker, N.; Nicholls, S.J.; Layland, J. Coronary Atherosclerotic Plaque Regression: JACC State-of-the-Art Review. J. Am. Coll. Cardiol. 2022, 79, 66–82. [Google Scholar] [CrossRef] [PubMed]
- Mendieta, G.; Pocock, S.; Mass, V.; Moreno, A.; Owen, R.; García-Lunar, I.; López-Melgar, B.; Fuster, J.J.; Andres, V.; Pérez-Herreras, C.; et al. Determinants of Progression and Regression of Subclinical Atherosclerosis Over 6 Years. J. Am. Coll. Cardiol. 2023, 82, 2069–2083. [Google Scholar] [CrossRef]
- Lee, S.-E.; Sung, J.M.; Andreini, D.; Budoff, M.J.; Cademartiri, F.; Chinnaiyan, K.; Choi, J.H.; Chun, E.J.; Conte, E.; Gottlieb, I.; et al. Differential association between the progression of coronary artery calcium score and coronary plaque volume progression according to statins: The Progression of AtheRosclerotic PlAque DetermIned by Computed TomoGraphic Angiography Imaging (PARADIGM) study. Eur. Heart J. Cardiovasc. Imaging 2019, 20, 1307–1314. [Google Scholar] [CrossRef]
- Cesaro, A.; Acerbo, V.; Scialla, F.; Scherillo, G.; De Michele, G.; Panico, D.; Porcelli, G.; de Sio, V.; Capolongo, A.; Sperlongano, S.; et al. Role of LipoprotEin(a) in CardiovascuLar Diseases and Premature Acute Coronary Syndromes (RELACS Study): Impact of Lipoprotein(a) levels on the premature coronary event and the severity of coronary artery disease. Nutr. Metab. Cardiovasc. Dis. 2025, in press. [CrossRef]
- Gao, B.; Li, C.; Liao, Q.; Pan, T.; Ren, C.; Cao, Q. Epicardial fat volume evaluated with multidetector computed tomography and other risk factors for prevalence of three-vessel coronary lesions. Eur. J. Med. Res. 2022, 27, 308. [Google Scholar] [CrossRef] [PubMed]
- Tchernof, A.; Lamarche, B.; Prud'Homme, D.; Nadeau, A.; Moorjani, S.; Labrie, F.; Lupien, P.J.; Després, J.-P. The dense LDL phenotype. Association with plasma lipoprotein levels, visceral obesity, and hyperinsulinemia in men. Diabetes Care 1996, 19, 629–637. [Google Scholar] [CrossRef] [PubMed]
- Goff, D.C., Jr.; D’Agostino, R.B.; Jr Haffner, S.M.; Otvos, J.D. Insulin resistance and adiposity influence lipoprotein size and subclass concentrations. Results from the Insulin Resistance Atherosclerosis Study. Metabolism 2005, 54, 264–270. [Google Scholar] [CrossRef]
- Barchuk, M.; Schreier, L.; López, G.; Cevey, A.; Baldi, J.; Tomé, M.d.C.F.; Goren, N.; Rubio, M.; Miksztowicz, V.; Berg, G. Glycosylphosphatidylinositol-anchored high density lipoprotein-binding protein 1 and angiopoietin-like protein 4 are associated with the increase of lipoprotein lipase activity in epicardial adipose tissue from diabetic patients. Atherosclerosis 2019, 288, 51–59. [Google Scholar] [CrossRef]
- Krauss, R.M. Small dense low-density lipoprotein particles: Clinically relevant? Curr. Opin. Lipidol. 2022, 33, 160–166. [Google Scholar] [CrossRef]
- Jayaraman, S.; Chavez, O.R.; Perez, A.; Minambres, I.; Sanchez-Quesada, J.L.; Gursky, O. Binding to heparin triggers deleterious structural and biochemical changes in human low-density lipoprotein, which are amplified in hyperglycemia. Biochim. Biophys. Acta Mol. Cell Biol. Lipids 2020, 1865, 158712. [Google Scholar] [CrossRef]
- Kotani, K.; Tsuzaki, K.; Sakane, N. The relationship between gamma-glutamyltransferase (GGT), bilirubin (Bil) and small dense low-density lipoprotein (sdLDL) in asymptomatic subjects attending a clinic for screening dyslipidaemias. Ann. Acad. Med. Singap. 2014, 43, 216–219. [Google Scholar] [CrossRef]
- Kim, S.Y.; Mun, S.B.; Yu, J.H.; Jin, Y.-J.; Suh, Y.J.; Cho, S.-H.; Lee, J.-W. Association between small dense LDL levels and hepatic fibrosis in patients with nonalcoholic fatty liver disease. Medicine 2022, 101, e30527. [Google Scholar] [CrossRef]
- Imajo, K.; Hyogo, H.; Yoneda, M.; Honda, Y.; Kessoku, T.; Tomeno, W.; Ogawa, Y.; Taguri, M.; Mawatari, H.; Nozaki, Y.; et al. LDL-migration index (LDL-MI), an indicator of small dense low-density lipoprotein (sdLDL), is higher in non-alcoholic steatohepatitis than in non-alcoholic fatty liver: A multicenter cross-sectional study. PLoS ONE 2014, 9, e115403. [Google Scholar] [CrossRef]
- Ege, M.R.; Guray, U.; Guray, Y.; Demirkan, B.; Kisacik, H. Serum gamma-glutamyltransferase levels correlate with epicardial adipose tissue thickness in patients with coronary artery disease. Angiology 2013, 64, 21–25. [Google Scholar] [CrossRef] [PubMed]
- Ding, L.; Peng, K.; Lin, L.; Li, M.; Wang, T.; Dai, M.; Zhao, Z.; Xu, M.; Lu, J.; Chen, Y.; et al. The impact of fat distribution on subclinical coronary atherosclerosis in middle-aged Chinese adults. Int. J. Cardiol. 2017, 235, 118–123. [Google Scholar] [CrossRef] [PubMed]
- Vandermeersch, A.; Ameye, S.; Puype, D.; Petitjean, D.; De Buyzere, M.; Langlois, M.R. Estimation of the low-density lipoprotein (LDL) subclass phenotype using a direct, automated assay of small dense LDL-cholesterol without sample pretreatment. Clin. Chim. Acta 2010, 411, 1361–1366. [Google Scholar] [CrossRef] [PubMed]
- Xuesong, F.; Enshi, W.; Jianxun, H.; Lei, Z.; Xiaoli, Z.; Hui, Y. Comparison of seven different reagents of peroxidase method for small and dense low density lipoprotein cholesterol (sdLDL-C) measurement. J. Clin. Lab. Anal. 2021, 35, e23660. [Google Scholar] [CrossRef]
- Amor, A.J.; Pinyol, M.; Solà, E.; Catalan, M.; Cofán, M.; Herreras, Z.; Amigó, N.; Gilabert, R.; Sala-Vila, A.; Ros, E.; et al. Relationship between noninvasive scores of nonalcoholic fatty liver disease and nuclear magnetic resonance lipoprotein abnormalities: A focus on atherogenic dyslipidemia. J. Clin. Lipidol. 2017, 11, 551–561.e7. [Google Scholar] [CrossRef]
- Cromwell, W.C.; Otvos, J.D. Low-density lipoprotein particle number and risk for cardiovascular disease. Curr. Atheroscler. Rep. 2004, 6, 381–387. [Google Scholar] [CrossRef]


| HC (n = 14) | PGC (n = 36) | GGC (n = 36) | |
|---|---|---|---|
| Age (years) | 53.8 ± 5.23 | 55.8 ± 9.41 | |
| Sex (m/f) | 10/4 (71.4) | 25/11 | |
| BMI (kg/m2) | 28.28 ± 4.98 | 33.53 ± 7.27 # | 31.87 ± 5.59 *# |
| Weight (kg) | 81.72 ± 15.55 | 95.07 ± 19.38 # | 90.05 ± 14.18 *# |
| WC (cm) | 97.14 ± 8.84 | 109.41 ± 14.68 # | 107.59 ± 11.61 *# |
| Smoking habit | 4 (28.6) | 10 (27.8) | 10 (27.8) |
| Dyslipidemia | 0 (0) | 12 (33.3) # | 10 (27.8) |
| Hypertension | 2 (14.3) | 12 (33.3) # | 12 (33.3) |
| Hypoglycemic treatment | |||
| Metformin | - | - | 30 |
| Empaglifozin | - | - | 33 |
| aGLP1 | - | - | 2 |
| DPP4i | - | - | 4 |
| HC (n = 14) | PGC (n = 36) | GGC (n = 36) | |
|---|---|---|---|
| HbA1c (%) | 5.4 ± 0.2 | 11.7 ± 2.1 # | 6.1 (0.77) *# |
| Glucose (mg/dL) | 88.9 ± 10.2 | 157.5 ± 66.6 # | 117.2 ± 20.3 *# |
| C-peptide (pmol/L) | nd | 841 (642.1) | 1034 (301.5) |
| Bilirubin (µmol/L) | 12.5 ± 4.8 | 10.8 ± 4.3 | 10.5 ± 3.6 |
| AST (U/L) | 22.62 ± 4.3 | 34.4 ± 17.7 # | 22.9 ± 13.2 *# |
| ALT (U/L) | 22.64 ± 9.1 | 42.9 ± 22.8 # | 27.9 ± 19.0 *# |
| ALP (U/L) | 70.4 ± 12.8 | 97.5 ± 25.5 # | 84.9 ± 19.1 *# |
| GGT (U/L) | 24.9 ± 11.4 | 52.6 ± 62.2 # | 35.2 ± 41.6 *# |
| CRP (mg/L) | 1.3 (1.72) | 7.7 (7.4) # | 2.35 (5.05) *# |
| Lipid profile | |||
| Cholesterol (mg/dL) | 194.6 ± 39.84 | 189.84 ± 37.61 | 180.91 ± 47.92 |
| Triglyceride (mg/dL) | 69.48 (61.06) | 141.6 (101.82) # | 132.8 (67.26) # |
| HDLc (mg/dL) | 54.46 ± 12.31 | 40.08 ± 9.37 # | 45.03 ± 8.47 *# |
| LDLc (mg/dL) | 123.01 ± 33.04 | 119.80 ± 31.65 | 105.56 ± 37.82 |
| VLDLc (mg/dL) | 14.0 (12.3) | 31.01 ± 12.11 # | 26.77 (13.02) # |
| Lp(a) (mg/L) | 241.7 ± 215.1 | 234.5 ± 277.3 | 266.9 ± 297.7 |
| Apolipoprotein | |||
| ApoB (g/L) | 0.93 ± 0.25 | 1.07 ± 0.26 # | 0.94 ± 0.31 |
| ApoA-I (g/L) | 1.65 ± 0.26 | 1.31 ± 0.23 # | 1.43 ± 0.24 *# |
| ApoA-II (mg/L) | 43.83 ± 4.93 | 34.19 ± 6.53 # | 37.42 ± 6.31 *# |
| ApoC-III (mg/L) | 8.22 (6.58) | 7.61 (6.64) | 8.57 (8.8) |
| ApoE (mg/L) | 5.76 ± 1.60 | 5.85 ± 1.81 | 5.33 ± 1.75 |
| HDL Composition | p | r |
|---|---|---|
| % cholesterol | 0.597 | −0.063 |
| % triglycerides | 0.268 | 0.133 |
| % phospholipids | 0.252 | 0.138 |
| % free cholesterol | 0.072 | −0.214 |
| % esterified cholesterol | 0.847 | 0.023 |
| % apo A-I | 0.023 | −0.268 |
| % apo A-II | 0.707 | 0.045 |
| % apo E | 0.391 | −0.103 |
| % apo C-III | 0.035 | 0.251 |
| HDL Function | ||
| Total PAF-AH | 0.356 | 0.111 |
| PAF-AH in HDL (nmol/min/mL) | 0.176 | 0.162 |
| PAF-AH in HDL (%) | 0.25 | 0.137 |
| HDL2 | 0.901 | 0.015 |
| HDL3 | 0.901 | −0.015 |
| Antioxidant capacity of HDL | 0.584 | −0.067 |
| HDL susceptibility to oxidation | 0.738 | −0.041 |
| LDL Composition | p | r |
|---|---|---|
| % cholesterol | 0.848 | −0.023 |
| % triglycerides | 0.822 | −0.027 |
| % phospholipids | 0.495 | 0.082 |
| % free cholesterol | 0.068 | −0.217 |
| % esterified cholesterol | 0.360 | 0.110 |
| % apo A-I | 0.789 | −0.032 |
| % apo E | 0.501 | −0.081 |
| % apo C-III | 0.755 | −0.037 |
| LDL Function | ||
| LDL susceptibility to aggregation | 0.258 | −0.135 |
| LDL(-) | 0.807 | −0.029 |
| LDL size | 0.007 | −0.320 |
| LDL susceptibility to oxidation | 0.252 | −0.143 |
| Bivariate Analysis | β | p |
|---|---|---|
| Age | 0.413 | <0.001 |
| BMI | 0.300 | 0.009 |
| GGT | 0.467 | <0.001 |
| LDLsize | −0.372 | 0.002 |
| HbA1c | 0.237 | 0.049 |
| Tg | 0.189 | 0.111 |
| %ApoAI in HDL | −0.22 | 0.065 |
| %ApoCIII in HDL | 0.198 | 0.098 |
| β | p | R2 | |
|---|---|---|---|
| Age | 0.484 | <0.001 | 0.505 |
| Sex | 0.164 | 0.085 | |
| BMI | 0.164 | 0.089 | |
| LDL size | −0.268 | 0.01 | |
| GGT | 0.343 | 0.001 |
Disclaimer/Publisher’s Note: The statements, opinions and data contained in all publications are solely those of the individual author(s) and contributor(s) and not of MDPI and/or the editor(s). MDPI and/or the editor(s) disclaim responsibility for any injury to people or property resulting from any ideas, methods, instructions or products referred to in the content. |
© 2025 by the authors. Licensee MDPI, Basel, Switzerland. This article is an open access article distributed under the terms and conditions of the Creative Commons Attribution (CC BY) license (https://creativecommons.org/licenses/by/4.0/).
Share and Cite
Rives, J.; Gil-Millan, P.; Viladés, D.; García-Osuna, Á.; Genua, I.; Miñambres, I.; Grau-Agramunt, M.; Gich, I.; Puig, N.; Benitez, S.; et al. Low-Density Lipoprotein Subfraction Phenotype Is Associated with Epicardial Adipose Tissue Volume in Type 2 Diabetes. J. Clin. Med. 2025, 14, 862. https://doi.org/10.3390/jcm14030862
Rives J, Gil-Millan P, Viladés D, García-Osuna Á, Genua I, Miñambres I, Grau-Agramunt M, Gich I, Puig N, Benitez S, et al. Low-Density Lipoprotein Subfraction Phenotype Is Associated with Epicardial Adipose Tissue Volume in Type 2 Diabetes. Journal of Clinical Medicine. 2025; 14(3):862. https://doi.org/10.3390/jcm14030862
Chicago/Turabian StyleRives, José, Pedro Gil-Millan, David Viladés, Álvaro García-Osuna, Idoia Genua, Inka Miñambres, Margarida Grau-Agramunt, Ignasi Gich, Nuria Puig, Sonia Benitez, and et al. 2025. "Low-Density Lipoprotein Subfraction Phenotype Is Associated with Epicardial Adipose Tissue Volume in Type 2 Diabetes" Journal of Clinical Medicine 14, no. 3: 862. https://doi.org/10.3390/jcm14030862
APA StyleRives, J., Gil-Millan, P., Viladés, D., García-Osuna, Á., Genua, I., Miñambres, I., Grau-Agramunt, M., Gich, I., Puig, N., Benitez, S., Julve, J., Pérez, A., & Sánchez-Quesada, J. L. (2025). Low-Density Lipoprotein Subfraction Phenotype Is Associated with Epicardial Adipose Tissue Volume in Type 2 Diabetes. Journal of Clinical Medicine, 14(3), 862. https://doi.org/10.3390/jcm14030862