Abstract
Background/Objectives: Patient-reported outcome measures (PROMs) and clinician-reported outcome measures (CROMs) are used in orthopaedic rehabilitation to evaluate patients’ health status and recovery. However, controversy still exists regarding their relevance and validity. This evaluation was conducted to assess the effectiveness and role of PROMs and CROMs in the orthopaedic rehabilitation outcome of patients who have undergone either total knee arthroplasty or hip arthroplasty. Methods: Outcome measures of 409 patients (68.3 ± 9.3 years; 34.2% male) with total knee arthroplasty and 308 patients (68.1 ± 10.6 years; 36.3% male) with total hip arthroplasty (control group) were assessed at baseline and after 21 days of inpatient rehabilitation. Effect sizes and correlations were analysed as they related to the use of PROMs and CROMs. To reduce statistical distortions caused by ceiling effects, we used a performance score (T2D) relying on two scores taken at the beginning and end of rehabilitation. Results: Large effect sizes (d > 0.97) for CROMs and medium effect sizes (d ≥ 0.65) for PROMs were observed in both groups. The standardised mean difference across all outcomes was 0.83 ± 0.59. PROMs worsened in 13.1% of all patients, while almost no patients showed a deterioration in CROMs. Correlations were highest between the Timed Up and Go and the Health Assessment Questionnaire scores (ρ > 0.45). Conclusions: Different and complementary assessment modalities of PROMs and CROMs serve as valuable clinical tools, providing a valid basis for interpreting patients’ health outcomes.
1. Introduction
Given the rising prevalence of hip and knee arthroplasties [1], ensuring the effectiveness of rehabilitation has become crucial. Consequently, outcome assessment plays a pivotal role in determining the most effective and efficient rehabilitation strategies to optimise recovery and functional outcomes. Different methods are used to evaluate the success of rehabilitation programmes, monitor treatment progress, and record patients’ impressions or expectations. Clinically based, performance-based, observer-reported, and patient-reported outcome measures are frequently used [2,3]. However, in joint replacement studies, outcome measures show high levels of variability due to the different scoring systems and heterogeneous reporting methods [4,5,6,7,8].
For a long time, the focus of outcome measures was predominantly directed towards clinical parameters recorded by conducting laboratory tests or performance measurements, summarised as clinician-reported outcome measures (CROMs) [9]. Following knee or hip arthroplasty, these typically include range of motion (ROM), stability, complication rates, and radiological parameters [10,11,12,13,14]. ROM measurements are carried out using goniometers, smartphone apps, or radiological joint angle determination [15,16]. Performance-based tests such as the 30 s chair-stand test, the 40-metre fast walk test, and the Timed Up and Go Test (TUG) are used for functional assessment [17]. The TUG measures the time it takes a person to stand up from a chair, reach a line three metres away, turn, and return to their starting position [18]. This test quantifies performance with tasks mimicking activities of daily living; the 6 min walk (6 MW) or the stair-climbing test (SCT) are also reliable performance tests that provide information about functional capacity in everyday situations [19].
Patient-reported outcome measures (PROMs) record subjective complaints and functional limitations and supplement clinical findings in patient-centred care [20,21]. PROMs may be useful for screening (e.g., to identify hidden problems), monitoring (e.g., to overview the effectiveness of therapies), strengthening patient-centred care (e.g., to achieve a higher patient compliance), and assessing the quality of care (e.g., to discover the strengths and weakness of therapies) [3]. These measures can be categorised as either generic or specific instruments. Generic measures provide a broad health quality assessment for different diseases and populations [22]. The Health Assessment Questionnaire (HAQ) measures disability, pain, medication effects, cost of care, and mortality [23]. The EQ-5D assesses mobility, self-care, daily activities, pain/discomfort, and anxiety/depression [24]. Visual analogue scales (VAS), verbal rating scales (VRS), and numerical pain scales (NPRS) are used to assess subjective pain [25,26]. Specific PROMs allow for a detailed assessment of specific conditions [27]. The Western Ontario and McMaster Universities Osteoarthritis Index (WOMAC) was developed to evaluate pain, stiffness, and function in people with knee and hip osteoarthritis [2,3,28,29,30].
Despite the potential for both PROMs and CROMs to demonstrate characteristic changes during rehabilitation, studies have demonstrated only a modest correlation between them [5,13,14,31,32,33,34,35,36], typically ranging from 0.4 to 0.6 [36,37,38]. This finding suggests that PROMs and CROMs may reflect distinct aspects of recovery. Fluctuations in the results of PROMs and CROMs can occur independently of each other and lead to a discrepancy between subjectively perceived and objectively measured recovery. This discrepancy can have clinical implications, as inadequate recognition of patients’ subjective complaints or functional improvements makes it difficult to accurately assess treatment success. This can lead to impairment of the adaptation of therapy to specific rehabilitation needs. Despite the relevance of this topic, recent studies have often considered PROMs and CROMs in isolation without systematically investigating their complementary or differentiating functions [9,11,13,21]. An in-depth understanding of the synergistic potential of an integrated assessment has not yet been comprehensively established. Furthermore, current clinical guidelines lack clear recommendations on the weighting and prioritisation of the results of PROMs and CROMs in the context of primary and secondary outcome measures. It is therefore crucial to precisely define these interrelationships in order to develop evidence-based guidelines for optimised and individualised rehabilitation assessment.
The aim of this study was to investigate the correlation and changes in PROMs and CROMs in patients undergoing total knee arthroplasty and compare these with the outcomes of patients undergoing total hip arthroplasty. By comparing these outcome measures across groups, the respective and complementary roles of PROMs and CROMs in the assessment of postoperative recovery in the context of orthopaedic rehabilitation were evaluated.
2. Materials and Methods
2.1. Aim, Design, and Setting of the Study
This cohort study was conducted to analyse changes and correlations between CROMs and PROMs at the beginning (t1) and end (t2) of orthopaedic rehabilitation (<19 days in-between) to describe the measurement properties of CROMs and PROMs in the recovery process after knee arthroplasty and hip arthroplasty, and to compare these. We applied a distribution-based approach that dynamically adjusts the final discharge score by systematically accounting for the individual improvement observed throughout the rehabilitation process. This method ensures a more accurate and individualised assessment of rehabilitation success, referred to as the ‘stratified performance score T2D’ [36,39]. This alternative metric adjusts discharge health status (t2) by observed changes in status over time (t2 − t1). In this approach, the initial values (t1) are taken into account in the valuation, while considering mathematical coupling between t1 and t2 − t1 (c.f., Section 2.2.3).
In Austria, all total joint replacement (TJR) patients are offered inpatient rehabilitation for 21 days [40]. According to the WHO definition, this rehabilitation includes a phase II follow-up treatment or post-acute therapy in specialised rehabilitation centres. The patient must fulfil three conditions to be eligible for medical rehabilitation: they must demonstrate a need for rehabilitation, be suitable for rehabilitation (motivated and able to participate in rehabilitation care), and be able to achieve the specific goal of rehabilitation care within a certain time frame [41]. The mean period between acute care (surgery) and rehabilitation for orthopaedic patients who have undergone a surgery of the knee or hip is around 10 weeks [37].
This study was conducted at the Rehabilitation Center Kitzbühel, a specialised orthopaedic facility in Austria, and included patients who had undergone total hip or knee arthroplasty. All participants completed a structured 21-day inpatient programme based on national standards for musculoskeletal rehabilitation. The programme featured two daily physiotherapy sessions (30–45 min), combining individual and group exercises to improve mobility, strength, proprioception, and gait. Additional components included functional training, occupational therapy when indicated, and standardised education on joint protection, pain management, and physical activity. Therapy intensity was adjusted to individual capacity, while the overall structure and frequency of interventions remained consistent. All treatments were delivered by licensed professionals under interdisciplinary supervision according to institutional guidelines.
The patients were fully informed of the data content and purpose of its use and had given their written informed consent for its scientific use. The Ethics Committee of the Medical University of Innsbruck approved the study protocol on 23 August 2019 (Ref: EC Nr: 1158/2019). It was retrospectively entered into the German Clinical Trials Register on 14 August 2020 (DRKS, registration number: DRKS00022854).
2.2. Outcome Measures
At the beginning (t1) and the end of rehabilitation (t2), clinician-reported data (CROMs) and self-reported data (PROMs) were collected.
2.2.1. Clinical Anthropometric Measures and Clinician-Reported Outcome Measures (CROMs)
Before the study started, the clinicians and therapists involved in the outcome measurements participated in a standardised training course on data collection to ensure that valid, reliable, and reproducible ROM and TUG data were collected. Experienced therapists used a conventional goniometer to measure the range of motion (ROM) of the knee and hip joints to ensure a high reliability for the longitudinal assessments. ROM calculations were based on reference values representing the range of motion as a percentage of the generally accepted normal range of the American Academy of Orthopaedic Surgeons (AAOS) active range of motion score [42,43]. Functional mobility was assessed using the TUG test. For the statistical analysis, TUG and ROM data were combined, and a mean value was calculated using the z-transformation to obtain a mean CROM score (mean CROMs).
2.2.2. Patient-Reported Outcome Measures (PROMs)
PROMs were recorded using the following instruments: WOMAC, NPRS, HAQ, and EQ-5D (TTO score and EQ-VAS) [44]. A shortened version of the HAQ, the HAQ-DI, was used in this study [23]. This questionnaire comprises 20 items divided into eight categories, which enables a comprehensive assessment of functional activities. For the statistical analysis, all PROMs were combined, and a mean score was calculated using the z-transformation to obtain the mean PROM score (mean PROMs). An overall medical quality index (MQOidx) was calculated from the mean value of the individual PROMs and the mean value of the TUG and ROM (mean CROMs).
2.2.3. T2D Performance Scores
Using objective measures of joint mobility can lead to ceiling effects, as some patients already have good scores or reach successful endpoints quickly. For example, if a patient has good knee mobility when starting rehabilitation or can perform the TUG in an acceptable period, a large increase is not expected during rehabilitation. In this case, the patient’s overall performance (healing success) may be good, but only a small increase (improvement) is observed descriptively. This is then interpreted as a low treatment effect or even failure. Therefore, to assess patient performance based on the individual scores, a specific method was used to reflect the fact that the change in scores depends on the patient’s initial functional status [36]. When preoperative scores are not available to assess postoperative progress, the simple formula t2 + (t2 − t1) best reflects performance and takes into account the functional status at the end of rehabilitation and improvements (changes from t1 to t2) [39]. It is possible to interpret ‘performance scores’ using a distribution-based approach in which t2 + (t2 − t1) are transformed into standardised scores with z-transformation or percentiles.
2.3. Statistical Analysis
SPSS Statistics for Windows (Version 27.0. Armonk, NY, USA: IBM Corp) was used for data analysis. For each outcome measure, score differences (Δ) between the beginning (t1, pre-test score) and the end (t2, post-test score) of rehabilitation were calculated and tested for significant changes using t-tests. For multiple comparisons, 2 × 2 MANOVA for repeated measurements was used. Z-values and effect sizes for within-subjects designs were calculated (Cohen’s dz and partial eta-squared, ηp2). Effect sizes were interpreted according to Cohen (Cohen, 1977) [45].
By means of z-standardisation, differently scaled quantities were summarised, and the changes were uniformly quantified for the mean of PROMs and the mean of CROMs. A value of 50% (median) or a z-value of zero corresponded to the mean of admission (t1) and discharge (t2) data for the sample. A z-difference of zero ± 0.20 represents no significant changes from t1 to t2. Negative z-differences (SMD) correspond to an improvement in the outcome measure. Changes from t1 to t2 are revealed by the number of patients (%) that could be improved in statistically relevant ways (categorical presentation). The threshold used was an average z-difference (SMD) of >0.20.
Correlations between CROMs and PROMs were determined using Spearman’s rank correlation coefficients (ρ), as not all data met the normality assumption and linear regression models for both t1 and t2 scores.
The difference between the percentiles of PROMs and CROMs was calculated to show the level of consistency. Performance scores (percentiles) for each outcome measure were classified as highly consistent (within one/same tertile), moderately consistent (if the scores ranged between one and two tertiles), or as poorly consistent/discrepant (more than two tertiles of difference between performance scores). By chance, this would result in an equivalence of 33.3% in each category if no correlation existed between the different measured outcomes.
3. Results
Between January and December 2018, a cohort of 717 patients completed the 21-day rehabilitation programme. Of these, 409 patients (34.2% male, n = 140) had undergone total knee arthroplasty, while 308 patients (36.3% male, n = 112) had undergone total hip arthroplasty. The mean age (±SD) in the knee group was 68.3 ± 9.3 years and in the hip group, 68.1 ± 10.6 years. All patients completed the full three-week rehabilitation programme. The average duration of the individual therapy received was 461.4 ± 109.9 min in the knee group and 468.0 ± 100.0 min in the hip group.
Table 1 summarises the changes in the scores and effect sizes in both groups (main effect time, all p < 0.001; ηp2 multivariate = 0.694). Large effect sizes (Cohen’s dz > 0.97) for CROMs (ROM and TUG) were observed in both groups. Medium effect sizes (d ≥ 0.65) were observed for the WOMAC (pain, function, and total score) and NPRS in the knee group and for the HAQ and the WOMAC (function and total score) in the hip group.

Table 1.
PROMs and CROMs in the knee and hip group. Quality-of-outcome measures were assessed and documented in the discharge report at the beginning (t1) and end (t2) of the 21-day inpatient rehabilitation programme. Statistically significant improvements were observed for all outcome measures in the knee group (all p < 0.001; ηp2 multivariate = 0.745) and the hip group (all p < 0.001; ηp2 multivariate = 0.670).
The overall Medical Outcome Quality (MQOidx; mean value from PROMs and CROMs) improved in 87.7% of patients by the end of rehabilitation (cut-off: z-difference (t2 − t1) < −0.20). In 9.5%, the status remained unchanged, while 2.8% showed a deterioration (>0.20). Significant baseline differences (t1) existed for NPRS, HAQ, WOMAC (pain, stiffness, total score), and ROM (p < 0.05; ηp2 = 0.183). CROMs responded more strongly than PROMs: 89.9% of patients improved (knee: 92.4%, hip: 86.4%), and 10.2% remained unchanged, showing no deterioration. In contrast, 71.3% of patients in the PROMs improved, 15.6% remained stable, and 13.1% deteriorated (knee: 12.2%, hip: 14.3%).
Table 2 summarises the correlations between CROMs and PROMs at the beginning (t1) and end (t2) of rehabilitation. The observed correlations and linear regression models were similar at the different time points. In the knee group, only the TUG showed a clear correlation with the HAQ at the beginning (ρ = 0.54) and at the end of rehabilitation (ρ = 0.46). Overall, the correlations between the PROMs and CROMs were less pronounced in this group, especially for t2, where a linear regression between all individual PROMs (EQ-5D, NPRS, HAQ, and WOMAC) and the mean CROMs (TUG and ROM) yielded an R2 of 0.29 (t1) and 0.19 (t2). Compared to the hip group, a strong positive correlation was found between the HAQ and the TUG [t1: ρ = 0.65; t2: ρ = 0.63] as well as a moderate negative correlation between the HAQ and the ROM [t1: ρ = −0.45; t2: ρ = −0.46]. The WOMAC also showed a strong positive correlation with the TUG (ρ ≥ 0.52). The linear regression between all individual PROMs and the mean CROMs resulted in an R2 of 0.34 (t1) and 0.39 (t2) for the hip group. Similar associations (cf. regression coefficients) can be observed in patients with total hip arthroplasty, as the multiple regression model shows for t1 CROMHIP = −0.007*EQ-VAS + −0.048*EQ-5D TTO + −0.119*NPRS + 0.456*HAQ + 0.184*WOMAC (R2 = 0.341, p = 0.000 **, c = −0.348) and for t2 CROMHIP = 0.039*EQ-VAS + −0.131*EQ-5D TTO + −0.068*NPRS + 0.424*HAQ + 0.189*WOMAC (R2 = 0.385, p = 0.000 **, c = 0.083).
Table 2.
Correlations between PROMs and CROMs in t1 and t2 for the knee group. The correlations and linear regression models were similar at the different time points. The associations between PROMs and the TUG were more pronounced than those between PROMs and the ROM. The strongest relationship to CROMs could be found with the HAQ. The correlation for changes between averaged PROMs and CROMs is 0.19 and ρ = 0.17 for the performance score.
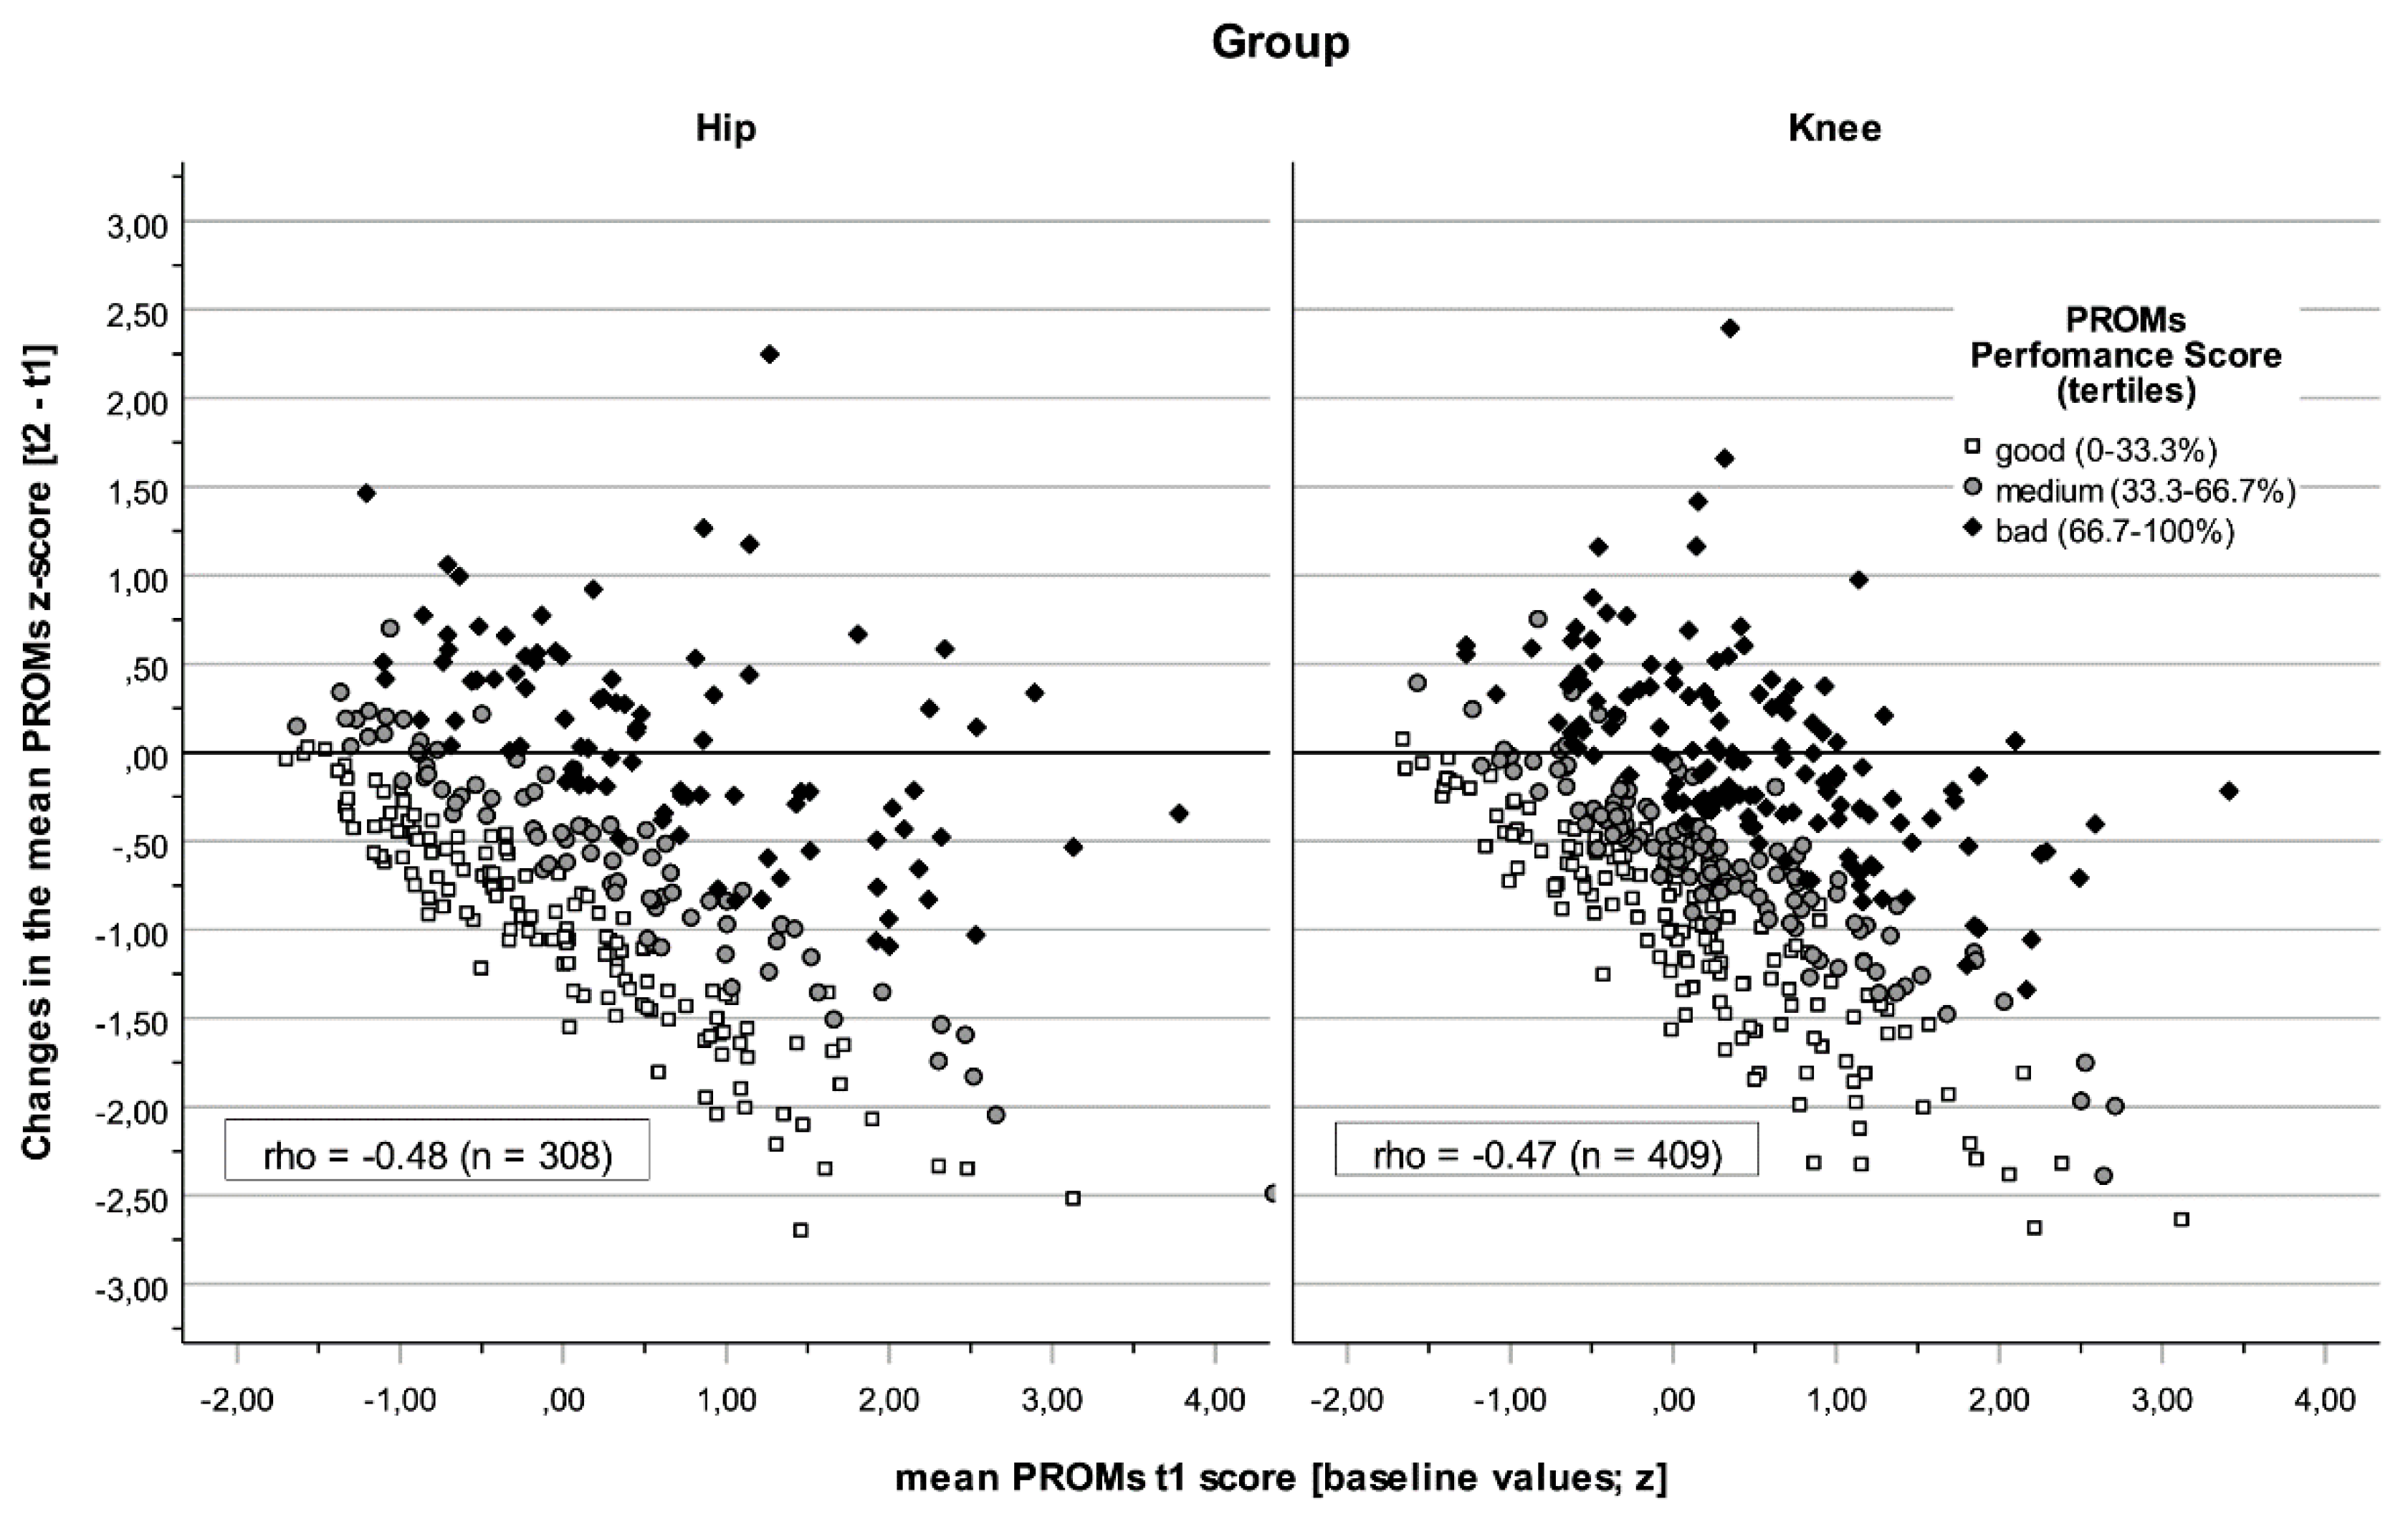
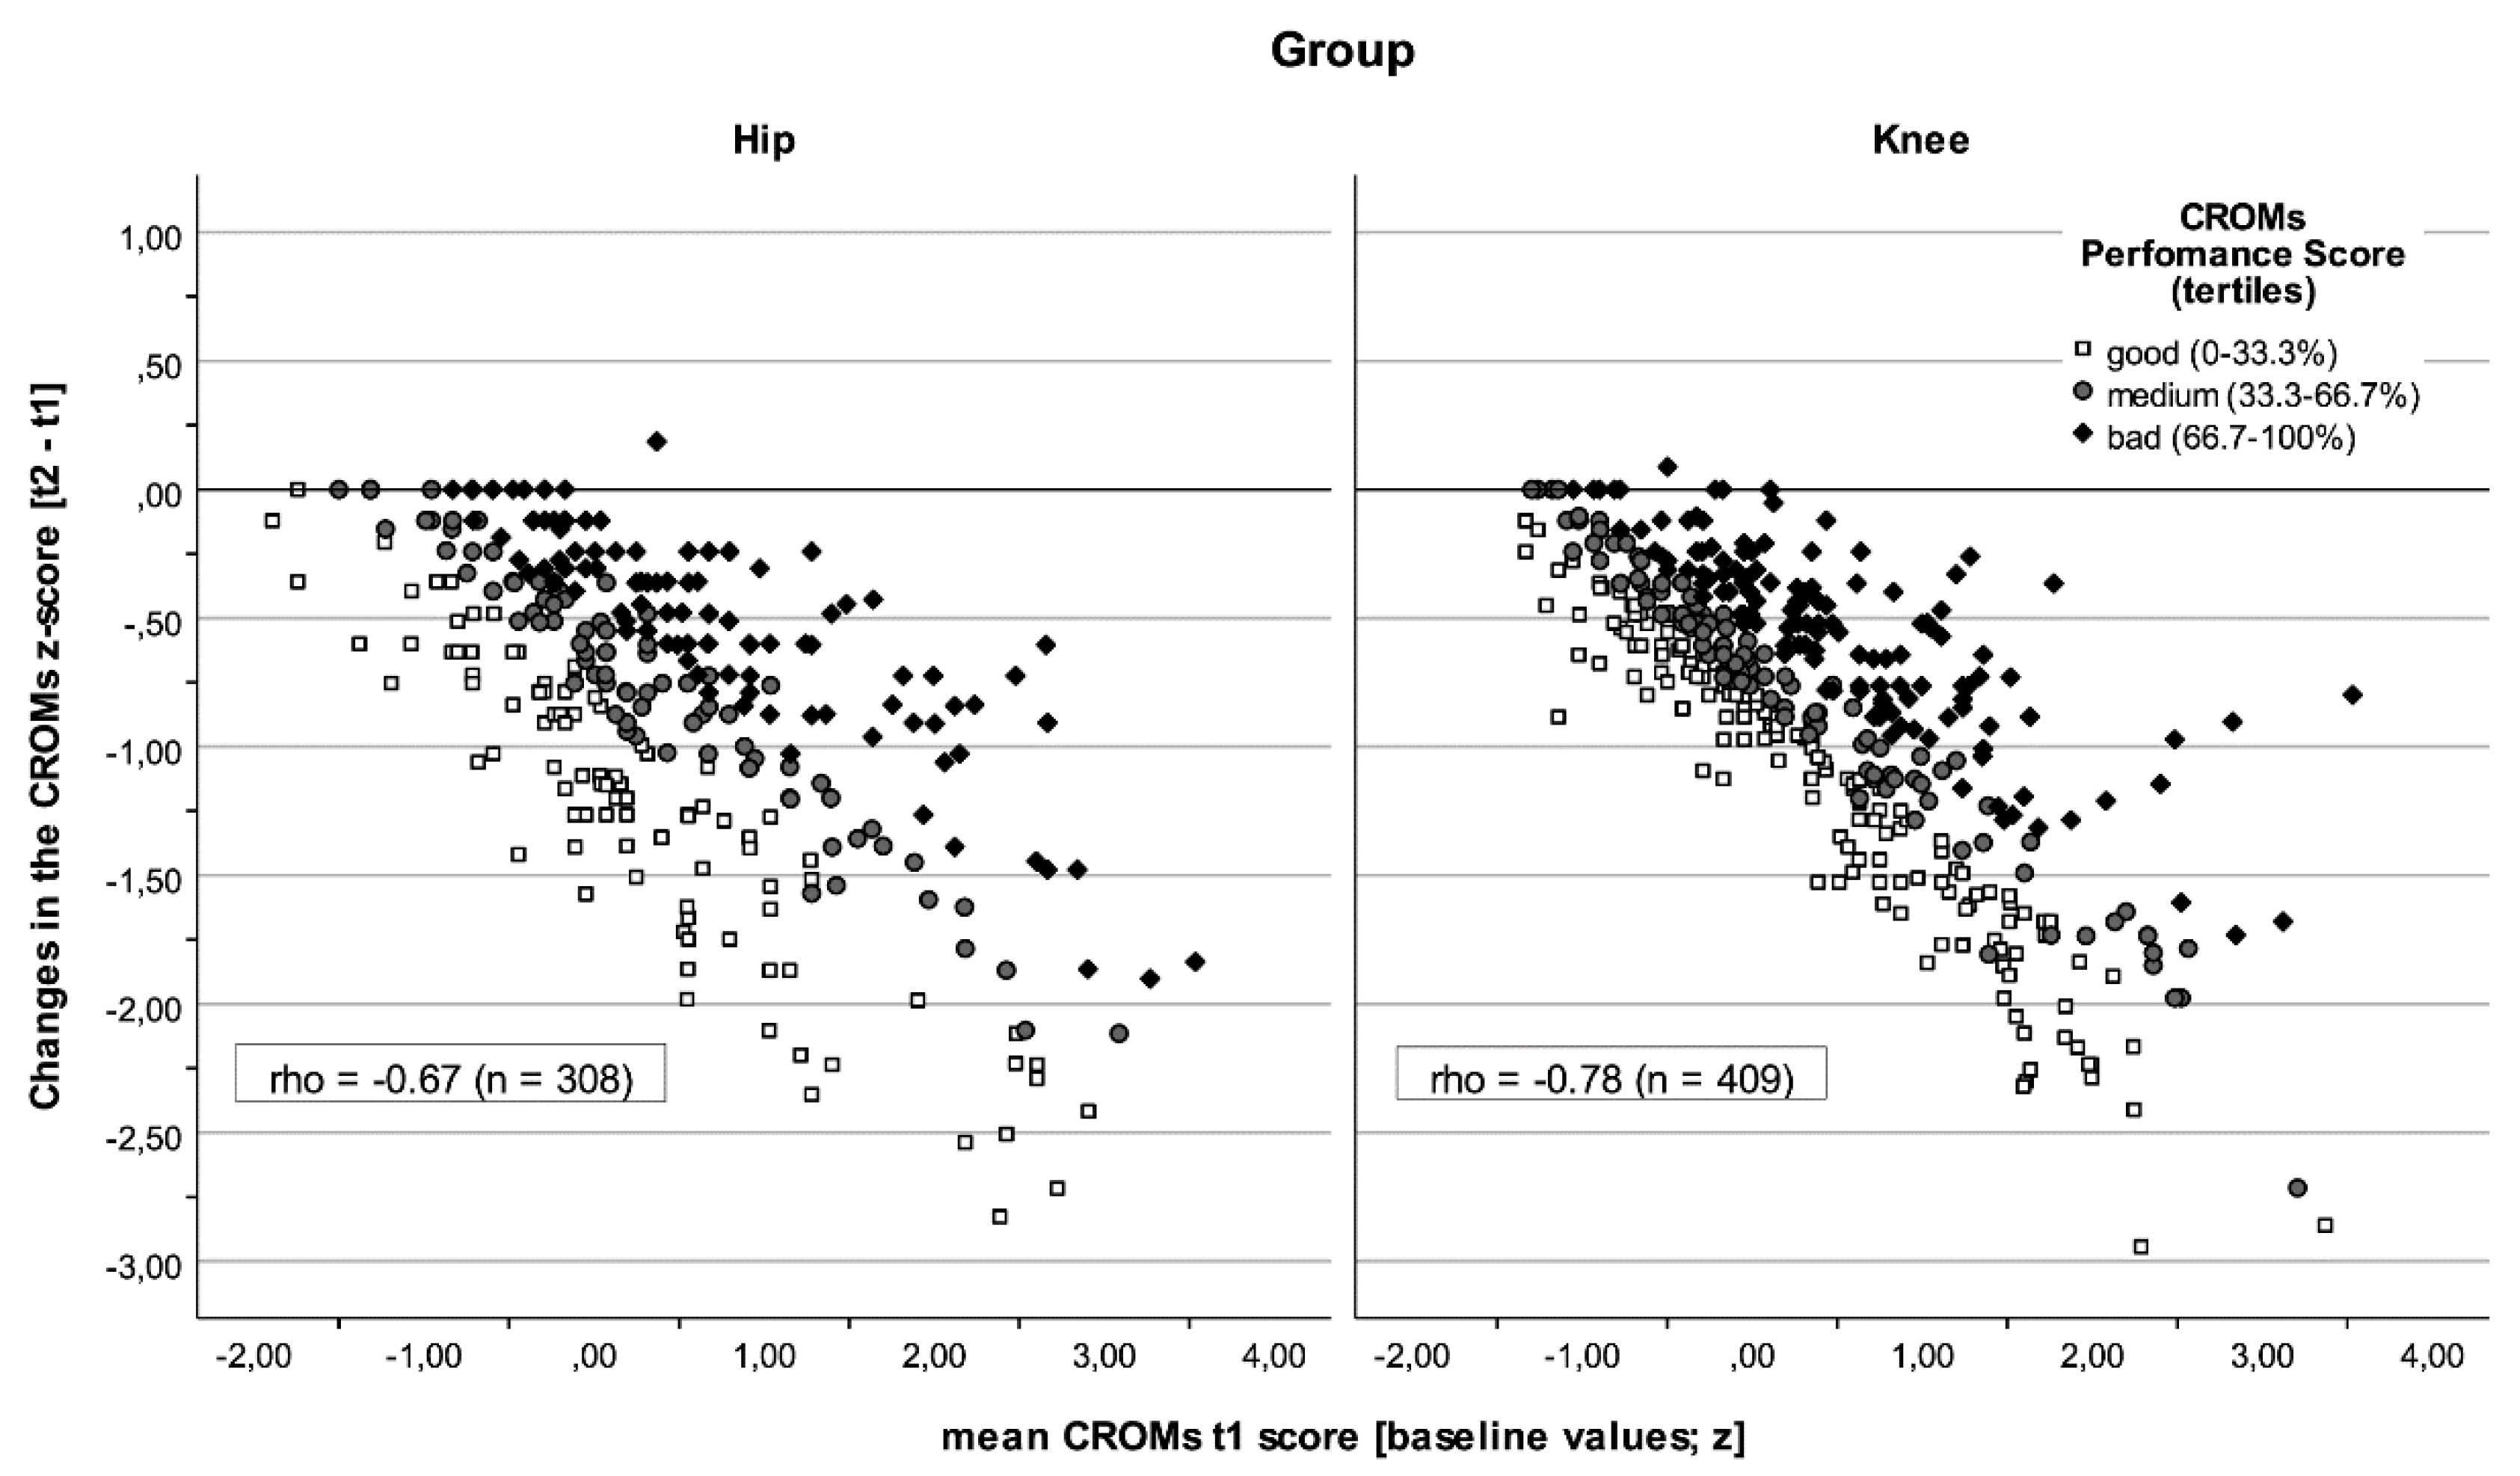
The behaviours of the PROMs and CROMs at the beginning of rehabilitation and in relation to the change are shown in Figure 1 and Figure 2. A general trend was observed that the values improved throughout rehabilitation. Some patients’ results worsened significantly as reflected by PROMs but not by CROMs in both groups (see also Table 1 and Table 2). Two effects were observed. First, the differences between the groups were less pronounced; the correlations were similar, but a stronger relationship was seen between the baseline values and their changes in CROMs for the knee group (ρ knee = −0.78 vs. ρ hip = −0.67, p = 0.002). Second, PROM baseline scores were more homogeneous in the knee group (Levene Test p = 0.001), as were changes in CROMs (p = 0.048).

Figure 1.
The performance of patients with total knee or hip arthroplasty in PROMs. Dots represent the mean PROMs score at the beginning of rehabilitation (x-axis) and their changes (y-axis). Classified performance score markers (t2 + Δ) based on normal scores (tertiles); The baseline scores (t1) were more homogeneous in the knee group (left-hand panel; SD = 0.93) than in the hip group (right-hand panel; SD = 1.10; Levene Test p = 0.001).

Figure 2.
The performance of patients with total knee or hip arthroplasty in CROMs. Dots represent the mean CROM score at the beginning of rehabilitation and its changes. Classified performance score markers based on normal scores (tertiles). The standard deviation between groups was more homogeneous in CROM-changes for the knee group (SD Knee = 0.57 vs. SD Hip = 0.69, p = 0.048). The hip group (left-hand panel) showed a weaker correlation (ρ = −0.67) between output value (t1) and its change.
4. Discussion
In this observational cohort study, we investigated changes in functional outcomes during rehabilitation after knee arthroplasty and hip arthroplasty, particularly focusing on the measurement properties and responsiveness of PROMs and CROMs. Our results show that CROMs have larger effect sizes than PROMs, indicating that these objective testing procedures are more sensitive for capturing functional improvements. While significant functional improvement was achieved in the knee and the hip group, PROM scores worsened in 13.1% of patients. This could indicate different subjective experiences of functional improvement or a discrepancy between the objective and subjective assessments of rehabilitation progress. The stability of the correlations over time and between the patient groups (Table 2) emphasises the methodological reliability of the assessments used. The similarity of the results obtained for knee and hip patients speaks in favour of the robust applicability of the investigated measurement instruments in both groups.
Correlations between CROMs and PROMs were most pronounced for TUG and HAQ scores. Weaker correlations could be observed between the ROM and PROMs. Therefore, the TUG test results reflect comparable PROM functions and limitations in patients undergoing hip or knee arthroplasty more accurately than the ROM. It should be noted that TUG and ROM capture different functions or modalities. This is especially true for knee patients, where the correlation between ROM and TUG is remarkably low (ρ = −0.21). However, in more than half of the cases, this seems to have had a lower impact on the consistency classification of the performance evaluation, whereby the level of agreement between the individual PROMs and combined CROMs is similar in both patient groups.
The moderate correlations between PROMs and CROMs observed in this study are supported by the literature [37,38,46,47]. Performance-based tests of physical function (CROMs) offer healthcare professionals the opportunity to objectively record what patients can actually do, while PROMs are based on patients’ subjective assessments of their abilities. These methodological differences explain the frequently observed moderate correlations between the two measurement approaches [5,13,14,31,32,33,34,35,36]. The TUG is one of the performance-based tests recommended by the Osteoarthritis Research Society International (OARSI) [17] and provides a means of practically assessing functional mobility. Our results show that the TUG reliably represents patients’ mobility abilities and correlates closely with PROMs of functional limitation, particularly with the HAQ. This could be due to the test design, which integrates everyday movement patterns [48]. In contrast, the ROM measurements correlated less strongly with PROMs, suggesting that this biomechanical measure allows only limited conclusions to be drawn about perceived functional limitations.
Another important aspect is the temporal development of the correlations between PROMs and CROMs. The results of the study show that CROMs, in particular ROM and TUG, have a high sensitivity for detecting functional improvement in the acute postoperative period, whereas PROMs are more indicative of long-term clinical outcomes [19,49,50]. This change in sensitivity may occur because objective functional improvement is more easily measurable immediately after surgery, while subjectively perceived improvement emerges gradually as the patient adapts to the new joint replacement. Other studies have shown that postoperative changes are particularly significant in the subacute phase (approximately one month after arthroplasty). Comparisons of the results in this period show contradictory or even reversed courses of functional improvement [51,52]. This emphasises the need for a targeted temporal adjustment of the assessment instruments in the recovery process. While objective measures provide a more reliable basis for assessing functional improvement in the early phases of rehabilitation, PROMs may play a greater role in later phases as they reflect the long-term integration of functional improvements into daily life. Future research should investigate how the optimal timing for the use of these tools can be defined to enable more precise course control and tailored treatment decisions.
There are obvious interdependencies between patient-reported outcomes and performance measures, but these are used to evaluate different outcomes and to assess complementary, important modalities in orthopaedic rehabilitation. Our finding is consistent with those of Stratford et al. [53], who proposed that self-reported outcomes and performance measures can be used to assess different aspects of physical function. These authors concluded that self-report measures provide information about the experience of performing the task, while performance measures contain information about the ability to perform the task. A gap often occurs between personal intention and patient behaviour, e.g., between high self-efficacy and a positive attitude towards physical activity, although this does not necessarily lead to increased physical activity [54]. Due to the tight schedule and the intensive rehabilitation process, this effect could be directly noticed and distinguished in our patients in this study. We observed that better mobility was associated with an increase in all reported endpoints, but the relationships between the different measurement modalities were not always clear. These findings agree with those of Melzer et al. [55], who reported detecting poor-to-moderate associations between performance-based measures and self-reported functional status in older patients. The discrepancy between objective functional improvements and subjective complaints can be explained by several mechanisms. In addition to the inherent subjectivity of patient-reported outcomes, neurophysiological processes [56], motor adaptation strategies [57], and sociocultural factors [58] also play a decisive role. Central nervous sensitisation and altered pain inhibition can lead to patients continuing to experience pain despite objective functional improvement. Neurotransmitters such as serotonin and dopamine influence pain processing and could explain the difference between objective measurements and subjective perception [56]. In addition, compensatory movement patterns can contribute to the discrepancy between objective and subjective results. Modified postures or altered gait patterns can maintain or even improve functionality without reducing the perception of pain [57]. This emphasises that a purely objective assessment of functional improvement may be incomplete and may not adequately reflect the subjective burden of patients.
The study results emphasise the need for a multidimensional assessment approach in musculoskeletal rehabilitation. After surgical interventions such as knee or hip arthroplasty, the combination of objective and subjective measurement methods enables not only a more comprehensive assessment of functional improvements but also the identification of neurophysiological regulatory mechanisms. This knowledge can be used specifically to optimise rehabilitation strategies, promote a more sustainable recovery of mobility, and determine the optimal time to use these assessment tools.
Compared to international studies, such as that of Monselli et al. [59], which also investigated postoperative rehabilitation protocols after hip arthroscopy, our results confirm the consensus on the effectiveness of a stepwise rehabilitation approach. The current literature underlines the need for standardised yet flexible and adaptable guidelines that take into account both individual needs and the patient’s activity level. A multidimensional assessment approach that integrates clinical and functional parameters is therefore essential in order to holistically record and specifically optimise rehabilitation outcomes. Our study provides practical evidence by analysing comparative data on PROMs and CROMs in the knee compared to the hip group. The results underline the clinical benefits of the combined use of both methods, as they enable a differentiated assessment of functional progress and thus support individually optimised treatment planning.
4.1. Limitations
This study has some methodological limitations that should be considered when interpreting the results. First, the analysis is based on a cohort from a single specialised rehabilitation centre, which may limit the generalisability of the results to other settings, and especially outpatient rehabilitation or international comparison groups. In addition, rehabilitation in an inpatient setting can influence the recruitment of patients through clinical and socioeconomic factors and thus further distort the results. Second, PROMs can be influenced by subjective factors such as pain perception, mental state, memory, or patient expectations, which can lead to bias. Therefore, the observed discrepancy between PROMs and CROMs could be due to methodological differences and/or inter-individual differences in the patients’ perceptions and self-assessments. Third, a relatively short period of three weeks may not have been sufficient for the clinical condition to reach a stable baseline of improvement. Future studies should consider a longer follow-up period to better capture the long-term effects of rehabilitation and provide a more comprehensive understanding of recovery progress. Finally, we did not stratify the analysis by demographic or clinical subgroups such as age, comorbidities, or preoperative functional levels. Such subgroup analyses could help to identify conditions under which PROMs or CROMs, or their interaction, may be more informative and guide more tailored outcome assessments in clinical practice.
4.2. Clinical Relevance
The results of this study have important clinical implications for rehabilitation after knee and hip arthroplasty. The observed improvements in both PROMs and CROMs confirm the effectiveness of structured rehabilitation programmes and support their continued use in outcome monitoring. The stronger correlation between the TUG test and the PROMs compared to the CROMs suggests that mobility-based performance measures are more consistent with patients’ subjectively perceived function. At the same time, the discrepancy between PROMs and CROMs highlights the need for a multidimensional assessment approach that integrates both subjective and objective parameters. While PROMs reflect the individual perception of pain and stress, CROMs capture objective functional progress. An exclusive focus on PROMs carries the risk of overlooking significant functional improvements. Therefore, clinicians and therapists should systematically include CROMs in their assessment procedures, especially in Phase II of the rehabilitation process. This integrative approach enables early detection of discrepancies, targeted adaptation of therapy, and the development of more individualised treatment strategies. The combined use of PROMs and CROMs can also improve treatment adherence and patient satisfaction, as well as provide a more informed assessment of short- and long-term outcomes.
5. Conclusions
This study demonstrates that PROMs and CROMs capture distinct yet complementary aspects of recovery after knee and hip arthroplasty and that they should not be used interchangeably. While CROMs are more sensitive to short-term functional gains, PROMs reflect the patient’s longer-term perception of recovery. The modest correlation between the two suggests that relying on either alone may lead to incomplete or misleading assessments. The findings support maintaining CROMs in routine clinical practice despite their resource demands. The integration of both types of measures facilitates more precise monitoring of progress, timely adjustment of rehabilitation strategies, and improved alignment between patient needs and clinical decision-making. Future research should focus on refining the timing and choice of outcome measures, as well as their interrelationships, to improve the prediction of long-term rehabilitation success.
Author Contributions
Conceptualisation, A.U., F.P., Š.M., M.J.F. and V.G.; methodology, A.U., F.P. and V.G.; software, F.P., Š.M. and V.G.; validation, A.U., F.P., Š.M., M.J.F. and V.G.; formal analysis F.P., Š.M. and V.G.; investigation, A.U., F.P., Š.M., M.J.F. and V.G.; resources, M.J.F. and V.G.; data curation, F.P., Š.M. and V.G.; writing—original draft preparation, A.U., F.P., Š.M., M.J.F. and V.G; writing—review and editing A.U., F.P., Š.M., M.J.F. and V.G.; visualisation, F.P.; supervision, V.G.; project administration, A.U. and V.G. All authors have read and agreed to the published version of the manuscript.
Funding
This research received no external funding.
Institutional Review Board Statement
The study was conducted in accordance with the Declaration of Helsinki, and the study protocol was approved by the Ethics Committee of the Medical University of Innsbruck on 23 August 2019 (Ref: EC Nr: 1158/2019). It was retrospectively entered into the German Clinical Trials Register on 14 August 2020 (DRKS, registration number: DRKS00022854).
Informed Consent Statement
The patients were fully informed of the content and purpose of the use of their data and had given their written informed consent for scientific use.
Data Availability Statement
The research data supporting this publication are stored in our institutional digital data repository for published research, accessible via https://creed.lbg.ac.at (accessed on 3 March 2025). The data sets analysed in this manuscript are not publicly available due to ethical and legal restrictions, as they contain potentially identifying and sensitive patient information. However, pseudonymised data sets have been created for the purpose of re-use and are also accessible at creed.lbg.ac.at. Requests for access to anonymised data sets should be directed to the corresponding author (V.G.).
Acknowledgments
The authors sincerely thank the team of the Rehabilitation Center in Kitzbühel and their colleagues and the Ludwig Boltzmann Society for their support in the development and execution of this study.
Conflicts of Interest
The authors declare no conflicts of interest.
References
- Maradit Kremers, H.; Larson, D.R.; Crowson, C.S.; Kremers, W.K.; Washington, R.E.; Steiner, C.A.; Jiranek, W.A.; Berry, D.J. Prevalence of Total Hip and Knee Replacement in the United States. J. Bone Jt. Surg. Am. 2015, 97, 1386–1397. [Google Scholar] [CrossRef] [PubMed]
- Alviar, M.J.; Olver, J.; Brand, C.; Tropea, J.; Hale, T.; Pirpiris, M.; Khan, F. Do patient-reported outcome measures in hip and knee arthroplasty rehabilitation have robust measurement attributes? A systematic review. J. Rehabil. Med. 2011, 43, 572–583. [Google Scholar] [CrossRef]
- Zaugg, M.; Baur, H.; Schmitt, K.-U. Applying patient-reported outcome measures (PROMs) in physiotherapy: An evaluation based on the QUALITOUCH Activity Index. Arch. Physiother. 2022, 12, 27. [Google Scholar] [CrossRef] [PubMed]
- Adriani, M.; Becker, R.; Milano, G.; Lachowski, K.; Prill, R. High variation among clinical studies in the assessment of physical function after knee replacement: A systematic review. Knee Surg. Sports Traumatol. Arthrosc. 2023, 31, 3854–3860. [Google Scholar] [CrossRef] [PubMed]
- Kirschner, J.; Michel, S.; Becker, R.; Stiebitz, O.; Hommel, H.; Schulz, R.; Daszkiewicz, M.; Królikowska, A.; Prill, R. Determination of Relationships between Symmetry-Based, Performance-Based, and Functional Outcome Measures in Patients Undergoing Total Hip Arthroplasty. J. Pers. Med. 2023, 13, 1046. [Google Scholar] [CrossRef]
- Lange, T.; Rataj, E.; Kopkow, C.; Lützner, J.; Günther, K.-P.; Schmitt, J. Outcome Assessment in Total Knee Arthroplasty: A Systematic Review and Critical Appraisal. J. Arthroplast. 2017, 32, 653–665.e1. [Google Scholar] [CrossRef]
- Prill, R.; Królikowska, A.; Becker, R.; Karlsson, J. Why there is a need to improve evaluation standards for clinical studies in orthopaedic and sports medicine. Knee Surg. Sports Traumatol. Arthrosc. 2023, 31, 4–5. [Google Scholar] [CrossRef]
- Singh, J.A.; Dohm, M.; Choong, P.F. Consensus on draft OMERACT core domains for clinical trials of Total Joint Replacement outcome by orthopaedic surgeons: A report from the International consensus on outcome measures in TJR trials (I-COMiTT) group. BMC Musculoskelet. Disord. 2017, 18, 45. [Google Scholar] [CrossRef]
- Powers, J.H.; Patrick, D.L.; Walton, M.K.; Marquis, P.; Cano, S.; Hobart, J.; Isaac, M.; Vamvakas, S.; Slagle, A.; Molsen, E.; et al. Clinician-Reported Outcome Assessments of Treatment Benefit: Report of the ISPOR Clinical Outcome Assessment Emerging Good Practices Task Force. Value Health 2017, 20, 2–14. [Google Scholar] [CrossRef]
- Bennell, K.; Dobson, F.; Hinman, R. Measures of physical performance assessments: Self-Paced Walk Test (SPWT), Stair Climb Test (SCT), Six-Minute Walk Test (6MWT), Chair Stand Test (CST), Timed Up & Go (TUG), Sock Test, Lift and Carry Test (LCT), and Car Task. Arthritis Care Res. 2011, 63, S350–S370. [Google Scholar] [CrossRef]
- Reiman, M.P.; Manske, R.C. The assessment of function: How is it measured? A clinical perspective. J. Man. Manip. Ther. 2011, 19, 91–99. [Google Scholar] [CrossRef] [PubMed]
- Reynaud, V.; Verdilos, A.; Pereira, B.; Boisgard, S.; Costes, F.; Coudeyre, E. Core Outcome Measurement Instruments for Clinical Trials of Total Knee Arthroplasty: A Systematic Review. J. Clin. Med. 2020, 9, 2439. [Google Scholar] [CrossRef] [PubMed]
- Vajapey, S.P.; Morris, J.; Li, D.; Greco, N.G.; Li, M.; Spitzer, A.I. Outcome Reporting Patterns in Total Hip Arthroplasty: A Systematic Review of Randomized Clinical Trials. JBJS Rev. 2020, 8, e0197. [Google Scholar]
- Vajapey, S.P.; Morris, J.; Spitzer, A.I.; Glassman, A.H.; Greco, N.J.; Li, M. Outcome reporting patterns in total knee arthroplasty: A systematic review. J. Clin. Orthop. Trauma. 2020, 11, S464–S471. [Google Scholar]
- Kim, S.G.; Kim, E.K. Test-retest reliability of an active range of motion test for the shoulder and hip joints by unskilled examiners using a manual goniometer. J. Phys. Ther. Sci. 2016, 28, 722–724. [Google Scholar]
- Nussbaumer, S.; Leunig, M.; Glatthorn, J.F.; Stauffacher, S.; Gerber, H.; Maffiuletti, N.A. Validity and test-retest reliability of manual goniometers for measuring passive hip range of motion in femoroacetabular impingement patients. BMC Musculoskelet. Disord. 2010, 11, 194. [Google Scholar] [CrossRef]
- Dobson, F.; Hinman, R.S.; Roos, E.M.; Abbott, J.H.; Roos, E.M. OARSI recommended performance-based tests to assess physical function in people diagnosed with hip or knee osteoarthritis. Osteoarthr. Cartil. 2013, 21, 1042–1052. [Google Scholar]
- Huber, E.O.; Meichtry, A.; de Bie, R.A.; Bastiaenen, C.H. Construct validity of change scores of the Chair Stand Test versus Timed Up and Go Test, KOOS questionnaire and the isometric muscle strength test in patients with severe knee osteoarthritis undergoing total knee replacement. Man. Ther. 2016, 21, 262–267. [Google Scholar]
- Dayton, M.R.; Judd, D.L.; Hogan, C.A.; Stevens-Lapsley, J.E. Performance-based versus self-reported outcomes using the HOOS following total hip arthroplasty. Am. J. Phys. Med. Rehabil. 2016, 95, 132–138. [Google Scholar]
- Porter, M.E.; Larsson, S.; Lee, T.H. Standardizing Patient Outcomes Measurement. N. Engl. J. Med. 2016, 374, 504–506. [Google Scholar] [CrossRef]
- Wolpert, M. Uses and abuses of patient reported outcome measures (PROMs): Potential iatrogenic impact of PROMs implementation and how it can be mitigated. Adm. Policy Ment. Health 2014, 41, 141–145. [Google Scholar] [PubMed]
- Patrick, D.L.; Deyo, R.A. Generic and disease-specific measures in assessing health status and quality of life. Med. Care 1989, 27, S217–S232. [Google Scholar]
- Bruce, B.; Fries, J. Longitudinal comparison of the Health Assessment Questionnaire (HAQ) and the Western Ontario and McMaster Universities Osteoarthritis Index (WOMAC). Arthritis Rheum. 2004, 51, 730–737. [Google Scholar] [PubMed]
- Rabin, R.; de Charro, F. EQ-5D: A measure of health status from the EuroQol Group. Ann. Med. 2001, 33, 337–343. [Google Scholar]
- Dworkin, R.H.; Turk, D.C.; Farrar, J.T.; Haythornthwaite, J.A.; Jensen, M.P.; Katz, N.P.; Kerns, R.D.; Stucki, G.; Allen, R.R.; Bellamy, N. Core outcome measures for chronic pain clinical trials: IMMPACT recommendations. Pain 2005, 113, 9–19. [Google Scholar]
- Price, D.D.; McGrath, P.A.; Rafii, A.; Buckingham, B. The validation of visual analogue scales as ratio scale measures for chronic and experimental pain. Pain 1983, 17, 45–56. [Google Scholar]
- Brinker, M.R.; O’Connor, D.P. Stakeholders in outcome measures: Review from a clinical perspective. Clin. Orthop. Relat. Res. 2013, 471, 3426–3436. [Google Scholar]
- Bachmeier, C.J.; March, L.M.; Cross, M.J.; Lapsley, H.; Tribe, K.; Courtenay, B.; Brooks, P. A comparison of outcomes in osteoarthritis patients undergoing total hip and knee replacement surgery. Osteoarthr. Cartil. 2001, 9, 137–146. [Google Scholar]
- Bellamy, N. The WOMAC Knee and Hip Osteoarthritis Indices: Development, validation, globalization and influence on the development of the AUSCAN Hand Osteoarthritis Indices. Clin. Exp. Rheumatol. 2005, 23, S148–S153. [Google Scholar]
- McConnell, S.; Kolopack, P.; Davis, A.M. The Western Ontario and McMaster Universities Osteoarthritis Index (WOMAC): A review of its utility and measurement properties. Arthritis Rheum. 2001, 45, 453–461. [Google Scholar]
- Lenguerrand, E.; Wylde, V.; Brunton, L.; Gooberman-Hill, R.; Blom, A.; Dieppe, P. Selecting, assessing and interpreting measures of function for patients with severe hip pathology: The need for caution. Orthop. Traumatol. Surg. Res. 2016, 102, 741–746. [Google Scholar]
- Stratford, P.W.; Kennedy, D.M.; Riddle, D.L. New study design evaluated the validity of measures to assess change after hip or knee arthroplasty. J. Clin. Epidemiol. 2009, 62, 347–352. [Google Scholar] [PubMed]
- Bily, W.; Jauker, J.; Nics, H.; Grote, V.; Pirchl, M.; Fischer, M.J. Associations between Patient-Reported and Clinician-Reported Outcome Measures in Patients after Traumatic Injuries of the Lower Limb. Int. J. Environ. Res. Public Health 2022, 19, 3140. [Google Scholar] [CrossRef] [PubMed]
- Unnanuntana, A.; Mait, J.E.; Shaffer, A.D.; Lane, J.M.; Mancuso, C.A. Performance-Based Tests and Self-Reported Questionnaires Provide Distinct Information for the Preoperative Evaluation of Total Hip Arthroplasty Patients. J. Arthroplast. 2012, 27, 770–775.e1. [Google Scholar]
- van den Akker-Scheek, I.; Zijlstra, W.; Groothoff, J.W.; Bulstra, S.K.; Stevens, M. Physical functioning before and after total hip arthroplasty: Perception and performance. Phys. Ther. 2008, 88, 712–719. [Google Scholar]
- Zdravkovic, A.; Grote, V.; Pirchl, M.; Stockinger, M.; Crevenna, R.; Fischer, M.J. Comparison of patient- and clinician-reported outcome measures in lower back rehabilitation: Introducing a new integrated performance measure (t2D). Qual. Life Res. 2022, 31, 303–315. [Google Scholar]
- Grote, V.; Unger, A.; Böttcher, E.; Muntean, M.; Puff, H.; Marktl, W.; Mur, E.; Kullich, W.; Holasek, S.; Hofmann, P.; et al. General and Disease-Specific Health Indicator Changes Associated with Inpatient Rehabilitation. J. Am. Med. Dir. Assoc. 2020, 21, e10–e2017. [Google Scholar]
- Kennedy, D.M.; Stratford, P.W.; Wessel, J.; Gollish, J.D.; Penney, D. Assessing stability and change of four performance measures: A longitudinal study evaluating outcome following total hip and knee arthroplasty. BMC Musculoskelet. Disord. 2005, 6, 3. [Google Scholar]
- Wagner, B.; Zdravkovic, A.; Pirchl, M.; Puhan, M.A.; Zwick, R.H.; Grote, V.; Crevenna, R.; Fischer, M.J. Performance Score (T2D)—A New Perspective in the Assessment of Six-Minute Walking Tests in Pulmonary Rehabilitation. Diagnostics 2022, 12, 2402. [Google Scholar] [CrossRef]
- Bachner, F.; Bobek, J.; Habimana, K.; Ladurner, J.; Lepuschutz, L.; Ostermann, H.; Rainer, L.; E Schmidt, A.; Zuba, M.; Quentin, W.; et al. Austria: Health System Review. Health Syst. Transit. 2018, 20, 1–254. [Google Scholar]
- Hofmarcher, M.M.; Quentin, W. Austria: Health system review. Health Syst. Transit. 2013, 15, 1–292. [Google Scholar] [PubMed]
- American Academy of Orthopaedic Surgeons. Joint Motion: Method of Measuring and Recording; E. & S. Livingstone: Chicago, IL, USA, 1965. [Google Scholar]
- Skinner, S.B.; McVey, C. Pocket Notes for the Physical Therapist Assistant, 2nd ed.; Jones & Bartlett Learning: Burlington, MA, USA, 2013. [Google Scholar]
- Ludwig, K.; Graf von der Schulenburg, J.M.; Greiner, W. German Value Set for the EQ-5D-5L. Pharmacoeconomics 2018, 36, 663–674. [Google Scholar] [PubMed]
- Cohen, J. Statistical Power Analysis for the Behavioral Sciences; Lawrence Erlbaum Associates, Inc.: Mahwah, NJ, USA, 1977. [Google Scholar]
- Bonnefoy-Mazure, A.; Armand, S.; Sagawa, Y.; Suvà, D.; Miozzari, H.; Turcot, K. Knee Kinematic and Clinical Outcomes Evolution Before, 3 Months, and 1 Year After Total Knee Arthroplasty. J. Arthroplast. 2017, 32, 793–800. [Google Scholar]
- Rossi, M.D.; Hasson, S.; Kohia, M.; Pineda, E.; Bryan, W. Mobility and perceived function after total knee arthroplasty. J. Arthroplast. 2006, 21, 6–12. [Google Scholar]
- Bischoff, H.A.; Stahelin, H.B.; Monsch, A.U.; Iversen, M.D.; Weyh, A.; von Dechend, M.; Akos, R.; Conzelmann, M.; Dick, W.; Theiler, R. Identifying a cut-off point for normal mobility: A comparison of the timed ‘up and go’ test in community-dwelling and institutionalised elderly women. Age Ageing 2003, 32, 315–320. [Google Scholar]
- Giesinger, K.; Hamilton, D.F.; Jost, B.; Holzner, B.; Giesinger, J.M. Comparative responsiveness of outcome measures for total knee arthroplasty. Osteoarthr. Cartil. 2014, 22, 184–189. [Google Scholar]
- Mizner, R.L.; Petterson, S.C.; Clements, K.E.; Zeni, J.A., Jr.; Irrgang, J.J.; Snyder-Mackler, L. Measuring functional improvement after total knee arthroplasty requires both performance-based and patient-report assessments: A longitudinal analysis of outcomes. J. Arthroplast. 2011, 26, 728–737. [Google Scholar]
- Browne, J.P.; Bastaki, H.; Dawson, J. What is the optimal time point to assess patient-reported recovery after hip and knee replacement? A systematic review and analysis of routinely reported outcome data from the English patient-reported outcome measures programme. Health Qual. Life Outcomes 2013, 11, 128. [Google Scholar]
- Stevens-Lapsley, J.E.; Schenkman, M.L.; Dayton, M.R. Comparison of Self-Reported Knee Injury and Osteoarthritis Outcome Score to Performance Measures in Patients After Total Knee Arthroplasty. PMR 2011, 3, 541–549. [Google Scholar]
- Stratford, P.W.; Kennedy, D.M. Performance measures were necessary to obtain a complete picture of osteoarthritic patients. J. Clin. Epidemiol. 2006, 59, 160–167. [Google Scholar]
- Deenik, J.; Kruisdijk, F.; Tenback, D.; Braakman-Jansen, A.; Taal, E.; Hopman-Rock, M.; Beekman, A.; Tak, E.; Hendriksen, I.; van Harten, P. Physical activity and quality of life in long-term hospitalized patients with severe mental illness: A cross-sectional study. BMC Psychiatry 2017, 17, 298. [Google Scholar]
- Melzer, I.; Kurz, I.; Sarid, O.; Jette, A.M. Relationship between self-reported function and disability and balance performance measures in the elderly. J. Rehabil. Res. Dev. 2007, 44, 685–691. [Google Scholar] [PubMed]
- Patrick, C.J.; Iacono, W.G.; Venables, N.C. Incorporating neurophysiological measures into clinical assessments: Fundamental challenges and a strategy for addressing them. Psychol. Assess. 2019, 31, 1512–1529. [Google Scholar] [PubMed]
- Shishov, N.; Melzer, I.; Bar-Haim, S. Parameters and Measures in Assessment of Motor Learning in Neurorehabilitation; A Systematic Review of the Literature. Front. Hum. Neurosci. 2017, 11, 82. [Google Scholar] [CrossRef]
- Stubbs, B.; Hurley, M.; Smith, T. What are the factors that influence physical activity participation in adults with knee and hip osteoarthritis? A systematic review of physical activity correlates. Clin. Rehabil. 2015, 29, 80–94. [Google Scholar]
- Monselli, C.; Bianco Prevot, L.; Accetta, R.; Tronconi, L.P.; Bolcato, V.; Basile, G. State of the Art in Rehabilitation Strategies After Hip Arthroscopy for Femoroacetabular Impingement Syndrome: A Systematic Review. J. Clin. Med. 2024, 13, 7302. [Google Scholar] [CrossRef]
Disclaimer/Publisher’s Note: The statements, opinions and data contained in all publications are solely those of the individual author(s) and contributor(s) and not of MDPI and/or the editor(s). MDPI and/or the editor(s) disclaim responsibility for any injury to people or property resulting from any ideas, methods, instructions or products referred to in the content. |
© 2025 by the authors. Licensee MDPI, Basel, Switzerland. This article is an open access article distributed under the terms and conditions of the Creative Commons Attribution (CC BY) license (https://creativecommons.org/licenses/by/4.0/).