
The Ability of the Triglyceride-Glucose (TyG) Index and Modified TyG Indexes to Predict the Presence of Metabolic-Associated Fatty Liver Disease and Metabolic Syndrome in a Pediatric Population with Obesity


Abstract
:1. Introduction
2. Materials and Methods
2.1. Study Population
2.2. Anthropometry
- .
2.3. Laboratory and Clinical Parameters
2.4. Indexes
2.5. Statistical Analysis
3. Results
4. Discussion
Author Contributions
Funding
Institutional Review Board Statement
Informed Consent Statement
Data Availability Statement
Acknowledgments
Conflicts of Interest
Abbreviations
| MASLD | Metabolic Associated Fatty Liver Disease |
| MetS | Metabolic Syndrome |
| HDL-C | High-Density Lipoprotein Cholesterol |
| NASH | Non-Alcoholic Steatohepatitis |
| TyG | Triglyceride-Glucose Index |
| TyG-BMI | Tyg-Body Mass Index |
| TyG-WC | Tyg-Waist Circumference |
| BWRP | Body Weight Reduction Program |
| BMI | Body Mass Index |
| SDS | Standard Deviation Score |
| BW | Body Weight |
| WC | Waist Circumference |
| HC | Hip Circumference |
| FPG | Fasting Plasma Glucose |
| T-C | Total Cholesterol |
| TG | Triglycerides |
| SBP | Systolic Blood Pressure |
| DBP | Diastolic Blood Pressure |
| ROC | Receiver Operating Characteristic |
| AUC | Area Under the Curve |
| CI | Confidence Interval |
| PPV | Positive Predictive Value |
| NPV | Negative Predictive Value |
| PRL | Positive Likelihood Ratio |
| NLR | Negative Likelihood Ratio |
| IRCCS | Istituto di Ricovero e Cura a Carattere Scientifico |
References
- Wasuwanich, P.; So, J.M.; Sadek, M.; Jarasvaraparn, C.; Rajborirug, S.; Quiros-Tejeira, R.E.; Karnsakul, W. Pediatric Non-Alcoholic Fatty Liver Disease (NAFLD): Trends, Mortality, and Socioeconomic Disparities in the U.S., 1998–2020. Children 2025, 12, 71. [Google Scholar] [CrossRef] [PubMed]
- Bedogni, G.; Tamini, S.; Caroli, D.; Cicolini, S.; Domenicali, M.; Sartorio, A. Development and Internal Validation of Fatty Liver Prediction Models in Obese Children and Adolescents. J. Clin. Med. 2021, 10, 1470. [Google Scholar] [CrossRef] [PubMed]
- Friedman, S.L.; Neuschwander-Tetri, B.A.; Rinella, M.; Sanyal, A.J. Mechanisms of NAFLD Development and Therapeutic Strategies. Nat. Med. 2018, 24, 908–922. [Google Scholar] [CrossRef] [PubMed]
- Dâmaso, A.R.; Masquio, D.C.L.; Campos, R.M.d.S.; Corgosinho, F.C.; Cercato, C. Effects of Multidisciplinary Therapy on Energy Balance, Inflammation, and Metabolic Diseases in Adolescents with Obesity: A Narrative Review. Ann. N. Y. Acad. Sci. 2024, 1542, 25–50. [Google Scholar] [CrossRef]
- Zimmet, P.; Alberti, K.G.M.; Kaufman, F.; Tajima, N.; Silink, M.; Arslanian, S.; Wong, G.; Bennett, P.; Shaw, J.; Caprio, S.; et al. The Metabolic Syndrome in Children and Adolescents—An IDF Consensus Report. Pediatr. Diabetes 2007, 8, 299–306. [Google Scholar] [CrossRef]
- Eslam, M.; Newsome, P.N.; Sarin, S.K.; Anstee, Q.M.; Targher, G.; Romero-Gomez, M.; Zelber-Sagi, S.; Wai-Sun Wong, V.; Dufour, J.-F.; Schattenberg, J.M.; et al. A New Definition for Metabolic Dysfunction-Associated Fatty Liver Disease: An International Expert Consensus Statement. J. Hepatol. 2020, 73, 202–209. [Google Scholar] [CrossRef]
- Malnick, S.D.H.; Zamir, D. From Non-Alcoholic Fatty Liver Disease to Metabolic-Associated Steatotic Liver Disease: Rationale and Implications for the New Terminology. World J. Hepatol. 2024, 16, 863–866. [Google Scholar] [CrossRef]
- Samanta, A.; Sen Sarma, M. Metabolic Dysfunction-Associated Steatotic Liver Disease: A Silent Pandemic. World J. Hepatol. 2024, 16, 511–516. [Google Scholar] [CrossRef]
- Kim, D.; Touros, A.; Kim, W.R. Nonalcoholic Fatty Liver Disease and Metabolic Syndrome. Clin. Liver Dis. 2018, 22, 133–140. [Google Scholar] [CrossRef]
- Hallsworth, K.; Adams, L.A. Lifestyle Modification in NAFLD/NASH: Facts and Figures. JHEP Rep. 2019, 1, 468–479. [Google Scholar] [CrossRef]
- Forlano, R.; Sigon, G.; Mullish, B.H.; Yee, M.; Manousou, P. Screening for NAFLD—Current Knowledge and Challenges. Metabolites 2023, 13, 536. [Google Scholar] [CrossRef] [PubMed]
- Cleveland, E.; Bandy, A.; VanWagner, L.B. Diagnostic Challenges of Nonalcoholic Fatty Liver Disease/Nonalcoholic Steatohepatitis. Clin. Liver Dis. 2018, 11, 98–104. [Google Scholar] [CrossRef]
- Vajro, P.; Lenta, S.; Socha, P.; Dhawan, A.; McKiernan, P.; Baumann, U.; Durmaz, O.; Lacaille, F.; McLin, V.; Nobili, V. Diagnosis of Nonalcoholic Fatty Liver Disease in Children and Adolescents: Position Paper of the ESPGHAN Hepatology Committee. J. Pediatr. Gastroenterol. Nutr. 2012, 54, 700–713. [Google Scholar] [CrossRef]
- Papachristodoulou, A.; Kavvadas, D.; Karamitsos, A.; Papamitsou, T.; Chatzidimitriou, M.; Sioga, A. Diagnosis and Staging of Pediatric Non-Alcoholic Fatty Liver Disease: Is Classical Ultrasound the Answer? Pediatr. Rep. 2021, 13, 312–321. [Google Scholar] [CrossRef]
- Simental-Mendía, L.E.; Rodríguez-Morán, M.; Guerrero-Romero, F. The Product of Fasting Glucose and Triglycerides As Surrogate for Identifying Insulin Resistance in Apparently Healthy Subjects. Metab. Syndr. Relat. Disord. 2008, 6, 299–304. [Google Scholar] [CrossRef]
- Ramdas Nayak, V.K.; Satheesh, P.; Shenoy, M.T.; Kalra, S. Triglyceride Glucose (TyG) Index: A Surrogate Biomarker of Insulin Resistance. J. Pak. Med. Assoc. 2022, 72, 986–988. [Google Scholar] [CrossRef]
- Wan, H.; Cao, H.; Ning, P. Superiority of the Triglyceride Glucose Index over the Homeostasis Model in Predicting Metabolic Syndrome Based on NHANES Data Analysis. Sci. Rep. 2024, 14, 15499. [Google Scholar] [CrossRef]
- Li, W.; Wang, Y.; He, F.; Liu, Z.; Dong, J.; Zhang, Y.; Li, T.; Liu, S.; Chen, E. Association between Triglyceride-Glucose Index and Nonalcoholic Fatty Liver Disease in Type 2 Diabetes Mellitus. BMC Endocr. Disord. 2022, 22, 261. [Google Scholar] [CrossRef]
- Ling, Q.; Chen, J.; Liu, X.; Xu, Y.; Ma, J.; Yu, P.; Zheng, K.; Liu, F.; Luo, J. The Triglyceride and Glucose Index and Risk of Nonalcoholic Fatty Liver Disease: A Dose-Response Meta-Analysis. Front. Endocrinol. 2022, 13, 1043169. [Google Scholar] [CrossRef]
- Khamseh, M.E.; Malek, M.; Abbasi, R.; Taheri, H.; Lahouti, M.; Alaei-Shahmiri, F. Triglyceride Glucose Index and Related Parameters (Triglyceride Glucose-Body Mass Index and Triglyceride Glucose-Waist Circumference) Identify Nonalcoholic Fatty Liver and Liver Fibrosis in Individuals with Overweight/Obesity. Metab. Syndr. Relat. Disord. 2021, 19, 167–173. [Google Scholar] [CrossRef]
- Sheng, G.; Lu, S.; Xie, Q.; Peng, N.; Kuang, M.; Zou, Y. The Usefulness of Obesity and Lipid-Related Indices to Predict the Presence of Non-Alcoholic Fatty Liver Disease. Lipids Health Dis. 2021, 20, 134. [Google Scholar] [CrossRef] [PubMed]
- Song, K.; Lee, H.W.; Choi, H.S.; Park, G.; Lee, H.S.; Kim, S.J.; Lee, M.; Suh, J.; Kwon, A.; Kim, H.-S.; et al. Comparison of the Modified TyG Indices and Other Parameters to Predict Non-Alcoholic Fatty Liver Disease in Youth. Biology 2022, 11, 685. [Google Scholar] [CrossRef] [PubMed]
- Zheng, S.; Shi, S.; Ren, X.; Han, T.; Li, Y.; Chen, Y.; Liu, W.; Hou, P.C.; Hu, Y. Triglyceride Glucose-Waist Circumference, a Novel and Effective Predictor of Diabetes in First-Degree Relatives of Type 2 Diabetes Patients: Cross-Sectional and Prospective Cohort Study. J. Transl. Med. 2016, 14, 260. [Google Scholar] [CrossRef] [PubMed]
- Cacciari, E.; Milani, S.; Balsamo, A.; Spada, E.; Bona, G.; Cavallo, L.; Cerutti, F.; Gargantini, L.; Greggio, N.; Tonini, G.; et al. Italian Cross-Sectional Growth Charts for Height, Weight and BMI (2 to 20 Yr). J. Endocrinol. Investig. 2006, 29, 581–593. [Google Scholar] [CrossRef]
- Lohman, T.G.; Roche, A.F.; Martorell, R. Anthropometric Standardization Reference Manual: Abridged Edition; Human Kinetics Books: Champaign, IL, USA, 1991. [Google Scholar]
- Saverymuttu, S.H.; Joseph, A.E.; Maxwell, J.D. Ultrasound Scanning in the Detection of Hepatic Fibrosis and Steatosis. Br. Med. J. Clin. Res. Ed. 1986, 292, 13–15. [Google Scholar]
- Sartorio, A.; Del Col, A.; Agosti, F.; Mazzilli, G.; Bellentani, S.; Tiribelli, C.; Bedogni, G. Predictors of Non-Alcoholic Fatty Liver Disease in Obese Children. Eur. J. Clin. Nutr. 2007, 61, 877–883. [Google Scholar] [CrossRef]
- Guerrero-Romero, F.; Simental-Mendía, L.E.; González-Ortiz, M.; Martínez-Abundis, E.; Ramos-Zavala, M.G.; Hernández-González, S.O.; Jacques-Camarena, O.; Rodríguez-Morán, M. The Product of Triglycerides and Glucose, a Simple Measure of Insulin Sensitivity. Comparison with the Euglycemic-Hyperinsulinemic Clamp. J. Clin. Endocrinol. Metab. 2010, 95, 3347–3351. [Google Scholar] [CrossRef]
- Er, L.-K.; Wu, S.; Chou, H.-H.; Hsu, L.-A.; Teng, M.-S.; Sun, Y.-C.; Ko, Y.-L. Triglyceride Glucose-Body Mass Index Is a Simple and Clinically Useful Surrogate Marker for Insulin Resistance in Nondiabetic Individuals. PLoS ONE 2016, 11, e0149731. [Google Scholar] [CrossRef]
- Youden, W.J. Index for Rating Diagnostic Tests. Cancer 1950, 3, 32–35. [Google Scholar] [CrossRef]
- Schober, P.; Boer, C.; Schwarte, L.A. Correlation Coefficients: Appropriate Use and Interpretation. Anesth. Analg. 2018, 126, 1763–1768. [Google Scholar] [CrossRef]
- Abou Jaoudeh, R.A.R.; Hartmann, P.; Olson, O.; Gupta, O.; Kumar, S.; Ibrahim, S.H.; Fawaz, R.; Aqul, A.; Hassan, S. Pharmacological Management of Pediatric Metabolic Dysfunction-Associated Steatotic Liver Disease. J. Pediatr. Gastroenterol. Nutr. 2025, 80, 14–24. [Google Scholar] [CrossRef] [PubMed]
- Chalasani, N.; Younossi, Z.; Lavine, J.E.; Diehl, A.M.; Brunt, E.M.; Cusi, K.; Charlton, M.; Sanyal, A.J. The Diagnosis and Management of Non-Alcoholic Fatty Liver Disease: Practice Guideline by the American Gastroenterological Association, American Association for the Study of Liver Diseases, and American College of Gastroenterology. Gastroenterology 2012, 142, 1592–1609. [Google Scholar] [CrossRef] [PubMed]
- Klancic, T.; Woodward, L.; Hofmann, S.M.; Fisher, E.A. High Density Lipoprotein and Metabolic Disease: Potential Benefits of Restoring Its Functional Properties. Mol. Metab. 2016, 5, 321–327. [Google Scholar] [CrossRef]
- Chen, X.-Y.; Wang, C.; Huang, Y.-Z.; Zhang, L.-L. Nonalcoholic Fatty Liver Disease Shows Significant Sex Dimorphism. World J. Clin. Cases 2022, 10, 1457–1472. [Google Scholar] [CrossRef]
- Burra, P.; Bizzaro, D.; Gonta, A.; Shalaby, S.; Gambato, M.; Morelli, M.C.; Trapani, S.; Floreani, A.; Marra, F.; Brunetto, M.R.; et al. Clinical Impact of Sexual Dimorphism in Non-Alcoholic Fatty Liver Disease (NAFLD) and Non-Alcoholic Steatohepatitis (NASH). Liver Int. 2021, 41, 1713–1733. [Google Scholar] [CrossRef]
- Jamshidi, N.; Feizi, A.; Sirlin, C.B.; Lavine, J.E.; Kuo, M.D. Multi-Modality, Multi-Dimensional Characterization of Pediatric Non-Alcoholic Fatty Liver Disease. Metabolites 2023, 13, 929. [Google Scholar] [CrossRef]
- Martinou, E.; Pericleous, M.; Stefanova, I.; Kaur, V.; Angelidi, A.M. Diagnostic Modalities of Non-Alcoholic Fatty Liver Disease: From Biochemical Biomarkers to Multi-Omics Non-Invasive Approaches. Diagnostics 2022, 12, 407. [Google Scholar] [CrossRef]
- Abdelhameed, F.; Kite, C.; Lagojda, L.; Dallaway, A.; Chatha, K.K.; Chaggar, S.S.; Dalamaga, M.; Kassi, E.; Kyrou, I.; Randeva, H.S. Non-Invasive Scores and Serum Biomarkers for Fatty Liver in the Era of Metabolic Dysfunction-Associated Steatotic Liver Disease (MASLD): A Comprehensive Review From NAFLD to MAFLD and MASLD. Curr. Obes. Rep. 2024, 13, 510–531. [Google Scholar] [CrossRef]
- Ahmadizar, F.; Younossi, Z.M. Exploring Biomarkers in Nonalcoholic Fatty Liver Disease Among Individuals With Type 2 Diabetes Mellitus. J. Clin. Gastroenterol. 2024, 59, 36–46. [Google Scholar] [CrossRef]
- Sergi, D.; Spaggiari, R.; Dalla Nora, E.; Angelini, S.; Castaldo, F.; Omenetto, A.; Stifani, G.; Sanz, J.M.; Passaro, A. HOMA-IR and TyG Index Differ for Their Relationship with Dietary, Anthropometric, Inflammatory Factors and Capacity to Predict Cardiovascular Risk. Diabetes Res. Clin. Pract. 2025, 222, 112103. [Google Scholar] [CrossRef]
- Ahmed, B.; Sultana, R.; Greene, M.W. Adipose Tissue and Insulin Resistance in Obese. Biomed. Pharmacother. 2021, 137, 111315. [Google Scholar] [CrossRef]
- Miyazaki, Y.; DeFronzo, R.A. Visceral Fat Dominant Distribution in Male Type 2 Diabetic Patients Is Closely Related to Hepatic Insulin Resistance, Irrespective of Body Type. Cardiovasc. Diabetol. 2009, 8, 44. [Google Scholar] [CrossRef] [PubMed]
- Ciarambino, T.; Crispino, P.; Guarisco, G.; Giordano, M. Gender Differences in Insulin Resistance: New Knowledge and Perspectives. Curr. Issues Mol. Biol. 2023, 45, 7845–7861. [Google Scholar] [CrossRef] [PubMed]
- Gutierrez-Grobe, Y.; Ponciano-Rodríguez, G.; Ramos, M.H.; Uribe, M.; Méndez-Sánchez, N. Prevalence of Non Alcoholic Fatty Liver Disease in Premenopausal, Posmenopausal and Polycystic Ovary Syndrome Women. The Role of Estrogens. Ann. Hepatol. 2010, 9, 402–409. [Google Scholar] [PubMed]
- Seidemann, L.; Lippold, C.P.; Rohm, C.M.; Eckel, J.C.; Schicht, G.; Matz-Soja, M.; Berg, T.; Seehofer, D.; Damm, G. Sex Hormones Differently Regulate Lipid Metabolism Genes in Primary Human Hepatocytes. BMC Endocr. Disord. 2024, 24, 135. [Google Scholar] [CrossRef]
- Grossmann, M.; Wierman, M.E.; Angus, P.; Handelsman, D.J. Reproductive Endocrinology of Nonalcoholic Fatty Liver Disease. Endocr. Rev. 2019, 40, 417–446. [Google Scholar] [CrossRef]
- Alves, E.S.; Santos, J.D.M.; Cruz, A.G.; Camargo, F.N.; Talarico, C.H.Z.; Santos, A.R.M.; Silva, C.A.A.; Morgan, H.J.N.; Matos, S.L.; Araujo, L.C.C.; et al. Hepatic Estrogen Receptor Alpha Overexpression Protects Against Hepatic Insulin Resistance and MASLD. Pathophysiology 2025, 32, 1. [Google Scholar] [CrossRef]
- Rocha, A.L.L.; Faria, L.C.; Guimarães, T.C.M.; Moreira, G.V.; Cândido, A.L.; Couto, C.A.; Reis, F.M. Non-Alcoholic Fatty Liver Disease in Women with Polycystic Ovary Syndrome: Systematic Review and Meta-Analysis. J. Endocrinol. Investig. 2017, 40, 1279–1288. [Google Scholar] [CrossRef]

| Total | MASLD+ | MASLD− | p-Value | |
|---|---|---|---|---|
| n. | 758 | 295 | 463 | |
| Sex (F/M) | 454 (59.9%)/304 (40.1%) | 133 (45.1%)/162 (54.9%) | 321 (69.3%)/142 (30.7%) | <0.0001 |
| Age (yrs) | 14.8 ± 2.1 | 14.6 ± 2.3 | 14.8 ± 2.0 | ns |
| Height (cm) | 163.0 ± 9.8 | 163.4 ± 10.5 | 162.8 ± 9.3 | ns |
| BW (kg) | 101.6 ± 22.7 | 106.6 ± 26.7 | 98.4 ± 19.2 | <0.0001 |
| BMI (kg/m2) | 37.9 ± 6.2 | 39.5 ± 7.1 | 36.9 ± 5.3 | <0.0001 |
| WC (cm) | 115.2 ± 14.7 | 119.1 ± 15.8 | 112.8 ± 13.4 | <0.0001 |
| HC (cm) | 121.6 ± 12.2 | 122.7 ± 14.0 | 121.0 ± 10.8 | ns |
| SBP (mmHg) | 125.5 ± 12.6 | 127.2 ± 13.5 | 124.4 ± 11.9 | <0.01 |
| DBP (mmHg) | 78.5 ± 7.9 | 79.7 ± 8.3 | 77.8 ± 7.6 | <0.001 |
| Glucose (mg/dL) | 81.5 ± 6.2 | 82.2 ± 6.5 | 81.0 ± 6.0 | <0.01 |
| T-C (mg/dL) | 163.8 ± 31.7 | 166.6 ± 33.4 | 162.0 ± 30.2 | <0.05 |
| HDL-C (mg/dL) | 42.8 ± 10.5 | 41.5 ± 9.8 | 43.6 ± 10.9 | <0.01 |
| Triglycerides (mg/dL) | 96.6 ± 40.8 | 105.2 ± 42.5 | 91.1 ± 38.8 | <0.0001 |
| MetS (+/−) | 211 (27.8%)/547 (72.2%) | 100 (33.9%)/195 (66.1%) | 111 (24%)/352 (76%) | <0.0001 |
| TyG | 4.4 ± 0.2 | 4.5 ± 0.2 | 4.4 ± 0.2 | <0.0001 |
| TyG-WC | 512.7 ± 74.3 | 535.5 ± 79.0 | 498.2 ± 67.3 | <0.0001 |
| TyG-BMI | 168.7 ± 30.1 | 177.6 ± 33.9 | 163.1 ± 25.8 | <0.0001 |
| Females | Males | p-Value | |
|---|---|---|---|
| n. | 454 | 304 | |
| Age (yrs) | 14.8 ± 2.1 | 14.6 ± 2.2 | ns |
| Height (cm) | 160.3 ± 7.4 | 167.0 ± 11.4 | <0.0001 |
| BW (kg) | 97.2 ± 18.7 | 108.1 ± 26.4 | <0.0001 |
| BMI (kg/m2) | 37.7 ± 6.0 | 38.3 ± 6.4 | ns |
| WC (cm) | 112.0 ± 13.5 | 120.1 ± 15.1 | <0.0001 |
| HC (cm) | 122.3 ± 29.3 | 120.7 ± 13.2 | ns |
| SBP (mmHg) | 123.5 ± 12.1 | 128.4 ± 12.7 | <0.0001 |
| DBP (mmHg) | 77.8 ± 7.6 | 79.7 ± 8.3 | <0.01 |
| Glucose (mg/dL) | 81.2 ± 6.5 | 81.9 ± 5.7 | ns |
| T-C (mg/dL) | 162.8 ± 31.0 | 165.3 ± 32.4 | ns |
| HDL-C (mg/dL) | 44.3 ± 10.4 | 40.5 ± 10.3 | <0.0001 |
| Triglycerides (mg/dL) | 93.1 ± 40.1 | 101.8 ± 41.5 | <0.01 |
| MetS (+/−) | 105 (23.1%)/349 (76.9%) | 106 (34.9%)/198 (65.1%) | <0.0001 |
| MASLD (+/−) | 133 (29.3%)/321 (70.7%) | 162 (53.3%)/142 (46.7%) | <0.0001 |
| TyG | 4.4 ± 0.2 | 4.5 ± 0.2 | <0.01 |
| TyG-WC | 495.9 ± 68.6 | 537.8 ± 75.5 | <0.0001 |
| TyG-BMI | 166.9 ± 29.5 | 171.4 ± 30.7 | <0.05 |
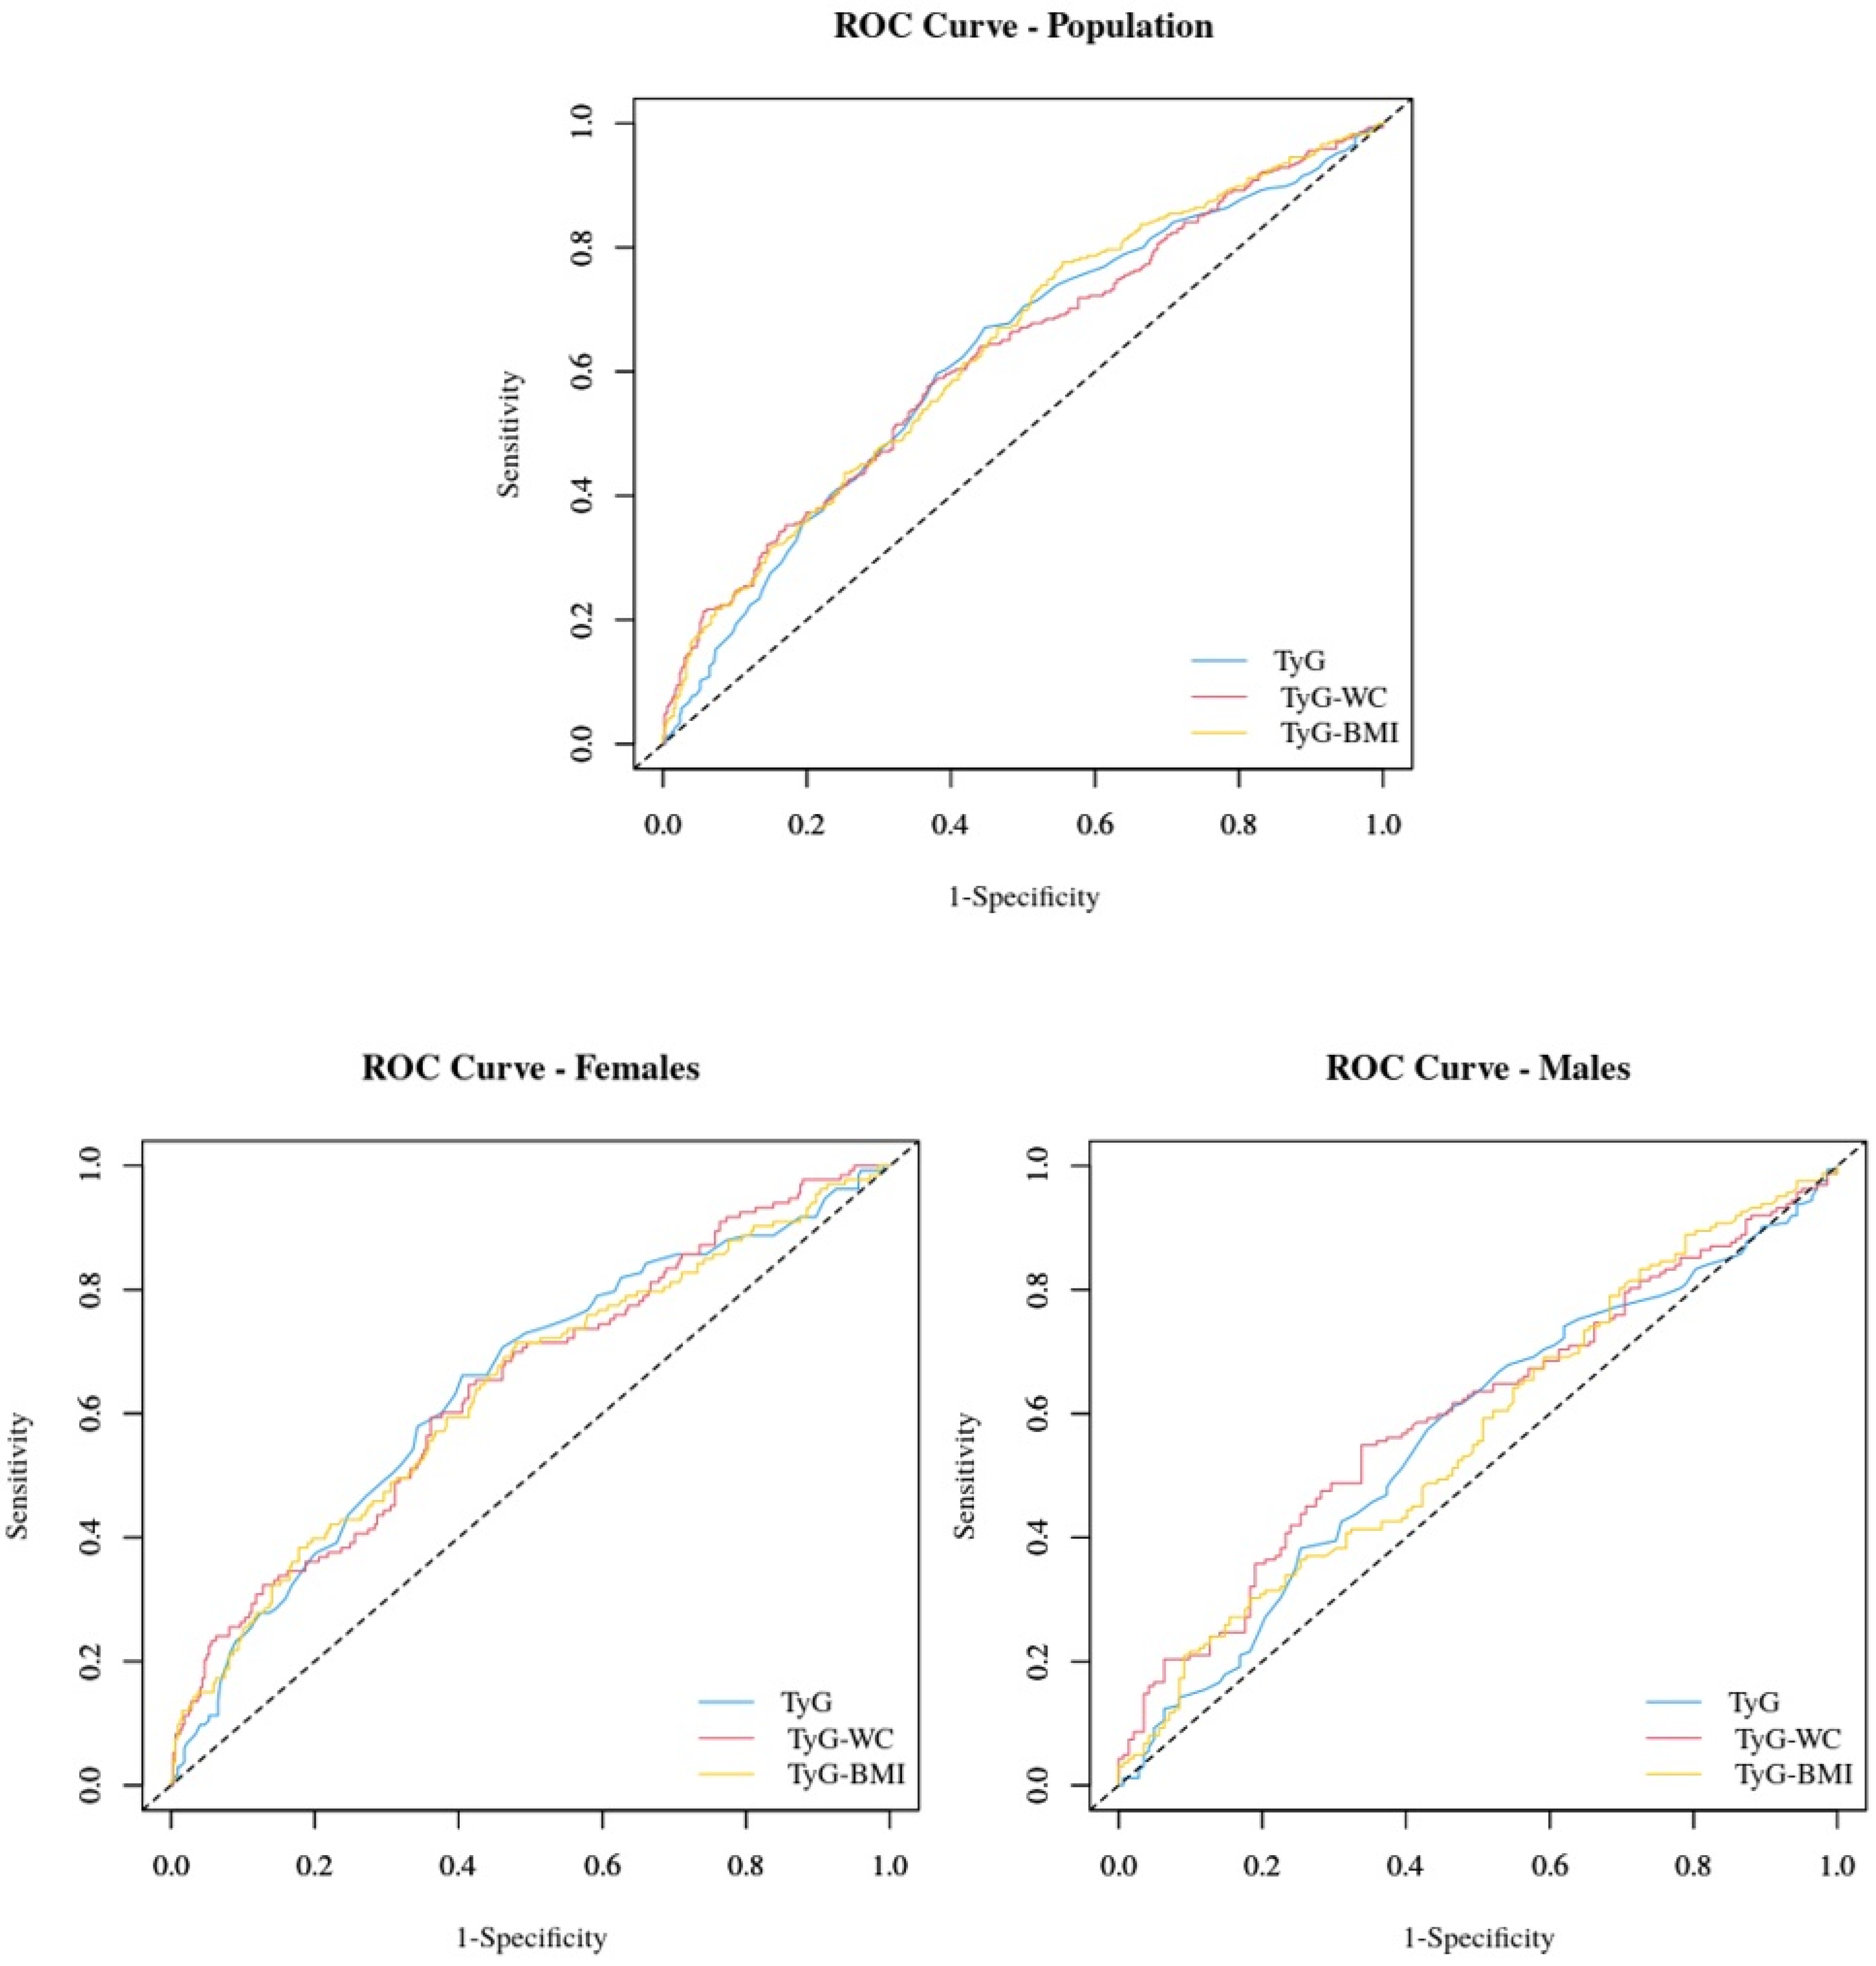
| ROC Area | Cutoff | Sensitivity | Specificity | PPV | NPV | PLR | NLR | |
|---|---|---|---|---|---|---|---|---|
| Study group | ||||||||
| TyG | 0.62 (0.58–0.66) | 4.43 | 67.1% | 55.3% | 48.9% | 72.5% | 1.50 | 0.60 |
| TyG-WC | 0.64 (0.60–0.68) | 478.83 | 77.6% | 44.5% | 47.1% | 75.7% | 1.40 | 0.50 |
| TyG-BMI | 0.63 (0.59–0.67) | 168.05 | 57.6% | 63.3% | 50.0% | 70.1% | 1.57 | 0.67 |
| Females | ||||||||
| TyG | 0.64 (0.59–0.70) | 4.43 | 66.2% | 59.5% | 40.4% | 80.9% | 1.63 | 0.57 |
| TyG-WC | 0.64 (0.58–0.69) | 478.80 | 71.4% | 52.0% | 38.2% | 81.5% | 1.49 | 0.55 |
| TyG-BMI | 0.64 (0.59–0.70) | 168.05 | 59.4% | 63.9% | 40.5% | 79.2% | 1.65 | 0.64 |
| Males | ||||||||
| TyG | 0.57 (0.50–0.63) | 4.47 | 61.1% | 53.5% | 60.0% | 54.7% | 1.32 | 0.73 |
| TyG-WC | 0.58 (0.50–0.63) | 589.80 | 30.2% | 81.7% | 65.3% | 50.7% | 1.65 | 0.85 |
| TyG-BMI | 0.60 (0.54–0.66) | 170.38 | 54.9% | 66.2% | 65.0% | 56.3% | 1.63 | 0.68 |
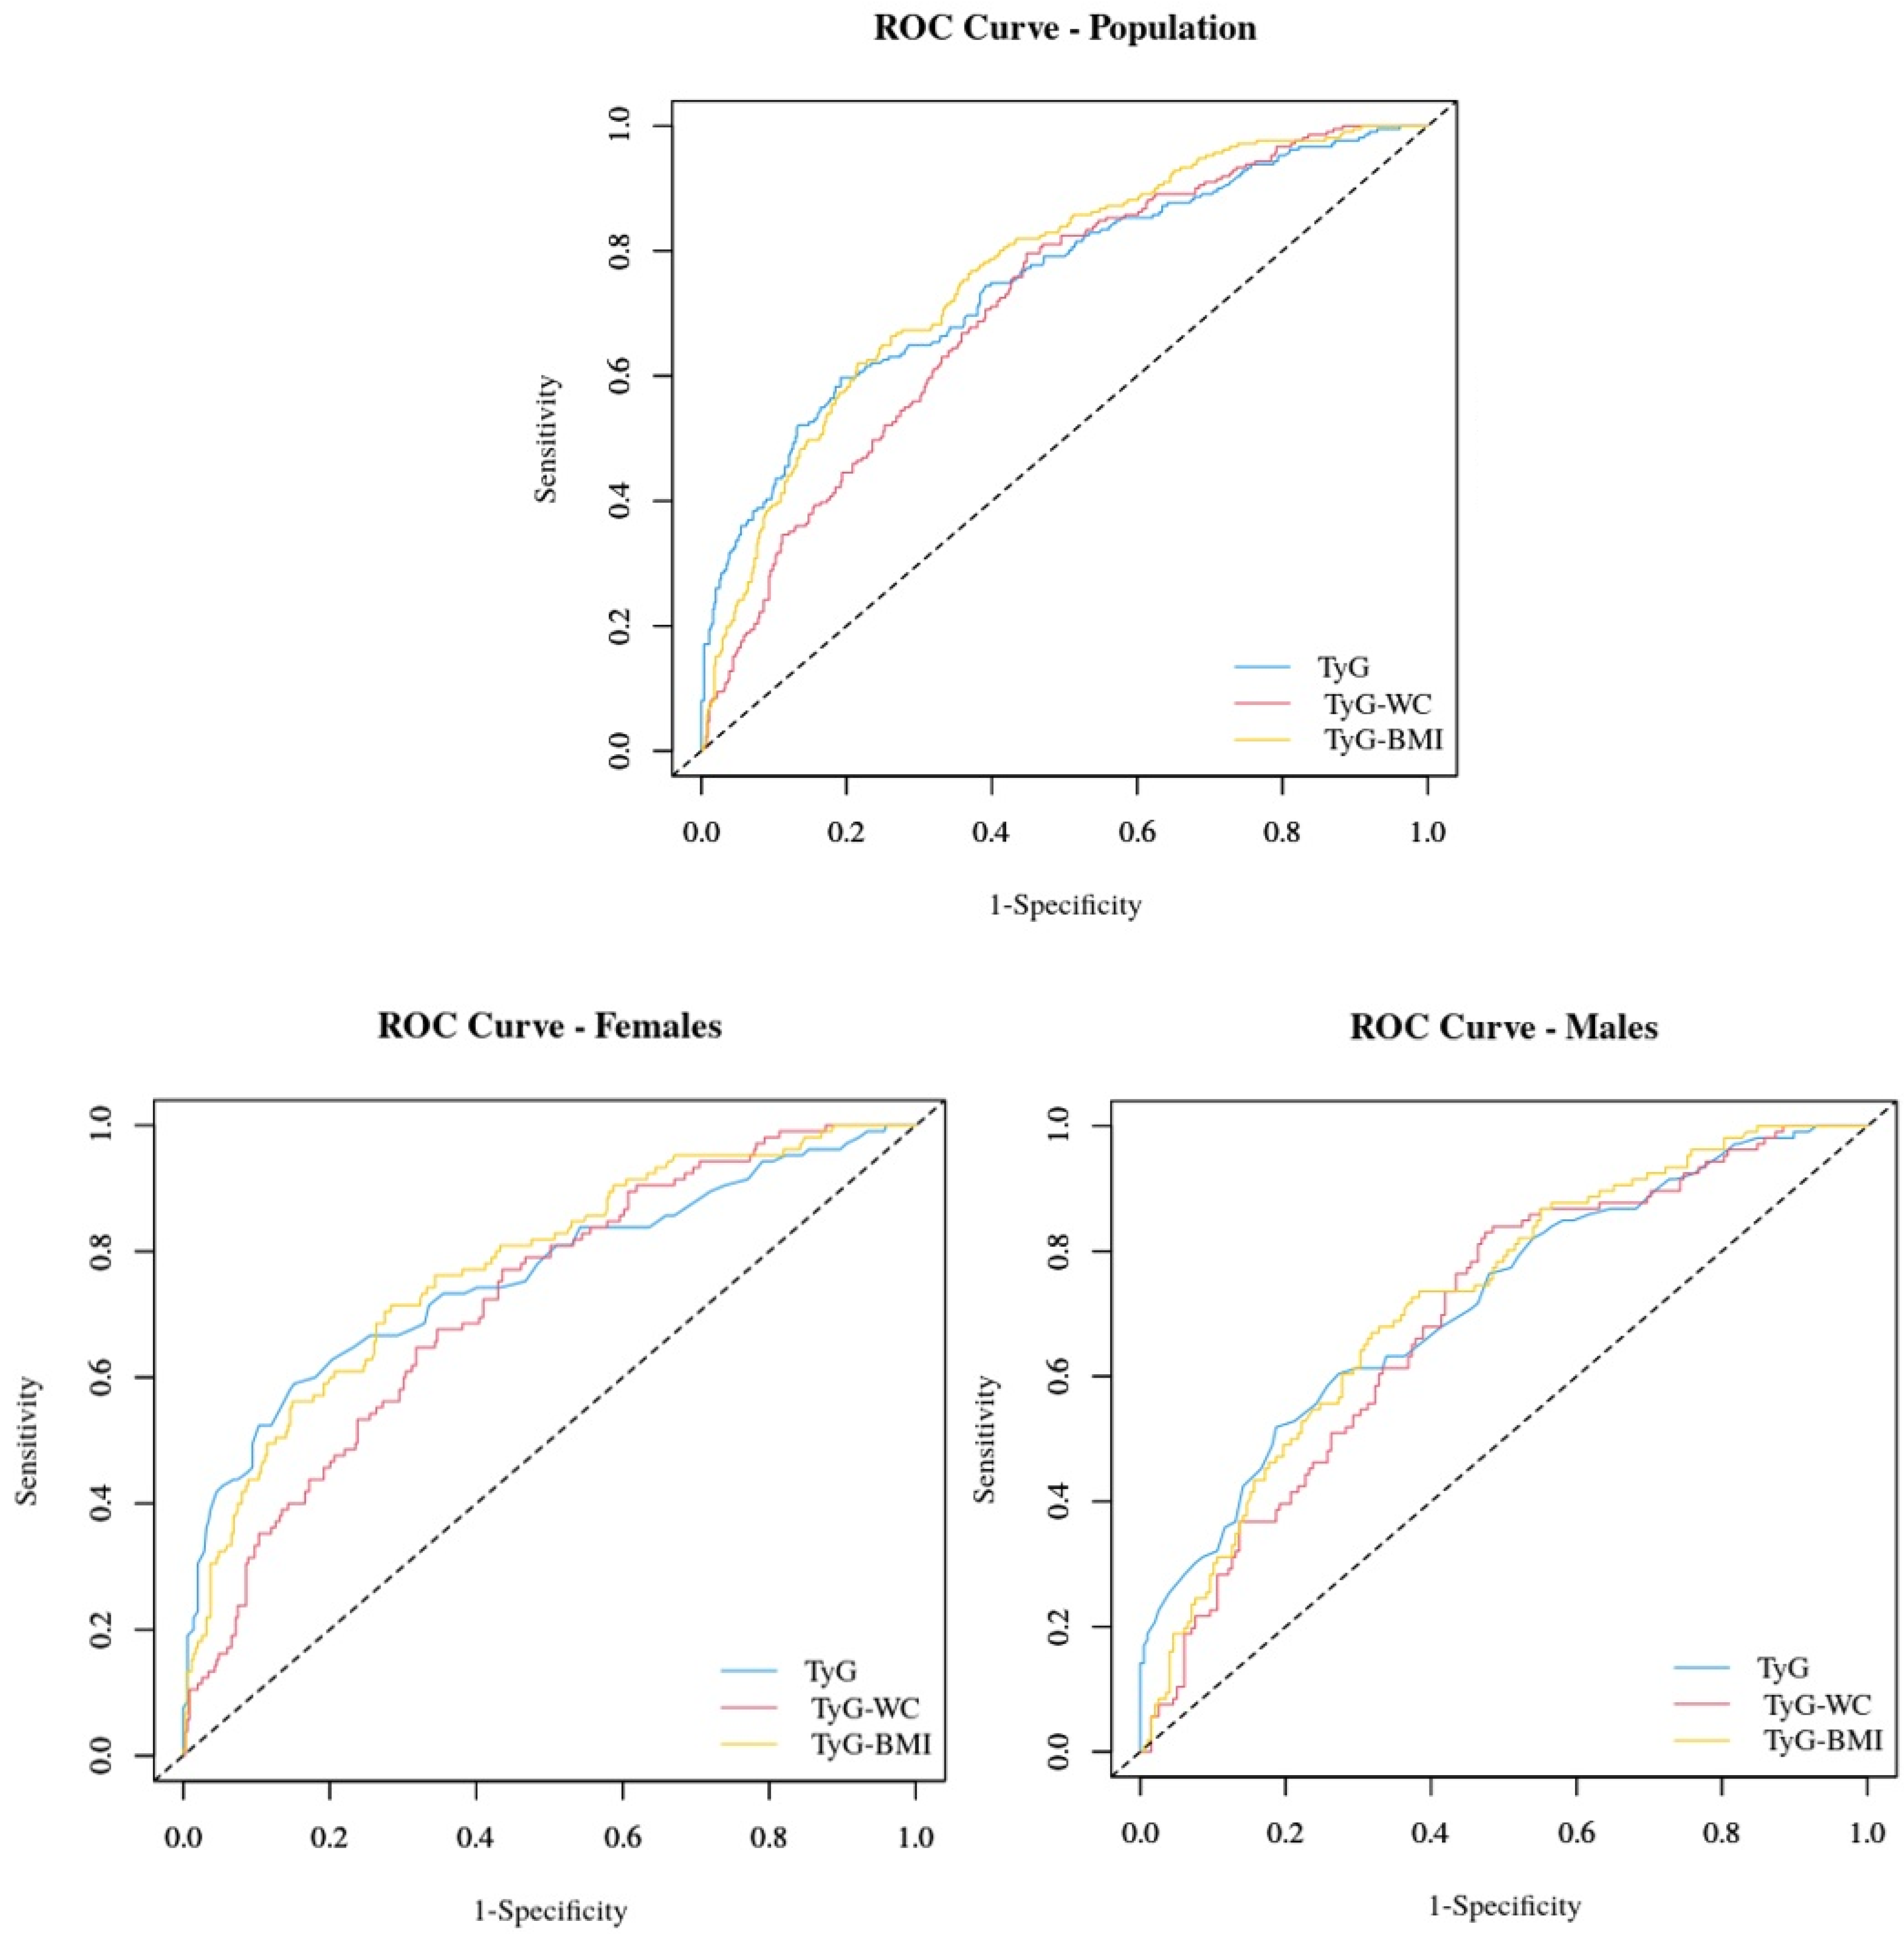
| ROC Area | Cutoff | Sensitivity | Specificity | PPV | NPV | PLR | NLR | |
|---|---|---|---|---|---|---|---|---|
| Study group | ||||||||
| TyG | 0.75 (0.71–0.79) | 4.55 | 59.7% | 80.8% | 54.5% | 83.9% | 3.11 | 0.50 |
| TyG-WC | 0.76 (0.73–0.80) | 538.48 | 62.1% | 78.4% | 52.6% | 84.3% | 2.88 | 0.48 |
| TyG-BMI | 0.71 (0.67–0.75) | 161.30 | 79.6% | 55.2% | 40.7% | 87.5% | 1.78 | 0.37 |
| Females | ||||||||
| TyG | 0.76 (0.70–0.82) | 4.55 | 59.0% | 84.8% | 53.9% | 87.3% | 3.89 | 0.48 |
| TyG-WC | 0.77 (0.72–0.82) | 510.40 | 71.4% | 71.6% | 43.1% | 89.3% | 2.52 | 0.40 |
| TyG-BMI | 0.72 (0.67–0.77) | 161.30 | 77.1% | 56.4% | 34.8% | 89.1% | 1.77 | 0.41 |
| Males | ||||||||
| TyG | 0.72 (0.66–0.78) | 4.59 | 51.9% | 81.3% | 59.8% | 75.9% | 2.77 | 0.59 |
| TyG-WC | 0.72 (0.66–0.78) | 531.10 | 72.6% | 62.6% | 51.0% | 81.0% | 1.94 | 0.44 |
| TyG-BMI | 0.69 (0.63–0.75) | 159.87 | 83.0% | 52.5% | 48.4% | 85.2% | 1.75 | 0.32 |
| Age | Height | BW | BMI | WC | HC | SBP | DBP | MetS | MASLD | ||
|---|---|---|---|---|---|---|---|---|---|---|---|
| Study group | |||||||||||
| TyG | R squared | 0.066 | 0.111 | 0.196 | 0.183 | 0.218 | 0.089 | 0.167 | 0.116 | 0.407 | 0.187 |
| p-value | ns | <0.01 | <0.0001 | <0.0001 | <0.0001 | <0.05 | ns | <0.01 | <0.0001 | ns | |
| TyG-WC | R squared | 0.334 | 0.458 | 0.799 | 0.744 | 0.950 | 0.673 | 0.394 | 0.343 | 0.4116 | 0.244 |
| p-value | <0.0001 | <0.0001 | <0.0001 | <0.0001 | <0.0001 | <0.0001 | <0.0001 | <0.0001 | <0.0001 | <0.0001 | |
| TyG-BMI | R squared | 0.306 | 0.235 | 0.837 | 0.967 | 0.772 | 0.808 | 0.395 | 0.345 | 0.317 | 0.235 |
| p-value | <0.001 | <0.05 | <0.0001 | <0.05 | ns | <0.0001 | <0.0001 | <0.0001 | <0.0001 | <0.0001 | |
| Males | |||||||||||
| TyG | R squared | 0.167 | 0.138 | 0.165 | 0.130 | 0.163 | 0.082 | 0.151 | 0.122 | 0.373 | 0.088 |
| p-value | <0.05 | <0.05 | <0.01 | <0.05 | <0.01 | ns | <0.01 | <0.05 | <0.0001 | ns | |
| TyG-WC | R squared | 0.558 | 0.563 | 0.860 | 0.812 | 0.946 | 0.790 | 0.431 | 0.332 | 0.354 | 0.130 |
| p-value | <0.001 | ns | ns | <0.01 | <0.001 | <0.001 | <0.0001 | <0.0001 | <0.0001 | <0.05 | |
| TyG-BMI | R squared | 0.469 | 0.356 | 0.855 | 0.967 | 0.848 | 0.845 | 0.468 | 0.383 | 0.293 | 0.187 |
| p-value | ns | ns | ns | ns | ns | <0.05 | <0.01 | <0.0001 | <0.0001 | <0.01 | |
| Females | |||||||||||
| TyG | R squared | 0.006 | 0.014 | 0.188 | 0.214 | 0.218 | 0.109 | 0.147 | 0.091 | 0.418 | 0.221 |
| p-value | ns | ns | <0.0001 | <0.0001 | <0.0001 | <0.05 | <0.01 | ns | <0.0001 | <0.0001 | |
| TyG-WC | R squared | 0.213 | 0.235 | 0.722 | 0.721 | 0.945 | 0.660 | 0.311 | 0.320 | 0.428 | 0.239 |
| p-value | <0.0001 | <0.0001 | <0.0001 | <0.0001 | <0.0001 | <0.0001 | <0.0001 | <0.0001 | <0.0001 | <0.0001 | |
| TyG-BMI | R squared | 0.197 | 0.090 | 0.855 | 0.967 | 0.735 | 0.795 | 0.332 | 0.306 | 0.325 | 0.254 |
| p-value | <0.0001 | ns | <0.0001 | <0.0001 | <0.0001 | <0.0001 | <0.0001 | <0.0001 | <0.0001 | <0.0001 | |
Disclaimer/Publisher’s Note: The statements, opinions and data contained in all publications are solely those of the individual author(s) and contributor(s) and not of MDPI and/or the editor(s). MDPI and/or the editor(s) disclaim responsibility for any injury to people or property resulting from any ideas, methods, instructions or products referred to in the content. |
© 2025 by the authors. Licensee MDPI, Basel, Switzerland. This article is an open access article distributed under the terms and conditions of the Creative Commons Attribution (CC BY) license (https://creativecommons.org/licenses/by/4.0/).
Share and Cite
Tamini, S.; Bondesan, A.; Caroli, D.; Marazzi, N.; Sartorio, A. The Ability of the Triglyceride-Glucose (TyG) Index and Modified TyG Indexes to Predict the Presence of Metabolic-Associated Fatty Liver Disease and Metabolic Syndrome in a Pediatric Population with Obesity. J. Clin. Med. 2025, 14, 2341. https://doi.org/10.3390/jcm14072341
Tamini S, Bondesan A, Caroli D, Marazzi N, Sartorio A. The Ability of the Triglyceride-Glucose (TyG) Index and Modified TyG Indexes to Predict the Presence of Metabolic-Associated Fatty Liver Disease and Metabolic Syndrome in a Pediatric Population with Obesity. Journal of Clinical Medicine. 2025; 14(7):2341. https://doi.org/10.3390/jcm14072341
Chicago/Turabian StyleTamini, Sofia, Adele Bondesan, Diana Caroli, Nicoletta Marazzi, and Alessandro Sartorio. 2025. "The Ability of the Triglyceride-Glucose (TyG) Index and Modified TyG Indexes to Predict the Presence of Metabolic-Associated Fatty Liver Disease and Metabolic Syndrome in a Pediatric Population with Obesity" Journal of Clinical Medicine 14, no. 7: 2341. https://doi.org/10.3390/jcm14072341
APA StyleTamini, S., Bondesan, A., Caroli, D., Marazzi, N., & Sartorio, A. (2025). The Ability of the Triglyceride-Glucose (TyG) Index and Modified TyG Indexes to Predict the Presence of Metabolic-Associated Fatty Liver Disease and Metabolic Syndrome in a Pediatric Population with Obesity. Journal of Clinical Medicine, 14(7), 2341. https://doi.org/10.3390/jcm14072341