
Potential Biomarkers for IDH-Mutant and IDH-Wild-Type Glioblastomas: A Single-Center Retrospective Study

 , , and
Abstract
:1. Introduction
2. Materials and Methods
2.1. Study Design and Setting
2.2. Patient Selection
2.3. Inflammatory Biomarker Selection
2.4. Diagnostic Imaging and Volumetric Assessment
2.5. Surgical Procedure and Postoperative Care
2.6. Adjuvant Treatment Protocol
2.7. Data Collection
3. Statistical Analysis
4. Results
5. Discussion
Future Perspectives and Directions
6. Conclusions
Author Contributions
Funding
Institutional Review Board Statement
Informed Consent Statement
Data Availability Statement
Conflicts of Interest
References
- De Simone, M.; Conti, V.; Palermo, G.; De Maria, L.; Iaconetta, G. Advancements in glioma care: Focus on emerging neurosurgical techniques. Biomedicines 2024, 12, 8. [Google Scholar] [CrossRef]
- Iacob, G.; Dinca, E.B. Current data and strategy in glioblastoma multiforme. J. Med. Life 2009, 2, 386–393. [Google Scholar] [PubMed]
- Newton, H.B. Overview of the molecular genetics and molecular chemotherapy of GBM. In Glioblastoma: Molecular Mechanisms of Pathogenesis and Current Therapeutic Strategies; Springer: New York, NY, USA, 2010; pp. 1–42. [Google Scholar]
- Khan, I.; Waqas, M.; Shamim, M.S. Prognostic significance of IDH 1 mutation in patients with glioblastoma multiforme. J. Pak. Med. Assoc. 2017, 67, 816–819. [Google Scholar] [PubMed]
- Korshunov, A.; Casalini, B.; Chavez, L.; Hielscher, T.; Sill, M.; Ryzhova, M.; Sharma, T.; Schrimpf, D.; Stichel, D.; Capper, D.; et al. Integrated molecular characterization of IDH-mutant glioblastomas. Neuropathol. Appl. Neurobiol. 2019, 45, 108–118. [Google Scholar]
- Han, S.; Liu, Y.; Cai, S.J.; Qian, M.; Ding, J.; Larion, M.; Gilbert, M.R.; Yang, C. IDH mutation in glioma: Molecular mechanisms and potential therapeutic targets. Br. J. Cancer 2020, 122, 1580–1589. [Google Scholar]
- Berghoff, A.S.; Kiesel, B.; Widhalm, G.; Wilhelm, D.; Rajky, O.; Kurscheid, S.; Kresl, P.; Wöhrer, A.; Marosi, C.; Hegi, M.E.; et al. Correlation of immune phenotype with IDH mutation in diffuse glioma. Neuro-Oncol. 2017, 19, 1460–1468. [Google Scholar]
- Davis, M.E. Glioblastoma: Overview of disease and treatment. Clin. J. Oncol. Nurs. 2016, 20, S2–S8. [Google Scholar] [PubMed]
- Zhang, H.; Wang, R.; Yu, Y.; Liu, J.; Luo, T.; Fan, F. Glioblastoma treatment modalities besides surgery. J. Cancer 2019, 10, 4793–4801. [Google Scholar]
- Zhang, P.; Xia, Q.; Liu, L.; Li, S.; Dong, L. Current opinion on molecular characterization for GBM classification in guiding clinical diagnosis, prognosis, and therapy. Front. Mol. Biosci. 2020, 7, 562798. [Google Scholar]
- Silantyev, A.S.; Falzone, L.; Libra, M.; Gurina, O.I.; Kardashova, K.S.; Nikolouzakis, T.K.; Nosyrev, A.E.; Sutton, C.W.; Mitsias, P.D.; Tsatsakis, A.; et al. Current and future trends on diagnosis and prognosis of glioblastoma: From molecular biology to proteomics. Cells 2019, 8, 863. [Google Scholar] [CrossRef]
- Mineo, J.F.; Bordron, A.; Baroncini, M.; Ramirez, C.; Maurage, C.A.; Blond, S.; Dam-Hieu, P. Prognosis factors of survival time in patients with glioblastoma multiforme: A multivariate analysis of 340 patients. Acta Neurochir. 2007, 149, 245–253. [Google Scholar] [CrossRef] [PubMed]
- Pebes Vega, J.C.; Mancin, S.; Vinciguerra, G.; Azzolini, E.; Colotta, F.; Pastore, M.; Morales Palomares, S.; Lopane, D.; Cangelosi, G.; Cosmai, S.; et al. Nutritional Assessment and Management of Patients with Brain Neoplasms Undergoing Neurosurgery: A Systematic Review. Cancers 2025, 17, 764. [Google Scholar] [CrossRef]
- Yin, H.; Zheng, X.; Yin, J.; Huang, J.; Lu, Y.; Yin, X.; Fu, J. m6A-Associated lncRNAs as Prognostic Biomarkers Correlated with Tumor Immune Microenvironment in Glioma. Cells 2022, 11, 1265. [Google Scholar] [CrossRef]
- Chelliah, S.S.; Paul, E.A.L.; Kamarudin, M.N.A.; Parhar, I. Challenges and Perspectives of Standard Therapy and Drug Development in High-Grade Gliomas. Molecules 2021, 26, 1169. [Google Scholar] [CrossRef] [PubMed]
- Lee, J.Y.; Oh, E.G.; Hyung, W.J.; Kim, H.I. Translation and validation of the Patient-Generated Subjective Global Assessment against the Mini-Nutritional Assessment for patients with gastric cancer. Asia-Pac. J. Oncol. Nurs. 2023, 10, 100148. [Google Scholar] [CrossRef]
- Zhang, Q.; Li, X.R.; Zhang, X.; Ding, J.S.; Liu, T.; Qian, L.; Song, M.M.; Song, C.H.; Barazzoni, R.; Tang, M.; et al. PG-SGA SF in nutrition assessment and survival prediction for elderly patients with cancer. BMC Geriatr. 2021, 21, 687. [Google Scholar] [CrossRef]
- Phillips, M.C.L.; Leyden, J.; McManus, E.J.; Lowyim, D.G.; Ziad, F.; Moon, B.G.; Haji Mohd Yasin, N.A.B.; Tan, A.; Thotathil, Z.; Jameson, M.B.; et al. Feasibility and Safety of a Combined Metabolic Strategy in Glioblastoma Multiforme: A Prospective Case Series. J. Oncol. 2022, 2022, 4496734. [Google Scholar] [CrossRef]
- Louis, D.N.; Perry, A.; Reifenberger, G.; Von Deimling, A.; Figarella-Branger, D.; Cavenee, W.K.; Ohgaki, H.; Wiestler, O.D.; Kleihues, P.; Ellison, D.W.; et al. The 2016 World Health Organization classification of tumors of the central nervous system: A summary. Acta Neuropathol. 2016, 131, 803–820. [Google Scholar]
- Han, S.; Liu, Y.; Li, Q.; Li, Z.; Hou, H.; Wu, A. Pre-treatment neutrophil-to-lymphocyte ratio is associated with neutrophil and T-cell infiltration and predicts clinical outcome in patients with glioblastoma. BMC Cancer 2015, 15, 617. [Google Scholar] [CrossRef]
- Lopes, M.; Carvalho, B.; Vaz, R.; Linhares, P. Influence of neutrophil–lymphocyte ratio in prognosis of glioblastoma multiforme. J. Neuro-Oncol. 2018, 136, 173–180. [Google Scholar]
- Zhang, X.; Li, C.; Xiao, L.; Gao, C.; Zhao, W.; Yang, M.; Sun, T.; Wang, F. Predicting individual prognosis and grade of patients with glioma based on preoperative eosinophil and neutrophil-to-lymphocyte ratio. Cancer Manag. Res. 2020, 12, 5793–5802. [Google Scholar] [PubMed]
- Bambury, R.M.; Teo, M.Y.; Power, D.G.; Yusuf, A.; Murray, S.; Battley, J.E.; Drake, C.; O’dea, P.; Bermingham, N.; Keohane, C.; et al. The association of pre-treatment neutrophil to lymphocyte ratio with overall survival in patients with glioblastoma multiforme. J. Neuro-Oncol. 2013, 114, 149–154. [Google Scholar]
- McNamara, M.G.; Lwin, Z.; Jiang, H.; Templeton, A.J.; Zadeh, G.; Bernstein, M.; Chung, C.; Millar, B.A.; Laperriere, N.; Mason, W.P. Factors impacting survival following second surgery in patients with glioblastoma in the temozolomide treatment era, incorporating neutrophil/lymphocyte ratio and time to first progression. J. Neuro-Oncol. 2014, 117, 147–152. [Google Scholar]
- Mazzella, A.; Orlandi, R.; Maiorca, S.; Uslenghi, C.; Chiari, M.; Bertolaccini, L.; Casiraghi, M.; Lo Iacono, G.; Girelli, L.; Spaggiari, L. How general and inflammatory status impacts on the prognosis of patients affected by lung cancer: State of the art. Biomedicines 2024, 12, 1554. [Google Scholar] [CrossRef]
- Karsli, P.B.; Yıldız, S.E.; Özdemir, M.; Türkkan, E.; Erdoğan, O.; Arslan, F.D. Prognostic role of red cell distribution width-to-platelet ratio in patients with advanced non-small cell lung cancer. Medicine 2023, 102, e34266. [Google Scholar] [CrossRef]
- Ulasov, I.; Singh, V.; Laevskaya, A.; Timashev, P.; Kharwar, R.K. Inflammatory Mediators and GBM Malignancy: Current Scenario and Future Prospective. Discov. Med. 2023, 35, 458–475. [Google Scholar] [CrossRef]
- Basheer, A.S.; Abas, F.; Othman, I.; Naidu, R. Role of Inflammatory Mediators, Macrophages, and Neutrophils in Glioma Maintenance and Progression: Mechanistic Understanding and Potential Therapeutic Applications. Cancers 2021, 13, 4226. [Google Scholar] [CrossRef]
- Komori, T. The 2016 WHO classification of tumours of the central nervous system: The major points of revision. Neurol. Med. Chir. 2017, 57, 301–311. [Google Scholar]
- Komori, T. The 2021 WHO classification of tumors, central nervous system tumors: The 10 basic principles. Brain Tumor Pathol. 2022, 39, 47–50. [Google Scholar]
- Ohgaki, H.; Kleihues, P. Population-based studies on incidence, survival rates, and genetic alterations in astrocytic and oligodendroglial gliomas. J. Neuropathol. Exp. Neurol. 2005, 64, 479–489. [Google Scholar]
- Barnholtz-Sloan, J.S.; Sloan, A.E.; Schwartz, A.G. Relative survival rates and patterns of diagnosis analyzed by time period for individuals with primary malignant brain tumor, 1973–1997. J. Neurosurg. 2003, 99, 458–466. [Google Scholar] [PubMed]
- Shinojima, N.; Kochi, M.; Hamada, J.I.; Nakamura, H.; Yano, S.; Makino, K.; Tsuiki, H.; Tada, K.; Kuratsu, J.I.; Ishimaru, Y.; et al. The influence of sex and the presence of giant cells on postoperative long-term survival in adult patients with supratentorial glioblastoma multiforme. J. Neurosurg. 2004, 101, 219–226. [Google Scholar] [PubMed]
- Plunkett, R.J.; Lis, A.; Barone, T.A.; Fronckowiak, M.D.; Greenberg, S.J. Hormonal effects on glioblastoma multiforme in the nude rat model. J. Neurosurg. 1999, 90, 1072–1077. [Google Scholar] [PubMed]
- Stupp, R.; Mason, W.P.; Van Den Bent, M.J.; Weller, M.; Fisher, B.; Taphoorn, M.J.; Belanger, K.; Brandes, A.A.; Marosi, C.; Bogdahn, U.; et al. Radiotherapy plus concomitant and adjuvant temozolomide for glioblastoma. N. Engl. J. Med. 2005, 352, 987–996. [Google Scholar]
- Tezcan, Y.; Koc, M. 3-D conformal radiotherapy with concomitant and adjuvant temozolomide for patients with glioblastoma multiforme and evaluation of prognostic factors. Radiol. Oncol. 2011, 45, 213–219. [Google Scholar]
- Sanson, M.; Marie, Y.; Paris, S.; Idbaih, A.; Laffaire, J.; Ducray, F.; El Hallani, S.; Boisselier, B.; Mokhtari, K.; Hoang-Xuan, K.; et al. Isocitrate dehydrogenase 1 codon 132 mutation is an important prognostic biomarker in gliomas. J. Clin. Oncol. 2009, 27, 4150–4154. [Google Scholar]
- Aibaidula, A.; Chan, A.K.Y.; Shi, Z.; Li, Y.; Zhang, R.; Yang, R.; Li, K.K.W.; Chung, N.Y.F.; Yao, Y.; Zhou, L.; et al. Adult IDH wild-type lower-grade gliomas should be further stratified. Neuro-Oncol. 2017, 19, 1327–1337. [Google Scholar]
- Stupp, R.; Brada, M.; Van Den Bent, M.J.; Tonn, J.C.; Pentheroudakis, G. High-grade glioma: ESMO Clinical Practice Guidelines for diagnosis, treatment and follow-up. Ann. Oncol. 2014, 25, iii93–iii101. [Google Scholar]
- Colotta, F.; Allavena, P.; Sica, A.; Garlanda, C.; Mantovani, A. Cancer-related inflammation, the seventh hallmark of cancer: Links to genetic instability. Carcinogenesis 2009, 30, 1073–1081. [Google Scholar]
- Mantovani, A.; Allavena, P.; Sica, A.; Balkwill, F. Cancer-related inflammation. Nature 2008, 454, 436–444. [Google Scholar]
- Han, S.; Zhang, C.; Li, Q.; Dong, J.; Liu, Y.; Huang, Y.; Jiang, T.; Wu, A. Tumour-infiltrating CD4+ and CD8+ lymphocytes as predictors of clinical outcome in glioma. Br. J. Cancer 2014, 110, 2560–2568. [Google Scholar] [PubMed]
- Lohr, J.; Ratliff, T.; Huppertz, A.; Ge, Y.; Dictus, C.; Ahmadi, R.; Grau, S.; Hiraoka, N.; Eckstein, V.; Ecker, R.C.; et al. Effector T-cell infiltration positively impacts survival of glioblastoma patients and is impaired by tumor-derived TGF-β. Clin. Cancer Res. 2011, 17, 4296–4308. [Google Scholar] [PubMed]
- Liang, J.; Piao, Y.; Holmes, L.; Fuller, G.N.; Henry, V.; Tiao, N.; De Groot, J.F. Neutrophils promote the malignant glioma phenotype through S100A4. Clin. Cancer Res. 2014, 20, 187–198. [Google Scholar] [PubMed]
- Auezova, R.; Ryskeldiev, N.; Doskaliyev, A.; Kuanyshev, Y.; Zhetpisbaev, B.; Aldiyarova, N.; Ivanova, N.; Akshulakov, S.; Auezova, L. Association of preoperative levels of selected blood inflammatory markers with prognosis in gliomas. OncoTargets Ther. 2016, 9, 6111–6117. [Google Scholar]
- Zheng, S.H.; Huang, J.L.; Chen, M.; Wang, B.L.; Ou, Q.S.; Huang, S.Y. Diagnostic value of preoperative inflammatory markers in patients with glioma: A multicenter cohort study. J. Neurosurg. 2017, 129, 583–592. [Google Scholar]
- You, J.; Zhu, G.Q.; Xie, L.; Liu, W.Y.; Shi, L.; Wang, O.C.; Huang, Z.H.; Braddock, M.; Guo, G.L.; Zheng, M.H. Preoperative platelet to lymphocyte ratio is a valuable prognostic biomarker in patients with colorectal cancer. Oncotarget 2016, 7, 25516–25527. [Google Scholar] [PubMed]
- De Simone, M.; Iaconetta, G.; Palermo, G.; Fiorindi, A.; Schaller, K.; De Maria, L. Clustering functional magnetic resonance imaging time series in glioblastoma characterization: A review of the evolution, applications, and potentials. Brain Sci. 2024, 14, 296. [Google Scholar] [CrossRef]
- De Simone, M.; Choucha, A.; Ranalli, C.; Pecoraro, G.; Appay, R.; Chinot, O.L.; Dufour, H.; Iaconetta, G. Astrocytomas IDH-mutant of posterior cranial fossa, clinical presentation, imaging features and onco-functional balance in surgical management. Neurosurg. Rev. 2025, 48, 271. [Google Scholar] [CrossRef]


| Characteristics | IDH-Mutant (n = 30) | IDH-Wild-Type (n = 36) | Total (n = 66) | p-Value | Effect Size |
|---|---|---|---|---|---|
| Age (years) | |||||
| Mean ± SD | 53.93 ± 12.00 | 62.39 ± 10.12 | 58.55 ± 11.72 | 0.003 1 | d = 0.76 |
| Range | 33–79 | 41–79 | 33–79 | ||
| Gender, n (%) | 0.294 2 | OR = 1.76 | |||
| Male | 22 (73.3) | 22 (61.1) | 44 (66.7) | ||
| Female | 8 (26.7) | 14 (38.9) | 22 (33.3) | ||
| ECOG PS, n (%) | 0.012 2 | OR = 3.58 | |||
| 0–1 | 24 (80.0) | 19 (52.8) | 43 (65.2) | ||
| 2–3 | 6 (20.0) | 17 (47.2) | 23 (34.8) | ||
| Tumor Location, n (%) | 0.324 2 | V = 0.22 | |||
| Frontal | 12 (40.0) | 15 (41.7) | 27 (40.9) | ||
| Temporal | 8 (26.7) | 11 (30.6) | 19 (28.8) | ||
| Parietal | 7 (23.3) | 6 (16.7) | 13 (19.7) | ||
| Occipital | 3 (10.0) | 4 (11.1) | 7 (10.6) | ||
| Surgical Resection, n (%) | 0.218 2 | OR = 1.68 | |||
| Total | 18 (60.0) | 17 (47.2) | 35 (53.0) | ||
| Subtotal | 12 (40.0) | 19 (52.8) | 31 (47.0) | ||
| MGMT Methylation, n (%) | 0.042 2 | OR = 2.72 | |||
| Methylated | 19 (63.3) | 14 (38.9) | 33 (50.0) | ||
| Non-methylated | 11 (36.7) | 22 (61.1) | 33 (50.0) | ||
| Radiotherapy, n (%) | <0.001 2 | OR = 29.33 | |||
| Yes | 29 (96.7) | 18 (50.0) | 47 (71.2) | ||
| No | 1 (3.3) | 18 (50.0) | 19 (28.8) | ||
| Chemotherapy, n (%) | 0.001 2 | OR = 6.25 | |||
| Yes | 25 (83.3) | 16 (44.4) | 41 (62.1) | ||
| No | 5 (16.7) | 20 (55.6) | 25 (37.9) | ||
| Survival Status, n (%) | 0.064 2 | OR = 2.60 | |||
| Alive | 15 (50.0) | 10 (27.8) | 25 (37.9) | ||
| Deceased | 15 (50.0) | 26 (72.2) | 41 (62.1) |
| Parameters | IDH-Mutant (n = 30) | IDH-Wild-Type (n = 36) | Total (n = 66) | p-Value | Effect Size |
|---|---|---|---|---|---|
| Complete Blood Count Parameters | |||||
| Hemoglobin (g/dL) 1 | 13.2 ± 1.8 | 12.4 ± 1.6 | 12.8 ± 1.7 | 0.034 | d = 0.47 |
| RDW (%) 1 | 13.8 ± 1.2 | 14.9 ± 1.4 | 14.4 ± 1.3 | 0.021 | d = 0.85 |
| PLT (103/µL) 1 | 268.26 ± 113.97 | 290.11 ± 74.84 | 280.18 ± 94.51 | 0.042 | d = 0.23 |
| MPV (fL) 1 | 8.61 ± 0.93 | 17.99 ± 57.09 | 13.7 ± 42.16 | 0.757 | d = 0.23 |
| Inflammatory Markers | |||||
| CRP (mg/L) 2 | 5.2 ± 4.8 | 8.9 ± 6.2 | 7.2 ± 5.8 | 0.015 | r = 0.30 |
| ESR (mm/h) 2 | 18.4 ± 12.6 | 28.7 ± 15.8 | 24.1 ± 14.9 | 0.008 | r = 0.33 |
| Leukocyte Subgroups | |||||
| Neutrophil (103/µL) 2 | 8.81 ± 3.71 | 8.48 ± 2.34 | 8.63 ± 3.02 | 0.887 | r = 0.02 |
| Lymphocyte (103/µL) 2 | 1.79 ± 0.67 | 1.97 ± 1.71 | 1.88 ± 1.34 | 0.290 | r = 0.13 |
| Monocyte (103/µL) 2 | 0.78 ± 0.36 | 0.59 ± 0.29 | 0.68 ± 0.33 | 0.026 | r = 0.27 |
| Eosinophil (103/µL) 2 | 0.11 ± 0.13 | 0.04 ± 0.06 | 0.07 ± 0.10 | 0.017 | r = 0.29 |
| Calculated Ratios | |||||
| PLT/EO ratio 2 | 12,714.1 ± 13,355.9 | 20,647.0 ± 14,404.3 | 17,041.1 ± 14,392.7 | 0.006 | r = 0.34 |
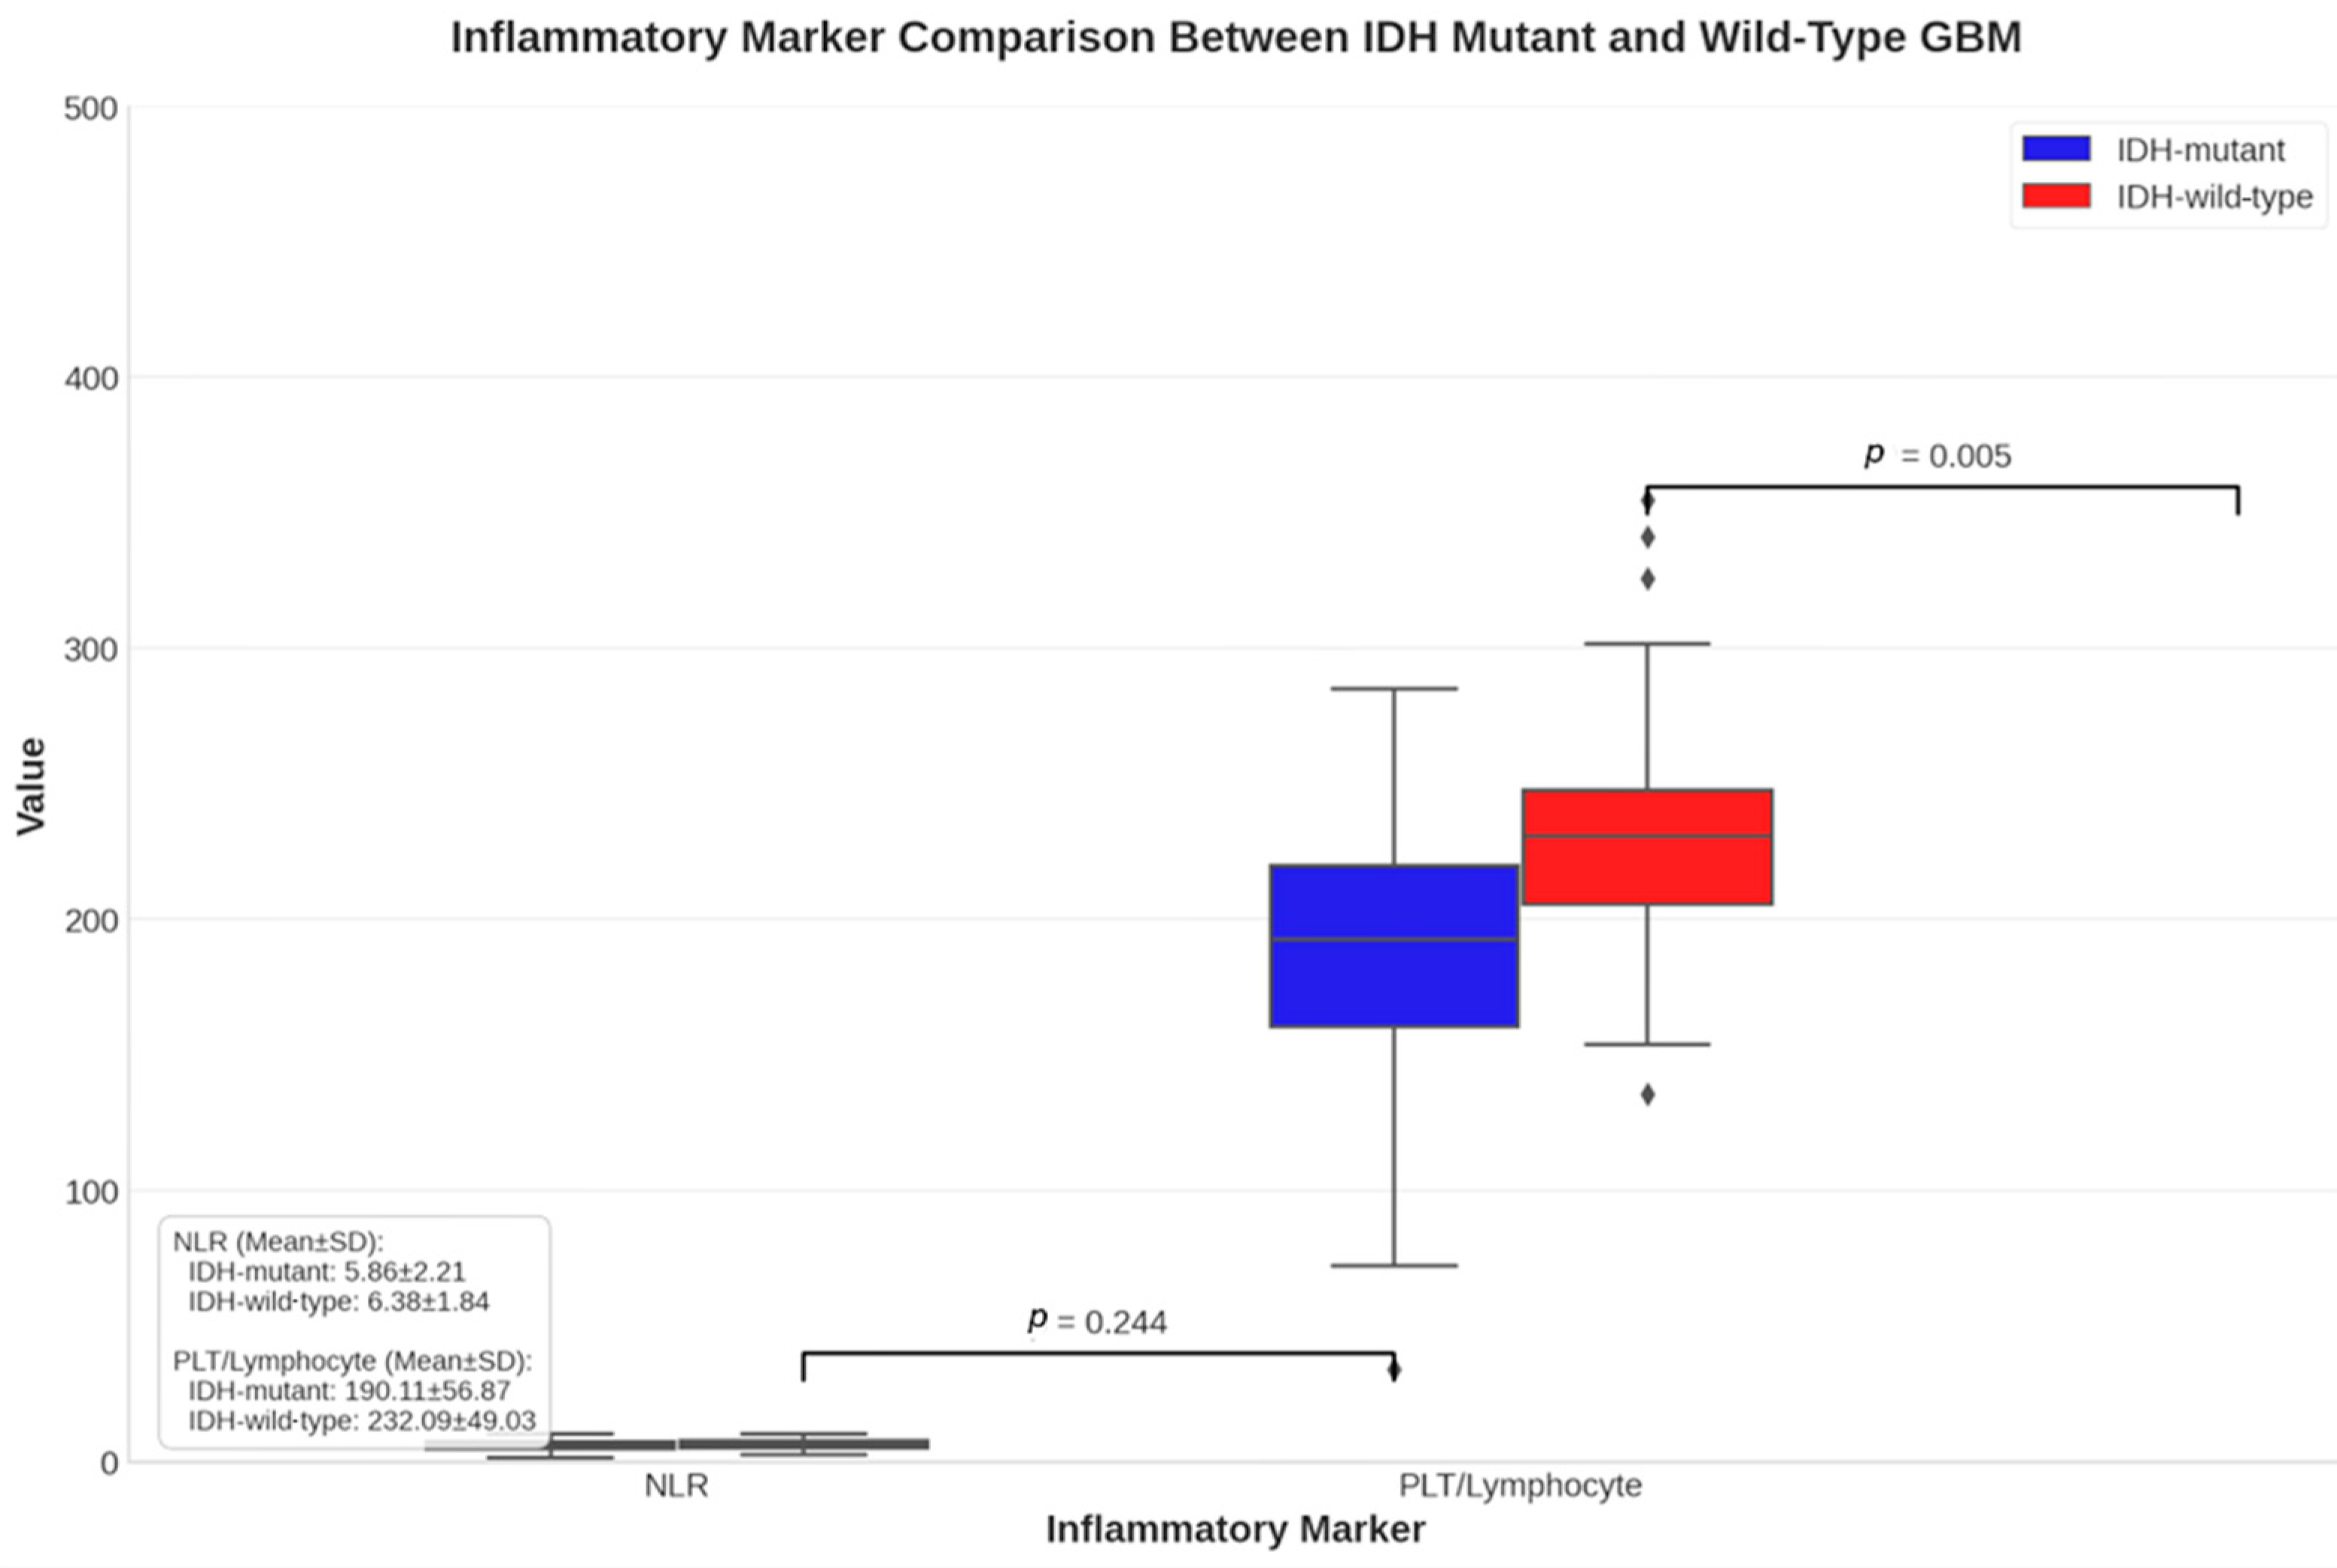
| Neutrophil/Lymphocyte 2 | 6.33 ± 6.10 | 6.63 ± 4.04 | 6.5 ± 5.04 | 0.467 | r = 0.09 |
| Neutrophil/Monocyte 2 | 17.53 ± 21.72 | 20.34 ± 16.52 | 19.06 ± 18.96 | 0.014 | r = 0.30 |
| Lymphocyte/Monocyte 2 | 2.96 ± 2.15 | 4.02 ± 3.60 | 3.54 ± 3.05 | 0.312 | r = 0.13 |
| Platelet/Neutrophil 2 | 36.85 ± 26.29 | 37.11 ± 14.55 | 36.9 ± 20.55 | 0.417 | r = 0.10 |
| Platelet/Lymphocyte 2 | 191.38 ± 151.17 | 231.49 ± 132.36 | 213.25 ± 141.54 | 0.100 | r = 0.20 |
| Platelet/Monocyte 2 | 577.38 ± 666.18 | 825.24 ± 964.93 | 712.58 ± 845.47 | 0.003 | r = 0.37 |
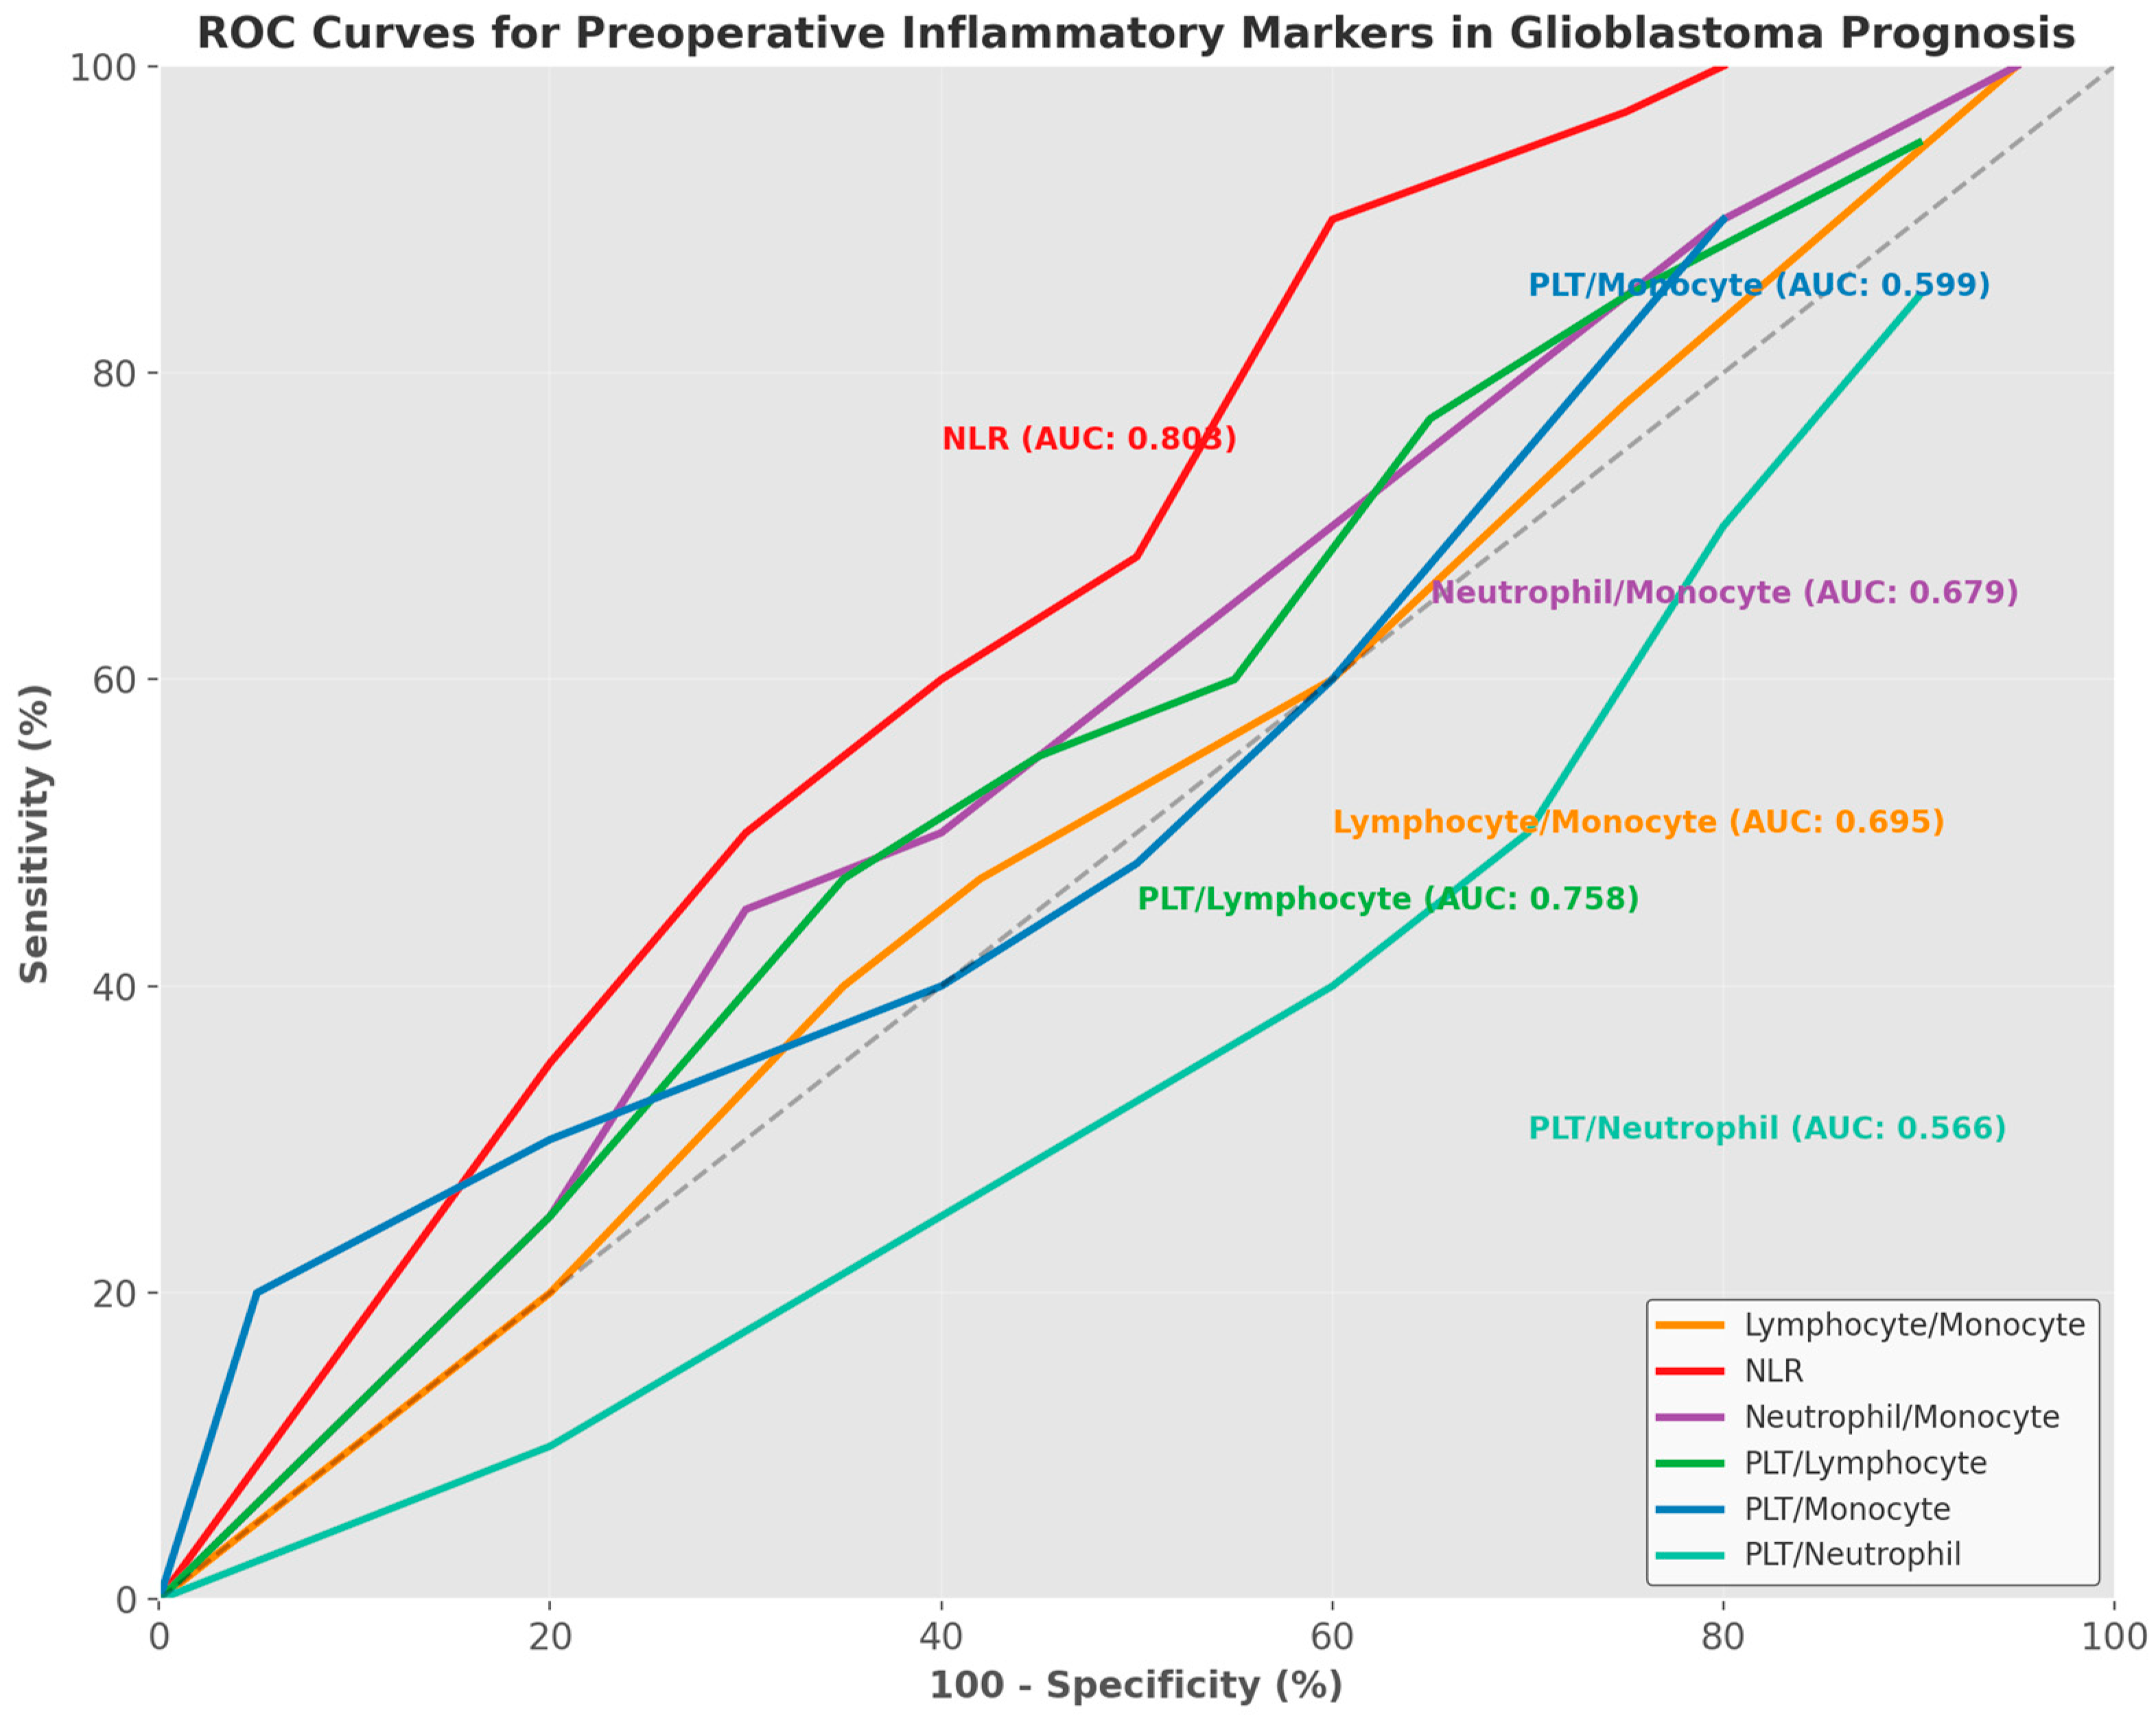
| Parameters | Lymphocyte/ Monocyte | NLR | Neutrophil/Monocyte | PLT/Lymphocyte | PLT/Monocyte | PLT/Neutrophil |
|---|---|---|---|---|---|---|
| AUC | 0.695 | 0.803 | 0.679 | 0.758 | 0.599 | 0.566 |
| AUC-CI (95%) | 0.572–0.818 | 0.695–0.911 | 0.552–0.806 | 0.644–0.872 | 0.468–0.730 | 0.432–0.700 |
| Cut-off value | <2.71 | >3.39 | >12.66 | >136.25 | >465.71 | <40.31 |
| Youden Index | 0.363 | 0.471 | 0.379 | 0.445 | 0.199 | 0.236 |
| Sensitivity (%) | 68.29 | 95.12 | 65.85 | 80.49 | 43.90 | 75.61 |
| 95% CI (Sensitivity) | 51.9–81.9 | 83.5–99.4 | 49.4–79.9 | 65.1–91.2 | 28.5–60.3 | 59.7–87.6 |
| Specificity (%) | 68.0 | 52.0 | 72.0 | 64.0 | 76.0 | 48.0 |
| 95% CI (Specificity) | 46.5–85.1 | 31.3–72.2 | 50.6–87.9 | 42.5–82.0 | 54.9–90.6 | 27.8–68.7 |
| PPV (%) | 77.8 | 76.5 | 79.4 | 78.6 | 75.0 | 70.5 |
| NPV (%) | 56.7 | 86.7 | 56.2 | 66.7 | 45.2 | 54.5 |
| +LR | 2.13 | 1.98 | 2.35 | 2.24 | 1.83 | 1.45 |
| −LR | 0.47 | 0.094 | 0.47 | 0.30 | 0.74 | 0.51 |
| p-value | 0.003 | 0.001 | 0.009 | 0.001 | 0.167 | 0.398 |
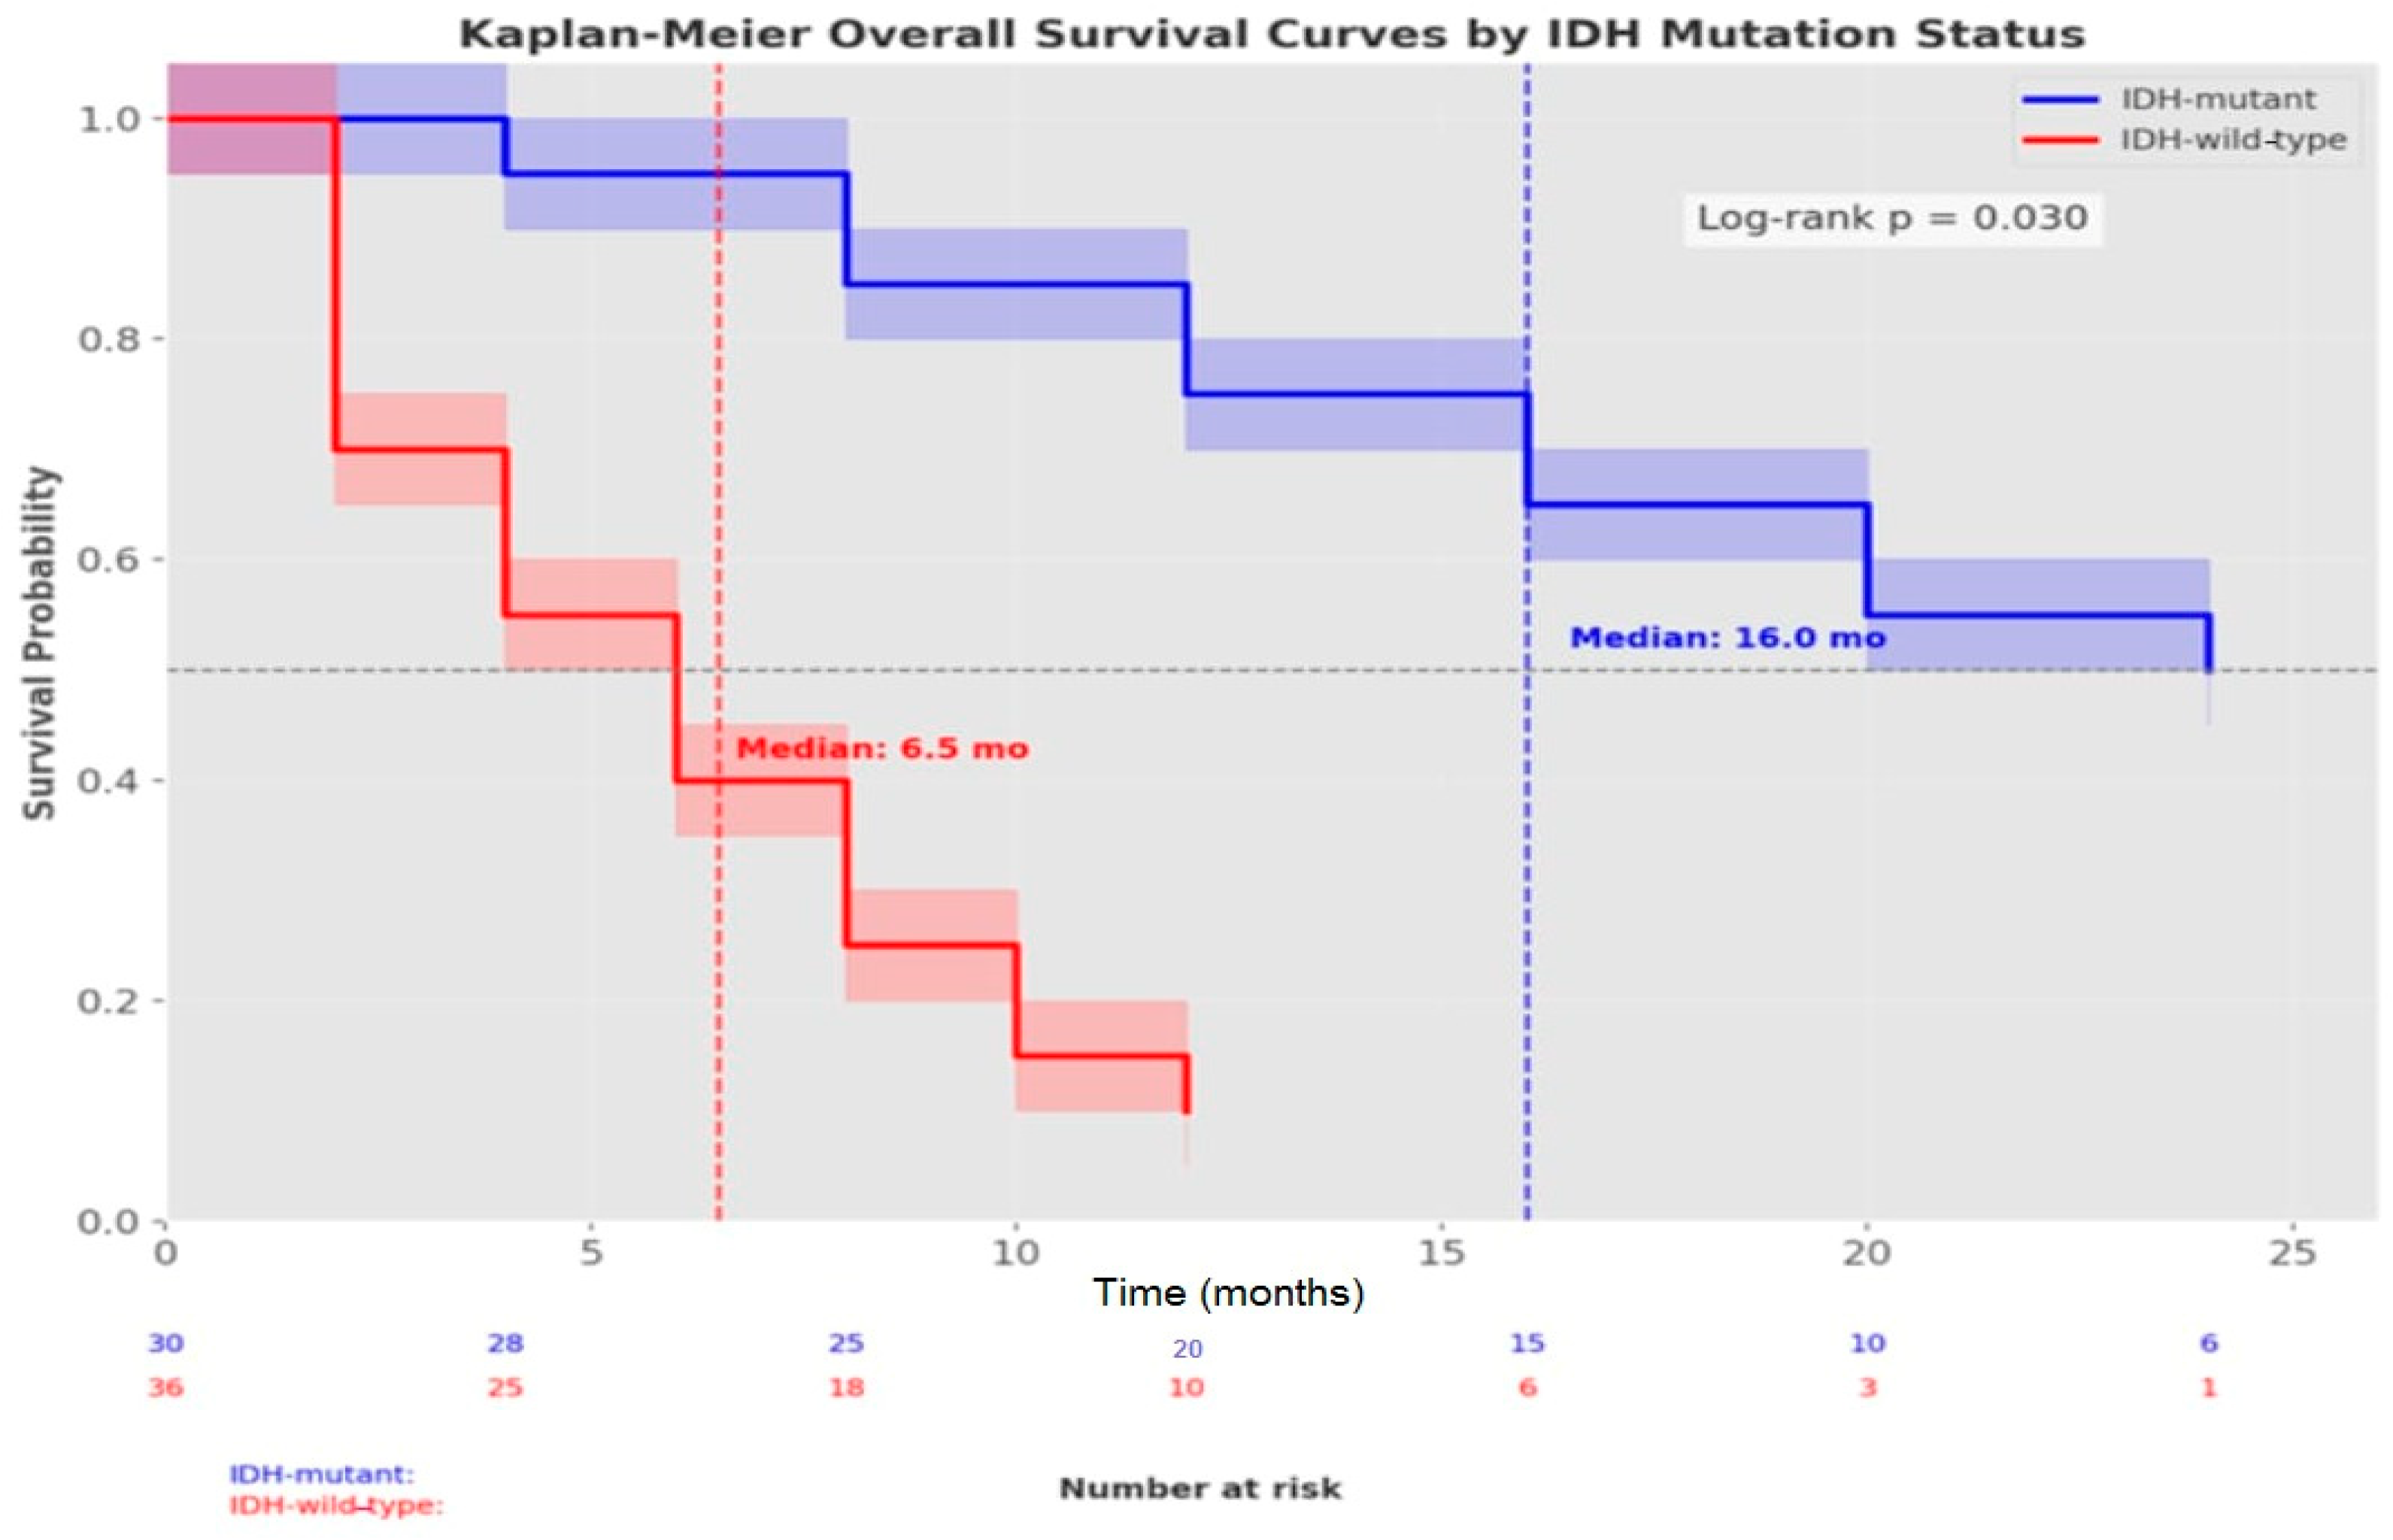
| Parameters | Median Survival (Months) | 95% CI | 6-Month OS (%) | 1-Year OS (%) | HR (95% CI) | p-Value * |
|---|---|---|---|---|---|---|
| Overall Survival | ||||||
| All Patients | 14.0 | 9.86–18.13 | 79.3 | 46.3 | - | 0.001 |
| Survival by IDH Status | 0.030 | |||||
| IDH-mutant | 16.0 | 11.41–20.58 | 92.8 | 69.2 | 1.0 (ref) | |
| IDH-wild-type | 6.5 | 0.0–15.35 | 49.0 | 2.5 | 2.84 (1.56–5.18) | |
| Overall Progression-Free Survival | ||||||
| All Patients | 11.0 | 7.83–14.16 | 67.5 | 33.3 | - | 0.001 |
| Progression-Free Survival by IDH Status | <0.001 | |||||
| IDH-mutant | 12.0 | 9.16–14.83 | 85.0 | 41.7 | 1.0 (ref) | |
| IDH-wild-type | 4.0 | 2.64–5.35 | 7.5 | - | 3.92 (2.14–7.16) |
| Variable | HR (Hazard Ratio) | 95% CI | p-Value |
|---|---|---|---|
| IDH Mutation | |||
| Mutant | 1.0 (ref) | - | - |
| Wild-type | 2.84 | 1.56–5.18 | 0.001 |
| Age | |||
| ≤60 Years | 1.0 (ref) | - | - |
| >60 Years | 1.76 | 1.12–2.78 | 0.014 |
| ECOG Performance Status | |||
| 0–1 | 1.0 (ref) | - | - |
| 2–3 | 2.12 | 1.34–3.36 | 0.002 |
| Surgical Resection | |||
| Total | 1.0 (ref) | - | - |
| Subtotal | 1.68 | 1.08–2.62 | 0.021 |
| MGMT Methylation | |||
| Methylated | 1.0 (ref) | - | - |
| Non-methylated | 1.92 | 1.22–3.02 | 0.005 |
| Neutrophil-to-lymphocyte Ratio | |||
| ≤3.39 | 1.0 (ref) | - | - |
| >3.39 | 1.84 | 1.16–2.92 | 0.009 |
Disclaimer/Publisher’s Note: The statements, opinions and data contained in all publications are solely those of the individual author(s) and contributor(s) and not of MDPI and/or the editor(s). MDPI and/or the editor(s) disclaim responsibility for any injury to people or property resulting from any ideas, methods, instructions or products referred to in the content. |
© 2025 by the authors. Licensee MDPI, Basel, Switzerland. This article is an open access article distributed under the terms and conditions of the Creative Commons Attribution (CC BY) license (https://creativecommons.org/licenses/by/4.0/).
Share and Cite
Sarac, M.E.; Boga, Z.; Kara, Ü.; Akbıyık, T.; Çınkı, A.H.; Olguner, S.K. Potential Biomarkers for IDH-Mutant and IDH-Wild-Type Glioblastomas: A Single-Center Retrospective Study. J. Clin. Med. 2025, 14, 2518. https://doi.org/10.3390/jcm14072518
Sarac ME, Boga Z, Kara Ü, Akbıyık T, Çınkı AH, Olguner SK. Potential Biomarkers for IDH-Mutant and IDH-Wild-Type Glioblastomas: A Single-Center Retrospective Study. Journal of Clinical Medicine. 2025; 14(7):2518. https://doi.org/10.3390/jcm14072518
Chicago/Turabian StyleSarac, Mustafa Emre, Zeki Boga, Ümit Kara, Tolga Akbıyık, Ahmet Hamit Çınkı, and Semih Kivanc Olguner. 2025. "Potential Biomarkers for IDH-Mutant and IDH-Wild-Type Glioblastomas: A Single-Center Retrospective Study" Journal of Clinical Medicine 14, no. 7: 2518. https://doi.org/10.3390/jcm14072518
APA StyleSarac, M. E., Boga, Z., Kara, Ü., Akbıyık, T., Çınkı, A. H., & Olguner, S. K. (2025). Potential Biomarkers for IDH-Mutant and IDH-Wild-Type Glioblastomas: A Single-Center Retrospective Study. Journal of Clinical Medicine, 14(7), 2518. https://doi.org/10.3390/jcm14072518