
Overnight Stay in the Emergency Department and In-Hospital Mortality Among Elderly Patients: A 6-Year Follow-Up Italian Study


Abstract
1. Introduction
1.1. Background/Rationale
1.2. Objectives
2. Methods
2.1. Study Design, Setting, and Participants
2.2. Variables
2.3. Statistical Methods
3. Results
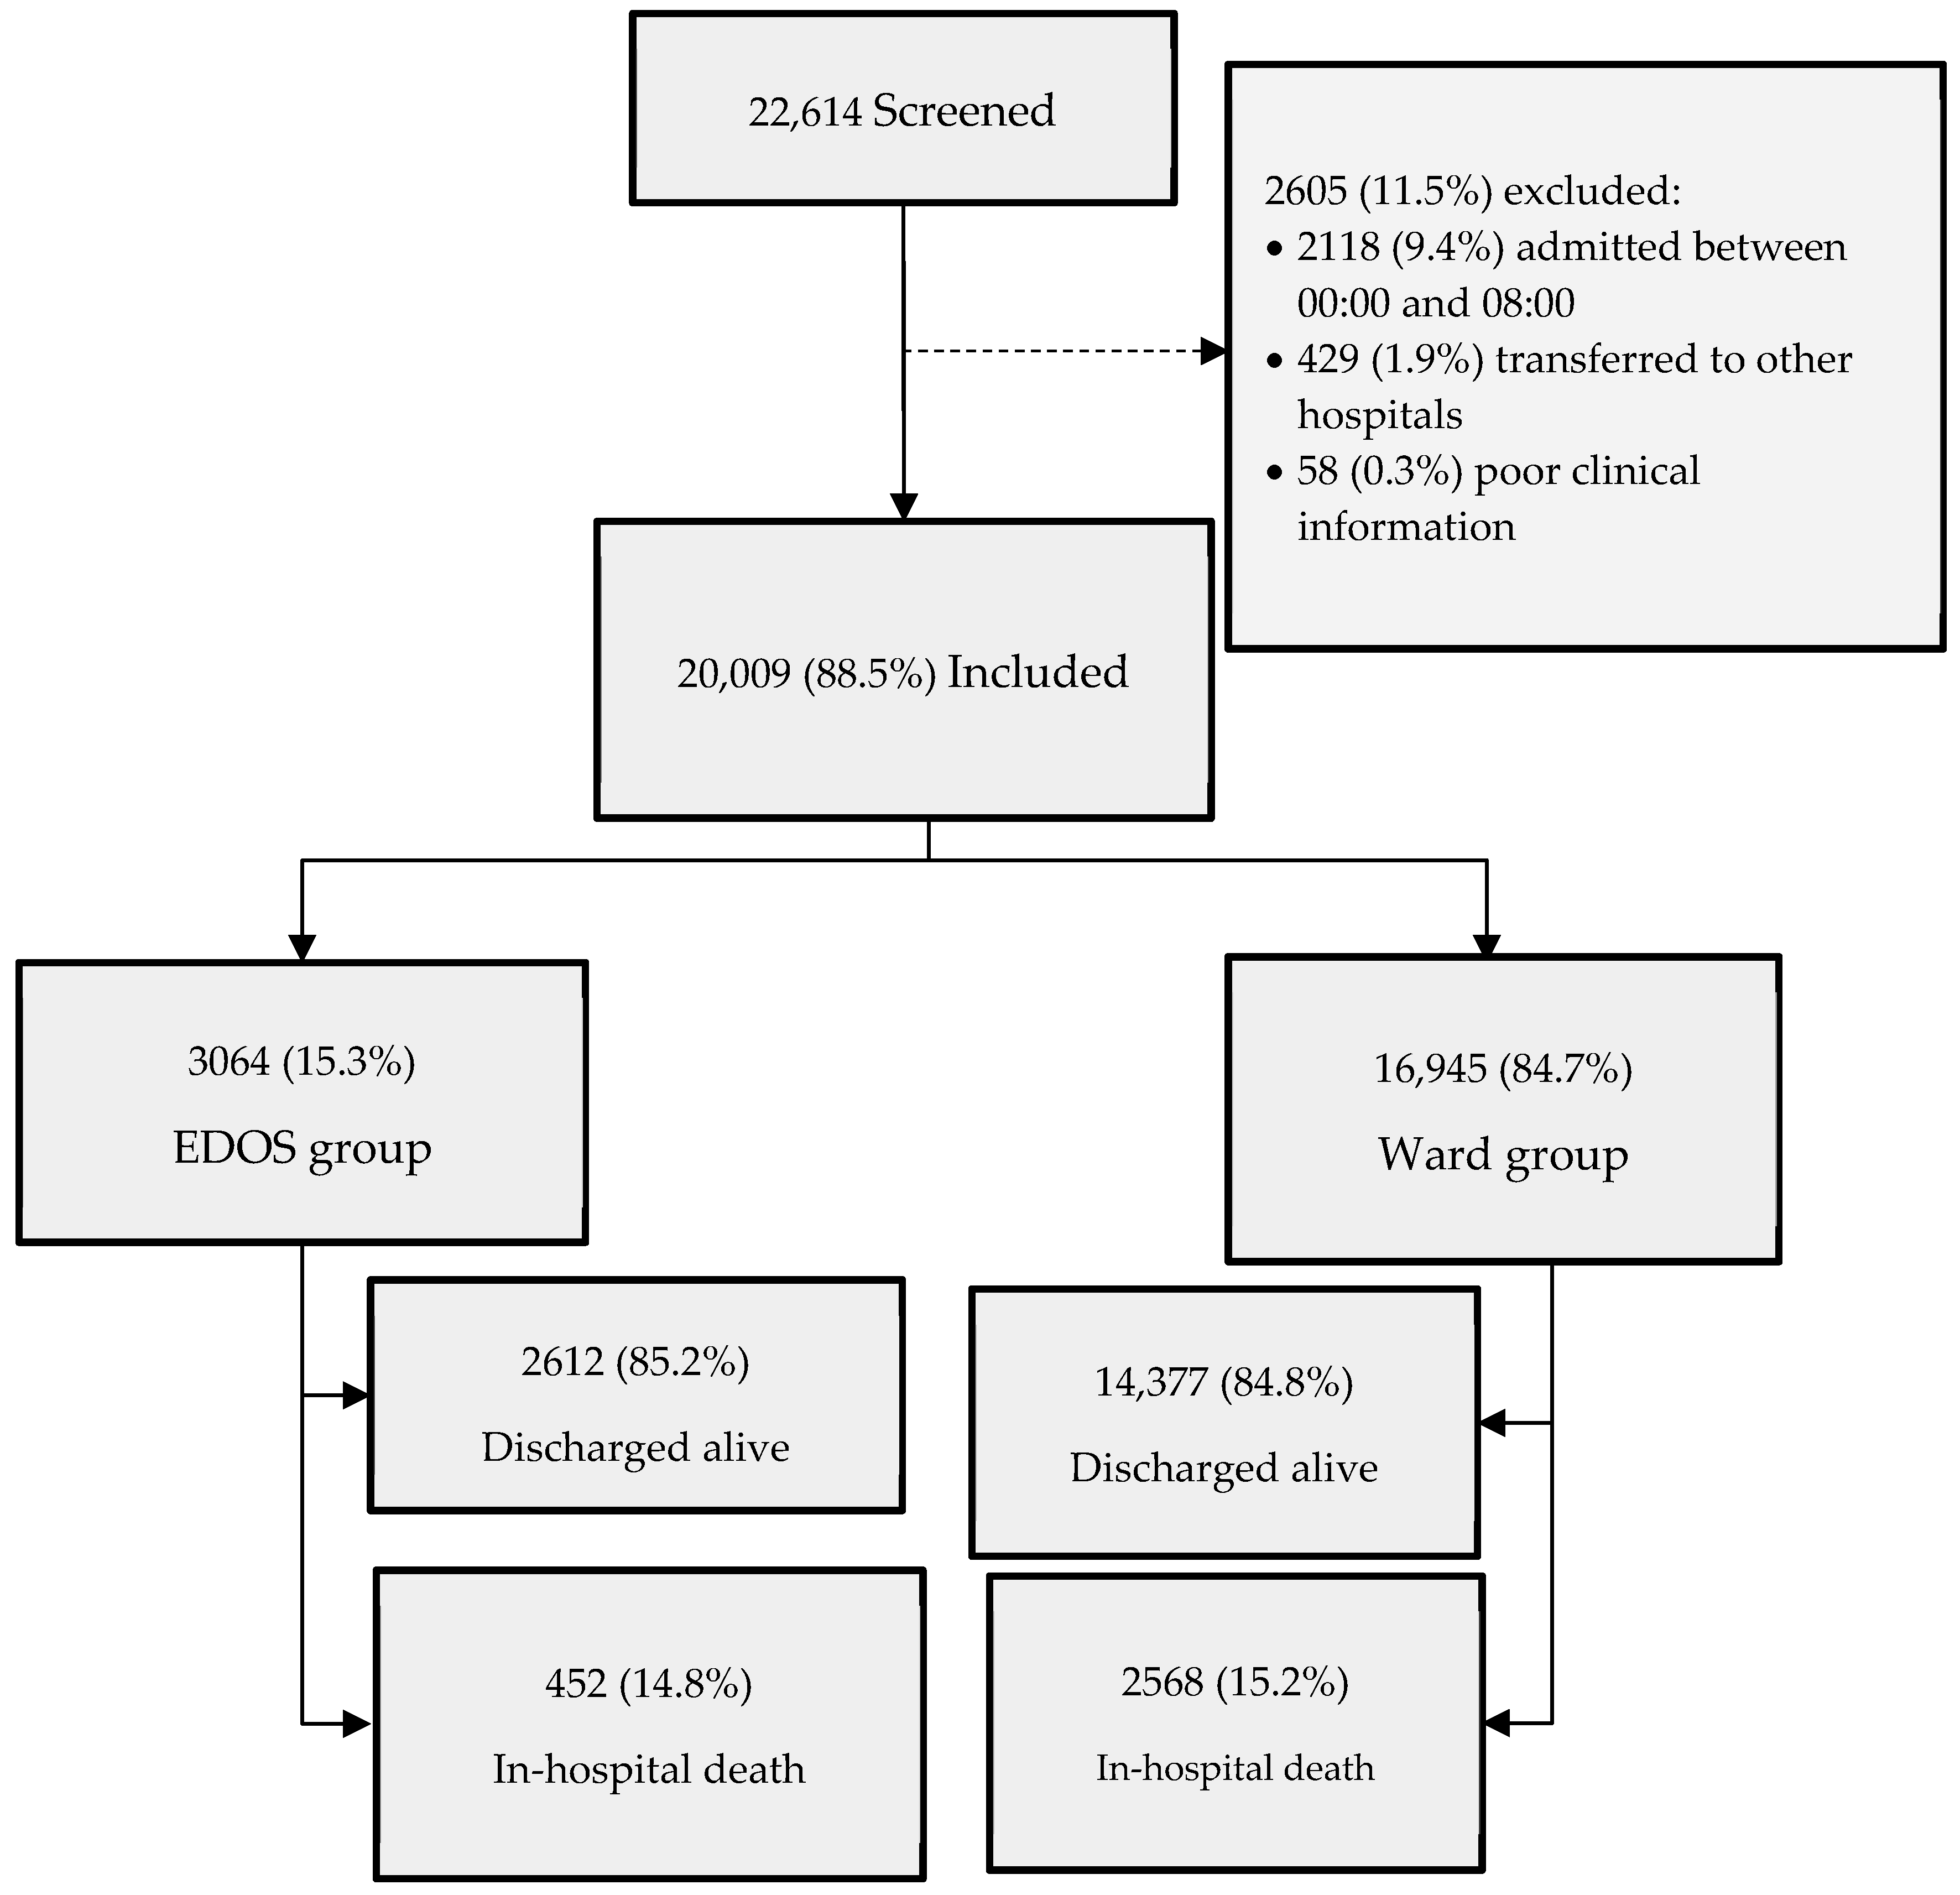
3.1. Participants
3.2. Descriptive Data
3.3. Outcome Data
3.4. Main Results
4. Discussion
4.1. Key Results
4.2. Limitations
4.3. Interpretation
4.4. Generalizability
Author Contributions
Funding
Institutional Review Board Statement
Informed Consent Statement
Data Availability Statement
Acknowledgments
Conflicts of Interest
Abbreviations
| CCI | Charlson Comorbidity Index |
| CHF | Congestive heart failure |
| CKD | Hemiplegia, chronic kidney disease |
| COPD | Chronic obstructive pulmonary disease |
| CVA | Acute Cerebrovascular Accidents or Transient Ischemic Attacks |
| D | Dementia |
| DM | Diabetes mellitus |
| ED | Emergency department |
| EDOS | Emergency department overnight stay |
| GI | Connective tissue diseases, peptic ulcer disease |
| L | Lymphoma and leukemia |
| LD | Liver disease |
| MI | History of myocardial infarction |
| NEWS | National Early Warning Score |
| PVD | Peripheral vascular disease |
| ROC | Receiver operating characteristic |
| ST | Solid tumors |
Appendix A

| Characteristic | Total No. (%) | EDOS Group No. (%) | Ward Group No. (%) | Difference (95% CI) | p-Value |
|---|---|---|---|---|---|
| Patients | 20,009 | 3064 (15.3) | 16,945 (84.7) | -- | -- |
| History | |||||
| CVA | 3002 (15) | 529 (17.3) | 2473 (14.6) | 2.7 (1.2 to 4.1) | <0.001 |
| Solid Tumor | 3583 (17.9) | 605 (19.7) | 2978 (17.6) | 2.1 (0.7 to 3.7) | 0.004 |
| CKD | 2452 (12.3) | 408 (13.3) | 2044 (12.1) | 1.2 (0 to 2.6) | 0.052 |
| DM | 3783 (18.9) | 607 (19.8) | 3176 (18.7) | 1.1 (−0.4 to 2.6) | 0.018 |
| COPD | 3293 (16.5) | 523 (17.1) | 2770 (16.3) | 0.8 (−0.7 to 2.2) | 0.321 |
| CTD | 1254 (6.3) | 212 (6.9) | 1042 (6.1) | 0.8 (−0.2 to 1.8) | 0.106 |
| MI | 1917 (9.6) | 308 (10) | 1609 (9.5) | 0.5 (−0.6 to 1.7) | 0.335 |
| Leukemia | 316 (1.6) | 55 (1.8) | 261 (1.5) | 0.3 (−0.2 to 0.8) | 0.298 |
| Lymphoma | 117 (0.6) | 24 (0.8) | 93 (0.5) | 0.3 (−0.1 to 0.6) | 0.117 |
| PUD | 543 (2.7) | 80 (2.6) | 463 (2.7) | −0.1 (−0.7 to 0.5) | 0.703 |
| LD | 919 (4.6) | 135 (4.4) | 784 (4.6) | −0.2 (−1.0 to 0.6) | 0.591 |
| PVD | 708 (3.5) | 100 (3.3) | 608 (3.6) | −0.3 (−1.0 to 0.4) | 0.371 |
| CHF | 2056 (10.3) | 307 (10) | 1749 (10.3) | −0.3 (−1.4 to 0.9) | 0.612 |
| Dementia | 4314 (21.6) | 649 (21.2) | 3665 (21.6) | −0.4 (−2.0 to 0.7) | 0.580 |
| Hemiplegia | 1976 (9.9) | 254 (8.3) | 1722 (10.2) | −1.9 (−2.9 to −0.8) | 0.165 |
| Length of Stay | Total No. (%) | EDOS Group No. (%) | Ward Group No. (%) | Difference (95% CI) | p-Value |
|---|---|---|---|---|---|
| ≤6 h | 17,438 (87.2) | 2491 (81.3) | 14,947 (88.2) | −6.9 (−8.4 to −5.5) | <0.001 |
| 6 to ≤12 h | 2316 (11.6) | 417 (13.6) | 1899 (11.2) | +2.4 (1.1 to 3.7) | <0.001 |
| >12 to ≤24 h | 194 (1.0) | 95 (3.1) | 99 (0.6) | +2.5 (1.9 to 3.2) | <0.001 |
| >24 h | 61 (0.3) | 61 (2.0) | 0 | +2.0 (1.5 to 2.5) | <0.001 |
| Total No. (%) | EDOS Group No. (%) | Ward Group No. (%) | Difference (95% CI) | p-Value | |
|---|---|---|---|---|---|
| Patients, No. | 20,009 | 3064 (15.3) | 16,945 (84.7) | -- | -- |
| Year | |||||
| 2017 | 3355 (16.8) | 422 (13.8) | 2933 (17.3) | −3.5 (−4.9 to −2.2) | <0.001 |
| 2018 | 3307 (16.5) | 400 (13.1) | 2907 (17.2) | −4.1 (−5.4 to −2.8) | <0.001 |
| 2019 | 3355 (16.8) | 474 (15.5) | 2881 (17.0) | −1.5 (−2.9 to −0.1) | 0.037 |
| 2020 | 2728 (13.6) | 461 (15.0) | 2267 (13.4) | 1.6 (0.3 to 3) | 0.013 |
| 2021 | 3687 (18.4) | 638 (20.8) | 3049 (18.0) | 2.8 (1.3 to 4.4) | <0.001 |
| 2022 | 3577 (17.9) | 669 (21.8) | 2908 (17.2) | 4.6 (3.1 to 6.3) | <0.001 |
| Month | |||||
| January | 1848 (9.2) | 298 (9.7) | 1550 (9.1) | 0.6 (−0.5 to 1.7) | 0.309 |
| February | 1555 (7.8) | 231 (7.5) | 1324 (7.8) | −0.3 (−1.3 to 0.8) | 0.602 |
| March | 1668 (8.3) | 269 (8.8) | 1399 (8.3) | 0.5 (−0.5 to 1.6) | 0.335 |
| April | 1679 (8.4) | 290 (9.5) | 1389 (8.2) | 1.3 (0.2 to 2.4) | 0.020 |
| May | 1720 (8.6) | 263 (8.6) | 1457 (8.6) | 0 (−1 to 1.1) | 0.978 |
| June | 1600 (8.0) | 249 (8.1) | 1457 (8.6) | −0.5 (−1.5 to 0.6) | 0.773 |
| July | 1615 (8.1) | 255 (8.3) | 1360 (8.0) | 0.3 (−0.7 to 1.4) | 0.579 |
| August | 1741 (8.7) | 230 (7.5) | 1511 (8.9) | −1.4 (−2.4 to −0.3) | 0.011 |
| September | 1673 (8.4) | 233 (7.6) | 1440 (8.5) | −0.9 (−1.9 to 0.2) | 0.100 |
| October | 1794 (9) | 277 (9.0) | 1517 (9.0) | 0 (−1 to 1.2) | 0.875 |
| November | 1793 (9) | 268 (8.7) | 1525 (9.0) | −0.3 (−1.3 to 0.9) | 0.652 |
| December | 1323 (6.6) | 201 (6.6) | 1122 (6.6) | 0 (−1 to 0.9) | 0.900 |
| Season | |||||
| Summer | 4956 (24.8) | 734 (24.0) | 4222 (24.9) | −0.9 (−2.6 to 0.7) | 0.257 |
| Fall | 5260 (26.3) | 778 (25.4) | 4482 (26.5) | −1.1 (−2.7 to 0.6) | 0.221 |
| Spring | 5067 (25.3) | 822 (26.8) | 4245 (25.1) | 1.7 (0.1 to 3.5) | 0.037 |
| Winter | 4726 (23.6) | 730 (23.8) | 3996 (23.6) | 0.2 (−1.4 to 1.9) | 0.771 |
References
- Sklar, D.P.; Crandall, C.S.; Loeliger, E.; Edmunds, K.; Paul, I.; Helitzer, D.L. Unanticipated Death After Discharge Home From the Emergency Department. Ann. Emerg. Med. 2007, 49, 735–745. [Google Scholar] [CrossRef] [PubMed]
- Pines, J.M.; Griffey, R.T. What We Have Learned from a Decade of ED Crowding Research. Acad. Emerg. Med. Off. J. Soc. Acad. Emerg. Med. 2015, 22, 985–987. [Google Scholar] [CrossRef] [PubMed]
- Stang, A.S.; Crotts, J.; Johnson, D.W.; Hartling, L.; Guttmann, A. Crowding Measures Associated with the Quality of Emergency Department Care: A Systematic Review. Acad. Emerg. Med. Off. J. Soc. Acad. Emerg. Med. 2015, 22, 643–656. [Google Scholar] [CrossRef]
- Pines, J.M.; Iyer, S.; Disbot, M.; Hollander, J.E.; Shofer, F.S.; Datner, E.M. The Effect of Emergency Department Crowding on Patient Satisfaction for Admitted Patients. Acad. Emerg. Med. Off. J. Soc. Acad. Emerg. Med. 2008, 15, 825–831. [Google Scholar] [CrossRef]
- Jones, S.; Moulton, C.; Swift, S.; Molyneux, P.; Black, S.; Mason, N.; Oakley, R.; Mann, C. Association between Delays to Patient Admission from the Emergency Department and All-Cause 30-Day Mortality. Emerg. Med. J. EMJ 2022, 39, 168–173. [Google Scholar] [CrossRef]
- Roussel, M.; Teissandier, D.; Yordanov, Y.; Balen, F.; Noizet, M.; Tazarourte, K.; Bloom, B.; Catoire, P.; Berard, L.; Cachanado, M.; et al. Overnight Stay in the Emergency Department and Mortality in Older Patients. JAMA Intern. Med. 2023, 183, 1378–1385. [Google Scholar] [CrossRef]
- Samaras, N.; Chevalley, T.; Samaras, D.; Gold, G. Older Patients in the Emergency Department: A Review. Ann. Emerg. Med. 2010, 56, 261–269. [Google Scholar] [CrossRef]
- Miró, Ò.; Aguiló, S.; Alquézar-Arbé, A.; Fernández, C.; Burillo, G.; Martínez, S.G.; Larrull, M.E.M.; Periago, A.B.B.; Molinas, C.L.A.; Falcón, C.R.; et al. Overnight Stay in Spanish Emergency Departments and Mortality in Older Patients. Intern. Emerg. Med. 2024, 19, 1653–1665. [Google Scholar] [CrossRef]
- He, H.; Garcia, E.A. Learning from Imbalanced Data. IEEE Trans. Knowl. Data Eng. 2009, 21, 1263–1284. [Google Scholar] [CrossRef]
- Williams, B. The National Early Warning Score: From Concept to NHS Implementation. Clin. Med. Lond. Engl. 2022, 22, 499–505. [Google Scholar] [CrossRef]
- Huang, Y.; Gou, R.; Diao, Y.; Yin, Q.; Fan, W.; Liang, Y.; Chen, Y.; Wu, M.; Zang, L.; Li, L.; et al. Charlson Comorbidity Index Helps Predict the Risk of Mortality for Patients with Type 2 Diabetic Nephropathy. J. Zhejiang Univ. Sci. B 2014, 15, 58–66. [Google Scholar] [CrossRef] [PubMed]
- Charlson, M.E.; Pompei, P.; Ales, K.L.; MacKenzie, C.R. A New Method of Classifying Prognostic Comorbidity in Longitudinal Studies: Development and Validation. J. Chronic Dis. 1987, 40, 373–383. [Google Scholar] [CrossRef] [PubMed]
- Fluss, R.; Faraggi, D.; Reiser, B. Estimation of the Youden Index and Its Associated Cutoff Point. Biom. J. 2005, 47, 458–472. [Google Scholar] [CrossRef] [PubMed]
- Ali, H.; Salleh, M.N.M.; Hussain, K.; Ahmad, A.; Ullah, A.; Muhammad, A.; Naseem, R.; Khan, M. A Review on Data Preprocessing Methods for Class Imbalance Problem. Int. J. Eng. 2019, 8, 390–397. [Google Scholar]
- Jiménez-Fàbrega, X.; Jacob, J. Pre- and Postpandemic Emergency Services: Similarities and Differences. Emerg. Rev. Soc. Espanola Med. Emerg. 2023, 35, 142–145. [Google Scholar] [CrossRef]
- Strini, V.; Piazzetta, N.; Gallo, A.; Schiavolin, R. Barthel Index: Creation and Validation of Two Cut-Offs Using the BRASS Index. Acta Biomed. Atenei Parm. 2020, 91, 19–26. [Google Scholar] [CrossRef]
- Aguilova, L.; Sauzéon, H.; Balland, É.; Consel, C.; N’Kaoua, B. [AGGIR scale: A contribution to specifying the needs of disabled elders]. Rev. Neurol. 2014, 170, 216–221. [Google Scholar] [CrossRef]
- Karamercan, M.A.; Dündar, D.Z.; Slagman, A.; Ergin, M.; Janssens, K.A.C.; Fabbri, A.; Bjornsen, L.P.; Somodi, S.; Adam, V.N.; Polyzogopoulou, E.; et al. Epidemiology of Geriatric Patients Presenting to Emergency Departments in Europe: EGERS Study. Eur. J. Emerg. Med. 2023, 30, 117–124. [Google Scholar] [CrossRef]
- Roussel, M. Increased Mortality in Elderly Patients Who Spent the Night in the Emergency Department: Lessons from the “No Bed Night” Study? Eur. J. Emerg. Med. Off. J. Eur. Soc. Emerg. Med. 2024, 31, 234–235. [Google Scholar] [CrossRef]
- Balen, F.; Routoulp, S.; Charpentier, S.; Azema, O.; Houze-Cerfon, C.-H.; Dubucs, X.; Lauque, D. Impact of Emergency Department Length of Stay on In-Hospital Mortality: A Retrospective Cohort Study. Eur. J. Emerg. Med. Off. J. Eur. Soc. Emerg. Med. 2024, 31, 39–45. [Google Scholar] [CrossRef]
- Lauque, D.; Khalemsky, A.; Boudi, Z.; Östlundh, L.; Xu, C.; Alsabri, M.; Onyeji, C.; Cellini, J.; Intas, G.; Soni, K.D.; et al. Length-of-Stay in the Emergency Department and In-Hospital Mortality: A Systematic Review and Meta-Analysis. J. Clin. Med. 2022, 12, 32. [Google Scholar] [CrossRef] [PubMed]
- Di Prazza, A.; Canino, B.; Barbagallo, M.; Veronese, N. The Importance of Prognosis in Geriatric Patients Attending the Emergency Department: A Comparison between Two Common Short Geriatric Assessment Tools. Aging Clin. Exp. Res. 2023, 35, 3041–3046. [Google Scholar] [CrossRef] [PubMed]
- Pilotto, A.; Sancarlo, D.; Panza, F.; Paris, F.; D’Onofrio, G.; Cascavilla, L.; Addante, F.; Seripa, D.; Solfrizzi, V.; Dallapiccola, B.; et al. The Multidimensional Prognostic Index (MPI), Based on a Comprehensive Geriatric Assessment, Predicts Short- and Long-Term Mortality in Hospitalized Older Patients with Dementia. J. Alzheimers Dis. JAD 2009, 18, 191–199. [Google Scholar] [CrossRef] [PubMed]
- Carpenter, C.R.; Shelton, E.; Fowler, S.; Suffoletto, B.; Platts-Mills, T.F.; Rothman, R.E.; Hogan, T.M. Risk Factors and Screening Instruments to Predict Adverse Outcomes for Undifferentiated Older Emergency Department Patients: A Systematic Review and Meta-Analysis. Acad. Emerg. Med. Off. J. Soc. Acad. Emerg. Med. 2015, 22, 1–21. [Google Scholar] [CrossRef]
| Total No. | EDOS Group No. (%) | Ward Group No. (%) | Difference (95% CI) | p-Value | |
|---|---|---|---|---|---|
| Patients | 20,009 | 3064 (15.3) | 16,945 (84.7) | -- | -- |
| COVID period | 9992 (49.9) | 1768 (57.7) | 8224 (48.5) | 9.2 (7.3 to 11.0) | <0.001 |
| Sex (males) | 9044 (45.2) | 1449 (47.3) | 7595 (44.8) | 2.5 (0.6 to 4.4) | 0.011 |
| Trauma-related | 6219 (31.1) | 1005 (32.8) | 5214 (30.8) | 2.0 (0.2 to 3.8) | 0.025 |
| CCI ≥ 5 | 13,046 (65.2) | 2031 (66.3) | 11,015 (65.0) | 1.3 (−0.5 to 3.1) | 0.171 |
| Age > 85 years | 9026 (45.1) | 1398 (45.6) | 7628 (45.0) | 0.6 (−1.3 to 2.5) | 0.532 |
| NEWS > 6 | 2317 (11.6) | 335 (10.9) | 1982 (11.7) | −0.8 (−2.0 to 0.5) | 0.224 |
| Diagnosis (ICD-9-CM Code) | Total No. | EDOS Group No. (%) | Ward Group No. (%) | Difference (95% CI) | p-Value |
|---|---|---|---|---|---|
| Diseases of the Digestive System (520–579) | 2403 (12.0) | 458 (14.9) | 1945 (11.5) | 3.4 (2.1 to 4.8) | <0.001 |
| Infectious and Parasitic Diseases (001–139) | 1217 (6.1) | 250 (8.2) | 967 (5.7) | 2.5 (1.4 to 3.5) | <0.001 |
| Diseases of the Respiratory System 460–519) | 4033 (20.2) | 682 (22.3) | 3351 (19.8) | 2.5 (0.9 to 4.1) | 0.002 |
| Diseases of the Genitourinary System (580–629) | 1467 (7.3) | 281 (9.2) | 1186 (7.0) | 2.2 (1.1 to 3.3) | <0.001 |
| Symptoms, Signs, and Laboratory Findings (780–799) | 451 (2.3) | 74 (2.4) | 377 (2.2) | 0.2 (−0.4 to 0.8) | 0.514 |
| Endocrine, Nutritional, and Metabolic (240–279) | 439 (2.2) | 74 (2.4) | 365 (2.2) | 0.2 (−0.3 to 0.9) | 0.364 |
| Congenital Malformations (740–759) | 3 (0.01) | 0 | 3 (0.1) | 0 (−0.1 to 0.1) | 0.461 |
| Diseases of the Musculoskeletal System (710–739) | 122 (0.6) | 15 (0.5) | 107 (0.6) | −0.1 (−0.4 to 0.2) | 0.353 |
| External Causes (E, V codes) | 27 (0.1) | 1 (0.03) | 26 (0.2) | −0.17 (−0.2 to 0) | 0.094 |
| Mental Disorders (290–319) | 220 (1.1) | 29 (0.9) | 191 (1.1) | −0.2 (−0.5 to 0.2) | 0.377 |
| Diseases of the Nervous System, Sense Organs (320–389) | 263 (1.3) | 35 (1.1) | 228 (1.3) | −0.2 (−0.6 to 0.2) | 0.363 |
| Neoplasms (140–239) | 972 (4.9) | 134 (4.4) | 838 (4.9) | −0.5 (−1.3 to 2.5) | 0.175 |
| Diseases of the Blood (280–289) | 531 (2.7) | 42 (1.4) | 489 (2.9) | −1.5 (−2.0 to −1.0) | <0.001 |
| Injury and Poisoning (800–999) | 2697 (13.0) | 306 (10) | 2391 (14.1) | −4.1 (−5.3 to −2.9) | <0.001 |
| Diseases of the Circulatory System (390–459) | 5121 (25.6) | 675 (22.0) | 4446 (26.2) | −4.2 (−5.8 to −2.6) | <0.001 |
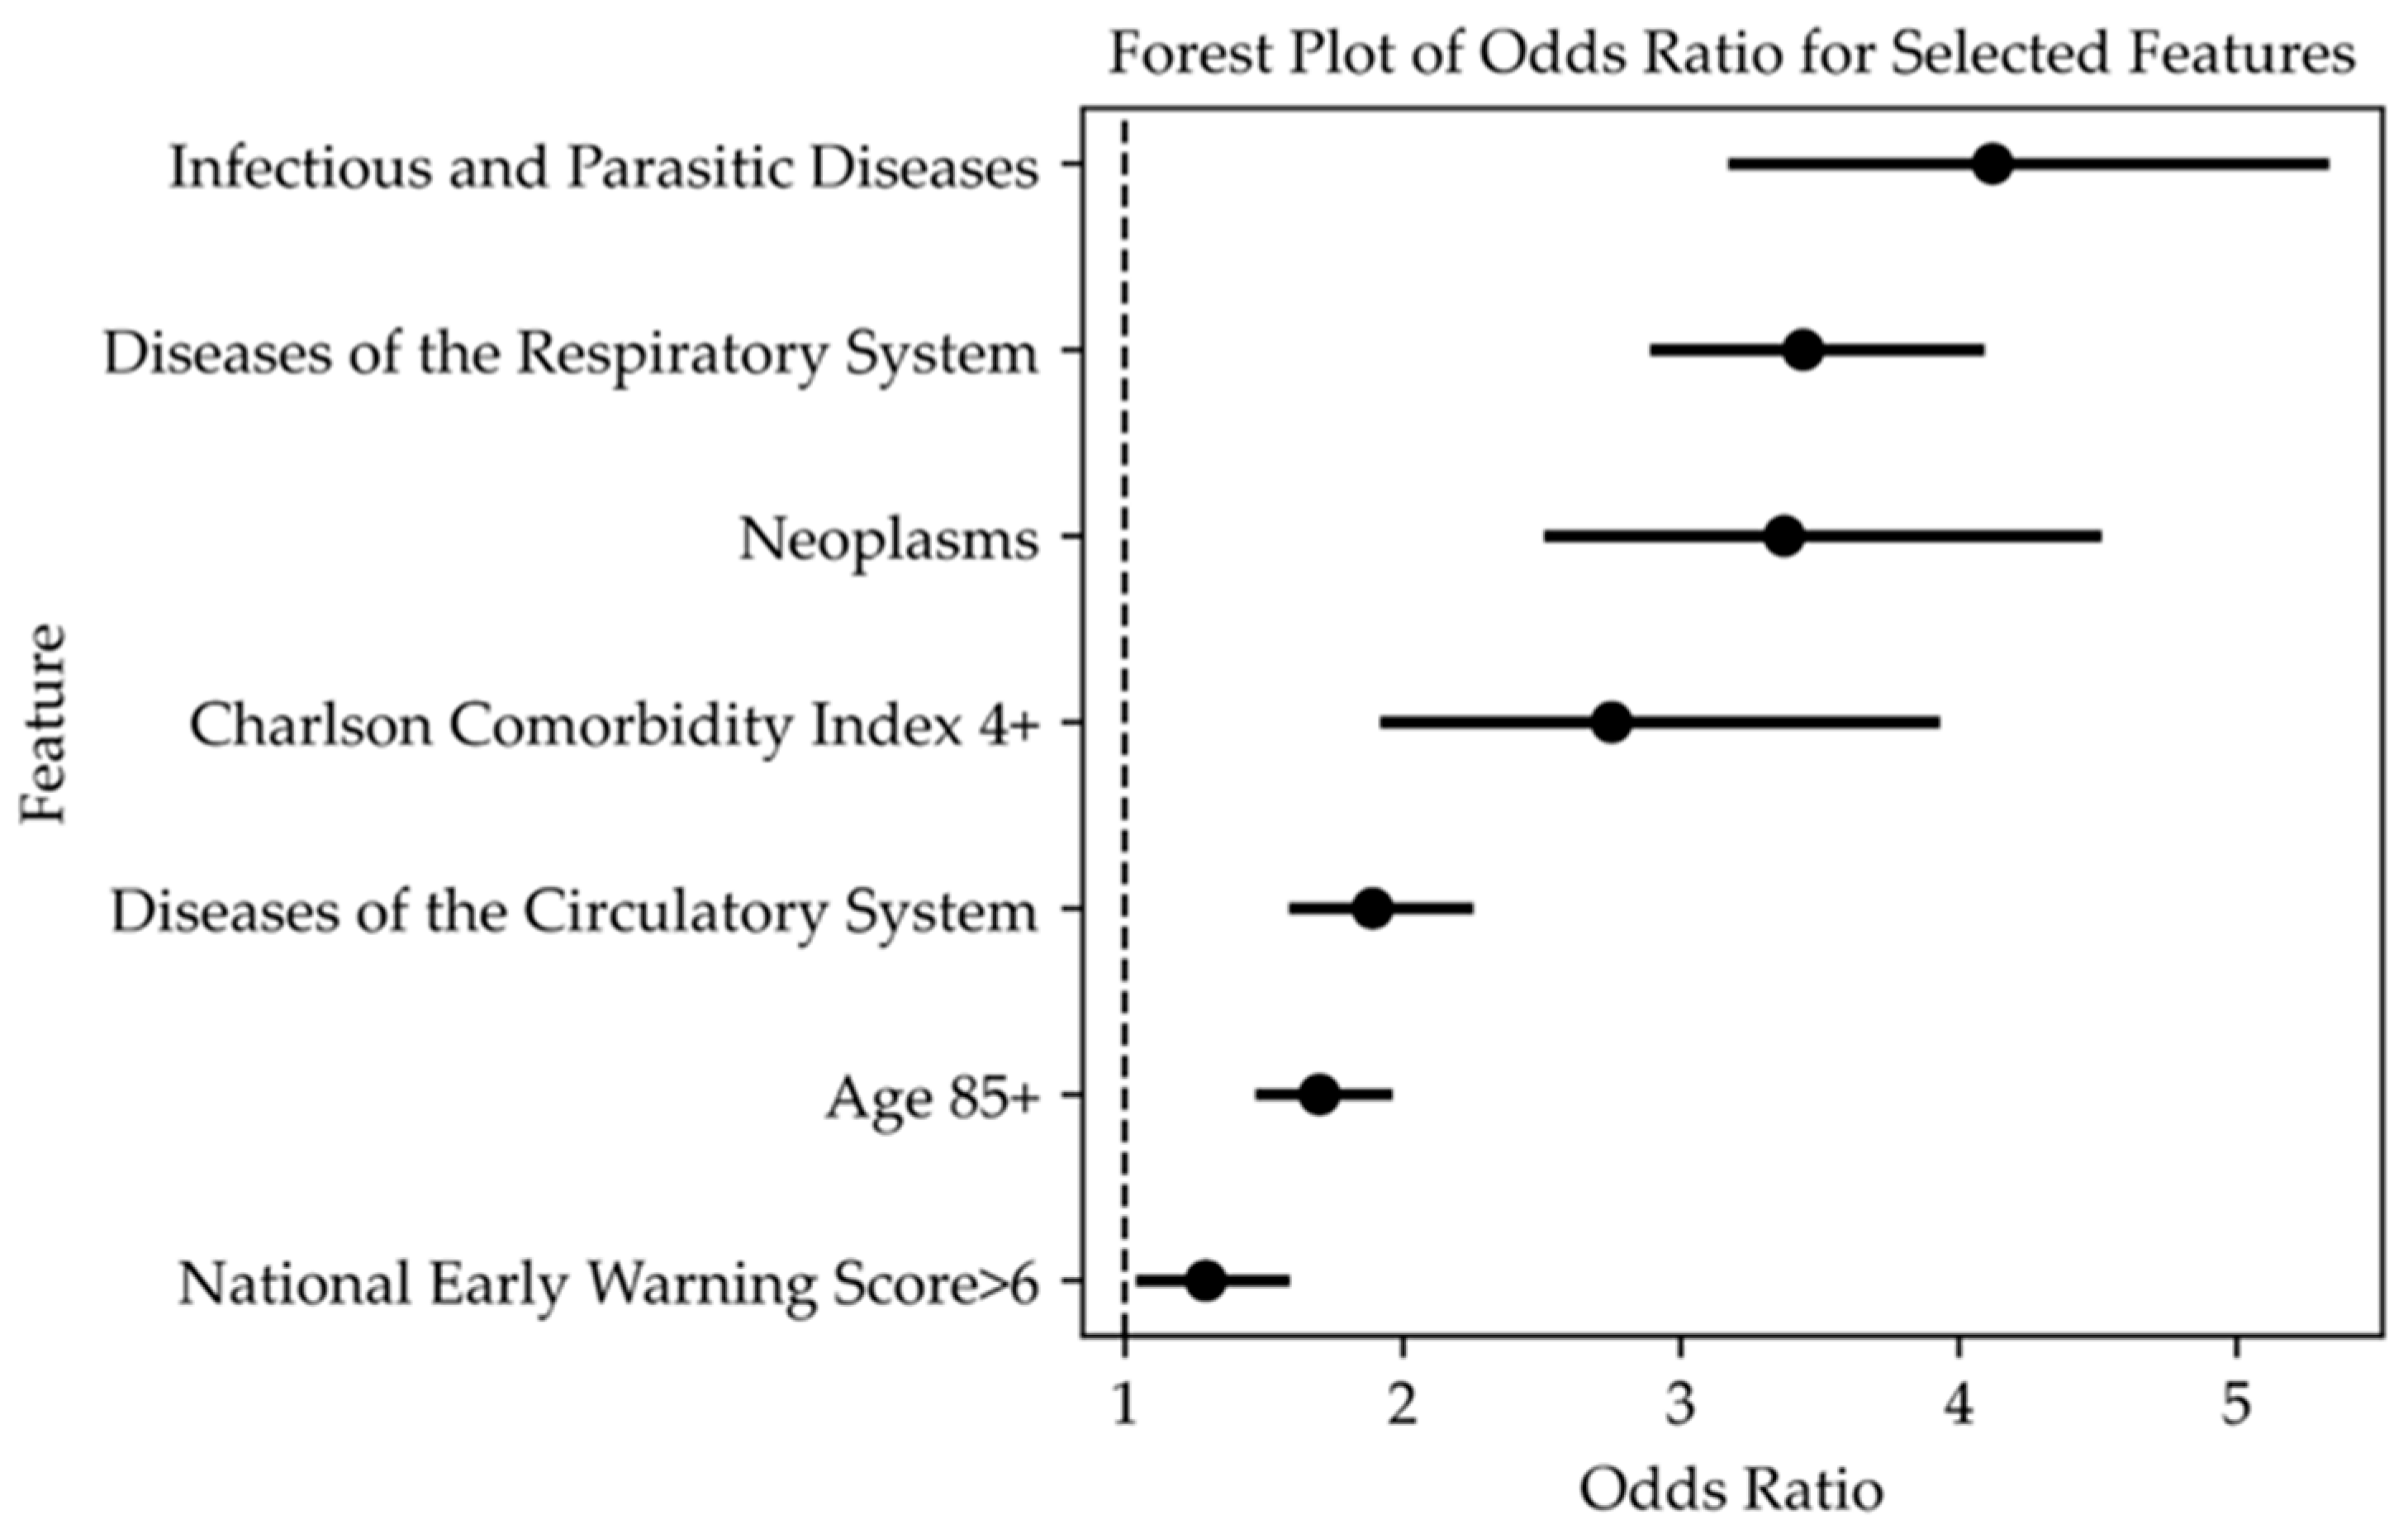
| Independent Variables | OR (95% CI) | p-Value |
|---|---|---|
| Infectious and Parasitic Diseases (001–139) | 3.51 (2.69 to 4.57) | <0.001 |
| Diseases of the Respiratory System (460–519) | 2.81 (2.35 to 3.36) | <0.001 |
| Diagnosis Codes of Neoplasms (140–239) | 2.66 (1.98 to 3.57) | <0.001 |
| CCI ≥ 5 | 2.62 (1.84 to 3.71) | <0.001 |
| Age > 85 years | 1.72 (1.51 to 1.96) | <0.001 |
| Diseases of the Circulatory System (390–459) | 1.54 (1.29 to 1.84) | <0.001 |
| NEWS > 6 | 1.27 (1.05 to 1.55) | <0.001 |
Disclaimer/Publisher’s Note: The statements, opinions and data contained in all publications are solely those of the individual author(s) and contributor(s) and not of MDPI and/or the editor(s). MDPI and/or the editor(s) disclaim responsibility for any injury to people or property resulting from any ideas, methods, instructions or products referred to in the content. |
© 2025 by the authors. Licensee MDPI, Basel, Switzerland. This article is an open access article distributed under the terms and conditions of the Creative Commons Attribution (CC BY) license (https://creativecommons.org/licenses/by/4.0/).
Share and Cite
Fabbri, A.; Tascioglu, A.B.; Bertini, F.; Montesi, D. Overnight Stay in the Emergency Department and In-Hospital Mortality Among Elderly Patients: A 6-Year Follow-Up Italian Study. J. Clin. Med. 2025, 14, 2879. https://doi.org/10.3390/jcm14092879
Fabbri A, Tascioglu AB, Bertini F, Montesi D. Overnight Stay in the Emergency Department and In-Hospital Mortality Among Elderly Patients: A 6-Year Follow-Up Italian Study. Journal of Clinical Medicine. 2025; 14(9):2879. https://doi.org/10.3390/jcm14092879
Chicago/Turabian StyleFabbri, Andrea, Ayca Begum Tascioglu, Flavio Bertini, and Danilo Montesi. 2025. "Overnight Stay in the Emergency Department and In-Hospital Mortality Among Elderly Patients: A 6-Year Follow-Up Italian Study" Journal of Clinical Medicine 14, no. 9: 2879. https://doi.org/10.3390/jcm14092879
APA StyleFabbri, A., Tascioglu, A. B., Bertini, F., & Montesi, D. (2025). Overnight Stay in the Emergency Department and In-Hospital Mortality Among Elderly Patients: A 6-Year Follow-Up Italian Study. Journal of Clinical Medicine, 14(9), 2879. https://doi.org/10.3390/jcm14092879