1. Introduction
Mechanical ventilation is one of the most common practices in emergency and critical care settings. The primary objective is to achieve and maintain sufficient oxygen supply for organs and an adequate clearance of carbon dioxide (CO
2) from the body [
1]. Considering CO
2, both hypocapnia and hypercapnia should be avoided [
2]. Frequent control of the arterial partial pressure of carbon dioxide (PaCO
2) is needed especially for patients with brain injury because carbon dioxide dilates the cerebral blood vessels and may, therefore, increase intracranial pressure [
3]. Hypocapnia, on the other hand, causes cerebral vasoconstriction and may lead to regional cerebral ischemia, and has been shown to worsen outcomes in patients with traumatic brain injury [
4,
5]. Nonetheless, unintentional hypocapnia commonly occurs in clinical practice [
6].
Arterial blood gas (ABG) analysis is the reference method for monitoring adequate ventilation in mechanically ventilated patients [
4]. Consequently, ABG analysis is the most frequent laboratory test in the intensive care unit (ICU) [
7]. The average number of ABG samples varies; in a study from our department, eight samples were taken during the first 24 h in patients treated following cardiac arrest [
8]. ABG analysis is also difficult or impossible in some situations, such as in the prehospital setting and during patient transportation [
9].
A noninvasive method for estimating arterial CO2 would have obvious implications for clinical practice. A commonly used strategy, under stable conditions, is to calculate the gap between end-tidal CO2 (ETCO2) and PaCO2 under the assumption that the gap remains constant, and use the continuous ETCO2 value for arterial CO2 estimation over time. However, because the gap may change, this method is likely to become inaccurate with time. In this experimental animal study, we tested a novel formula for calculating arterial carbon dioxide partial pressure. The formula utilizes noninvasive patient gas parameters readily available in ventilated patients and could provide an alternative way to determine PaCO2 value without ABG analysis. We hypothesized that this formula would outperform traditional end-tidal CO2 (ETCO2)-based PaCO2 prediction, also in situations involving concomitant changes in ventilation and perfusion.
2. Materials and Methods
The current study consists of an analysis of data collected during a series of animal experiments undertaken at the Research and Development Unit of the Helsinki University Hospital, Helsinki, Finland between September 2015 and September 2016. The animal experiments were a part of a developmental project where a novel adaptive ventilation control system was applied on traditional pressure- (PCV) and volume-controlled (VCV) mechanical ventilation and on pressure support (CPAP-PSV) of spontaneously triggered breathing. The developmental project was conducted for internal purposes only, and it will not be published in a scientific journal. The study protocol was approved by the National Animal Experiment Board (ESAVI/1801/04.10.07/2015; Hämeenlinna, Finland) and by the Hospital Board of Helsinki University Hospital (17 June 2015).
2.1. Study Subjects
Nineteen Landrace pigs of both genders were used for the experiments. The average weight of the pigs was 28.7 ± 10.1 kg (range 15.5–47.0 kg). All animals were fasted overnight but had free access to water. Twenty minutes prior to testing, the animals were premedicated with intramuscular medetomidine (80 μg/kg) and ketamine (10 mg/kg). An ear vein was cannulated, and anesthesia was induced using bolus doses of propofol (4–5 mg/kg). After tracheal intubation, the pigs were mechanically ventilated using either volume control ventilation (VCV), pressure control ventilation (PCV), or continuous positive airway pressure combined with pressure support ventilation (CPAP + PSV) mode. A five-lead electrocardiogram and peripheral capillary oxygen saturation through a pulse oximeter were recorded continuously. Respiratory gases (fraction inspired carbon dioxide [FiCO
2], ETCO
2, fraction inspired oxygen [FIO
2] and end tidal oxygen [ETO
2]) were measured with an S/5 Anaesthesia Monitor (GE Healthcare, Helsinki, Finland) [
10]. Blood gases were measured using an epoc
® Blood Analysis System (Alere, Waltham, MA, USA).
Anesthesia was maintained with sevoflurane, and analgesia was provided by boluses of fentanyl. Depth of anesthesia was monitored using EntropyTM in addition to visual observation. The femoral artery was cannulated for blood pressure monitoring and arterial blood sampling, and blood pressure was measured invasively. A central venous catheter was inserted in some cases for monitoring of central venous pressure, infusion of intravenous fluids and medication, and for creating an air embolism as described below. After completing the test, the animals were euthanized with a bolus of potassium chloride. Baseline characteristics, physiological parameters, and data on mechanical ventilation are shown in
Supplementary Tables S1 and S2.
2.2. Experimental Procedures
The first set of ABG measurements was taken after induction of anesthesia under stable hemodynamical conditions in normoventilated animals. In two animals, the testing included different depths of anesthesia and awakening with spontaneous breathing. In one animal, the procedures included mildly elevated abdominal pressure and awakening. In 10 animals (pigs 9–19), the only intervention undertaken was elevation of intra-abdominal pressure by inflating carbon dioxide into the abdominal cavity to a pressure of 15 mmHg. In eight animals (pigs 1–8), various procedures were undertaken in an attempt to manipulate the arterial content of carbon dioxide.
These included:
Inducing metabolic acidosis with an infusion of lactate (30–32 mmol) followed by infusion of 1 mL/kg sodium bicarbonate to increase the CO2 content;
Experimental air embolism with the injection of 60 mL of air into the central vein;
Lung injury with the injection of 0.9% sodium chloride endobronchially;
Endobronchial ventilation with blocking of the left bronchus with the inflated balloon of a Swan–Ganz catheter balloon acting as a bronchial blocker;
Trendelenburg position.
Considering further ABG samples, a 15 min stabilization period was allowed after each intervention in order to reach hemodynamic stability before sampling. The only exception was in a case where an air embolus was injected: in a situation of rapidly deteriorating hemodynamics, stabilization was not possible and the sample was taken without a stabilization period. The outline of the experimental protocol is shown in the
Supplemental Figure S1a.
2.3. Estimation of Arterial CO2 Partial Pressure
Synchronously with the measurement of ABG we obtained data on respiratory gases, i.e., FICO2, ETCO2, FIO2, and ETO2, and used these in a formula for the estimation of PaCO2.
The novel formula (Formula 1) used for prediction of PaCO
2 is defined as
The relationship factor k is defined by fitting unpublished datapoints for the minimal difference between the blood gas measured PaCO
2 and the Formula 1 calculated value. PETCO
2 and PETO
2 are the respective measured dry gas end-tidal volume % values converted to body temperature and pressure saturated partial pressures. For this purpose, we utilized one datapoint from each of 190 emergency patients breathing room air and of 43 ICU ventilated patients recently treated in our university hospital. This fitting gave the value k = 0.035 for samples when ETO
2 ≤ 60 kPa and k = 0.01 when ETO
2 > 60 kPa. PaCO
2 and PaO
2 are the arterial CO
2 and O
2 partial pressures, respectively, and PETCO
2 and PETO
2 are the end-tidal CO
2 and O
2 pressures. The estimation of PaO
2 was based on values from the oxygen dissociation curve assuming a normal pH level and is presented in
Supplementary Materials Table S3 [
11]. Despite differences in the oxygen dissociation curve between humans and pigs, we did not use a porcine-specific method for measuring hemoglobin saturation, possibly overestimating the PaO
2 level [
12].
In addition to Formula 1, we used another method to estimate PaCO2. First, the difference between measured PaCO2 and ETCO2 was calculated from the first available ABG and the corresponding capnography value. This difference was added to the subsequent ETCO2 values at the times when subsequent ABG samples were taken (Formula 2: PaCO2 = ETCO2 + (PaCO2 − ETCO2)). We compared this method to our novel formula (Formula 1).
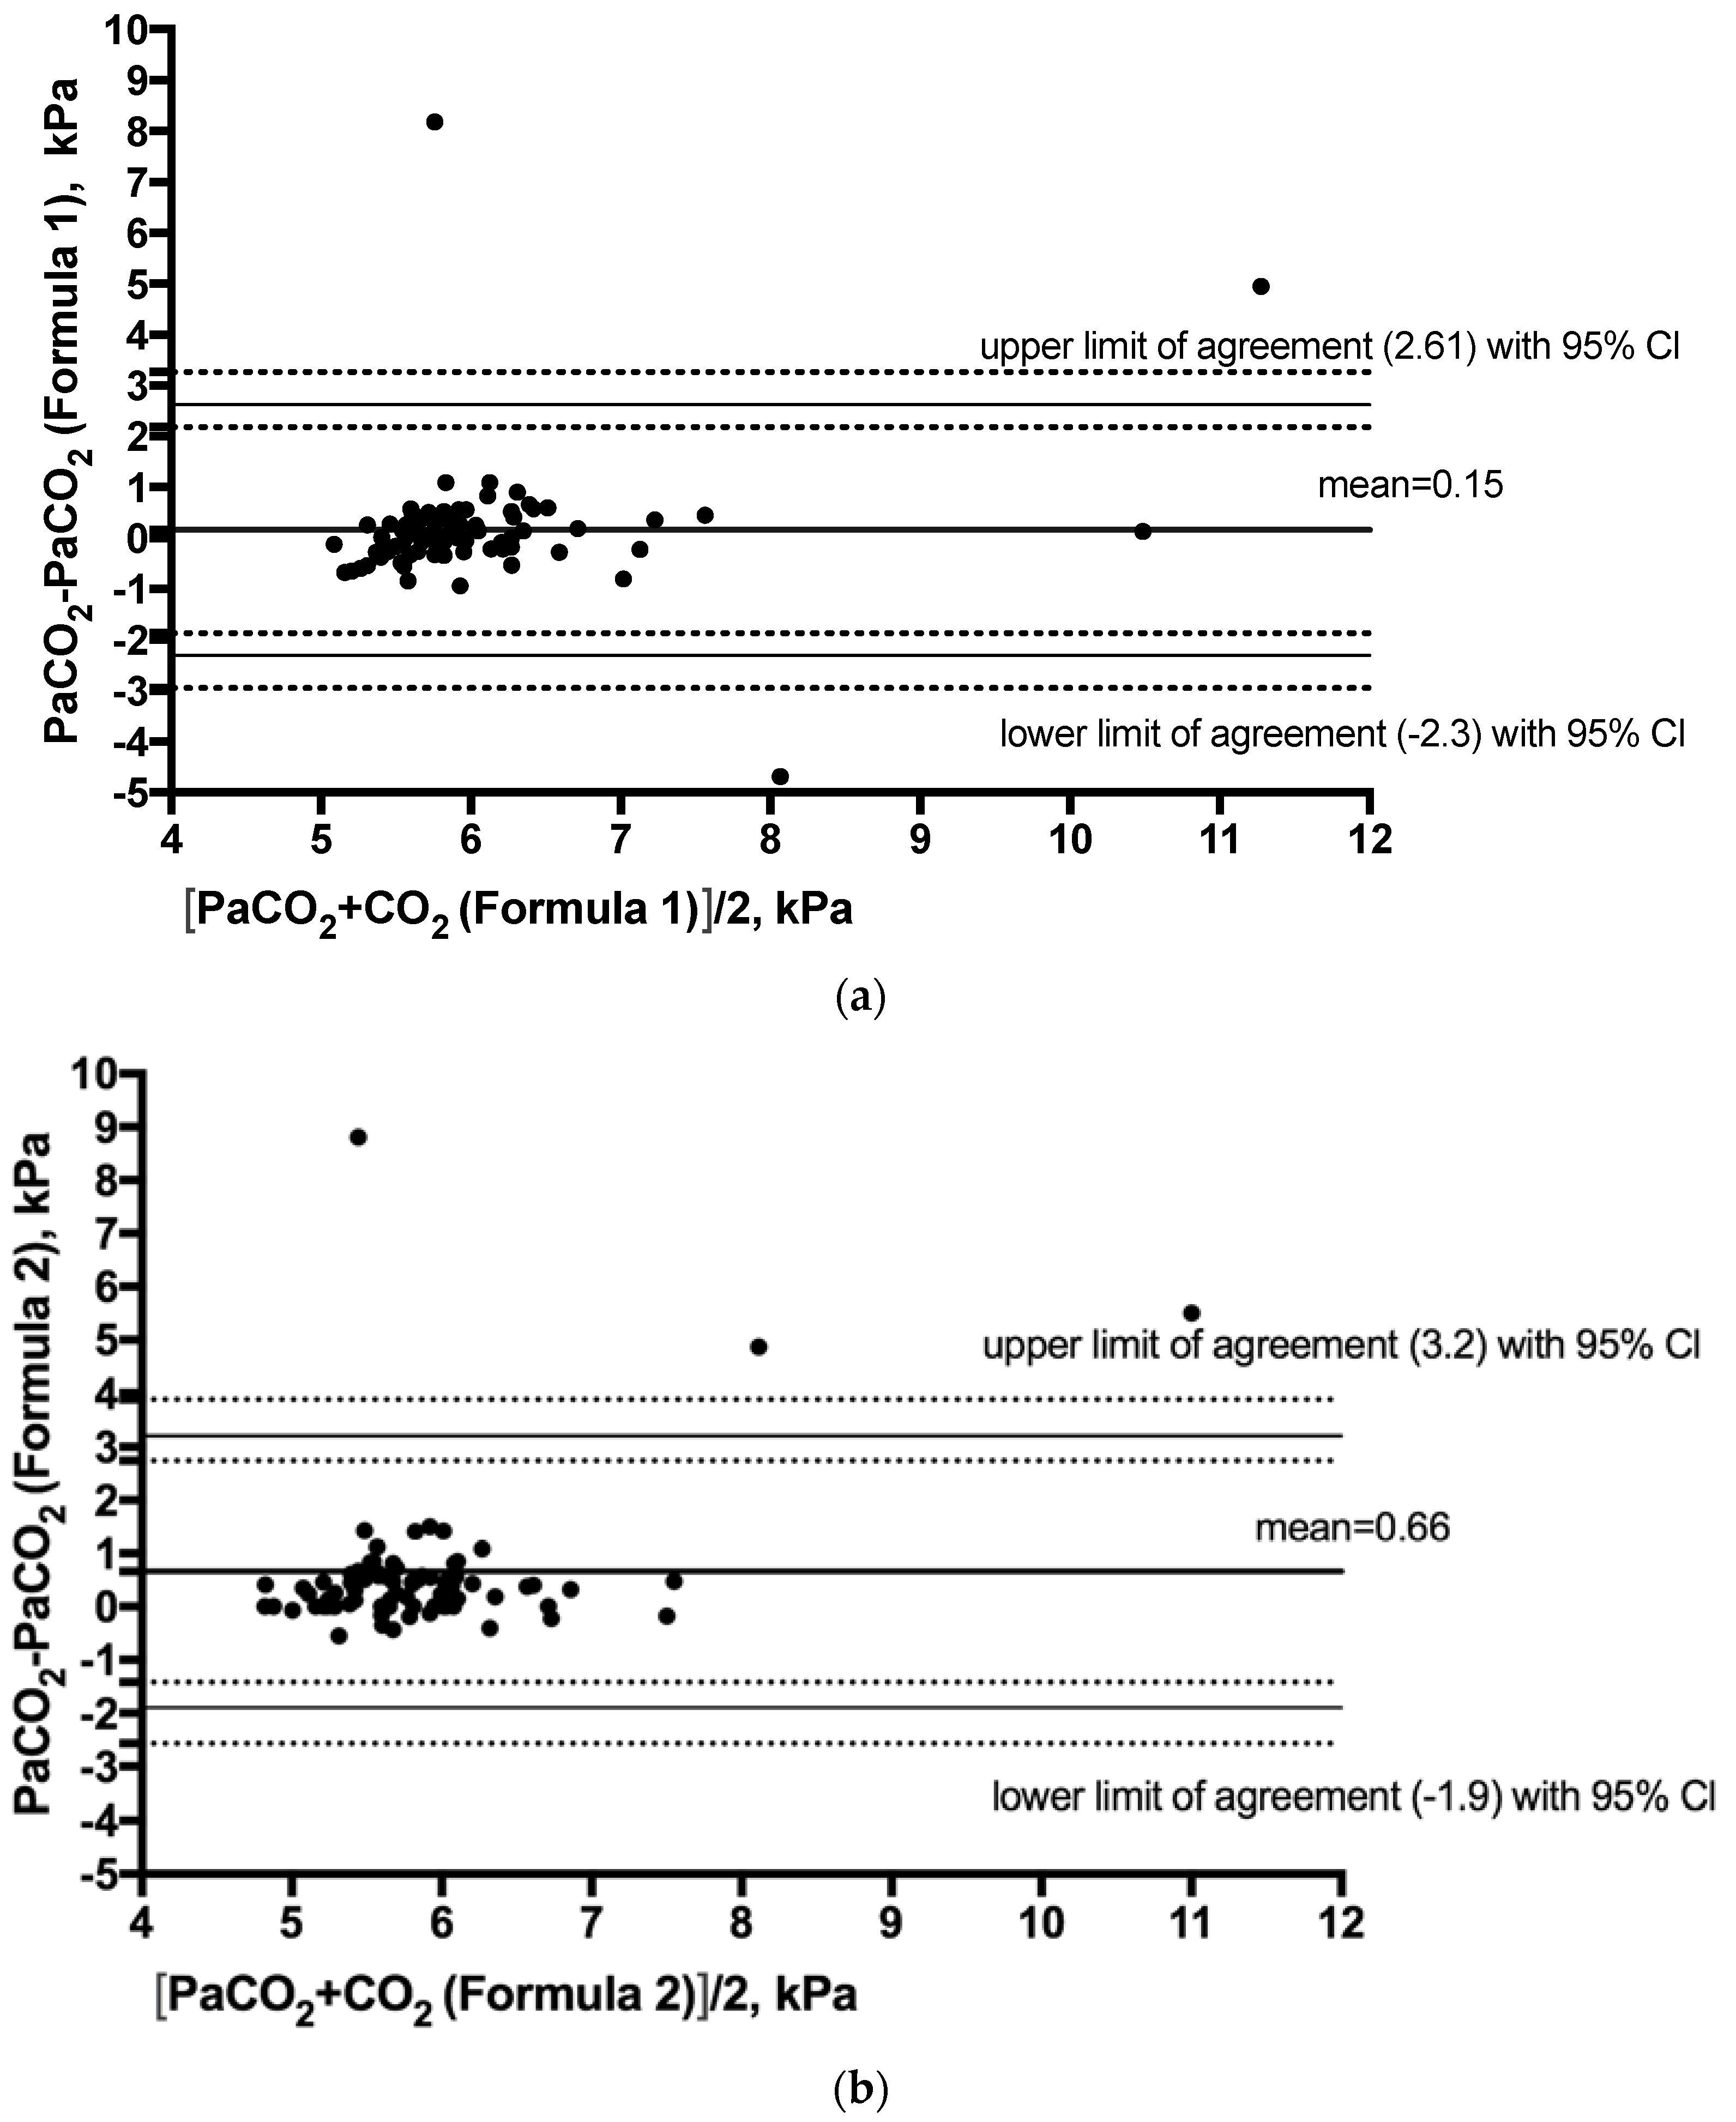
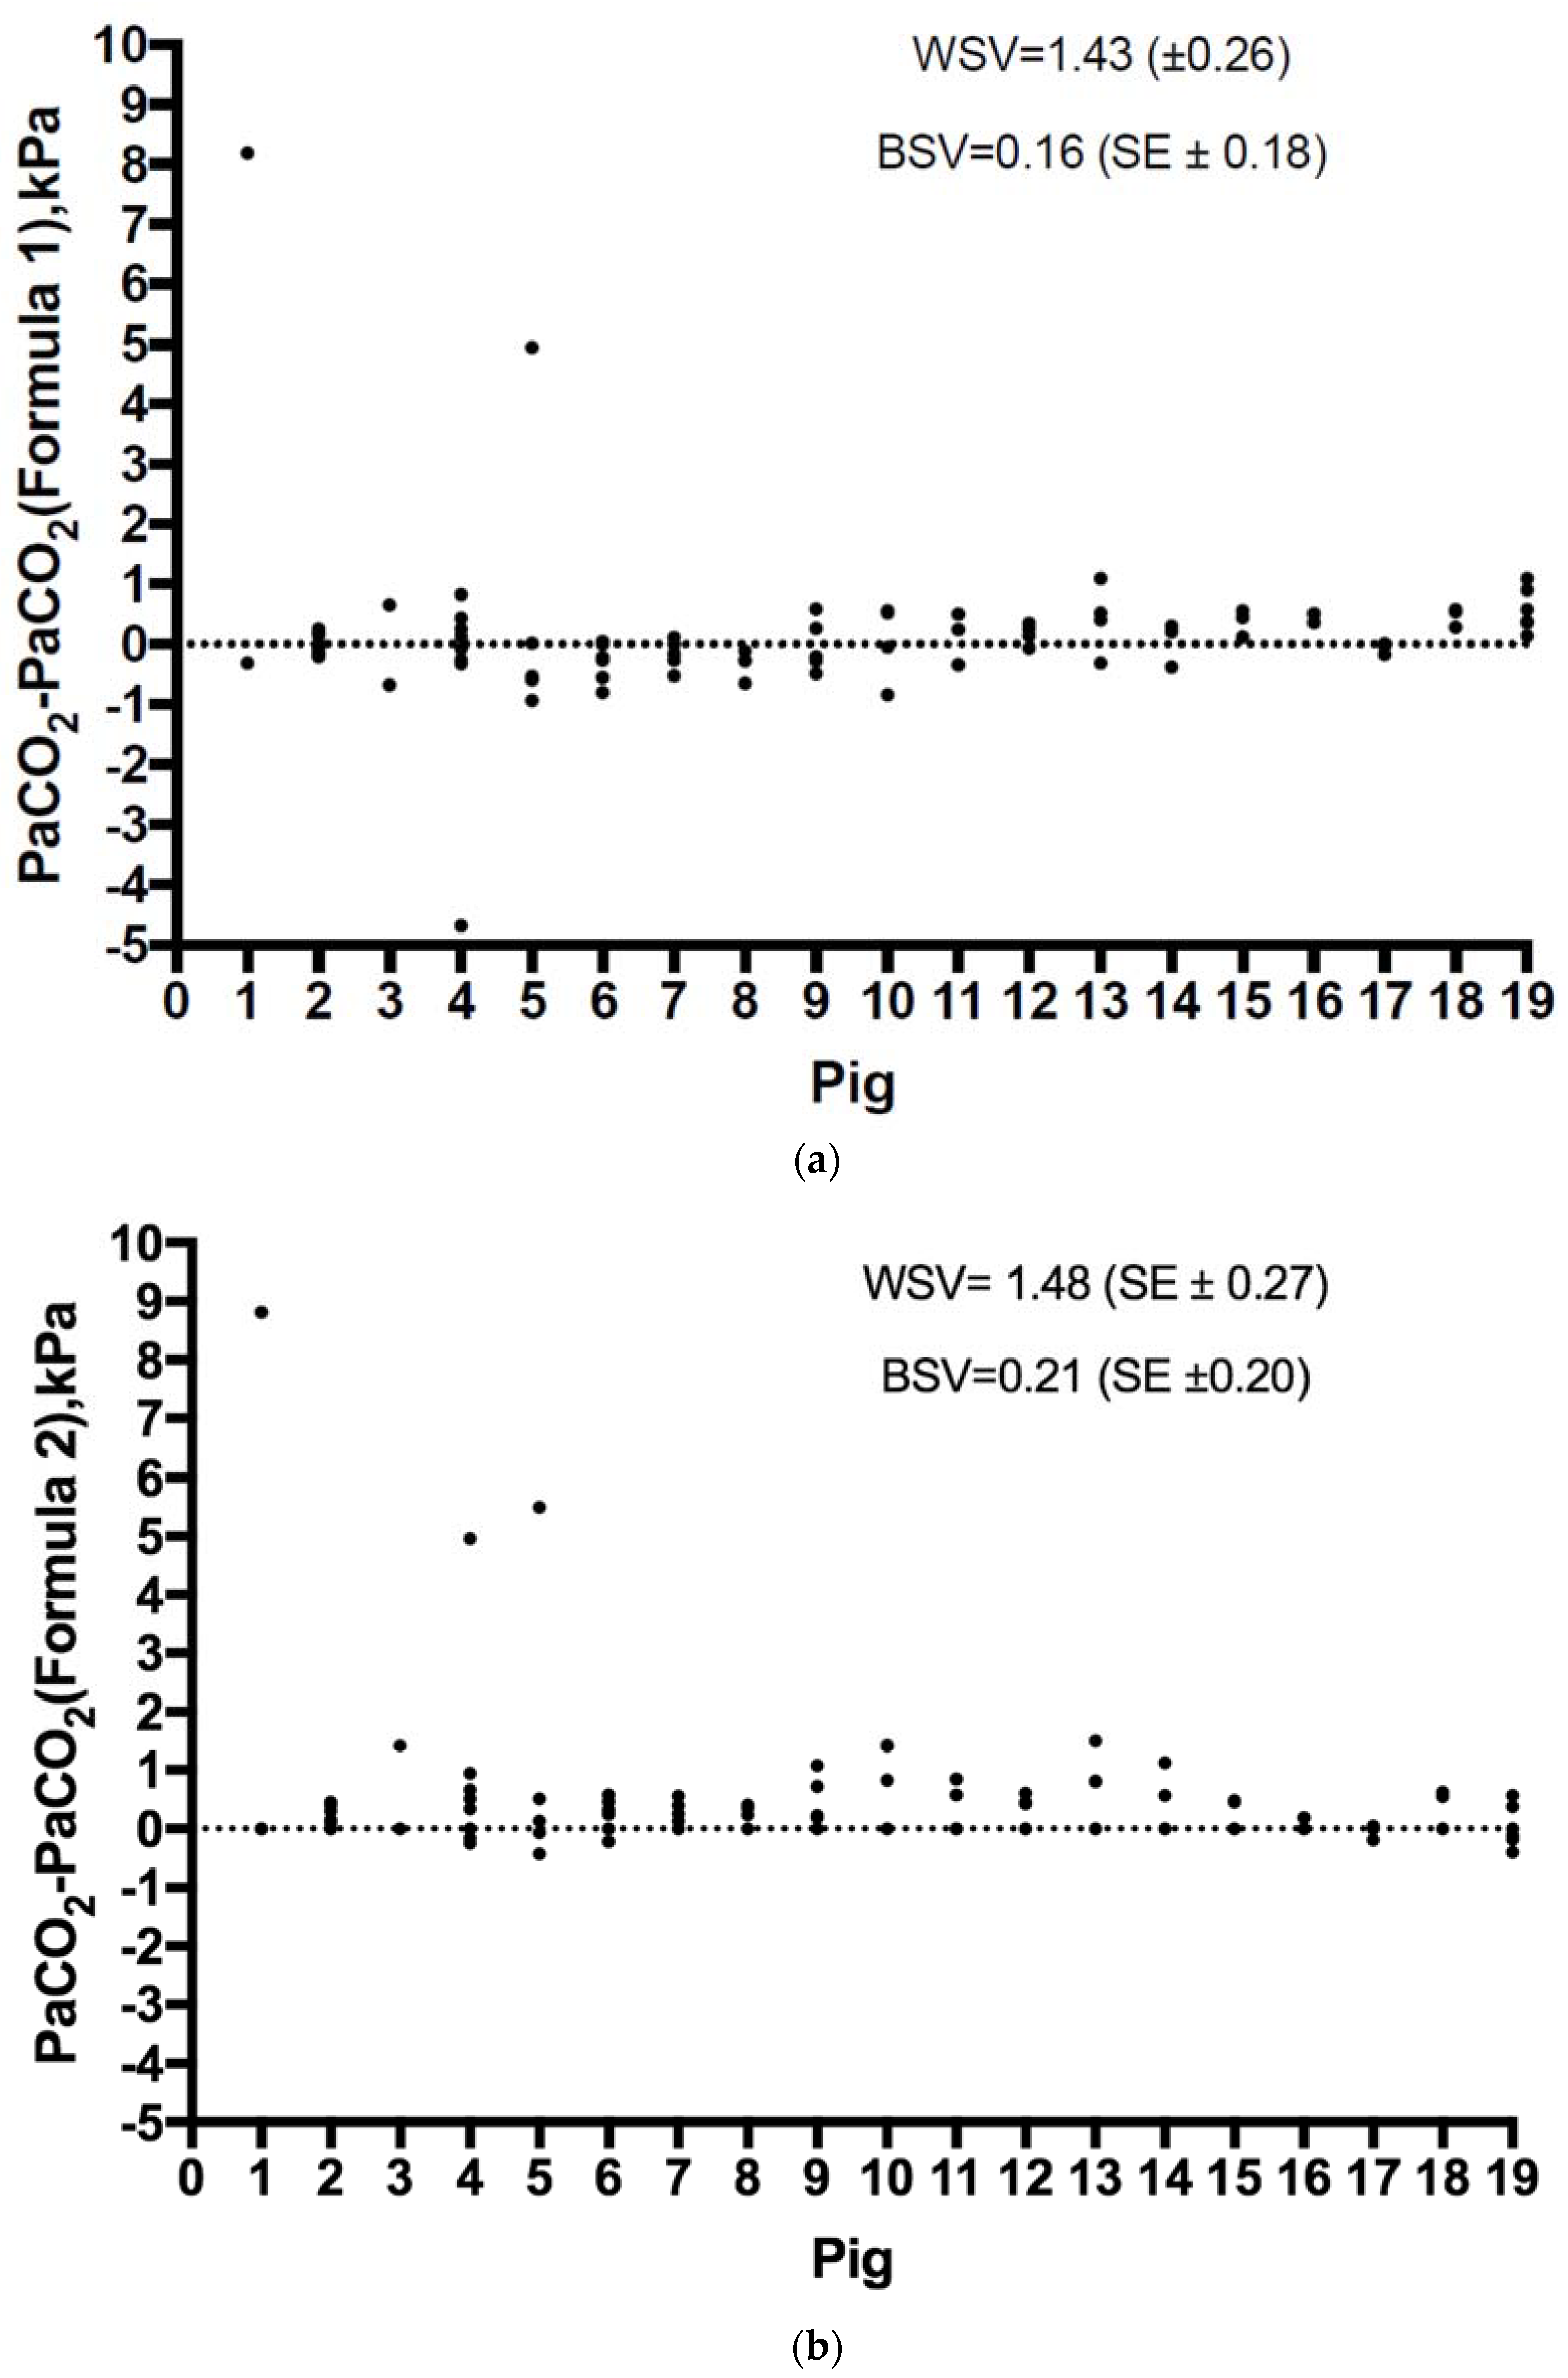
2.4. Statistical Analyses
Categorical variables are expressed as a number and percentage. Normally and non-normally distributed continuous variables are expressed as mean (±SD) and median (range), respectively. To demonstrate the agreement between the estimated and measured values of blood PaCO
2, we created Bland–Altman plots [
13] with 95% confidence intervals. Mean differences between the measured PaCO
2 and both formulae with the limits of agreement and their respective 95% confidence intervals were calculated. The standard deviations of the differences with their standard errors (SE) were calculated. Within-subject and between-subject variances (WSW and BSV) and intra-class correlations (τ) were calculated for both formulae as well as the repeatability coefficients. The data were not normally distributed (Kolmogorov–Smirnov test,
p value < 0.001). The normality of the distribution of the differences between the measured and estimated values were tested using the Kolmogorov–Smirnov test (
p values 0.218 and 0.138). The two formulae were compared, regarding the difference between the estimated and actual PaCO
2 value over time, with a mixed linear model, with subjects treated as a random effect and method, time, and their interaction as fixed effects. For the Bland–Altman analysis including the bias with ±SE and the limits of agreement with 95% confidence intervals we used the freely available software created by Olofsen et al. [
14].
Other analyses were performed using Statistical Package for Social Sciences version 24 software (SPSS Inc., Chicago, IL, USA), SAS version 9.4 (SAS Institute Inc., Cary, NC, USA), and SPSS for Windows (Version 22.0, IBM, Armonk, NY, USA).
4. Discussion
In this study, we tested the agreement of two noninvasive methods to estimate PaCO2. We found that our novel formula, which uses information from respiratory gas measurements available during mechanical ventilation, appears more accurate in a hemodynamically stable state than the commonly used ETCO2 gap method. After controlled validation in clinical studies, this novel formula may have clinical implications in cases where PaCO2 control is important but where ABG analysis is difficult, such as during patient transport. To the best of our knowledge, no studies on the estimation of PaCO2 using readily available respiratory gas values and oxygen saturation have been published.
In previous studies the acceptable range of agreement has been set at 1 kPa between different methods of estimating PaCO
2 [
15]. Importantly, the clinically significant difference may vary depending on the situation; e.g., for neurosurgical patients with critically elevated intracerebral pressure, changes of more than 0.5 kPa in PaCO
2 values may be extremely significant. One key point of the novel formula is the definition of the factor k. It has been developed from data in patients who were breathing room air, so it is likely that additional data from subjects receiving supplemental oxygen may refine this value further, especially in relationship to increased oxygen pressures.
Previous studies regarding a correlation between end-tidal carbon dioxide (ETCO
2) and PaCO
2 have shown conflicting results. On one hand, Razi and colleagues found a strong correlation between ETCO
2 and PaCO
2 in 87 critically ill mechanically ventilated patients [
16]. On the other hand, Kerr and colleagues, in a study on head trauma patients, concluded that the clinical validity of estimation of PaCO
2 with ETCO
2 was not sufficient in patients with respiratory distress or during spontaneous breathing [
17]. According to our results, when using a method assuming a stable gap between ETCO
2 and PaCO
2, the value of PaCO
2 is underestimated, which might lead to insufficient ventilation. Probably, the gradient between ETCO
2 and PaCO
2 does not remain constant when a patient’s clinical condition changes; this decreases the accuracy. Belenkiy and colleagues used volumetric capnography (Vcap) in a porcine model of chest trauma and showed that the difference between the estimated and measured PaCO
2 values changed only slightly [
18].
Transcutaneous CO
2 (tc-CO
2) monitoring has been used especially in neonates and infants [
19]. The accuracy of tc-CO
2 has varied in studies and, for example, during low flow shock, tc-CO
2 is not a consistently accurate reflection of PaCO
2 [
20] and is dependent on microvascular circulation [
21]. Estimations based on end-tidal carbon dioxide may be sufficient in selected patients, assuming the clinical condition is stable, which is not the case in many critically ill patients in the ICU or prehospital setting.
In this study, the interventions undertaken to influence CO
2 in a few cases caused cardiovascular and respiratory collapse. As expected and due to the rapid decrease in cardiac output (CO) and lung perfusion, this resulted in much poorer accuracy of both formulae estimating PaCO
2. Ornato et al. showed that the relationship between CO and ETCO
2 was more logarithmic than linear, resulting in big changes in ETCO
2 when changes in CO were rather small [
22]. During low or high CO, ETCO
2 seems to be a poor indicator of PaCO
2. In prehospital settings, ETCO
2 cannot estimate PaCO
2, since the gradient between PaCO
2 and ETCO
2 varies greatly. The difference is especially notable in patients with hypocapnia [
23]. Similar results have been shown with other methods using ETCO
2 for the estimation of PaCO
2. Mechanically ventilated patients with severe trauma or burns have poorer correlation between ETCO
2 and PaCO
2 in prehospital settings, with acidosis and poor outcome as consequences [
24]. When FIO
2 approaches 100%, the reliability of the novel formula is impaired. In one case during our study, a tube occlusion problem occurred, and the difference between PaCO
2 and calculated PaCO
2 was near 5 kPa. In addition to the obvious unreliability of ETCO
2 associated with tube occlusion, the high difference was partly due to high FIO
2, as pulse oximetry is a poor indicator of PaO
2 [
25]. Indeed, our results are preliminary and cannot be generalized at this stage to other populations. In an ongoing further study, our aim is to test the accuracy of the presented formula with a large group of mechanically ventilated ICU patients with and without respiratory failure.
If this novel formula is validated in clinical studies, a built-in algorithm in patient monitoring could offer continuous information about a patient’s estimated PaCO2 level. This could be valuable in settings without the possibility of ABG analysis. Indeed, our results show that the novel algorithm was more accurate than estimating carbon dioxide with end-tidal CO2, which is commonly used in the prehospital setting. Eventually, ventilators that keep patients’ CO2 levels stable by modifying tidal volume and pressure may be developed; using an equation embedded in the ventilator for estimating arterial CO2 tension is one possible practical application.
Our study has some important limitations. First, the number of individual animals subjected to different experiments was small and, thus, the respiratory and hemodynamic conditions were not standardized. Second, ABG analyses were not taken at specified time points, and the number of ABG analyses varied. Third, as mentioned previously, remarkable changes in cardiac output result in a poor capacity to estimate PaCO
2 with the traditional method. In this study we did not measure cardiac output; hence, it is unclear to what extent it applies to the new algorithm. Fourth, we did not use hyperventilation or very high FIO
2 in the experiments. At this point, it is uncertain how the new algorithm functions for patients with hypocapnia or in situations where a high FIO
2 is used. In the setup of the original study, the goal was normoventilation while manipulating PaCO
2 in various interventions. In addition, the determination of factor k used in the algorithm may change with more datapoints. In situations where ETO
2 is remarkably high, for example, massive shunting in lungs, the algorithm does not function. Finally, despite differences in the oxygen dissociation curve between humans and pigs, we did not use a porcine-specific method for measuring hemoglobin saturation, possibly overestimating the PaO
2 level [
25]. Finally, the samples were obtained in animals ventilated with a novel adaptive ventilation control system. However, this novel ventilation system uses common ventilation modes that are not likely to influence the end-tidal concentrations of either oxygen or carbon dioxide any differently than other currently used mechanical ventilators. Nonetheless, the inherent limitations of the study design are not likely to overestimate the accuracy of the novel algorithm, but the opposite. Some of the limitations, such as lack of standardization of the experiments, render the study sample more similar to a clinical real-life scenario than a tightly controlled experimental setting would have done.

 ,
, 


