Squalene Epoxidase Correlates E-Cadherin Expression and Overall Survival in Colorectal Cancer Patients: The Impact on Prognosis and Correlation to Clinicopathologic Features


Abstract
:1. Introduction
2. Materials and Methods
2.1. Case Selection
2.2. Immunohistochemistry (IHC)
2.3. Assessment of Immunohistochemical Staining
2.4. Statistical Analysis of Prognostic Parameters
2.5. Ethical Permission
3. Results
3.1. Association of SE and E-Cadherin Expression Status with Clinicopathologic Characteristics
3.2. High SE Expression at the Invasive Front Correlates with RFS and OS
4. Discussion
5. Conclusions
Author Contributions
Conflicts of Interest
References
- Bray, F.; Ferlay, J.; Soerjomataram, I.; Siegel, R.L.; Torre, L.A.; Jemal, A. Global cancer statistics 2018: GLOBOCAN estimates of incidence and mortality worldwide for 36 cancers in 185 countries. CA Cancer J. Clin. 2018, 68, 394–424. [Google Scholar] [CrossRef] [PubMed]
- Torre, L.A.; Siegel, R.L.; Ward, E.M.; Jemal, A. Global Cancer Incidence and Mortality Rates and Trends—An Update. Cancer Epidemiol. Biomark. Prev. 2016, 25, 16–27. [Google Scholar] [CrossRef] [PubMed]
- Tariq, K.; Ghias, K. Colorectal cancer carcinogenesis: A review of mechanisms. Cancer Biol. Med. 2016, 13, 120–135. [Google Scholar] [CrossRef]
- Nagai, M.; Sakakibara, J.; Wakui, K.; Fukushima, Y.; Igarashi, S.; Tsuji, S.; Arakawa, M.; Ono, T. Localization of the squalene epoxidase gene (SQLE) to human chromosome region 8q24.1. Genomics 1997, 44, 141–143. [Google Scholar] [CrossRef]
- Nagumo, A.; Kamei, T.; Sakakibara, J.; Ono, T. Purification and characterization of recombinant squalene epoxidase. J. Lipid Res. 1995, 36, 1489–1497. [Google Scholar]
- Sotiriou, C.; Neo, S.Y.; McShane, L.M.; Korn, E.L.; Long, P.M.; Jazaeri, A.; Martiat, P.; Fox, S.B.; Harris, A.L.; Liu, E.T. Breast cancer classification and prognosis based on gene expression profiles from a population-based study. Proc. Natl. Acad. Sci. USA 2003, 100, 10393–10398. [Google Scholar] [CrossRef]
- Liu, Y.; Sun, W.; Zhang, K.; Zheng, H.; Ma, Y.; Lin, D.; Zhang, X.; Feng, L.; Lei, W.; Zhang, Z.; et al. Identification of genes differentially expressed in human primary lung squamous cell carcinoma. Lung Cancer 2007, 56, 307–317. [Google Scholar] [CrossRef] [PubMed]
- Zhang, H.Y.; Li, H.M.; Yu, Z.; Yu, X.Y.; Guo, K. Expression and significance of squalene epoxidase in squamous lung cancerous tissues and pericarcinoma tissues. Thorac. Cancer 2014, 5, 275–280. [Google Scholar] [CrossRef]
- Helms, M.W.; Kemming, D.; Pospisil, H.; Vogt, U.; Buerger, H.; Korsching, E.; Liedtke, C.; Schlotter, C.M.; Wang, A.; Chan, S.Y.; et al. Squalene epoxidase, located on chromosome 8q24.1, is upregulated in 8q+ breast cancer and indicates poor clinical outcome in stage I and II disease. Br. J. Cancer 2008, 99, 774–780. [Google Scholar] [CrossRef]
- Shkurnikov, M.Y.; Galatenko, V.V.; Lebedev, A.E.; Podol’skii, V.E.; Tonevitskii, E.A.; Mal’tseva, D.V. On statistical relationship between ADRA2A expression and the risk of breast cancer relapse. Bull. Exp. Biol. Med. 2014, 157, 454–458. [Google Scholar] [CrossRef] [PubMed]
- Zhao, S.G.; Evans, J.R.; Kothari, V.; Sun, G.; Larm, A.; Mondine, V.; Schaeffer, E.M.; Ross, A.E.; Klein, E.A.; Den, R.B.; et al. The Landscape of Prognostic Outlier Genes in High-Risk Prostate Cancer. Clin. Cancer Res. 2016, 22, 1777–1786. [Google Scholar] [CrossRef] [PubMed]
- Zhao, H.; Logothetis, C.J.; Gorlov, I.P. Usefulness of the top-scoring pairs of genes for prediction of prostate cancer progression. Prostate Cancer Prostatic Dis. 2010, 13, 252–259. [Google Scholar] [CrossRef]
- Sui, Z.; Zhou, J.; Cheng, Z.; Lu, P. Squalene epoxidase (SQLE) promotes the growth and migration of the hepatocellular carcinoma cells. Tumour Biol. 2015, 36, 6173–6179. [Google Scholar] [CrossRef]
- Kim, S.; Kon, M.; DeLisi, C. Pathway-based classification of cancer subtypes. Biol. Direct 2012, 7, 21. [Google Scholar] [CrossRef] [PubMed]
- Brown, D.N.; Caffa, I.; Cirmena, G.; Piras, D.; Garuti, A.; Gallo, M.; Alberti, S.; Nencioni, A.; Ballestrero, A.; Zoppoli, G. Squalene epoxidase is a bona fide oncogene by amplification with clinical relevance in breast cancer. Sci. Rep. 2016, 6, 19435. [Google Scholar] [CrossRef] [PubMed]
- Jardel, P.; Debiais, C.; Godet, J.; Irani, J.; Fromont, G. Ductal carcinoma of the prostate shows a different immunophenotype from high grade acinar cancer. Histopathology 2013, 63, 57–63. [Google Scholar] [CrossRef] [PubMed]
- Qin, Y.; Zhang, Y.; Tang, Q.; Jin, L.; Chen, Y. SQLE induces epithelial-to-mesenchymal transition by regulating of miR-133b in esophageal squamous cell carcinoma. Acta Biochim. Biophys. Sin. 2017, 49, 138–148. [Google Scholar] [CrossRef] [PubMed]
- Stopsack, K.H.; Gerke, T.A.; Sinnott, J.A.; Penney, K.L.; Tyekucheva, S.; Sesso, H.D.; Andersson, S.O.; Andren, O.; Cerhan, J.R.; Giovannucci, E.L.; et al. Cholesterol Metabolism and Prostate Cancer Lethality. Cancer Res. 2016, 76, 4785–4790. [Google Scholar] [CrossRef]
- Washington, M.K.; Berlin, J.; Branton, P.; Burgart, L.J.; Carter, D.K.; Fitzgibbons, P.L.; Halling, K.; Frankel, W.; Jessup, J.; Kakar, S.; et al. Protocol for the examination of specimens from patients with primary carcinoma of the colon and rectum. Arch. Pathol. Lab. med. 2009, 133, 1539–1551. [Google Scholar] [CrossRef]
- Prall, F. Tumour budding in colorectal carcinoma. Histopathology 2007, 50, 151–162. [Google Scholar] [CrossRef]
- Wang, L.M.; Kevans, D.; Mulcahy, H.; O’Sullivan, J.; Fennelly, D.; Hyland, J.; O’Donoghue, D.; Sheahan, K. Tumor budding is a strong and reproducible prognostic marker in T3N0 colorectal cancer. Am. J. Surg. Pathol. 2009, 33, 134–141. [Google Scholar] [CrossRef] [PubMed]
- Cho, S.J.; Kakar, S. Tumor Budding in Colorectal Carcinoma: Translating a Morphologic Score Into Clinically Meaningful Results. Arch. Pathol. Lab. Med. 2018, 142, 952–957. [Google Scholar] [CrossRef] [PubMed]
- Kim, J.H.; Park, M.Y.; Kim, C.N.; Kim, K.H.; Kang, H.B.; Kim, K.D.; Kim, J.W. Expression of endothelial cell-specific molecule-1 regulated by hypoxia inducible factor-1alpha in human colon carcinoma: Impact of ESM-1 on prognosis and its correlation with clinicopathological features. Oncol. Rep. 2012, 28, 1701–1708. [Google Scholar] [CrossRef]
- Van Berkel, W.J.; Kamerbeek, N.M.; Fraaije, M.W. Flavoprotein monooxygenases, a diverse class of oxidative biocatalysts. J. Biotechnol. 2006, 124, 670–689. [Google Scholar] [CrossRef]
- Joosten, V.; van Berkel, W.J. Flavoenzymes. Curr. Opin. Chem. Biol. 2007, 11, 195–202. [Google Scholar] [CrossRef]
- Haider, S.; McIntyre, A.; van Stiphout, R.G.; Winchester, L.M.; Wigfield, S.; Harris, A.L.; Buffa, F.M. Genomic alterations underlie a pan-cancer metabolic shift associated with tumour hypoxia. Genome Biol. 2016, 17, 140. [Google Scholar] [CrossRef]
- Nagai, M.; Sakakibara, J.; Nakamura, Y.; Gejyo, F.; Ono, T. SREBP-2 and NF-Y are involved in the transcriptional regulation of squalene epoxidase. Biochem. Biophys. Res. Commun. 2002, 295, 74–80. [Google Scholar] [CrossRef]
- Gill, S.; Stevenson, J.; Kristiana, I.; Brown, A.J. Cholesterol-dependent degradation of squalene monooxygenase, a control point in cholesterol synthesis beyond HMG-CoA reductase. Cell Metab. 2011, 13, 260–273. [Google Scholar] [CrossRef] [PubMed]
- Sharpe, L.J.; Brown, A.J. Controlling cholesterol synthesis beyond 3-hydroxy-3-methylglutaryl-CoA reductase (HMGCR). J. Biol. Chem. 2013, 288, 18707–18715. [Google Scholar] [CrossRef] [PubMed]
- Clendening, J.W.; Pandyra, A.; Boutros, P.C.; El Ghamrasni, S.; Khosravi, F.; Trentin, G.A.; Martirosyan, A.; Hakem, A.; Hakem, R.; Jurisica, I.; et al. Dysregulation of the mevalonate pathway promotes transformation. Proc. Natl. Acad. Sci. USA 2010, 107, 15051–15056. [Google Scholar] [CrossRef] [PubMed]
- Ginestier, C.; Monville, F.; Wicinski, J.; Cabaud, O.; Cervera, N.; Josselin, E.; Finetti, P.; Guille, A.; Larderet, G.; Viens, P.; et al. Mevalonate metabolism regulates Basal breast cancer stem cells and is a potential therapeutic target. Stem Cells (Dayton, Ohio) 2012, 30, 1327–1337. [Google Scholar] [CrossRef] [PubMed]
- Azrolan, N.I.; Coleman, P.S. A discoordinate increase in the cellular amount of 3-hydroxy-3-methylglutaryl-CoA reductase results in the loss of rate-limiting control over cholesterogenesis in a tumour cell-free system. Biochem. J. 1989, 258, 421–425. [Google Scholar] [CrossRef] [PubMed]
- Erickson, S.K.; Cooper, A.D.; Barnard, G.F.; Havel, C.M.; Watson, J.A.; Feingold, K.R.; Moser, A.H.; Hughes-Fulford, M.; Siperstein, M.D. Regulation of cholesterol metabolism in a slow-growing hepatoma in vivo. Biochim. Biophys. Acta 1988, 960, 131–138. [Google Scholar] [CrossRef]
- Chen, H.W.; Kandutsch, A.A.; Waymouth, C. Inhibition of cell growth by oxygenated derivatives of cholesterol. Nature 1974, 251, 419–421. [Google Scholar] [CrossRef] [PubMed]
- Bjorkhem, I. Five decades with oxysterols. Biochimie 2013, 95, 448–454. [Google Scholar] [CrossRef]
- Olkkonen, V.M.; Beaslas, O.; Nissila, E. Oxysterols and their cellular effectors. Biomolecules 2012, 2, 76–103. [Google Scholar] [CrossRef]
- Marwarha, G.; Raza, S.; Hammer, K.; Ghribi, O. 27-hydroxycholesterol: A novel player in molecular carcinogenesis of breast and prostate cancer. Chem. Phys. Lipids 2017, 207, 108–126. [Google Scholar] [CrossRef]
- Nelson, E.R. The significance of cholesterol and its metabolite, 27-hydroxycholesterol in breast cancer. Mol. Cell. Endocrinol. 2018, 466, 73–80. [Google Scholar] [CrossRef]
- Zlobec, I.; Lugli, A. Epithelial mesenchymal transition and tumor budding in aggressive colorectal cancer: Tumor budding as oncotarget. Oncotarget 2010, 1, 651–661. [Google Scholar] [CrossRef]
- Slik, K.; Blom, S.; Turkki, R.; Valimaki, K.; Kurki, S.; Mustonen, H.; Haglund, C.; Carpen, O.; Kallioniemi, O.; Korkeila, E.; et al. Combined epithelial marker analysis of tumour budding in stage II colorectal cancer. J. Pathol. Clin. Res. 2019, 5, 63–78. [Google Scholar] [CrossRef]
- Thomson, S.; Buck, E.; Petti, F.; Griffin, G.; Brown, E.; Ramnarine, N.; Iwata, K.K.; Gibson, N.; Haley, J.D. Epithelial to mesenchymal transition is a determinant of sensitivity of non-small-cell lung carcinoma cell lines and xenografts to epidermal growth factor receptor inhibition. Cancer Res. 2005, 65, 9455–9462. [Google Scholar] [CrossRef] [PubMed]


| Characteristics | Total | SE Expression | p | |||
|---|---|---|---|---|---|---|
| Negative/Low | High | |||||
| n = 58 | % | n = 85 | % | |||
| Age (years) | ||||||
| <50 | 26 | 10 | 17.2 | 16 | 18.8 | 0.830 * |
| ≥50 | 117 | 48 | 82.8 | 69 | 81.2 | |
| Gender | ||||||
| Female | 68 | 33 | 48.5 | 35 | 33.3 | 0.088 * |
| Male | 75 | 25 | 51.5 | 50 | 66.7 | |
| Site | ||||||
| Right/Transverse colon | 34 | 16 | 27.6 | 18 | 21.2 | 0.426 * |
| Left colon and rectum | 109 | 42 | 72.4 | 67 | 78.8 | |
| Size | 0.391 * | |||||
| <5 cm in diameter | 60 | 27 | 46.6 | 33 | 38.8 | |
| ≥5 cm in diameter | 83 | 31 | 53.4 | 52 | 61.2 | |
| Grade | 1.000 * | |||||
| Low | 111 | 45 | 77.6 | 66 | 77.6 | |
| High | 32 | 13 | 22.4 | 19 | 22.4 | |
| LV invasion | <0.001 * | |||||
| Not identified | 39 | 26 | 44.8 | 13 | 15.3 | |
| Present | 104 | 32 | 55.2 | 72 | 64.7 | |
| Tumor border | 0.378 * | |||||
| Pushing | 13 | 7 | 12.1 | 6 | 7.1 | |
| Infiltrating | 130 | 51 | 87.9 | 79 | 92.9 | |
| Tumor budding | <0.001 * | |||||
| Low | 36 | 26 | 44.8 | 10 | 11.8 | |
| High | 107 | 32 | 55.2 | 75 | 88.2 | |
| Invasion depth | 0.002 + | |||||
| pT1 | 5 | 4 | 6.9 | 1 | 1.2 | |
| pT2 | 21 | 15 | 25.9 | 6 | 7.1 | |
| pT3 | 105 | 36 | 62.1 | 69 | 81.2 | |
| pT4 | 12 | 3 | 5.2 | 9 | 10.6 | |
| LN metastasis | <0.001 ‡ | |||||
| pN0 | 67 | 37 | 63.8 | 30 | 35.3 | |
| pN1 | 23 | 11 | 19.0 | 12 | 14.1 | |
| pN2 | 53 | 10 | 17.2 | 43 | 50.6 | |
| Distant metastasis | 0.005 + | |||||
| M0 | 121 | 55 | 94.8 | 66 | 77.6 | |
| M1 | 22 | 3 | 5.2 | 19 | 22.4 | |
| TNM stage | <0.001 ‡ | |||||
| I | 21 | 16 | 27.6 | 5 | 5.9 | |
| II | 45 | 21 | 36.2 | 24 | 28.2 | |
| III | 55 | 18 | 31.0 | 37 | 43.5 | |
| IV | 22 | 3 | 5.2 | 19 | 22.4 | |
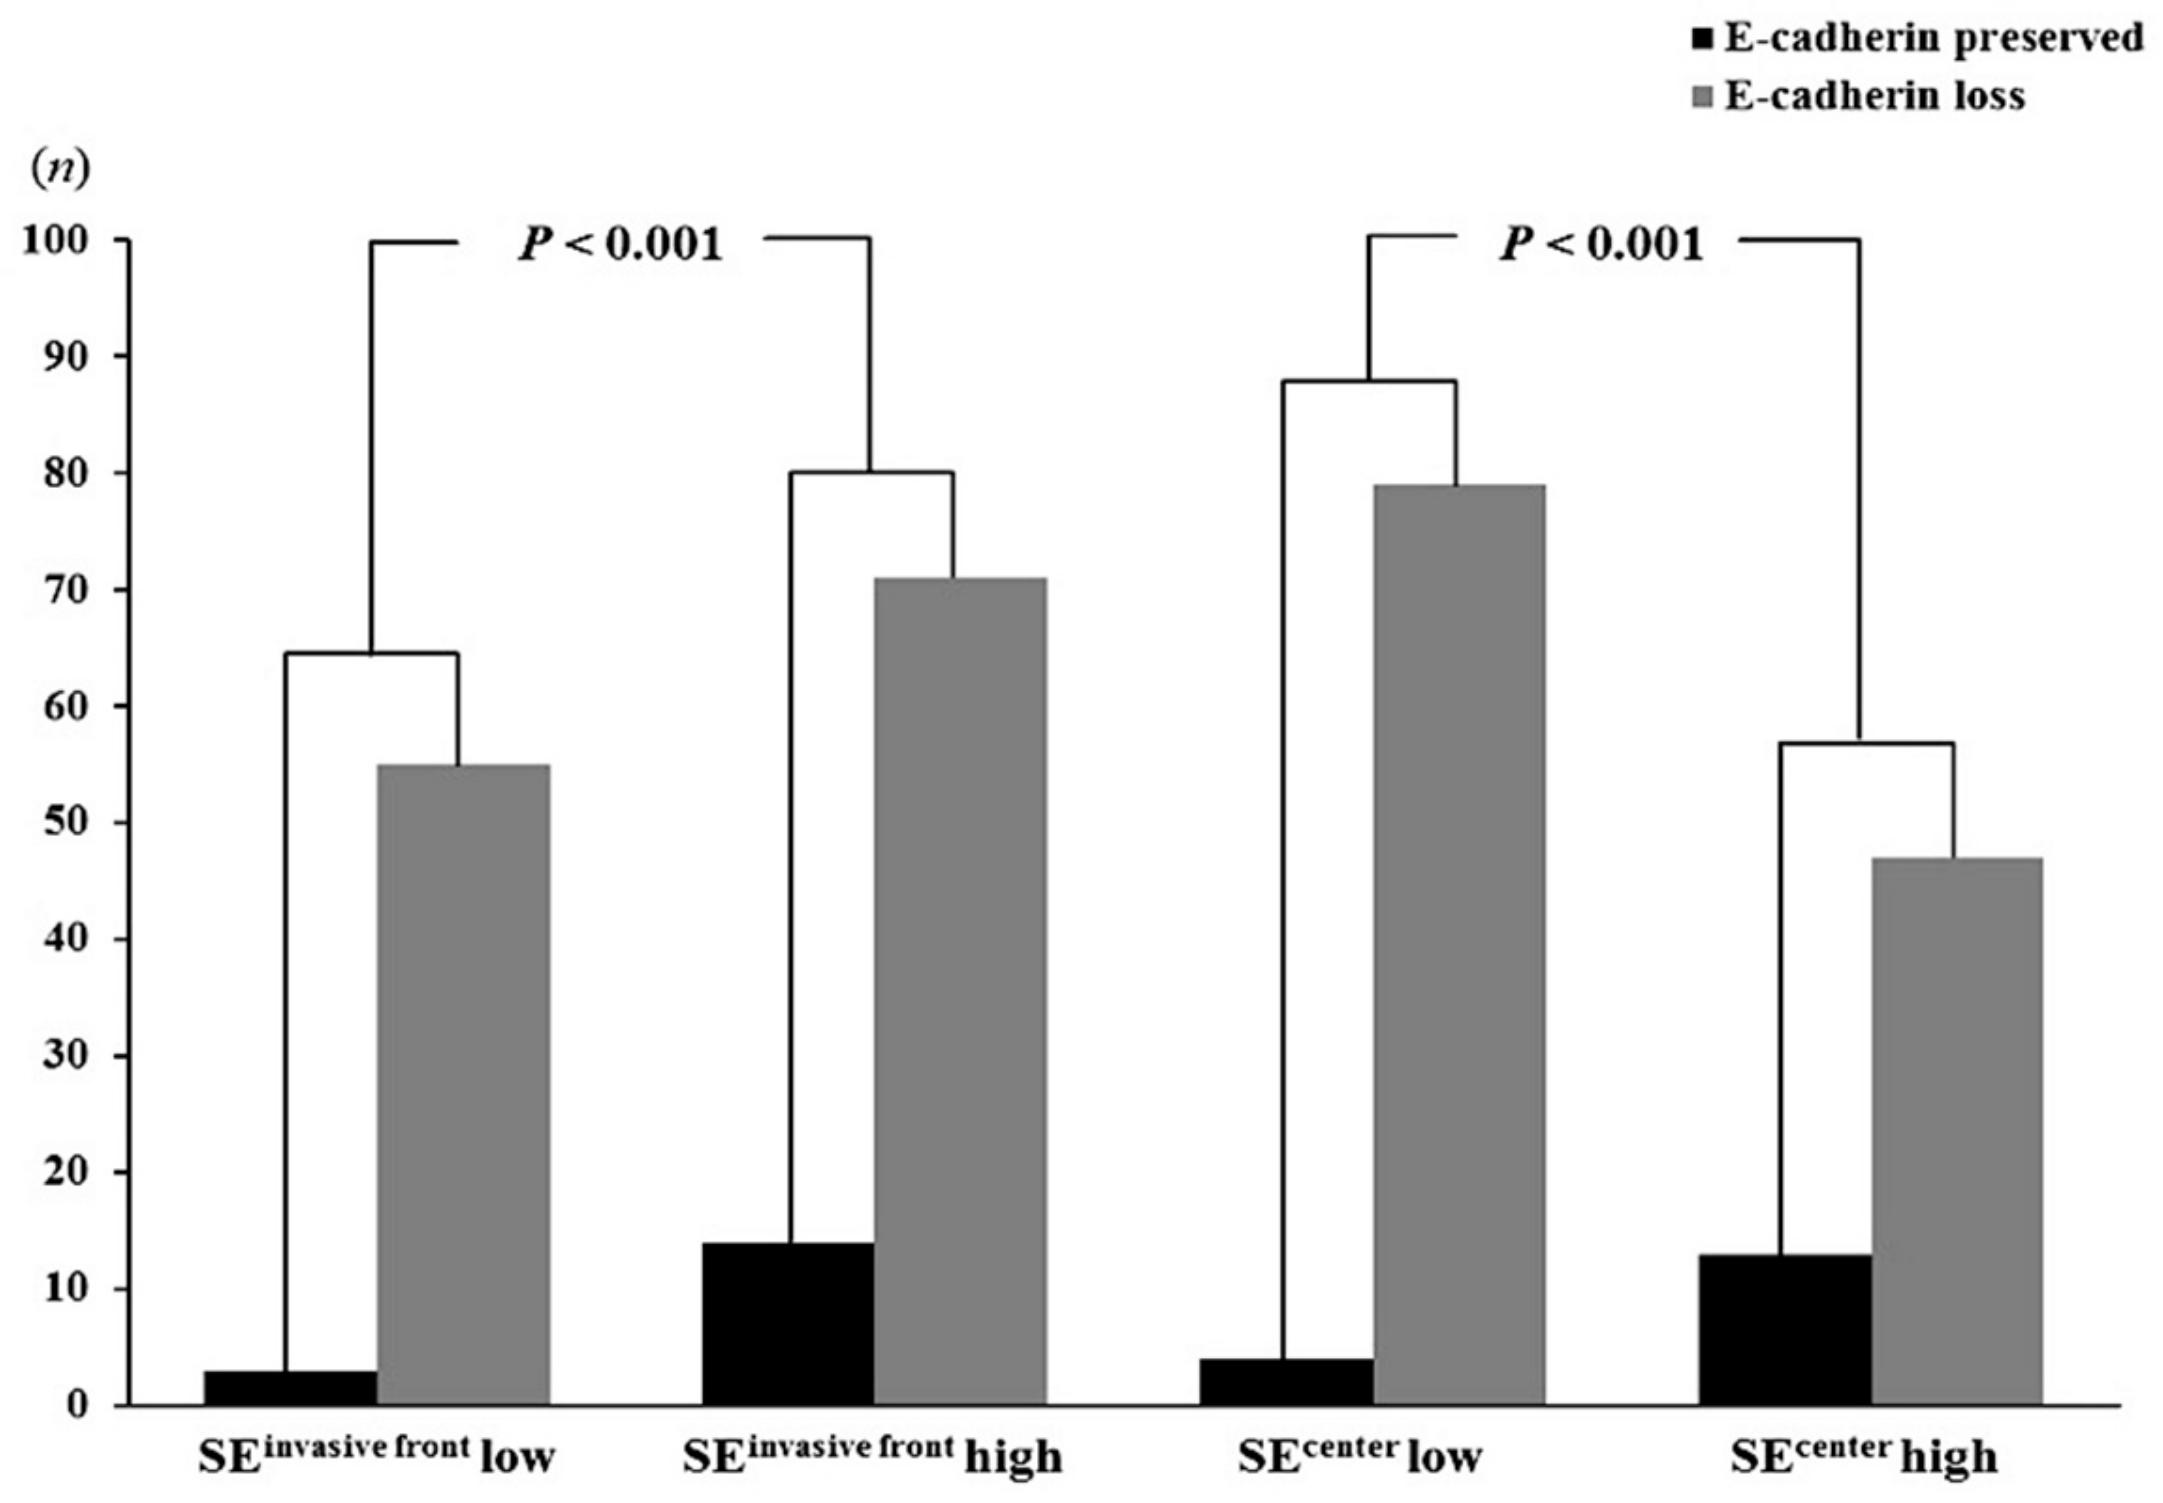
| SE Expression | E-Cadherin Expression | p-Value | |
|---|---|---|---|
| High (n = 17) (%) | Low/Negative (n = 126) (%) | ||
| Invasive front | |||
| Low/negative (n = 58) | 3 (5.2) | 55 (94.8) | <0.001 |
| High (n = 85) | 14 (16.5) | 71 (83.5) | |
| Tumor center | |||
| Low/negative, (n = 83) | 4 (4.8) | 79 (95.2) | <0.001 |
| High, (n = 60) | 13 (21.7) | 47 (73.8) | |
| n | RFS | OS | |||
|---|---|---|---|---|---|
| Relative Risk (95% CI) | p | Relative Risk (95% CI) | p | ||
| SEinvasive front | <0.001 | <0.001 | |||
| Low/negative | 58 | 1.000 | 1.000 | ||
| High | 85 | 3.647 (1.912–6.955) | 3.976 (1.894–8.347) | ||
| LV invasion | 0.768 | 0.939 | |||
| Not identified | 39 | 1.000 | 1.000 | ||
| Present | 104 | 0.911 (0.490–1.694) | 0.973 (0.490–1.934) | ||
| Budding | 0.657 | 0.882 | |||
| Low | 36 | 1.000 | 1.000 | ||
| High | 107 | 1.153 (0.614–2.165) | 0.949 (0.476–1.893) | ||
| Invasion depth | 0.022 | 0.030 | |||
| pT1 + pT2 | 26 | 1.000 | 1.000 | ||
| pT3 + pT4 | 117 | 3.774 (1.314–10.840) | 3.872 (1.138–13.175) | ||
| LN metastasis | 0.833 | 0.223 | |||
| Not identified | 67 | 1.000 | 1.000 | ||
| Present | 76 | 1.252 (0.747–2.099) | 1.433 (0.804–2.554) | ||
| Distant metastasis | 0.001 | <0.001 | |||
| M0 | 121 | 1.000 | 1.000 | ||
| M1 | 22 | 2.592 (1.455–4.618) | 3.569 (1.935–6.523) | ||
© 2019 by the authors. Licensee MDPI, Basel, Switzerland. This article is an open access article distributed under the terms and conditions of the Creative Commons Attribution (CC BY) license (http://creativecommons.org/licenses/by/4.0/).
Share and Cite
Kim, J.H.; Kim, C.N.; Kang, D.W. Squalene Epoxidase Correlates E-Cadherin Expression and Overall Survival in Colorectal Cancer Patients: The Impact on Prognosis and Correlation to Clinicopathologic Features. J. Clin. Med. 2019, 8, 632. https://doi.org/10.3390/jcm8050632
Kim JH, Kim CN, Kang DW. Squalene Epoxidase Correlates E-Cadherin Expression and Overall Survival in Colorectal Cancer Patients: The Impact on Prognosis and Correlation to Clinicopathologic Features. Journal of Clinical Medicine. 2019; 8(5):632. https://doi.org/10.3390/jcm8050632
Chicago/Turabian StyleKim, Joo Heon, Chang Nam Kim, and Dong Wook Kang. 2019. "Squalene Epoxidase Correlates E-Cadherin Expression and Overall Survival in Colorectal Cancer Patients: The Impact on Prognosis and Correlation to Clinicopathologic Features" Journal of Clinical Medicine 8, no. 5: 632. https://doi.org/10.3390/jcm8050632