Nuclear Phospho-SOD1 Protects DNA from Oxidative Stress Damage in Amyotrophic Lateral Sclerosis

 , ,
, ,  and
and
Abstract
1. Introduction
2. Materials and Methods
2.1. Chemicals and Reagents
2.2. Cell Culture and Treatment
2.3. Patients’ Enrolment
2.4. Isolation of PBMCs from ALS Patients and Healthy Controls
2.5. Subcellular Fractionation
2.6. Cell Transfection
2.7. Western Blotting Analysis
2.8. Immunocytochemistry
2.9. Comet Assay
2.10. Immunoprecipitation
2.11. Mass Spectrometry
2.12. Real Time-qPCR
2.13. Statistical Analysis
2.14. Ethic Statement
3. Results
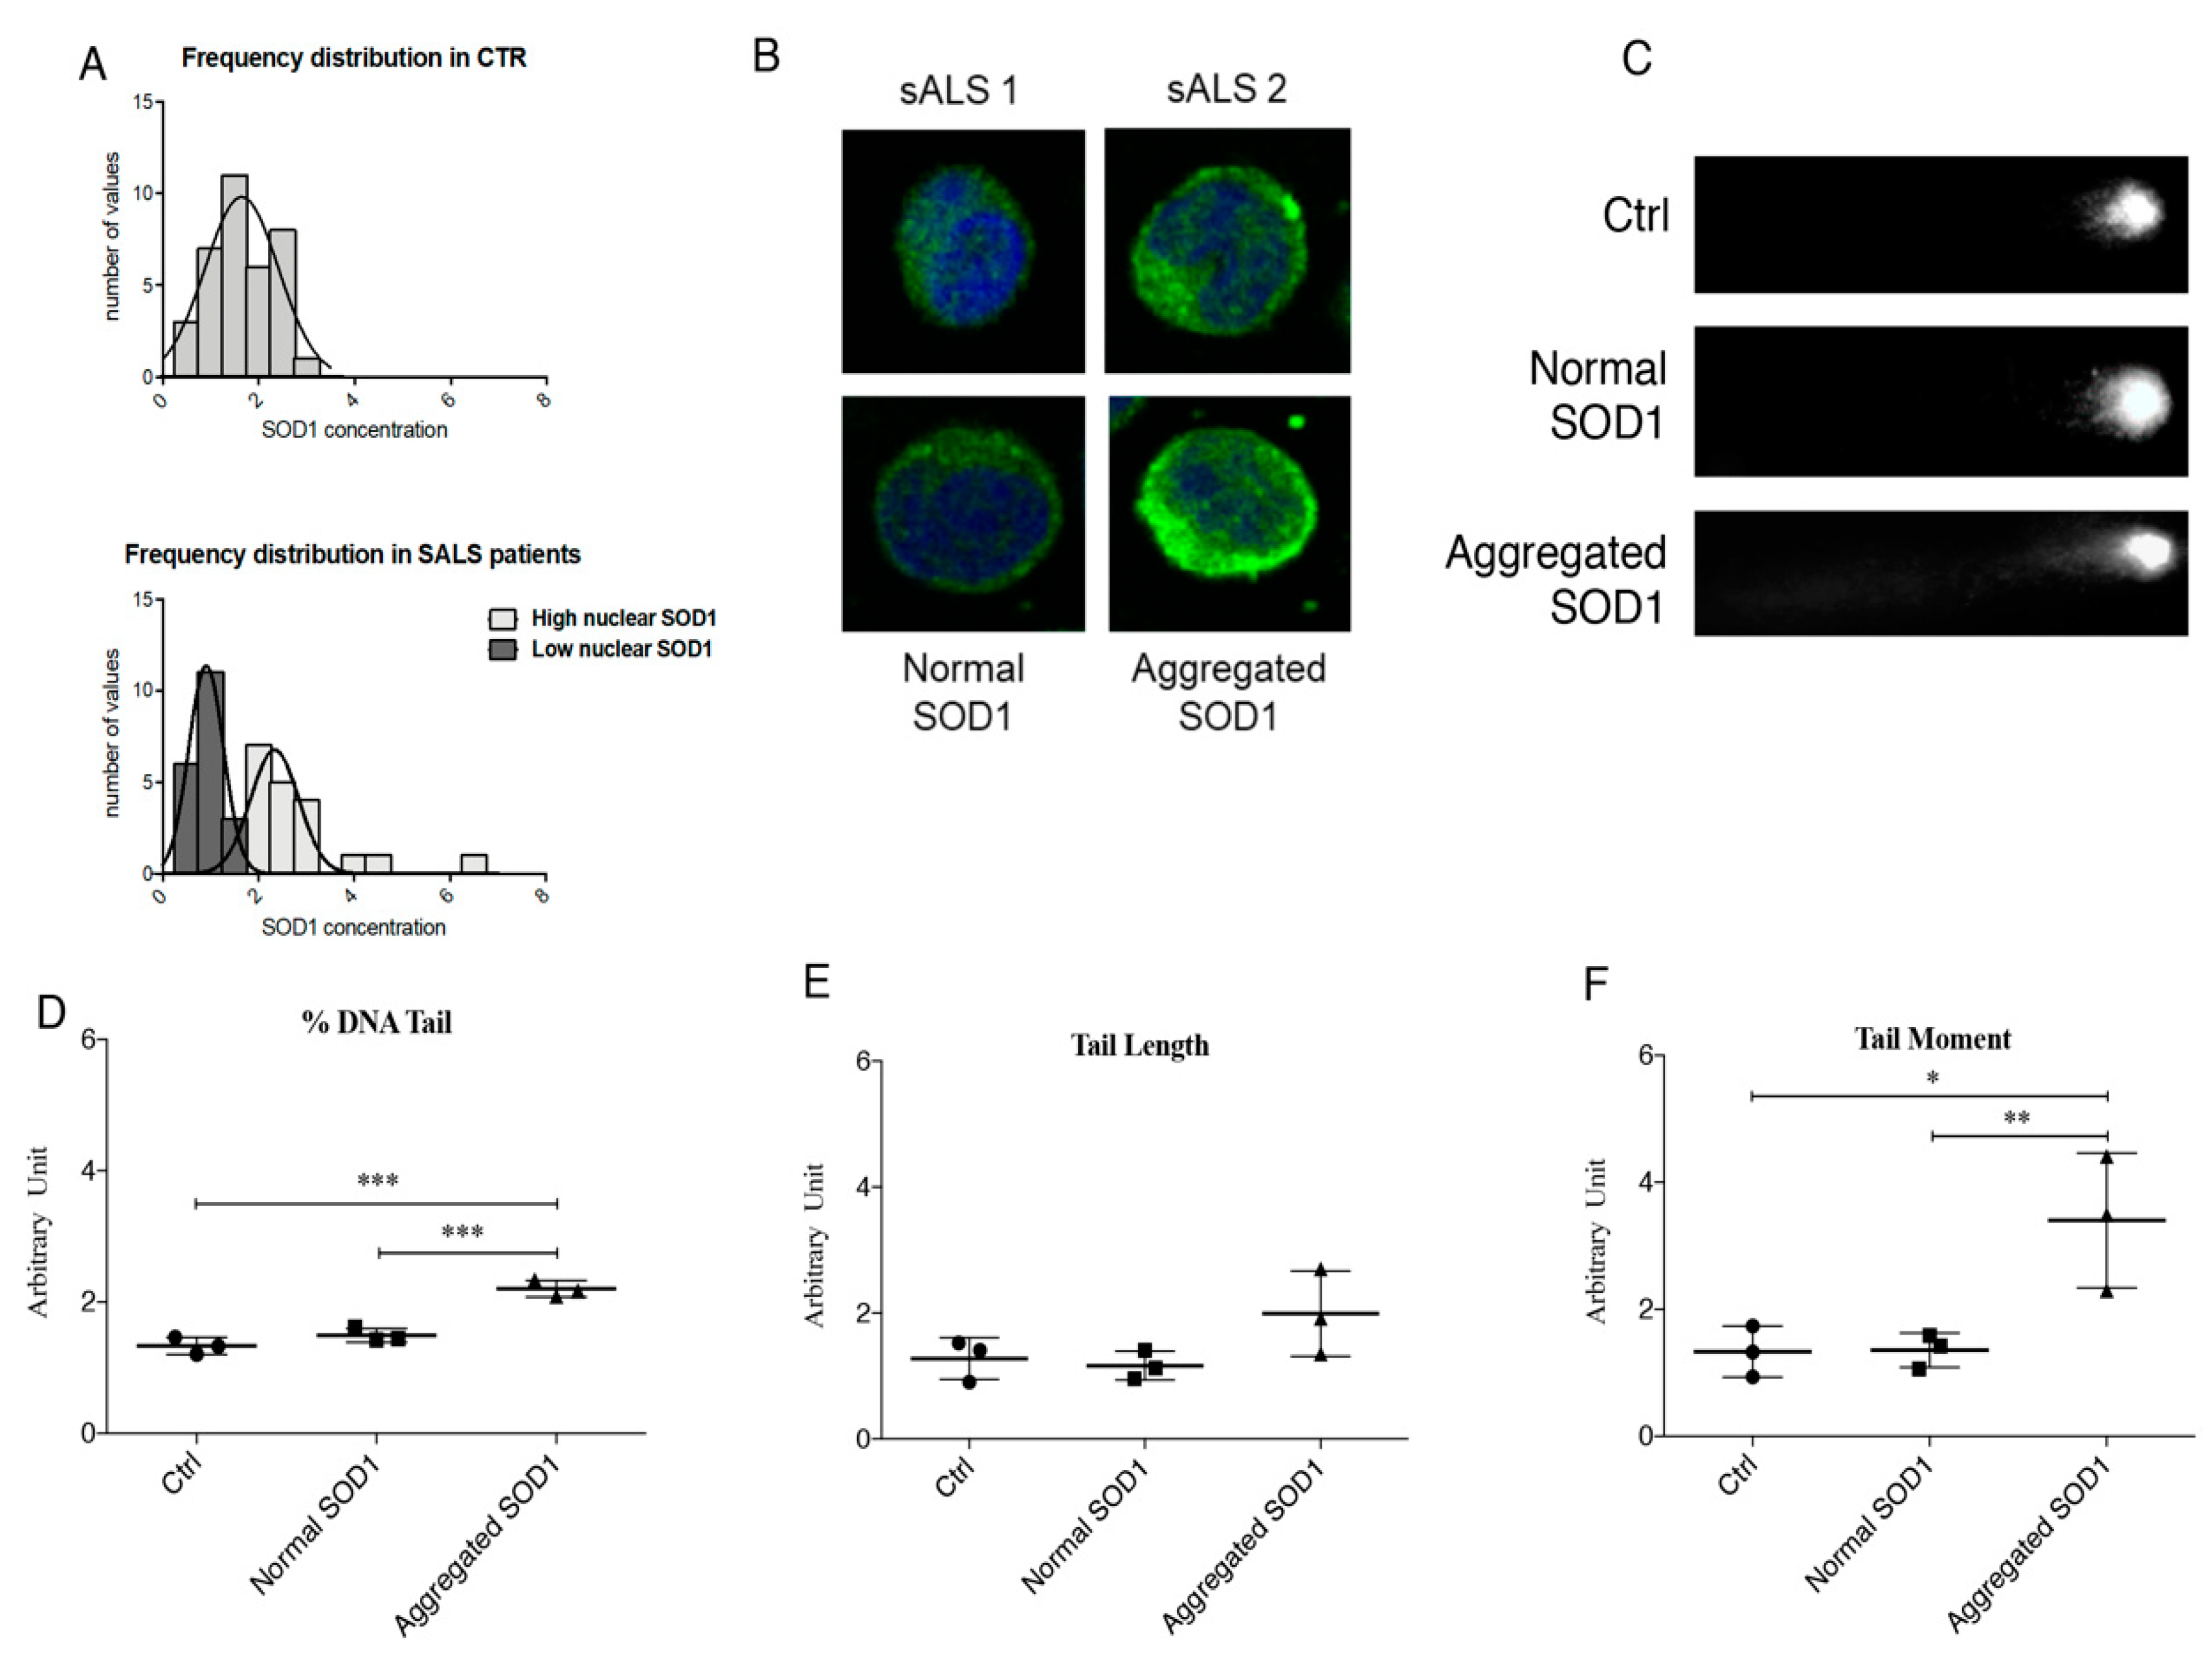
3.1. Cytoplasmic Aggregation of SOD1 Induce DNA Damage
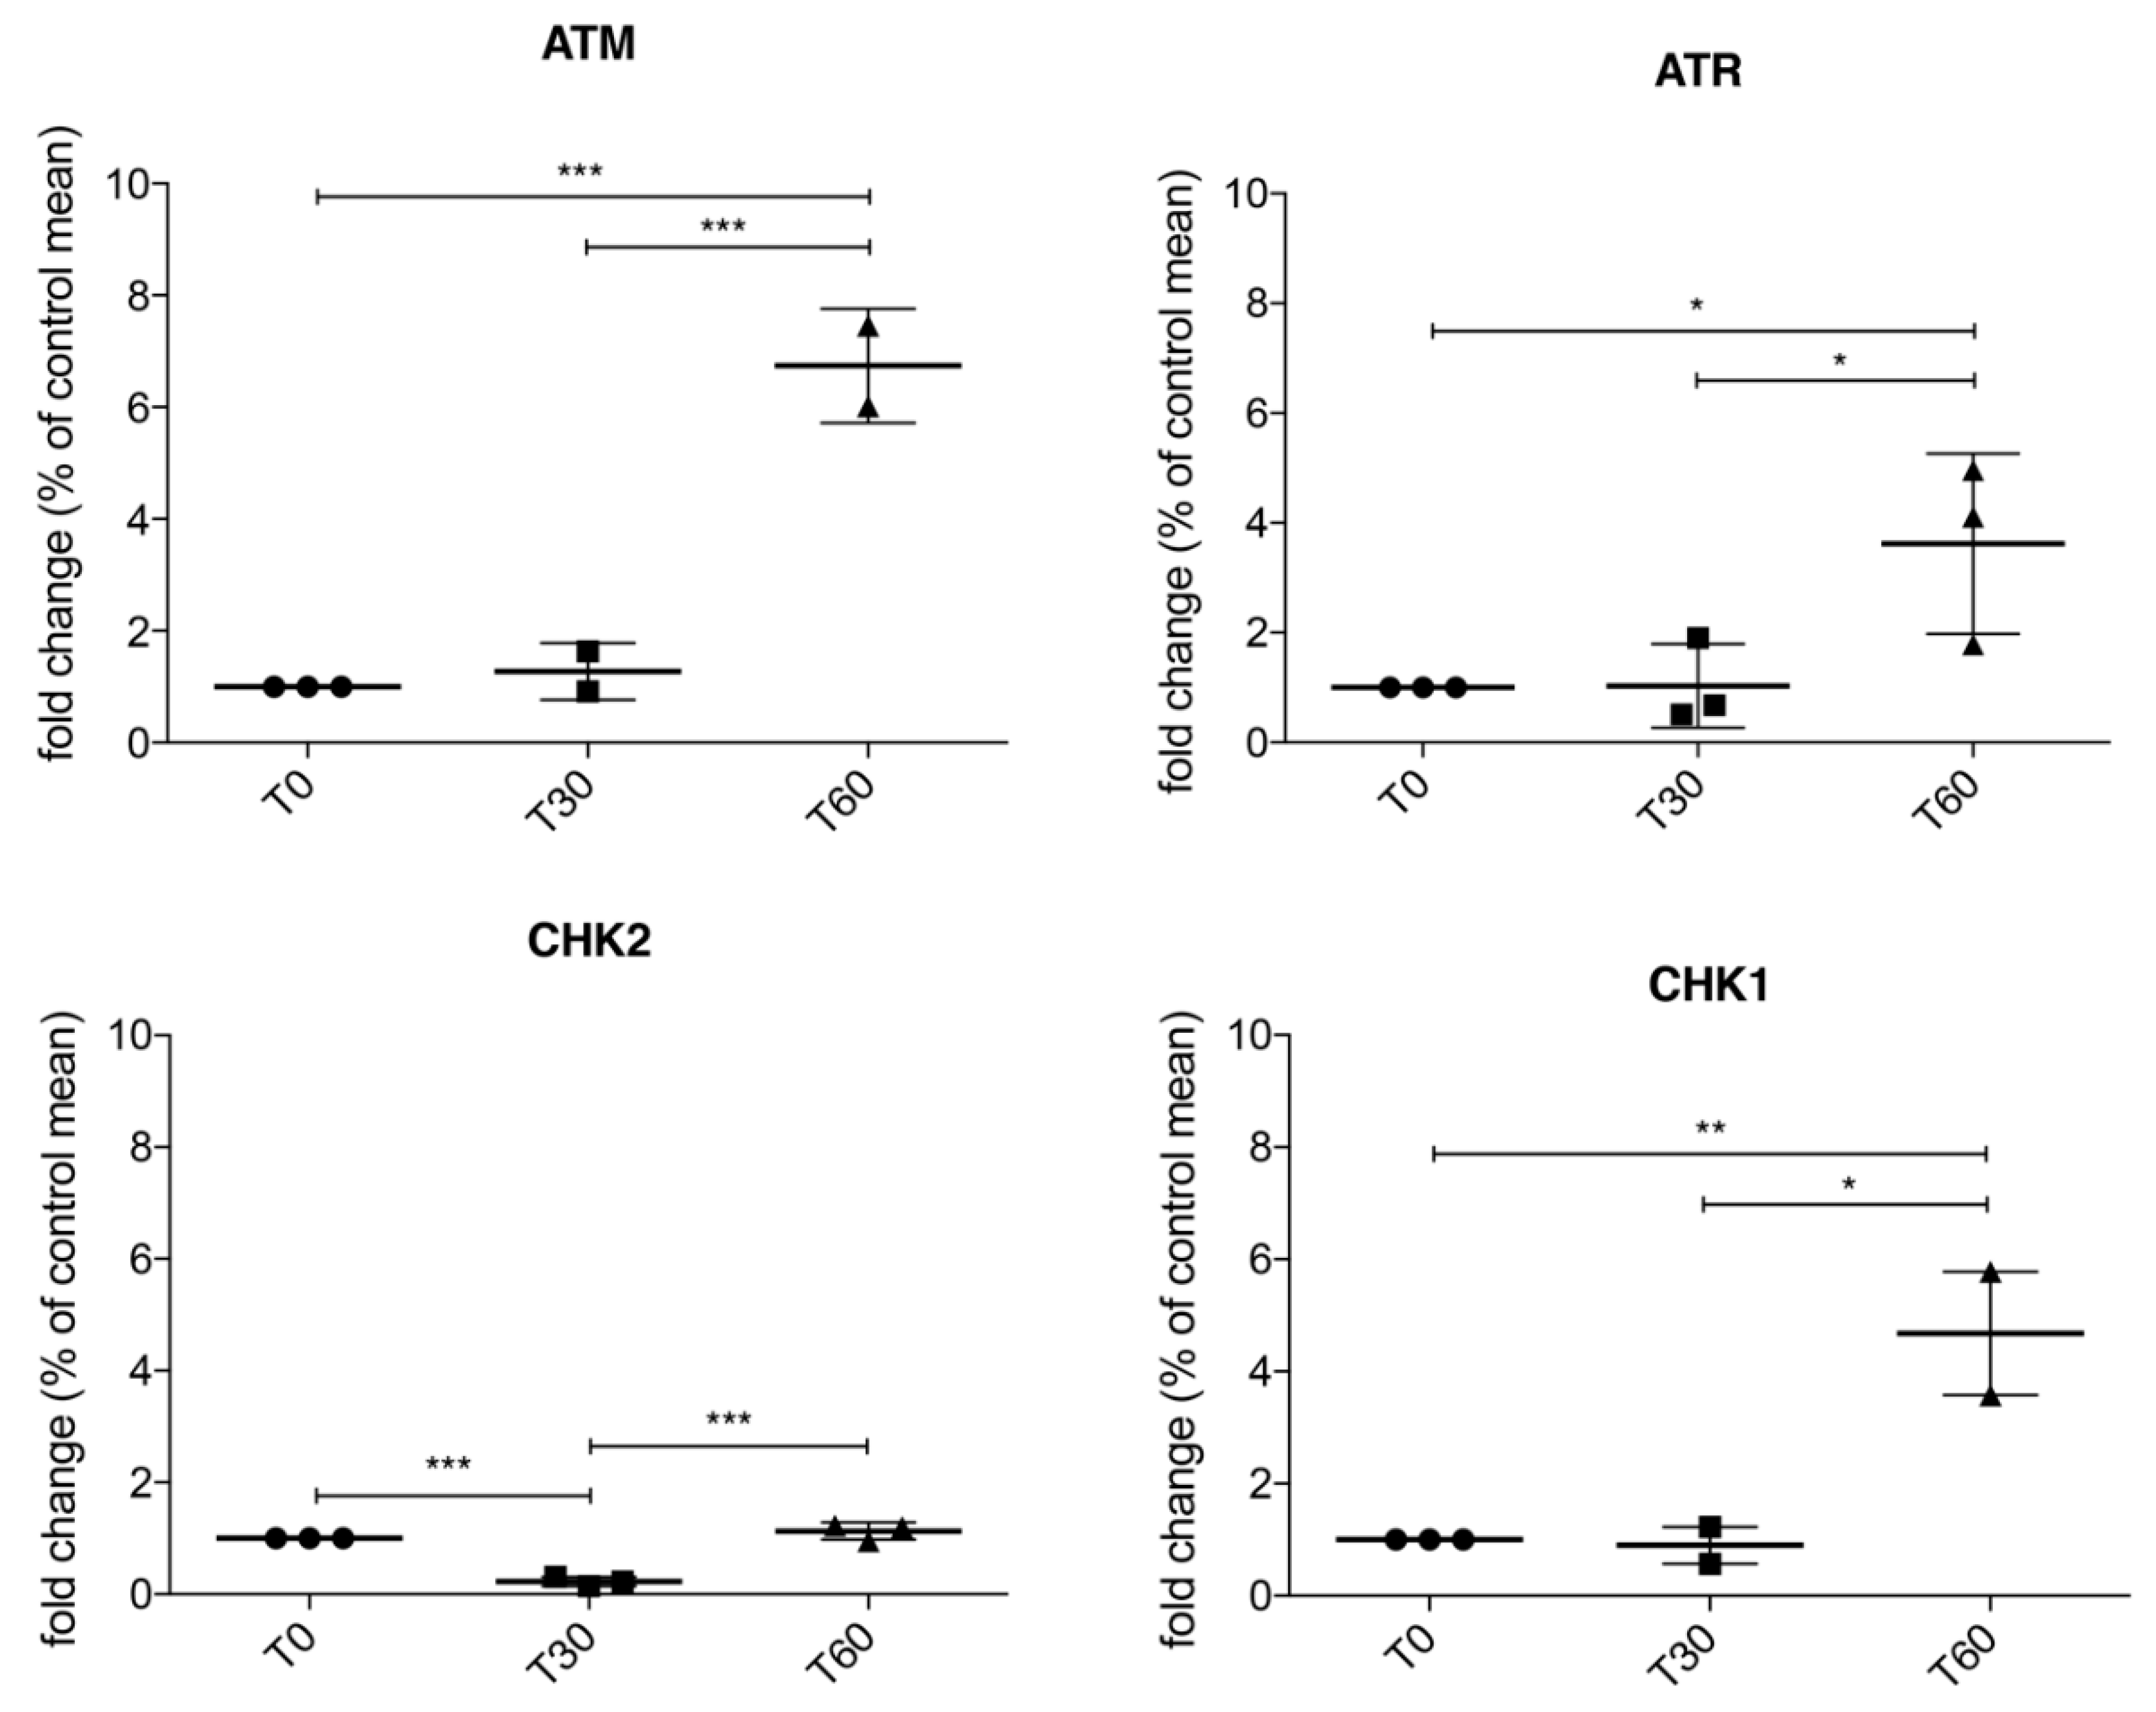
3.2. Activation of ATM/Chk2 and ATR/Chk1 Pathways in Treated SH-SY5Y
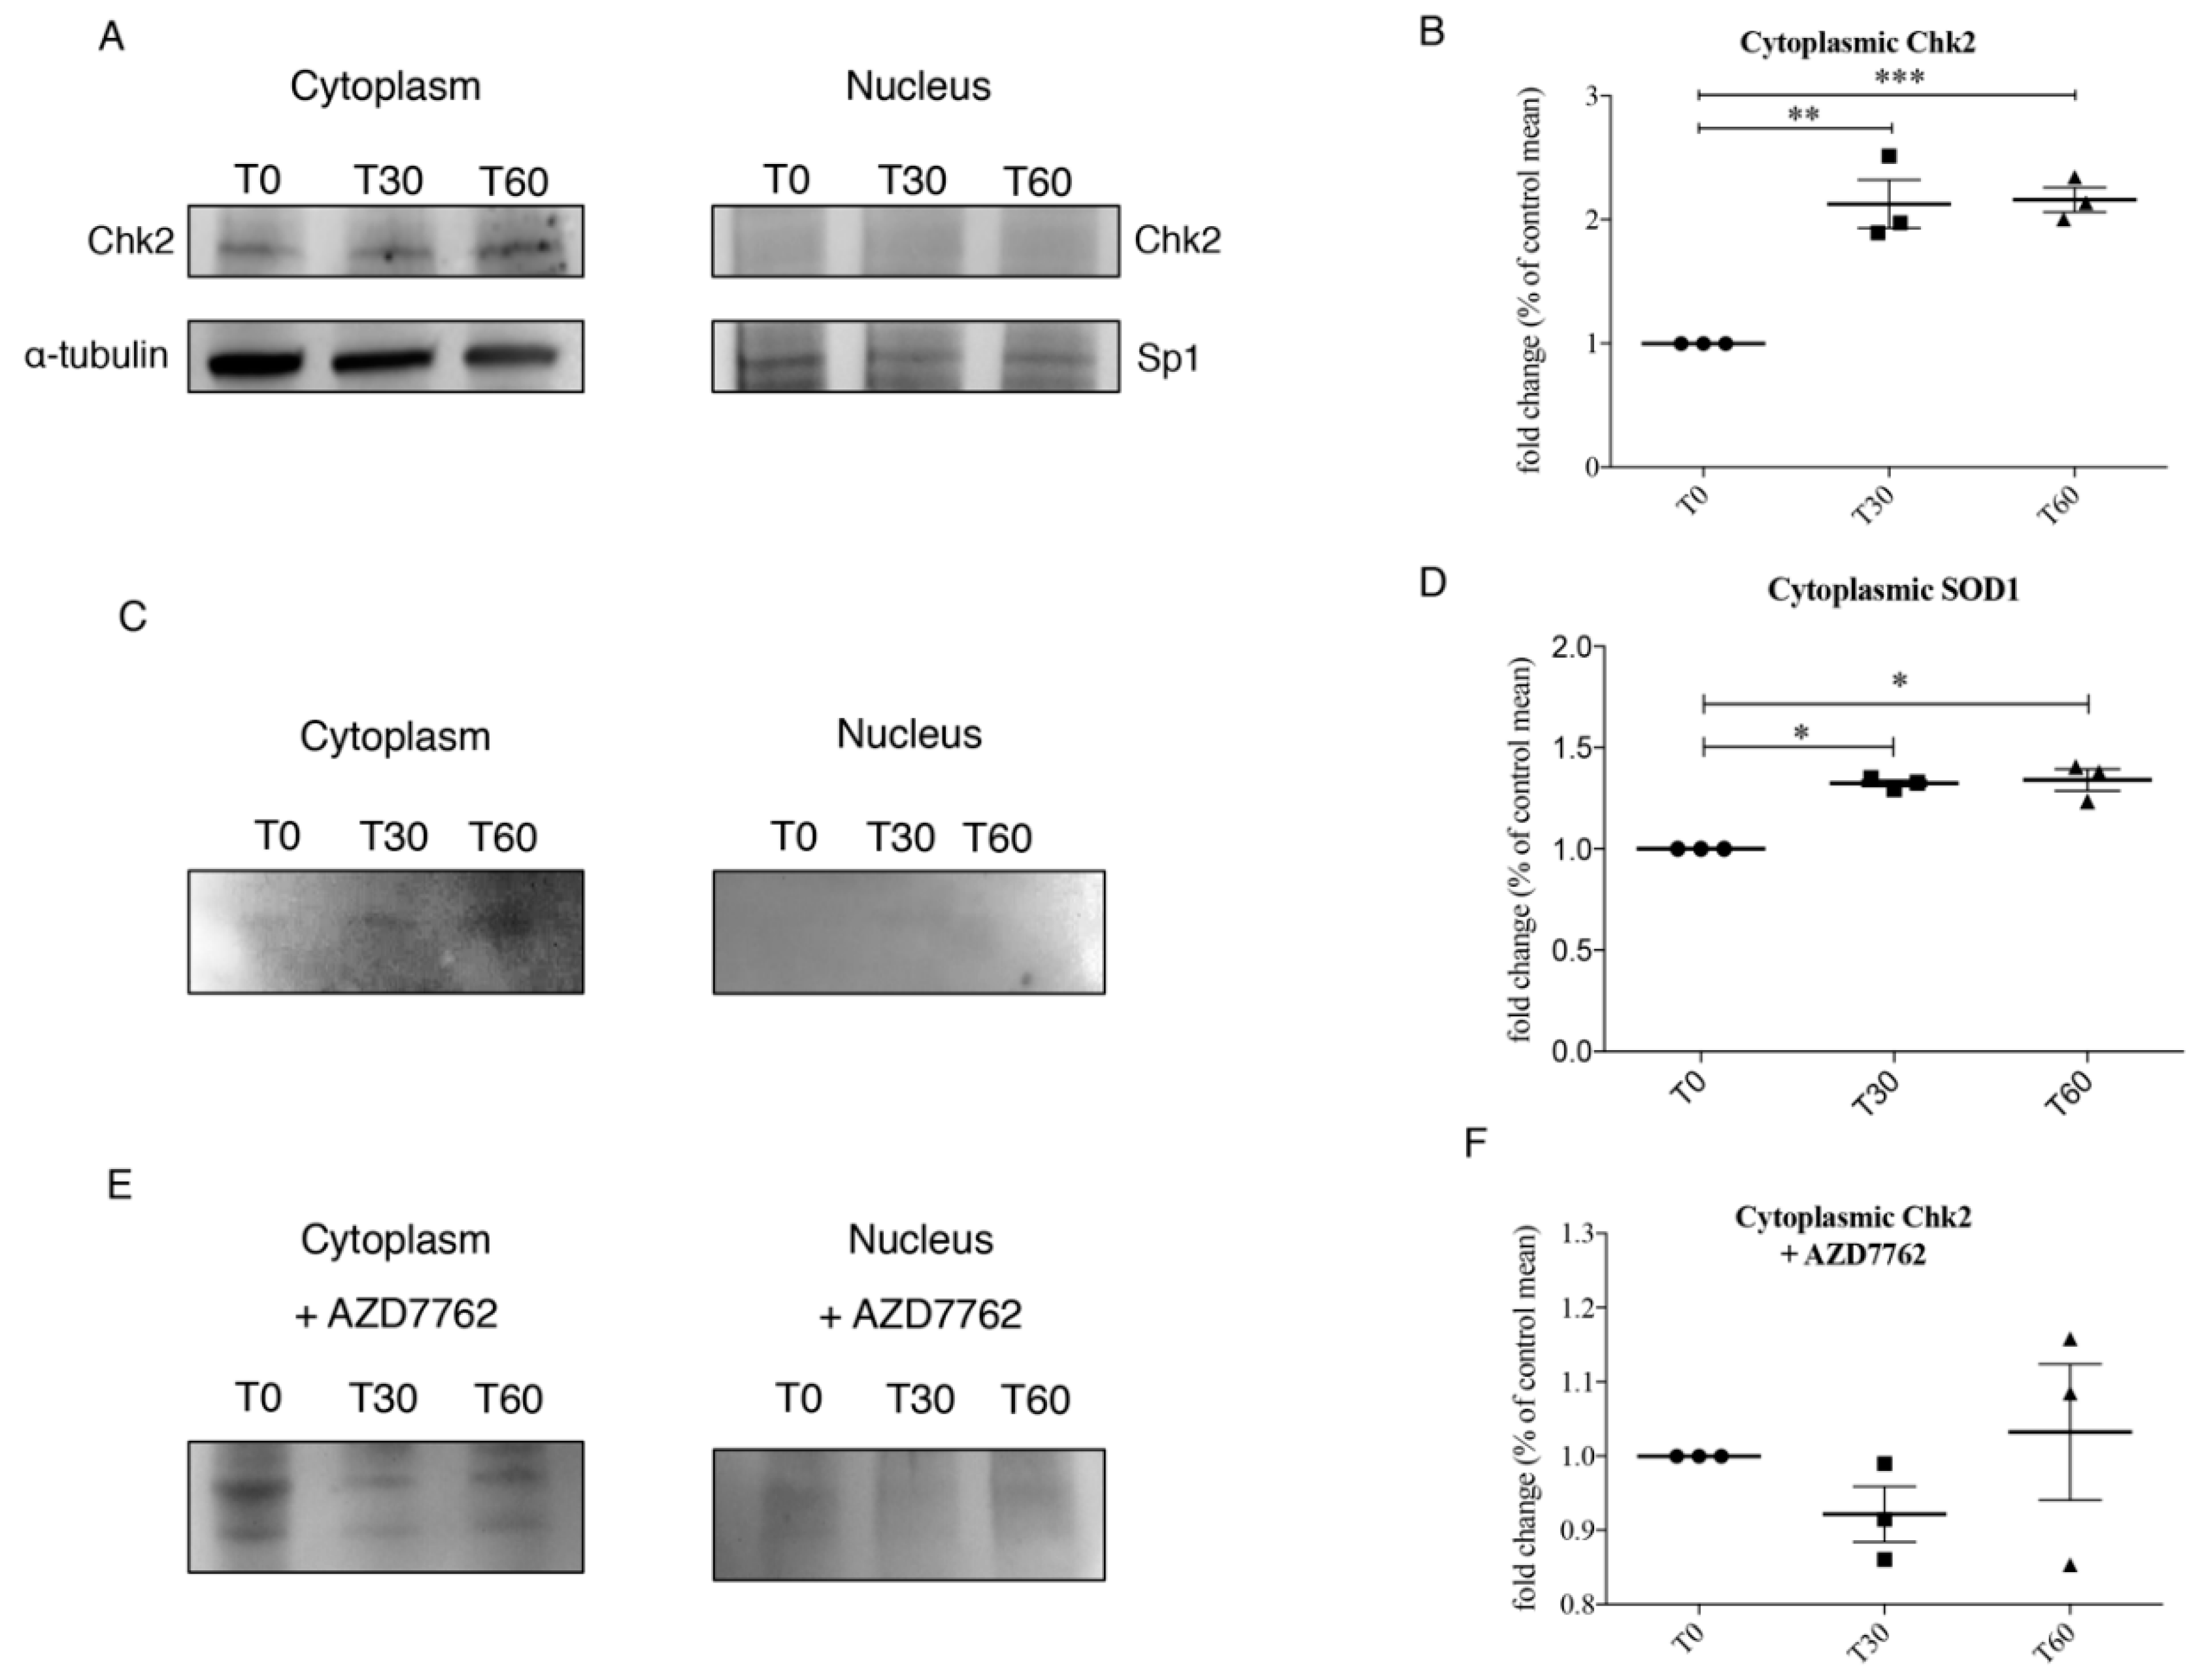
3.3. Chk2 Binds SOD1 in Presence of Oxidative Stress
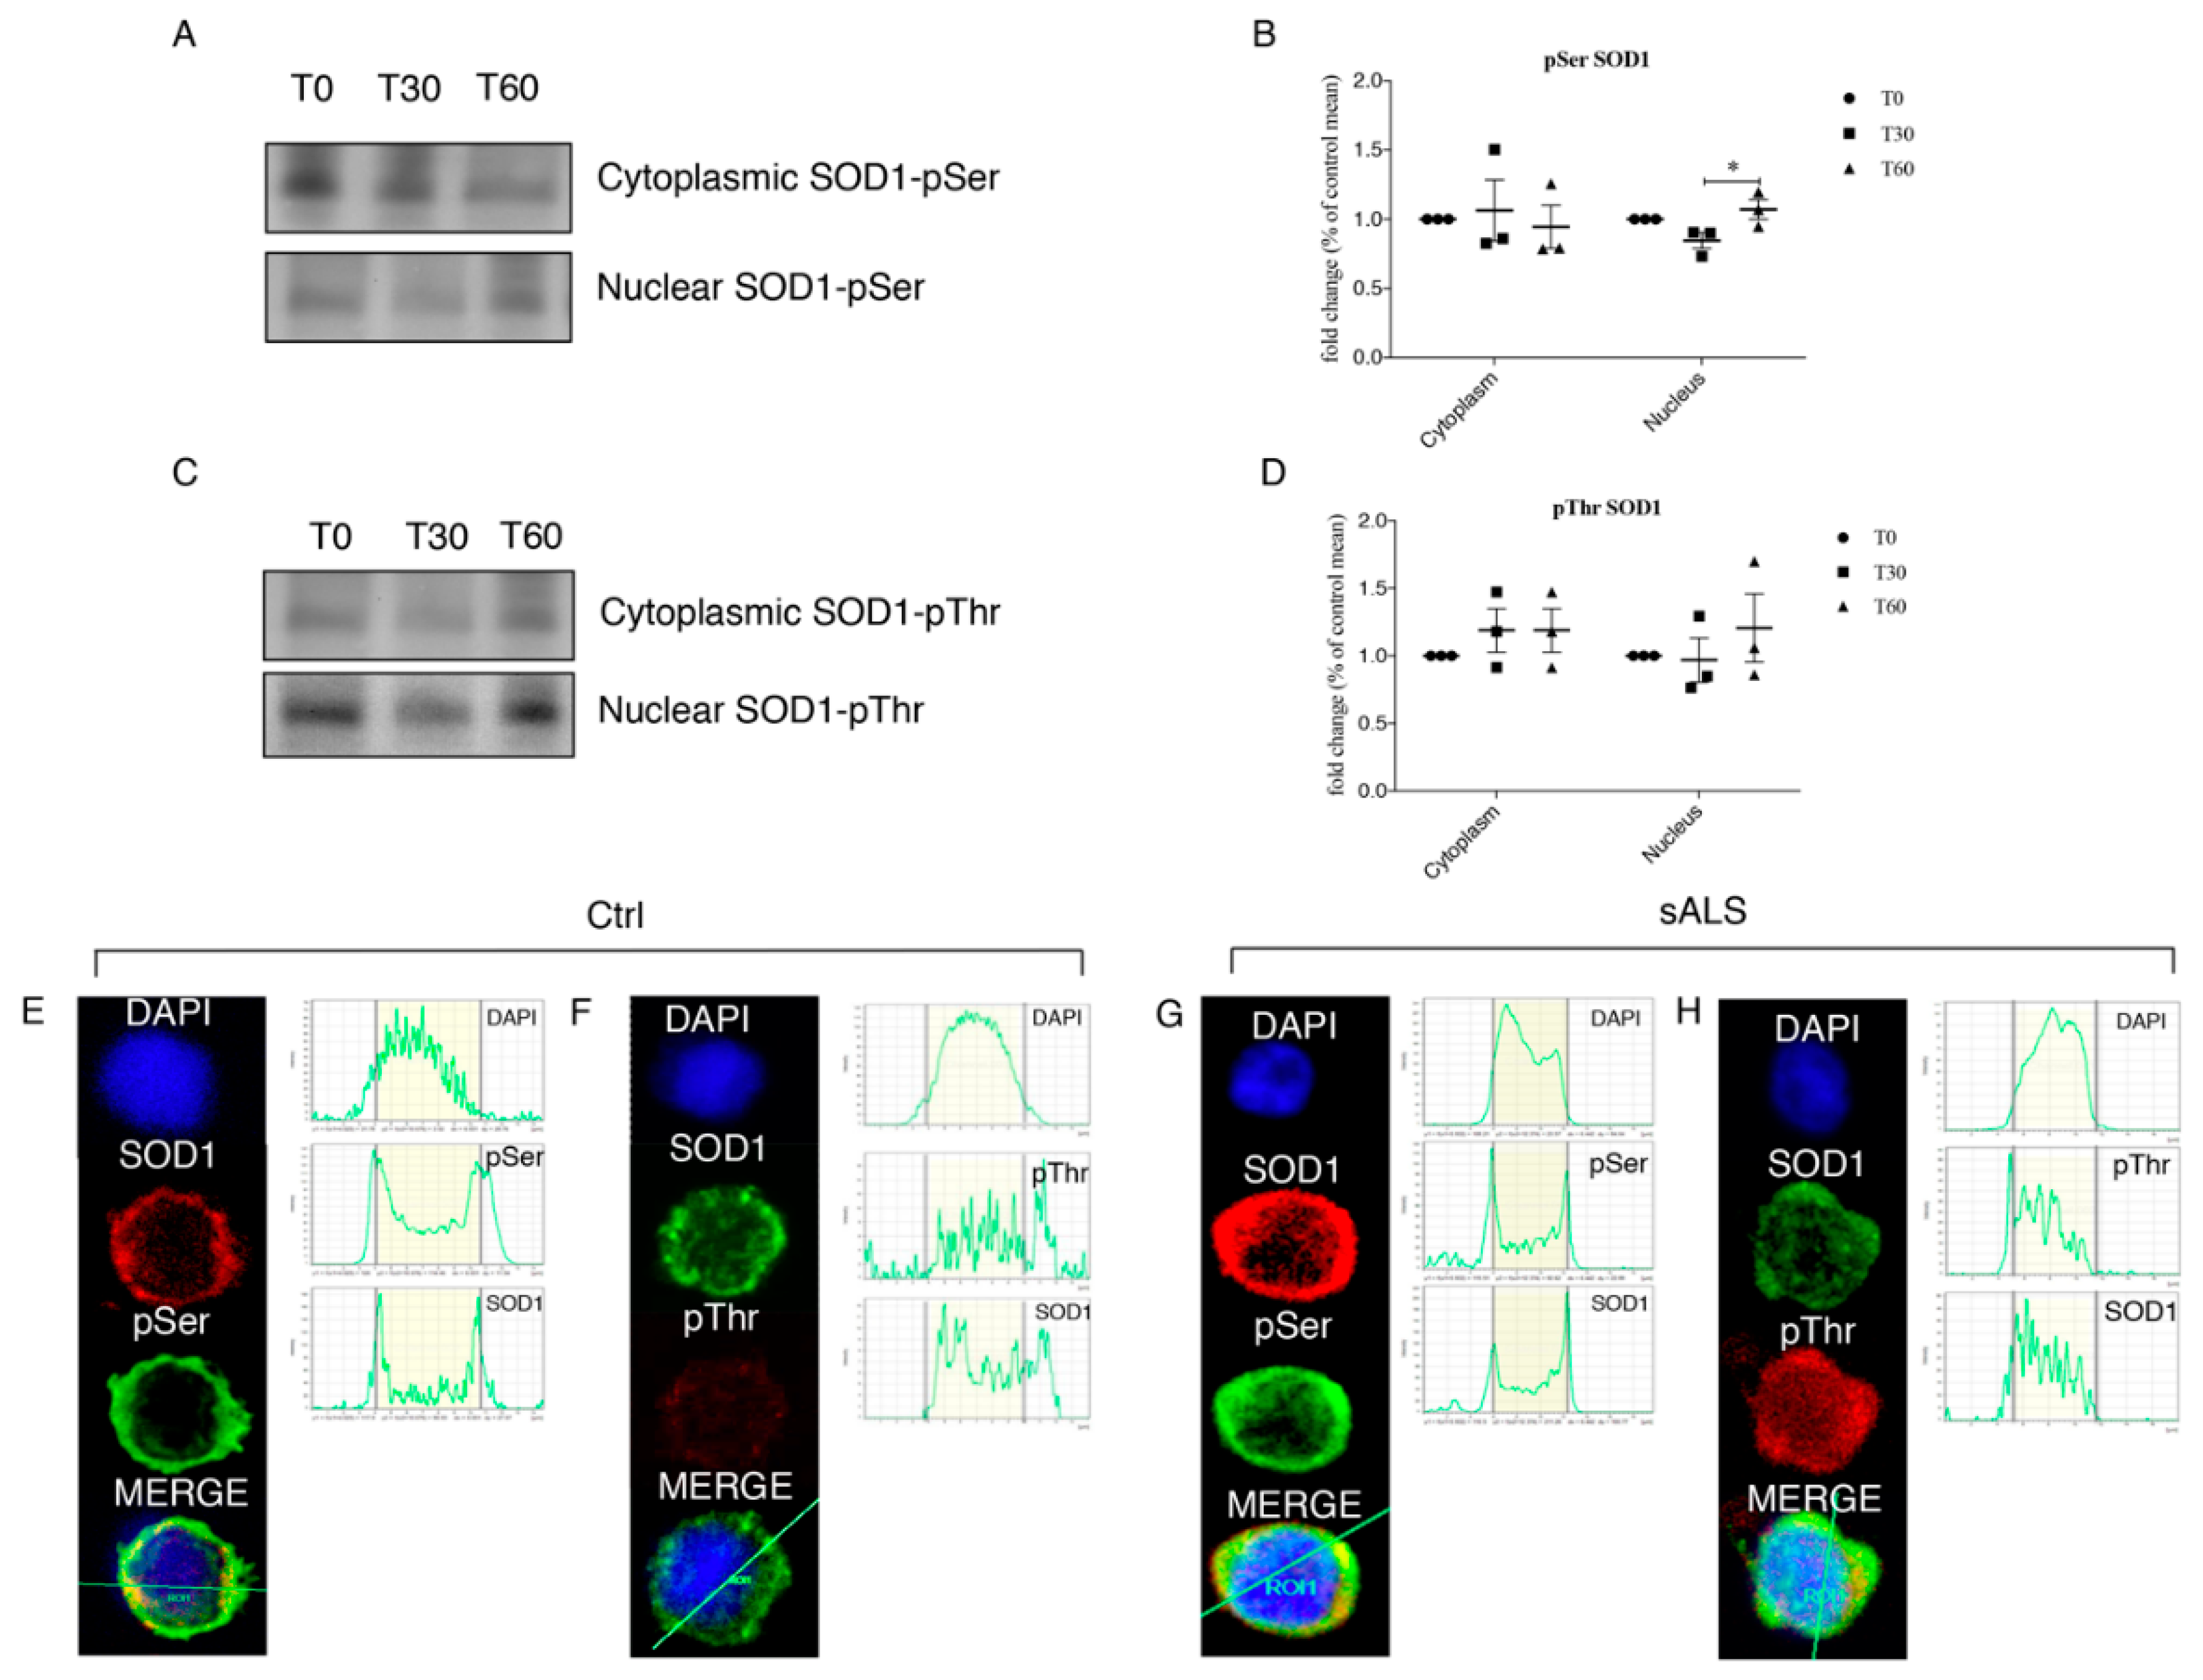
3.4. Oxidative Stress Stimulates SOD1 Phosphorylation
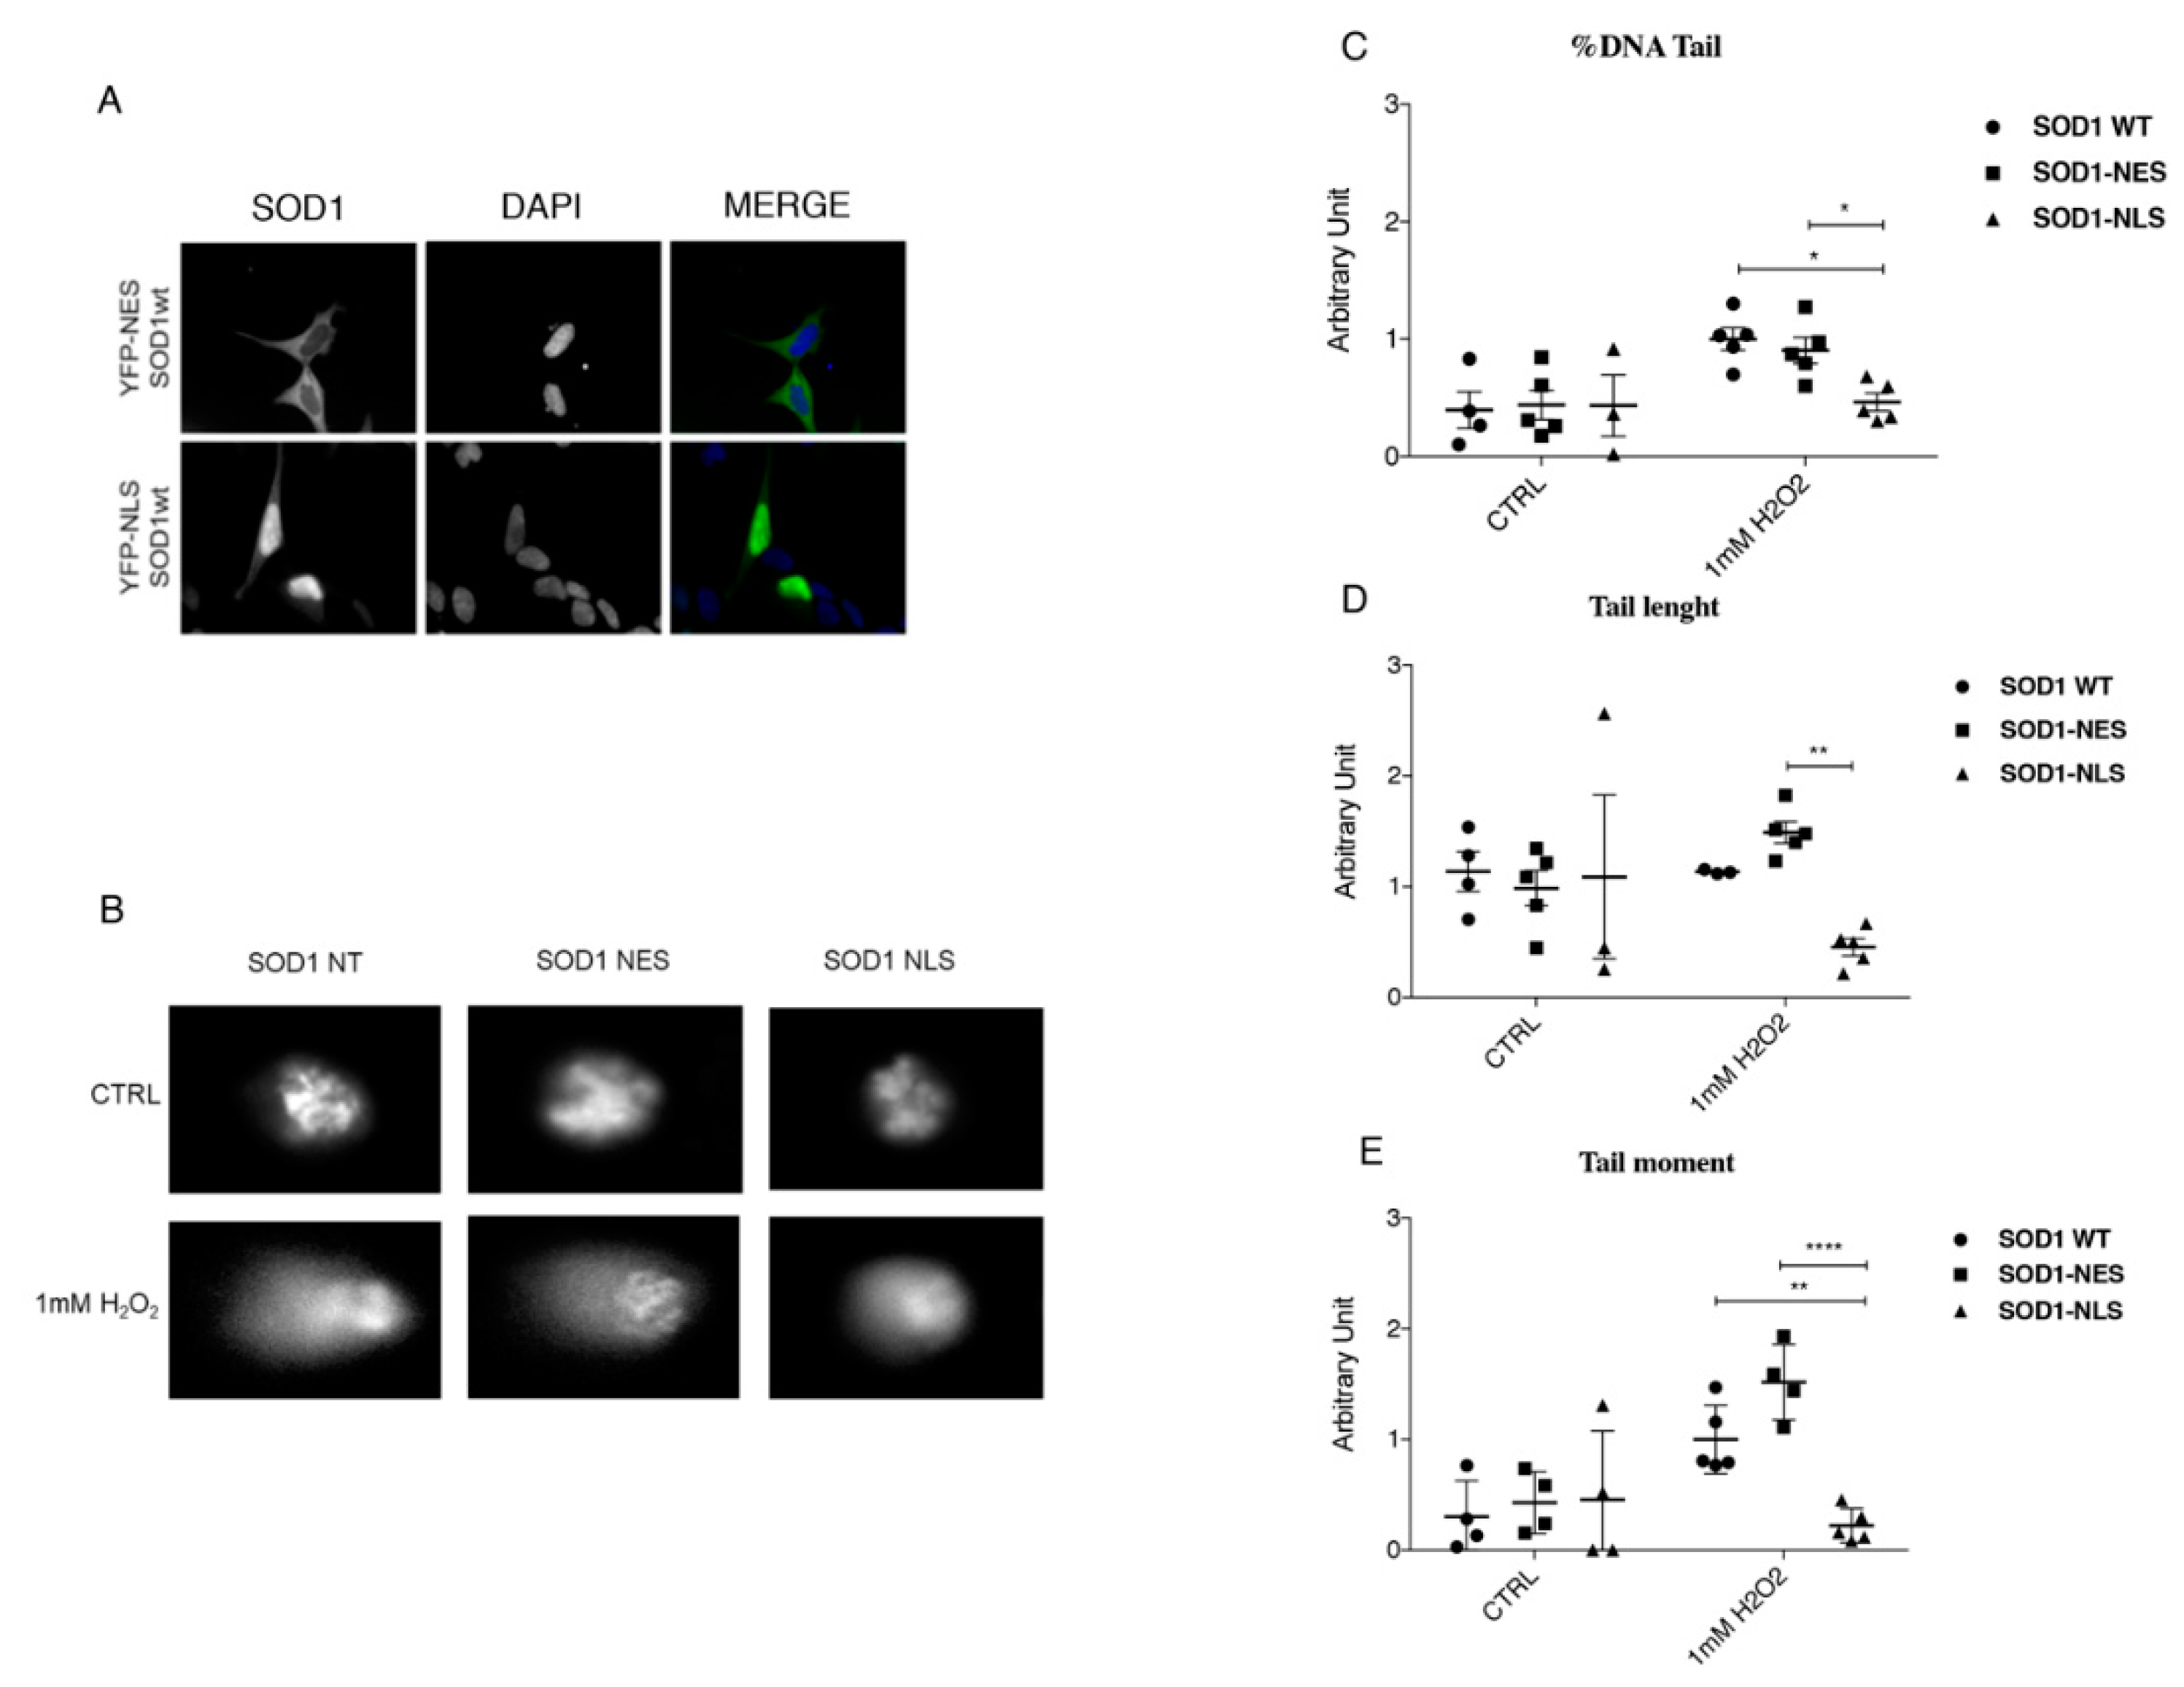
3.5. Protective Role of SOD1 in Nucleus
4. Discussion
Supplementary Materials
Author Contributions
Funding
Conflicts of Interest
Abbreviations
| ALS | Amyotrophic Lateral Sclerosis |
| ATM | Ataxia Telangiectasia Mutated |
| ATR | ATM and Rad3-related |
| Chk1 | Checkpoint Kinase 1 |
| Chk2 | Checkpoint Kinase 2 |
| DDR | DNA Damage Repair |
| DSB | Double Strand Break |
| fALS | familial Amyotrophic Lateral Sclerosis |
| FUS | Fused in Sarcoma |
| NES | Nuclear Export Signal |
| NLS | Nuclear Localization Signal |
| PBMC | Peripheral Blood Mononuclear Cell |
| PBS | Phosphate Buffered Saline |
| pSer | phosphoSerine |
| pThr | phosphoThreonine |
| RBP | RNA Binding Protein |
| sALS | sporadic Amyotrophic Lateral Sclerosis |
| Ser | Serine |
| SOD1 | Superoxide dismutase 1 |
| SSB | Single Strand Break |
| TARDBP | TAR DNA Binding Protein |
| Thr | Threonine |
References
- Riancho, J.; Gonzalo, I.; Ruiz-Soto, M.; Berciano, J. Why do motor neurons degenerate? Actualization in the pathogenesis of amyotrophic lateral sclerosis. Neurologia 2019, 34, 27–37. [Google Scholar] [CrossRef]
- Zufiría, M.; Gil-Bea, F.J.; Fernández-Torrón, R.; Poza, J.J.; Muñoz-Blanco, J.L.; Rojas-García, R.; Riancho, J.; López de Munain, A. Als: A bucket of genes, environment, metabolism and unknown ingredients. Prog. Neurobiol. 2016, 142, 104–129. [Google Scholar] [CrossRef] [PubMed]
- Migliore, L.; Coppedè, F. Genetics, environmental factors and the emerging role of epigenetics in neurodegenerative diseases. Mutat. Res. 2009, 667, 82–97. [Google Scholar] [CrossRef] [PubMed]
- Cirulli, E.T.; Lasseigne, B.N.; Petrovski, S.; Sapp, P.C.; Dion, P.A.; Leblond, C.S.; Couthouis, J.; Lu, Y.F.; Wang, Q.; Krueger, B.J.; et al. Exome sequencing in amyotrophic lateral sclerosis identifies risk genes and pathways. Science 2015, 347, 1436–1441. [Google Scholar] [CrossRef] [PubMed]
- Taylor, J.P.; Brown, R.H.; Cleveland, D.W. Decoding als: From genes to mechanism. Nature 2016, 539, 197–206. [Google Scholar] [CrossRef] [PubMed]
- Hegde, M.L.; Mantha, A.K.; Hazra, T.K.; Bhakat, K.K.; Mitra, S.; Szczesny, B. Oxidative genome damage and its repair: Implications in aging and neurodegenerative diseases. Mech. Ageing Dev. 2012, 133, 157–168. [Google Scholar] [CrossRef]
- Pan, L.; Penney, J.; Tsai, L.H. Chromatin regulation of DNA damage repair and genome integrity in the central nervous system. J. Mol. Biol. 2014, 426, 3376–3388. [Google Scholar] [CrossRef] [PubMed]
- Penndorf, D.; Witte, O.W.; Kretz, A. DNA plasticity and damage in amyotrophic lateral sclerosis. Neural Regen. Res. 2018, 13, 173–180. [Google Scholar]
- Madabhushi, R.; Gao, F.; Pfenning, A.R.; Pan, L.; Yamakawa, S.; Seo, J.; Rueda, R.; Phan, T.X.; Yamakawa, H.; Pao, P.C.; et al. Activity-induced DNA breaks govern the expression of neuronal early-response genes. Cell 2015, 161, 1592–1605. [Google Scholar] [CrossRef]
- Li, Z.; Pearlman, A.H.; Hsieh, P. DNA mismatch repair and the DNA damage response. DNA Repair 2016, 38, 94–101. [Google Scholar] [CrossRef]
- Maréchal, A.; Zou, L. DNA damage sensing by the atm and atr kinases. Cold Spring Harb. Perspect. Biol. 2013, 5, a012716. [Google Scholar] [CrossRef] [PubMed]
- Sirbu, B.M.; Cortez, D. DNA damage response: Three levels of DNA repair regulation. Cold Spring Harb. Perspect. Biol. 2013, 5, a012724. [Google Scholar] [CrossRef]
- Shiwaku, H.; Okazawa, H. Impaired DNA damage repair as a common feature of neurodegenerative diseases and psychiatric disorders. Curr. Mol. Med. 2015, 15, 119–128. [Google Scholar] [CrossRef]
- Pansarasa, O.; Bordoni, M.; Drufuca, L.; Diamanti, L.; Sproviero, D.; Trotti, R.; Bernuzzi, S.; La Salvia, S.; Gagliardi, S.; Ceroni, M.; et al. Lymphoblastoid cell lines as a model to understand amyotrophic lateral sclerosis disease mechanisms. Dis. Model. Mech. 2018, 11, dmm031625. [Google Scholar] [CrossRef] [PubMed]
- Cereda, C.; Leoni, E.; Milani, P.; Pansarasa, O.; Mazzini, G.; Guareschi, S.; Alvisi, E.; Ghiroldi, A.; Diamanti, L.; Bernuzzi, S.; et al. Altered intracellular localization of sod1 in leukocytes from patients with sporadic amyotrophic lateral sclerosis. PLoS ONE 2013, 8, e75916. [Google Scholar] [CrossRef] [PubMed]
- Gagliardi, S.; Cova, E.; Davin, A.; Guareschi, S.; Abel, K.; Alvisi, E.; Laforenza, U.; Ghidoni, R.; Cashman, J.R.; Ceroni, M.; et al. Sod1 mrna expression in sporadic amyotrophic lateral sclerosis. Neurobiol. Dis. 2010, 39, 198–203. [Google Scholar] [CrossRef] [PubMed]
- Milani, P.; Amadio, M.; Laforenza, U.; Dell’Orco, M.; Diamanti, L.; Sardone, V.; Gagliardi, S.; Govoni, S.; Ceroni, M.; Pascale, A.; et al. Posttranscriptional regulation of sod1 gene expression under oxidative stress: Potential role of elav proteins in sporadic als. Neurobiol. Dis. 2013, 60, 51–60. [Google Scholar] [CrossRef]
- Sau, D.; De Biasi, S.; Vitellaro-Zuccarello, L.; Riso, P.; Guarnieri, S.; Porrini, M.; Simeoni, S.; Crippa, V.; Onesto, E.; Palazzolo, I.; et al. Mutation of sod1 in als: A gain of a loss of function. Hum. Mol. Genet. 2007, 16, 1604–1618. [Google Scholar] [CrossRef]
- Barbosa, L.F.; Cerqueira, F.M.; Macedo, A.F.; Garcia, C.C.; Angeli, J.P.; Schumacher, R.I.; Sogayar, M.C.; Augusto, O.; Carrì, M.T.; Di Mascio, P.; et al. Increased sod1 association with chromatin, DNA damage, p53 activation, and apoptosis in a cellular model of sod1-linked als. Biochim. Biophys. Acta 2010, 1802, 462–471. [Google Scholar] [CrossRef] [PubMed]
- Carroll, J.; Page, T.K.; Chiang, S.C.; Kalmar, B.; Bode, D.; Greensmith, L.; Mckinnon, P.J.; Thorpe, J.R.; Hafezparast, M.; El-Khamisy, S.F. Expression of a pathogenic mutation of sod1 sensitizes aprataxin-deficient cells and mice to oxidative stress and triggers hallmarks of premature ageing. Hum. Mol. Genet. 2015, 24, 828–840. [Google Scholar] [CrossRef]
- Dell’Orco, M.; Milani, P.; Arrigoni, L.; Pansarasa, O.; Sardone, V.; Maffioli, E.; Polveraccio, F.; Bordoni, M.; Diamanti, L.; Ceroni, M.; et al. Hydrogen peroxide-mediated induction of sod1 gene transcription is independent from nrf2 in a cellular model of neurodegeneration. Biochim. Biophys. Acta 2016, 1859, 315–323. [Google Scholar] [CrossRef]
- Ludolph, A.; Drory, V.; Hardiman, O.; Nakano, I.; Ravits, J.; Robberecht, W.; Shefner, J. A revision of the el escorial criteria-2015. Amyotroph. Lateral Scler. Front. Degener 2015, 16, 291–292. [Google Scholar] [CrossRef]
- Schreiber, E.; Matthias, P.; Müller, M.M.; Schaffner, W. Rapid detection of octamer binding proteins with ‘mini-extracts’, prepared from a small number of cells. Nucleic Acids Res. 1989, 17, 6419. [Google Scholar] [CrossRef]
- Crippa, V.; D’Agostino, V.G.; Cristofani, R.; Rusmini, P.; Cicardi, M.E.; Messi, E.; Loffredo, R.; Pancher, M.; Piccolella, M.; Galbiati, M.; et al. Transcriptional induction of the heat shock protein b8 mediates the clearance of misfolded proteins responsible for motor neuron diseases. Sci. Rep. 2016, 6, 22827. [Google Scholar] [CrossRef]
- Guareschi, S.; Cova, E.; Cereda, C.; Ceroni, M.; Donetti, E.; Bosco, D.A.; Trotti, D.; Pasinelli, P. An over-oxidized form of superoxide dismutase found in sporadic amyotrophic lateral sclerosis with bulbar onset shares a toxic mechanism with mutant sod1. Proc. Natl. Acad. Sci. USA 2012, 109, 5074–5079. [Google Scholar] [CrossRef]
- Nicastro, R.; Tripodi, F.; Gaggini, M.; Castoldi, A.; Reghellin, V.; Nonnis, S.; Tedeschi, G.; Coccetti, P. Snf1 phosphorylates adenylate cyclase and negatively regulates protein kinase a-dependent transcription in saccharomyces cerevisiae. J. Biol. Chem. 2015, 290, 24715–24726. [Google Scholar] [CrossRef]
- Friedberg, E.C. DNA damage and repair. Nature 2003, 421, 436–440. [Google Scholar] [CrossRef]
- Yan, S.; Sorrell, M.; Berman, Z. Functional interplay between atm/atr-mediated DNA damage response and DNA repair pathways in oxidative stress. Cell. Mol. Life Sci. 2014, 71, 3951–3967. [Google Scholar] [CrossRef]
- Rosen, D.R.; Siddique, T.; Patterson, D.; Figlewicz, D.A.; Sapp, P.; Hentati, A.; Donaldson, D.; Goto, J.; O’Regan, J.P.; Deng, H.X. Mutations in cu/zn superoxide dismutase gene are associated with familial amyotrophic lateral sclerosis. Nature 1993, 362, 59–62. [Google Scholar] [CrossRef]
- Cova, E.; Cereda, C.; Galli, A.; Curti, D.; Finotti, C.; Di Poto, C.; Corato, M.; Mazzini, G.; Ceroni, M. Modified expression of bcl-2 and sod1 proteins in lymphocytes from sporadic als patients. Neurosci. Lett. 2006, 399, 186–190. [Google Scholar] [CrossRef] [PubMed]
- Bartek, J.; Lukas, J. Chk1 and chk2 kinases in checkpoint control and cancer. Cancer Cell 2003, 3, 421–429. [Google Scholar] [CrossRef]
- Tsang, C.K.; Liu, Y.; Thomas, J.; Zhang, Y.; Zheng, X.F. Superoxide dismutase 1 acts as a nuclear transcription factor to regulate oxidative stress resistance. Nat. Commun. 2014, 5, 3446. [Google Scholar] [CrossRef] [PubMed]
- Dam, D.H.; Lee, J.H.; Sisco, P.N.; Co, D.T.; Zhang, M.; Wasielewski, M.R.; Odom, T.W. Direct observation of nanoparticle-cancer cell nucleus interactions. ACS Nano 2012, 6, 3318–3326. [Google Scholar] [CrossRef] [PubMed]


| Sample | PTMs | Peptide Sequence | Phosida | NetPhos 2.0 | Phosphosite Plus | Ref. [26] |
|---|---|---|---|---|---|---|
| Cyt | S98 | DGVADVSIEDSVISLSGDHCIIGRTLVVHEK | X | X | X | |
| S102 | DGVADVSIEDSVISLSGDHCIIGRTLVVHEK | X | X | |||
| S142 | TGNAGSRLACGVIGIAQ | X | ||||
| Nuc | S34 | PVKVWGSIKGLTE | X | X | ||
| T39 | GSIKGLTEGLHGF | |||||
| T58 | DNTAGCTSAGPHF | X | X | |||
| S59 | NTAGCTSAGPHFN | X | X | |||
| S69 | PHFNPLSRKHGGP | X | ||||
| S142 | TGNAGSRLACGVIGIAQ | X |
© 2019 by the authors. Licensee MDPI, Basel, Switzerland. This article is an open access article distributed under the terms and conditions of the Creative Commons Attribution (CC BY) license (http://creativecommons.org/licenses/by/4.0/).
Share and Cite
Bordoni, M.; Pansarasa, O.; Dell’Orco, M.; Crippa, V.; Gagliardi, S.; Sproviero, D.; Bernuzzi, S.; Diamanti, L.; Ceroni, M.; Tedeschi, G.; et al. Nuclear Phospho-SOD1 Protects DNA from Oxidative Stress Damage in Amyotrophic Lateral Sclerosis. J. Clin. Med. 2019, 8, 729. https://doi.org/10.3390/jcm8050729
Bordoni M, Pansarasa O, Dell’Orco M, Crippa V, Gagliardi S, Sproviero D, Bernuzzi S, Diamanti L, Ceroni M, Tedeschi G, et al. Nuclear Phospho-SOD1 Protects DNA from Oxidative Stress Damage in Amyotrophic Lateral Sclerosis. Journal of Clinical Medicine. 2019; 8(5):729. https://doi.org/10.3390/jcm8050729
Chicago/Turabian StyleBordoni, Matteo, Orietta Pansarasa, Michela Dell’Orco, Valeria Crippa, Stella Gagliardi, Daisy Sproviero, Stefano Bernuzzi, Luca Diamanti, Mauro Ceroni, Gabriella Tedeschi, and et al. 2019. "Nuclear Phospho-SOD1 Protects DNA from Oxidative Stress Damage in Amyotrophic Lateral Sclerosis" Journal of Clinical Medicine 8, no. 5: 729. https://doi.org/10.3390/jcm8050729
APA StyleBordoni, M., Pansarasa, O., Dell’Orco, M., Crippa, V., Gagliardi, S., Sproviero, D., Bernuzzi, S., Diamanti, L., Ceroni, M., Tedeschi, G., Poletti, A., & Cereda, C. (2019). Nuclear Phospho-SOD1 Protects DNA from Oxidative Stress Damage in Amyotrophic Lateral Sclerosis. Journal of Clinical Medicine, 8(5), 729. https://doi.org/10.3390/jcm8050729